

 Calculate Revenue
 Research Markets
 Find For Sale Properties
 Compare My Listing
 STR Revenue Calculator
 Custom Comp Sets
 Submarket Insights
 Custom Search Filters
 Rate Recommendations
 Performance Benchmarking
 Competitor Comparison
 Owner Contact Details
 Property-level performance data
 Tourism Insights
 Real Estate Investment Analytics
 About Us
 Sales
Sales Support
 Press
PressEuropean Market Review August 2024: Budget-Friendly Destinations Lead the Pack in Record-Breaking Demand
Published: September 30, 2024
Last updated: February 27, 2025

Linda Rollins
Key Takeaways:
- August demand rose 21% year-over-year (YOY), leading to a 3.3% boost in occupancy and higher nightly rates.
- Lesser-known, budget-friendly countries like Kosovo, Moldova, and Albania saw over 50% YOY demand growth.
- Cities like Barcelona, Amsterdam, and Paris stood out with strong occupancy rates and ADR growth, benefiting from major events and limited supply.
The biggest month for short-term rental (STR) demand in Europe did not disappoint this year. Total demand nights reached a new record high of 64.2 million in August, up an impressive 21% year-over-year (YOY).
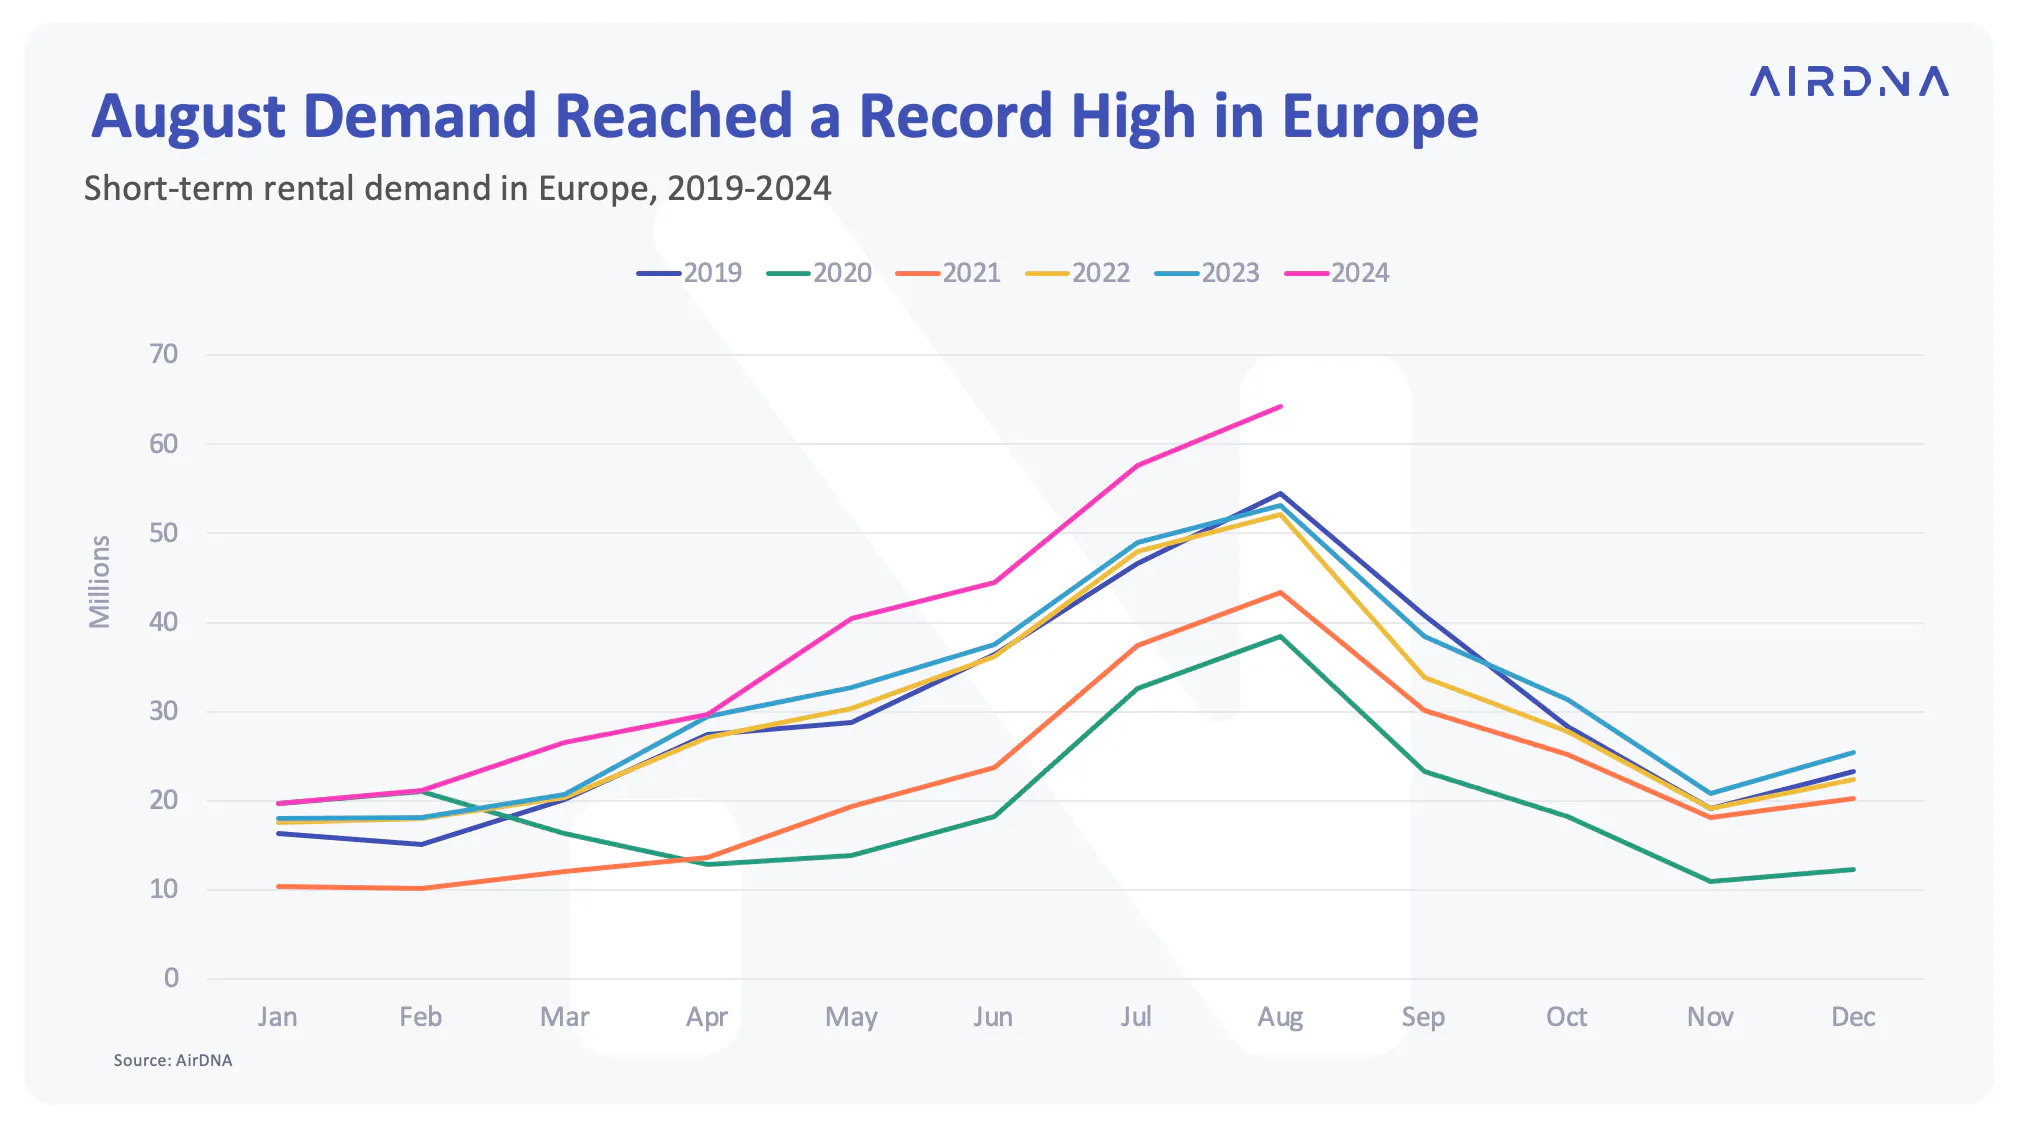
The European continent added 121,000 new listings in August to keep up with the demand surge, bringing the total number of available listings to 4.08 million.
While occupancy growth was more modest in June (+1.4% YOY) and July (+0.3% YOY), strong demand in August pushed occupancy rates to an average of 73%, up by 3.3% YOY. This occupancy boost gave hosts more pricing power, with average daily rates (ADR) increasing by 5.7% YOY. Nightly rates in August averaged €177 across Europe.
Overall, the European STR market reached new heights this summer, surpassing last year’s records. From June to August, 247.7 million nights were available for rent (+17% YOY), while 166.3 million nights were stayed (+19% YOY). Altogether, European rentals generated €28.9 billion in revenue, marking a 24% YOY increase.
At a Glance: August STR Performance in Europe
- Available listings totaled 4.08M, up 15.8% year-over-year (YOY)
- Demand reached 64.2M, an increase of 21% YOY
- Average daily rates (ADR) averaged €177, up 5.7% YOY
- Average occupancy was 73%, up 3.3% YOY and up 5% compared to 2019
- Revenue per Available Rental (RevPAR) increased 9.1% YOY to €130
- Booked nights increased 19.5% YOY
Cheaper European Destinations Led Demand Growth This Summer
The growing interest in more affordable, off-the-beaten-path European destinations continues to be a strong travel trend. This summer, 7 of the top 10 countries with the highest year-over-year (YOY) growth in STR stays were lesser-known spots where average nightly rates are under €100. Kosovo, Moldova, and Albania led the way, with demand in each of these countries increasing by more than 50% this summer.
Travel demand for more popular European destinations also remained strong, with the Nordic countries continuing to lead the way. Norway, Sweden, Finland, and Denmark each saw STR demand increase by over 25% YOY this summer.
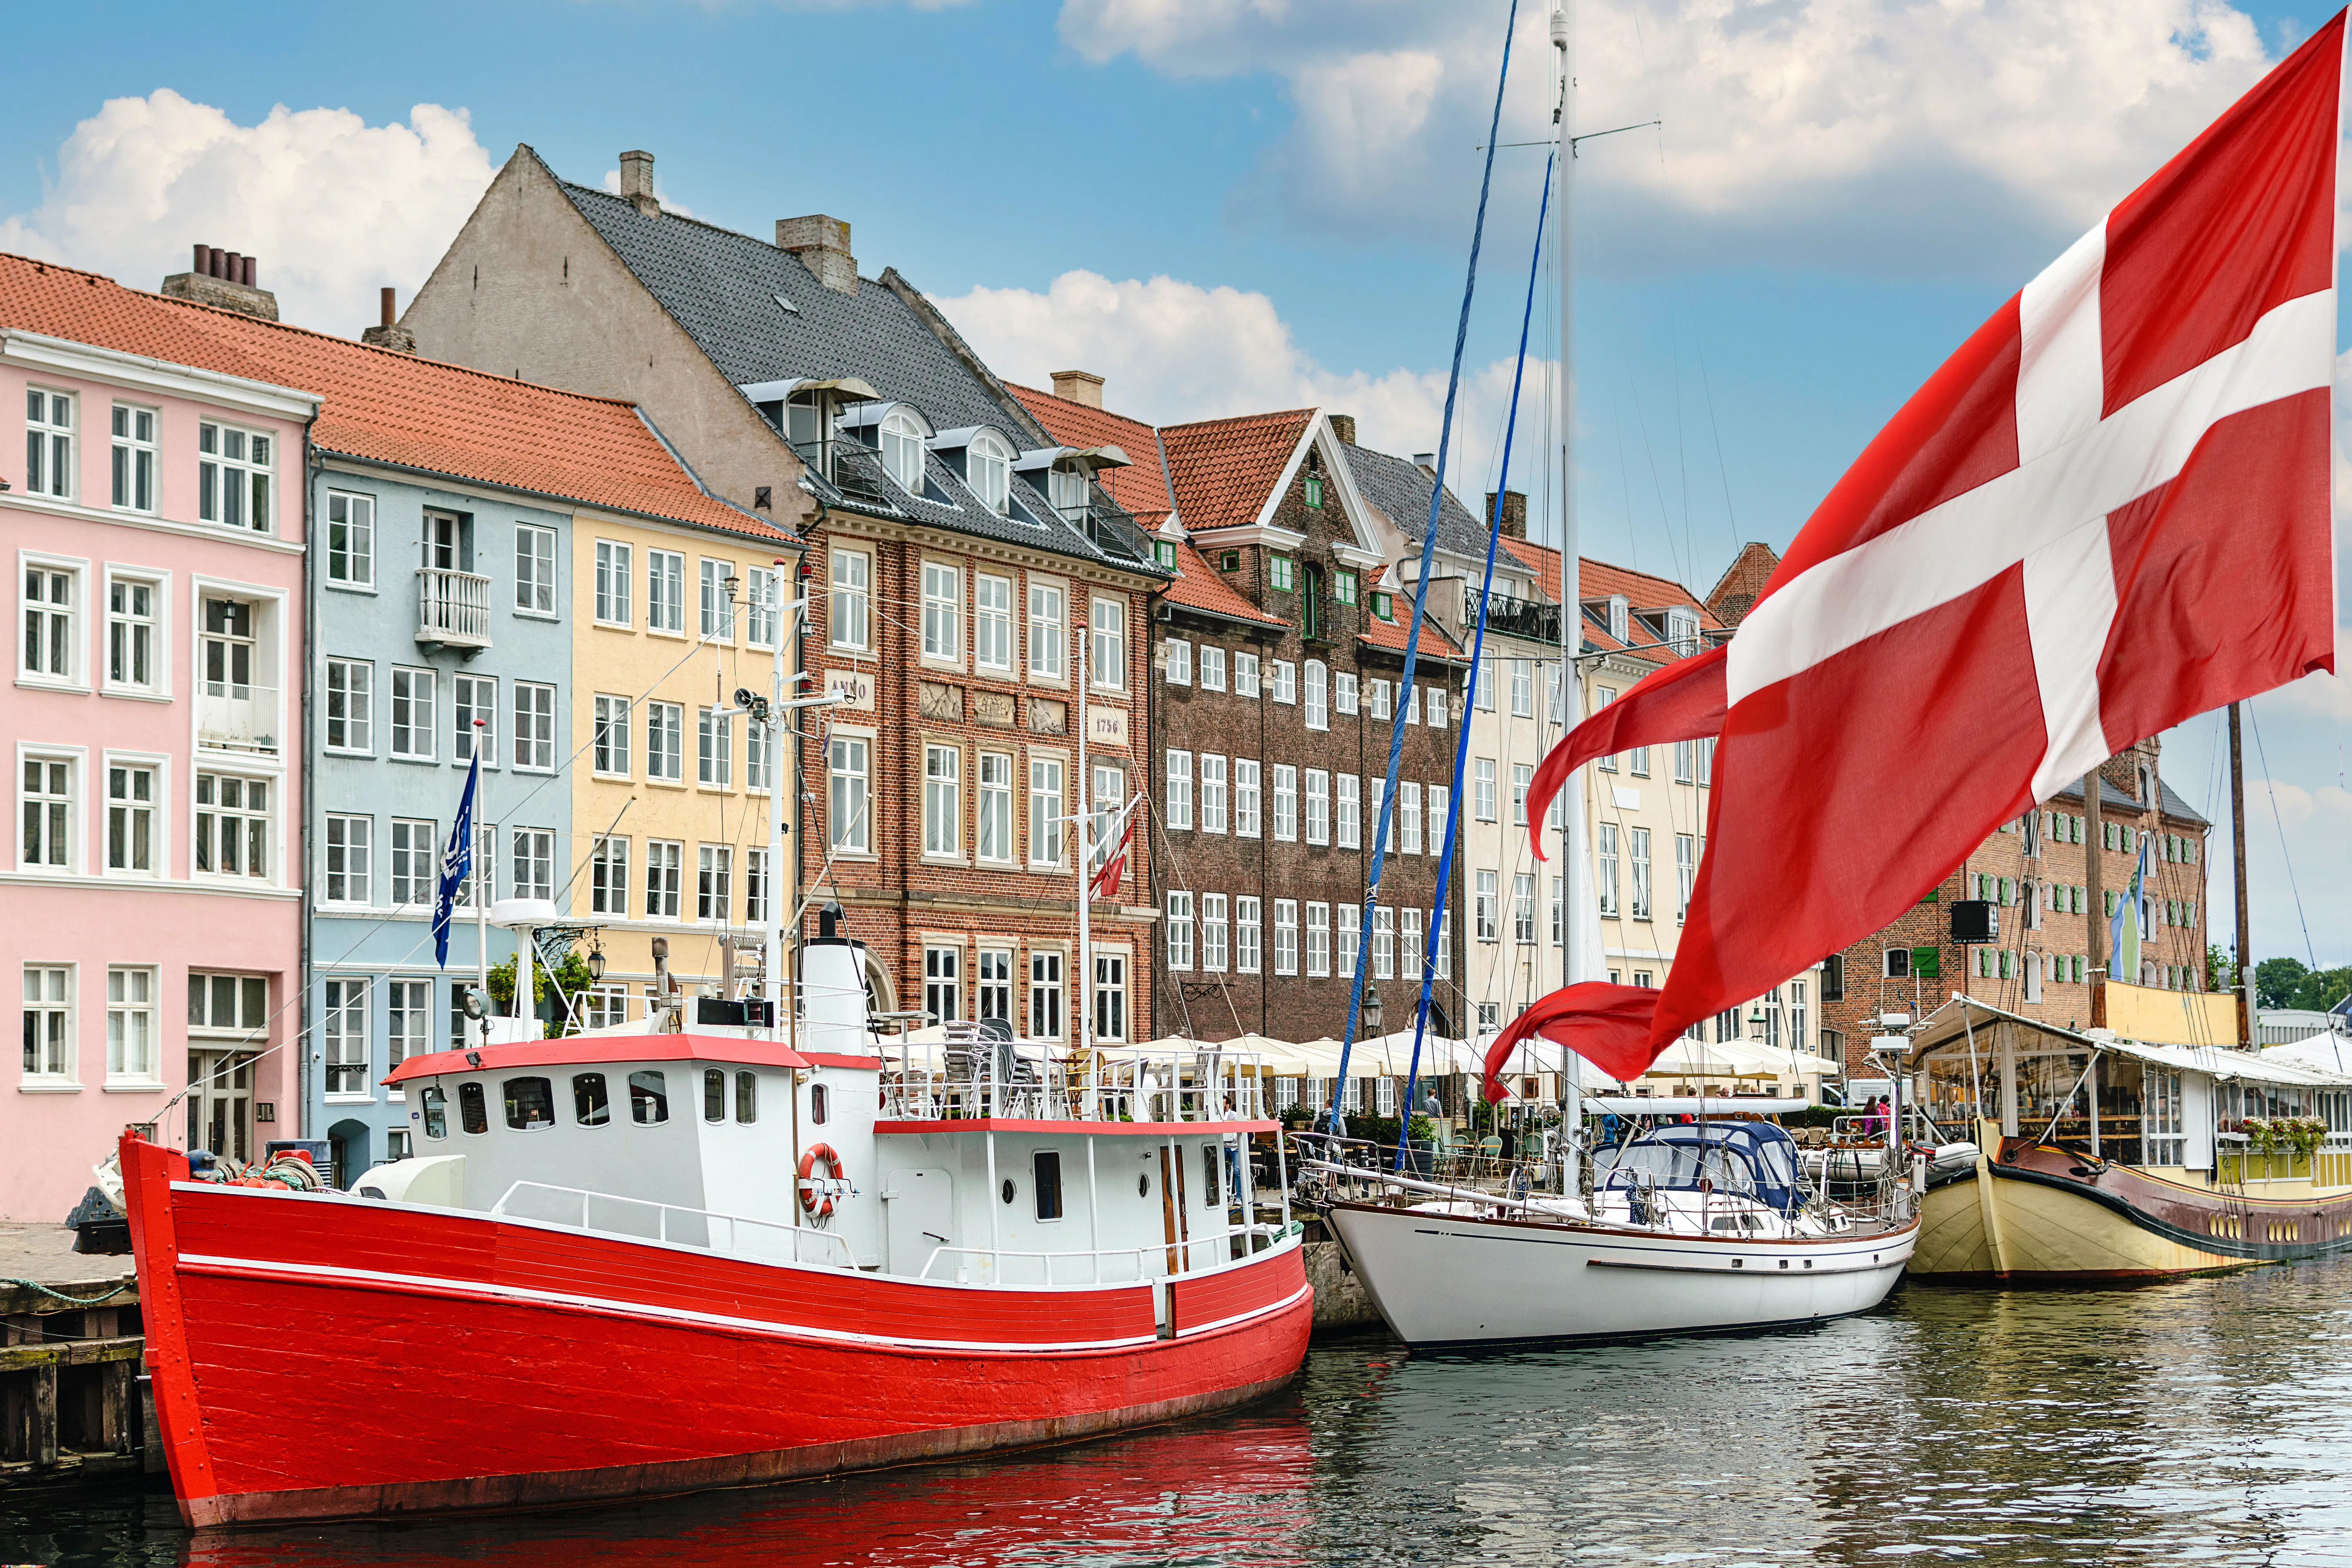
Denmark’s performance was particularly noteworthy. After lagging in its post-COVID demand recovery, renewed travel interest this summer finally brought demand back to pre-pandemic levels. Strong demand growth also led to a remarkable 19% YOY increase in average nightly rates, the highest among the top 20 European countries.
Spain also recovered to pre-pandemic demand levels this summer. While demand remained below 2019 levels last summer, this summer saw a total of 18.3 million nights stayed. That’s a 10% increase compared to 2019. High demand, combined with limited supply growth, helped Spain rank second among the top 20 European countries in both ADR growth (+8.7% YOY) and occupancy growth (+4.9% YOY) this summer.
A few notable countries that lagged in demand growth this summer include Portugal, the UK, and Italy. In Portugal, new STR regulations under the Mais Habitação law have significantly limited short term rental supply and demand growth in major cities. Both the UK and Italy experienced strong demand growth last summer, but demand slowed this year as travelers opted for cheaper and less-traveled destinations.
Create 5-star guest experiences
With Uplisting, you can send the right messages at the right time on all booking sites. Read and respond to guest messages in a single, unified inbox — whether you’re at the office or on the go.
Lower Price Tier Properties Continue to See the Strongest Occupancy
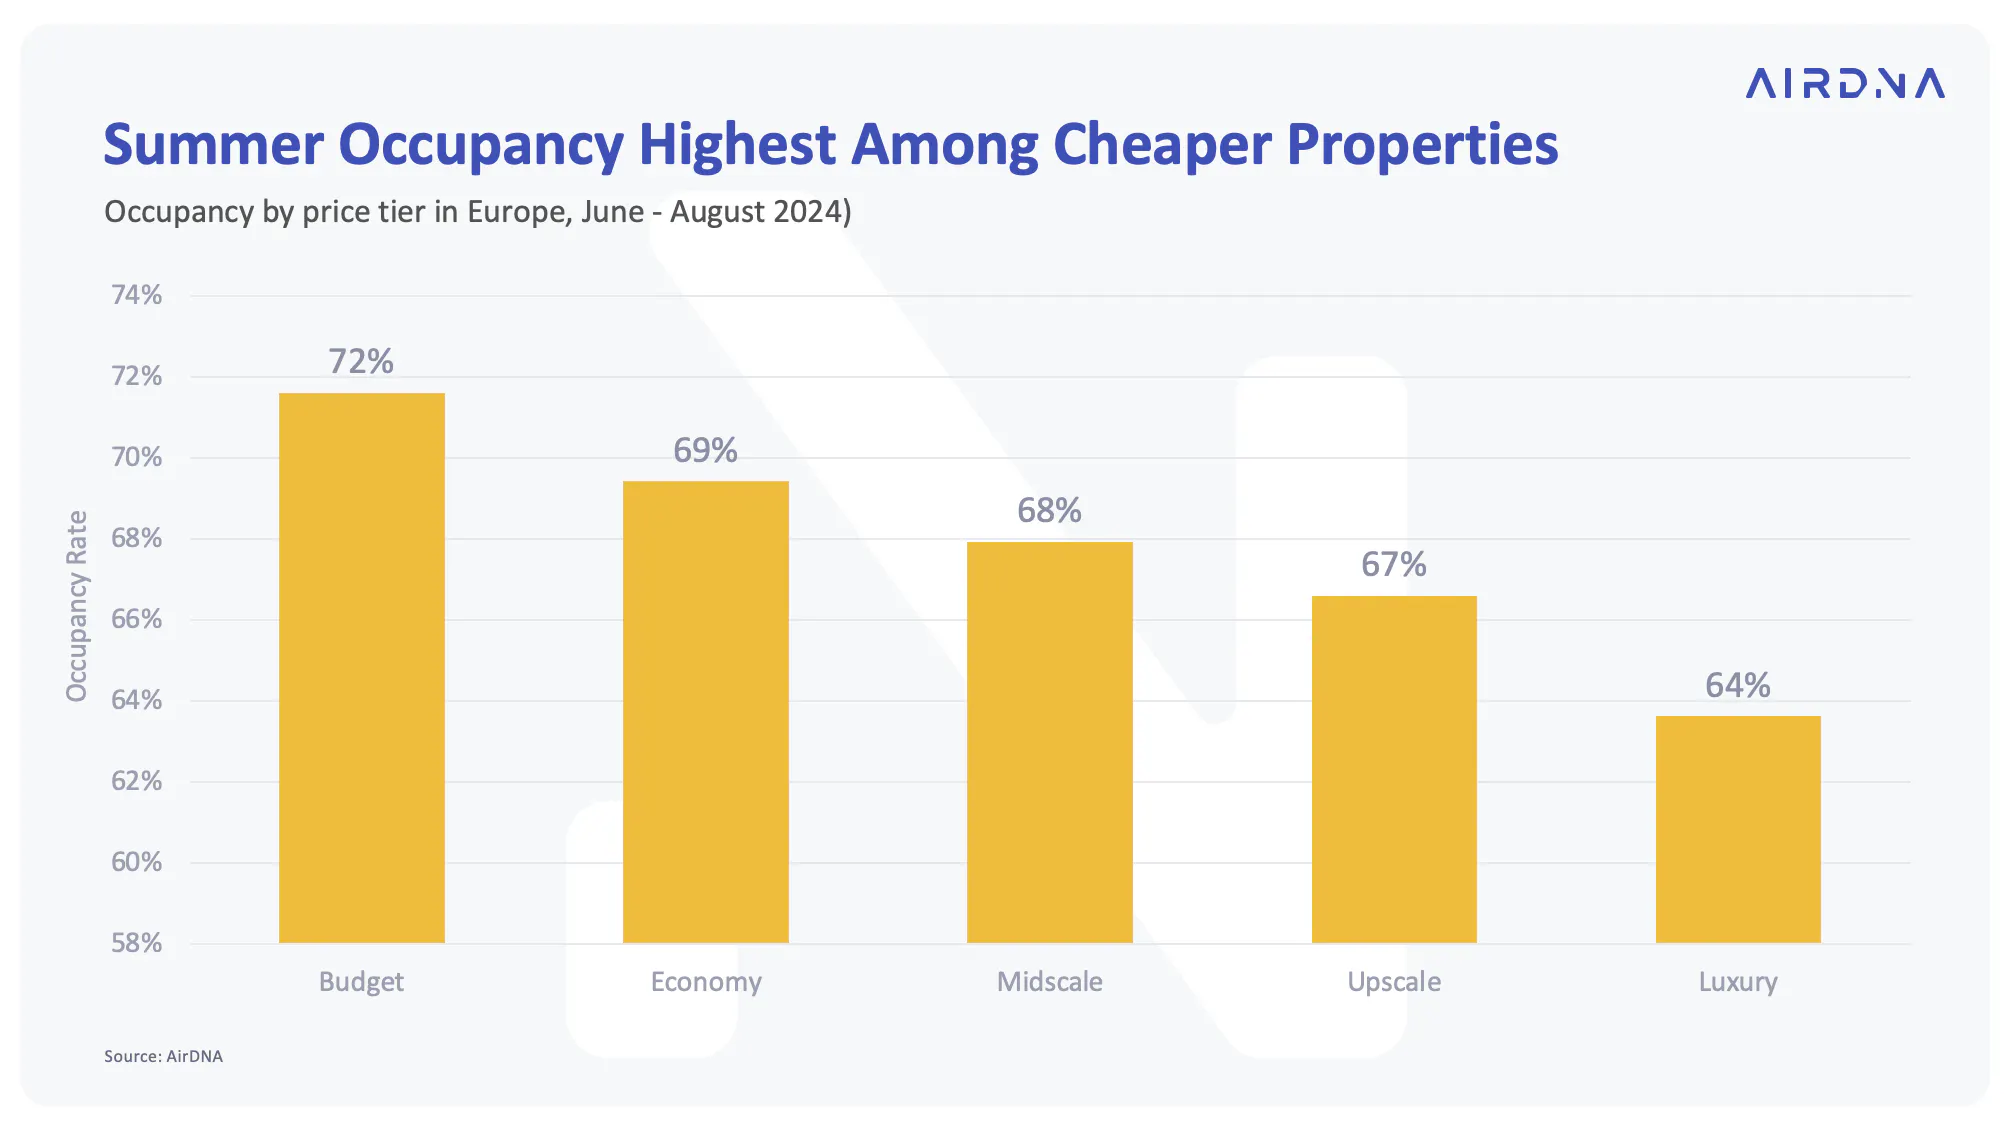
Budget-conscious travel continues to shape guest choices this summer. Similar to last summer, occupancy rates were highest among lower price tier properties. Budget stays had the strongest occupancy rate at 72%, while luxury stays saw the lowest occupancy rate at 64%.
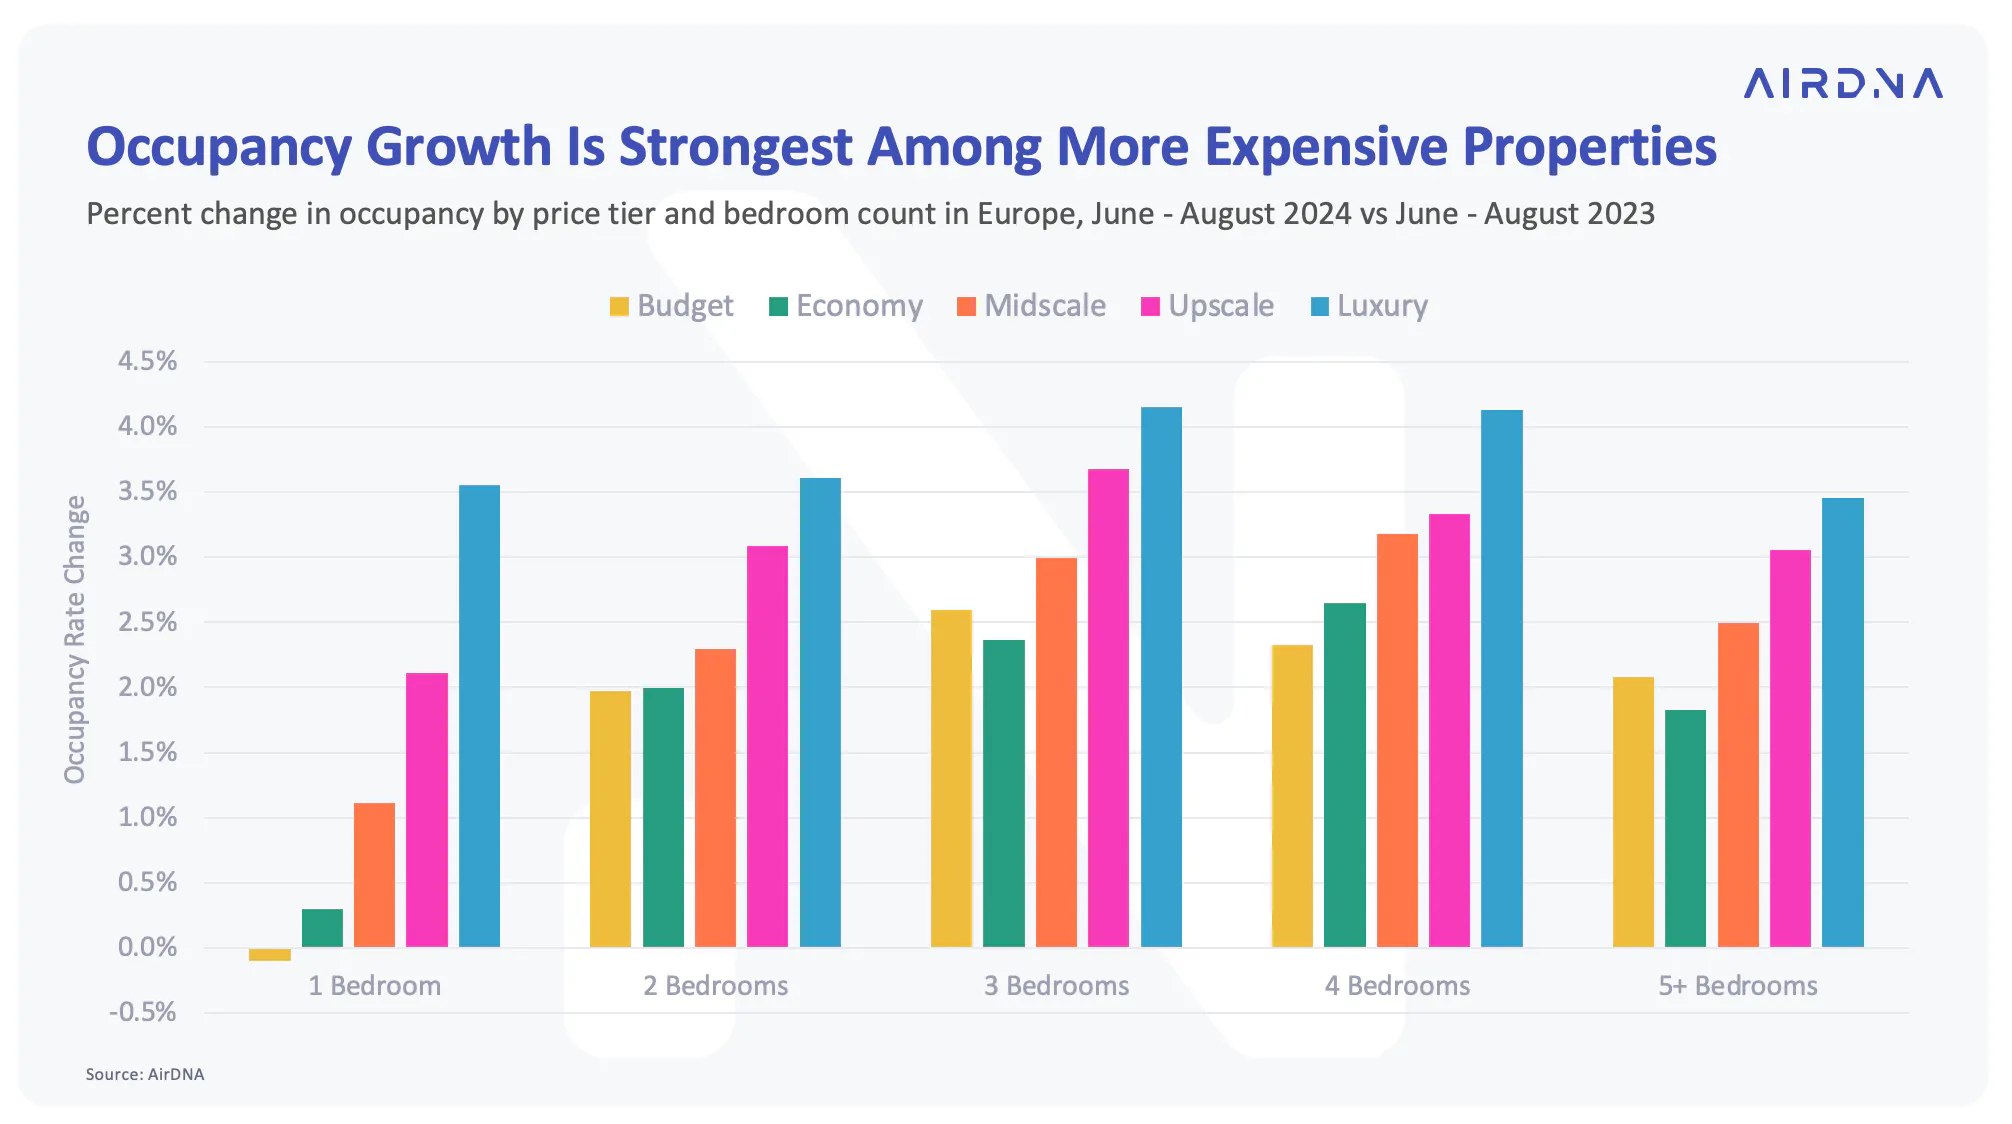
However, when looking at year-over-year (YOY) growth in occupancy rates across price tiers, higher-priced properties saw a bigger increase in occupancy this summer compared to lower price tier properties. Larger properties with 3 or more bedrooms were the primary drivers of occupancy growth among upscale and luxury stays.
Strong Occupancy and ADRs Define Top RevPAR Performers
Across much of Europe, record-high demand this summer meant hosts enjoyed strong occupancy rates and increased pricing power.
- From June to August, occupancy averaged 67.2%, a 2% year-over-year (YOY) increase.
- Average Daily Rates (ADRs) rose by 4% YOY, reaching an average of €174.
- Summer Revenue per Available Rental (RevPAR) increased 6% YOY to an average of €117 per available rental night.
RevPAR performance is driven by occupancy and ADR performance. Markets with high occupancy rates and high nightly rates typically see the strongest RevPAR performance. This summer in Europe, countries like Iceland, Greece, and the UK led in RevPAR, with occupancy rates exceeding 70% and ADRs over €200.
Mid-performing RevPAR markets often have strong occupancy rates but lower ADRs compared to top-performing markets. For example, countries like the Netherlands and Portugal saw strong occupancy this summer, but slightly lower RevPARs due to lower nightly rates. On the other hand, markets like Austria and Italy had high ADRs this summer but lower occupancy rates, placing them in the middle of the RevPAR performance rankings.
Bottom-performing RevPAR markets typically struggle with low occupancy, low ADRs, or both. Sometimes, these factors go hand in hand. Hosts facing low booking rates tend to lower prices to stay competitive. This is the case in countries like Sweden, Norway, and Finland, where supply growth has led to significant year-over-year (YOY) declines in both occupancy and ADR.
Among the top 50 European cities, several stood out for their strong RevPAR performance this summer:
- Barcelona and Amsterdam: With STR regulations limiting supply growth, both cities enjoyed occupancy rates above 70% and nightly rates exceeding €220.
- Paris: Although Paris had one of the lowest occupancy rates among the top 50 cities, it saw a major ADR boost from hosting the Olympics and Paralympics. ADRs were up 17% YOY, with Paris hosts earning an average of €150 per available listing night.
The bottom RevPAR performers this summer may not have matched the occupancy and ADR rates of the highest-performing cities, but their lower nightly rates helped drive significant demand growth. Cities like Warsaw, Poland; Belgrade, Serbia; and Bucharest, Romania saw demand surge by more than 25% YOY, as travelers were attracted to more affordable stays.
Upcoming Events for Hosts to Keep an Eye On
This summer was an impressive showcase of the impact that major events can have on STR markets and how hosts can adapt to capitalize on heightened demand and higher ADRs.
For the Paris Olympics, locals jumped on the opportunity to rent out their homes, meeting a 90% year-over-year (YOY) surge in demand with a 70% YOY increase in available listings.
Similarly, for EURO 2024, skyrocketing demand in smaller cities like Dortmund and Stuttgart allowed hosts to raise rates and profit from the influx of guests
As Taylor Swift, Adele, and Coldplay took the stage across Europe this summer, we saw local city economies and thousands of STR listings find opportunities to earn additional revenue from concert goers.
It’s clear that it pays to keep track of local events coming to town. If you’re an STR host, AirDNA has flagged two upcoming events to keep your eye on.

Oktoberfest
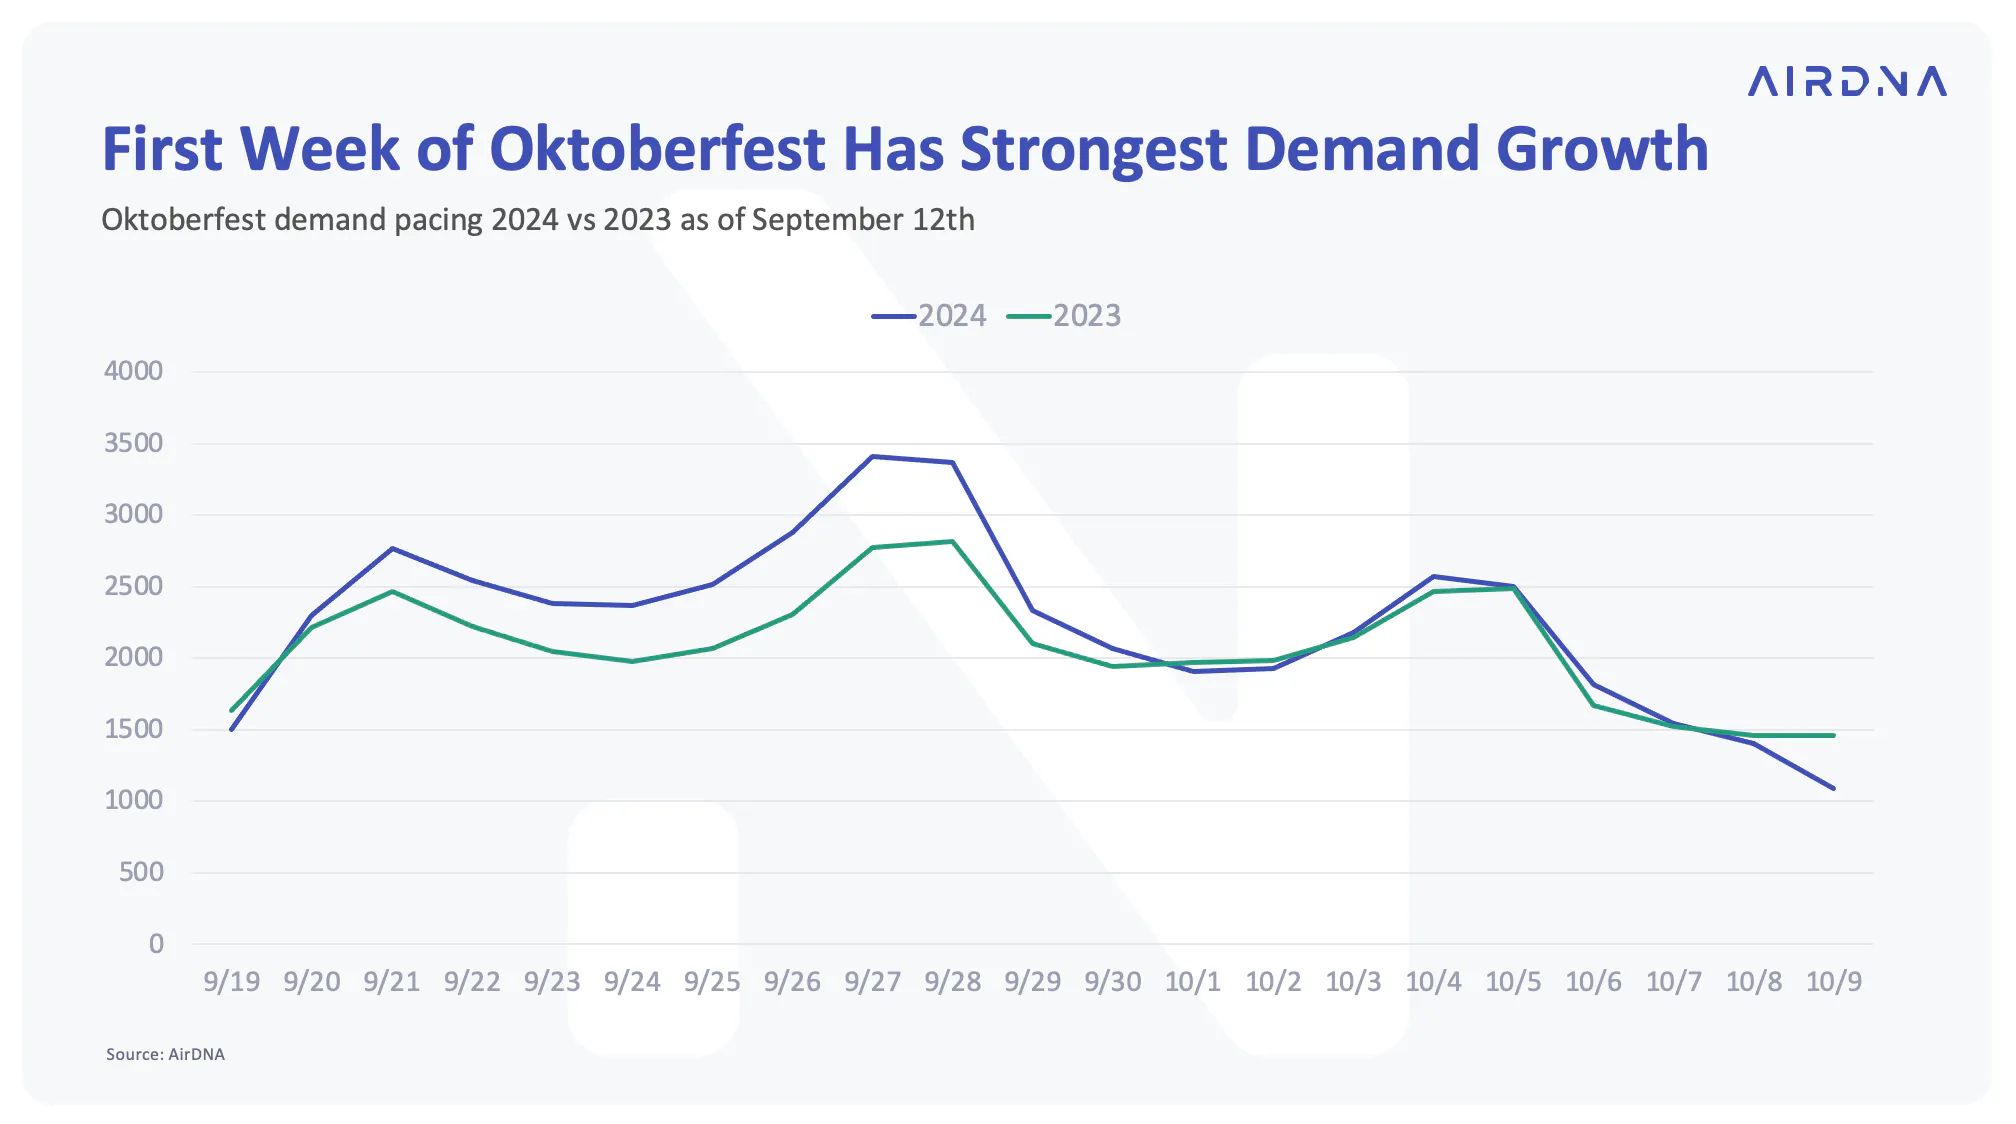
Oktoberfest, Germany’s largest and most famous annual beer festival, returns to Munich from September 21st through October 6th this year. Current demand on the books suggests that this year’s festival will drive even more demand than last year.
Last year’s Oktoberfest spanned 18 days, with total demand nights reaching 38,400. This year’s festival will be slightly shorter at 16 days. Current demand on the books is already 3% higher than last year, despite the reduced length of the festival.
The first week of Oktoberfest is currently seeing the greatest uptick in demand, with booked nights up 19% YOY for September 21-27. The second week of Oktoberfest (September 28 - October 4) is seeing more modest demand growth, with current demand on the books up 6% YOY. The weekends of Oktoberfest typically see the most demand. Hosts that are adjusting their weekend pricing can expect to earn a greater premium.
Oasis
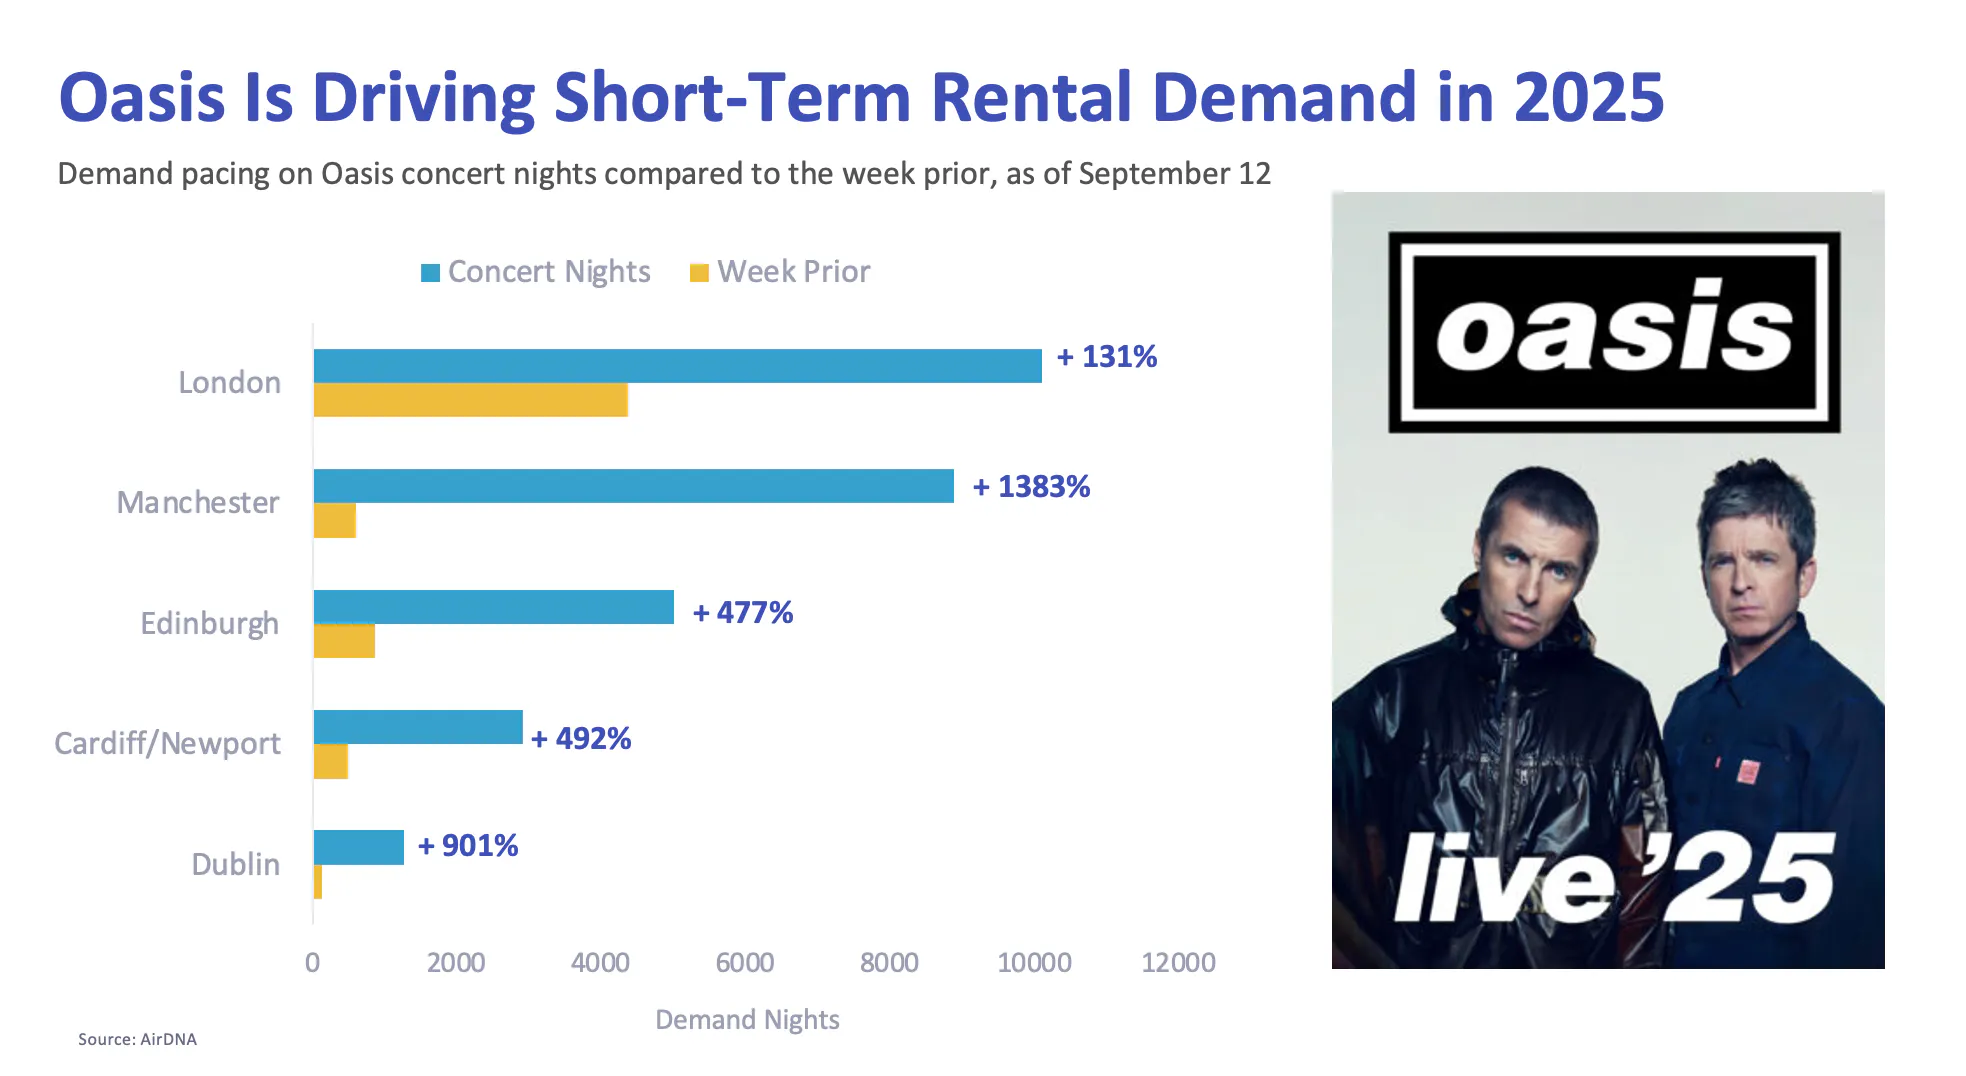
Before Europe has had a chance to recover from Taylor Swift, Oasis is coming in to take over the spotlight. A few weeks ago, the English rock band announced that it’s getting back together and has scheduled a 5-stop concert tour in the UK next summer. Tickets were released on August 31st and AirDNA data is already showing remarkable demand spikes on concert nights.
Manchester is leading demand pacing, with booked stays for concert nights up 1,383% compared to the week prior. Booked stays for Dublin concert nights are up 901% compared to the week prior. In Cardiff and Edinburgh, stays booked for concert nights are currently five times the number of stays booked for the week prior. London is seeing the smallest demand growth with bookings up +131%.
While many concert goers are getting ahead of the curve and booking their stays in advance, the large majority of fans have yet to book their accommodations. Let’s look at the booking curve for the Eras Tour in Dublin as an example. Eleven months from Taylor Swift’s arrival, only 13% of total stays for concert dates had been booked.
It’s clear that there are many more STR reservations on the horizon. Hosts that are looking to take advantage of Oasis coming to town should be paying close attention to the booking and pricing trends of their market as concert dates approach.
Market-Informed Pricing Decisions
AirDNA’s vacation rental pricing tool uses data-driven recommendations to propose the best daily rates.
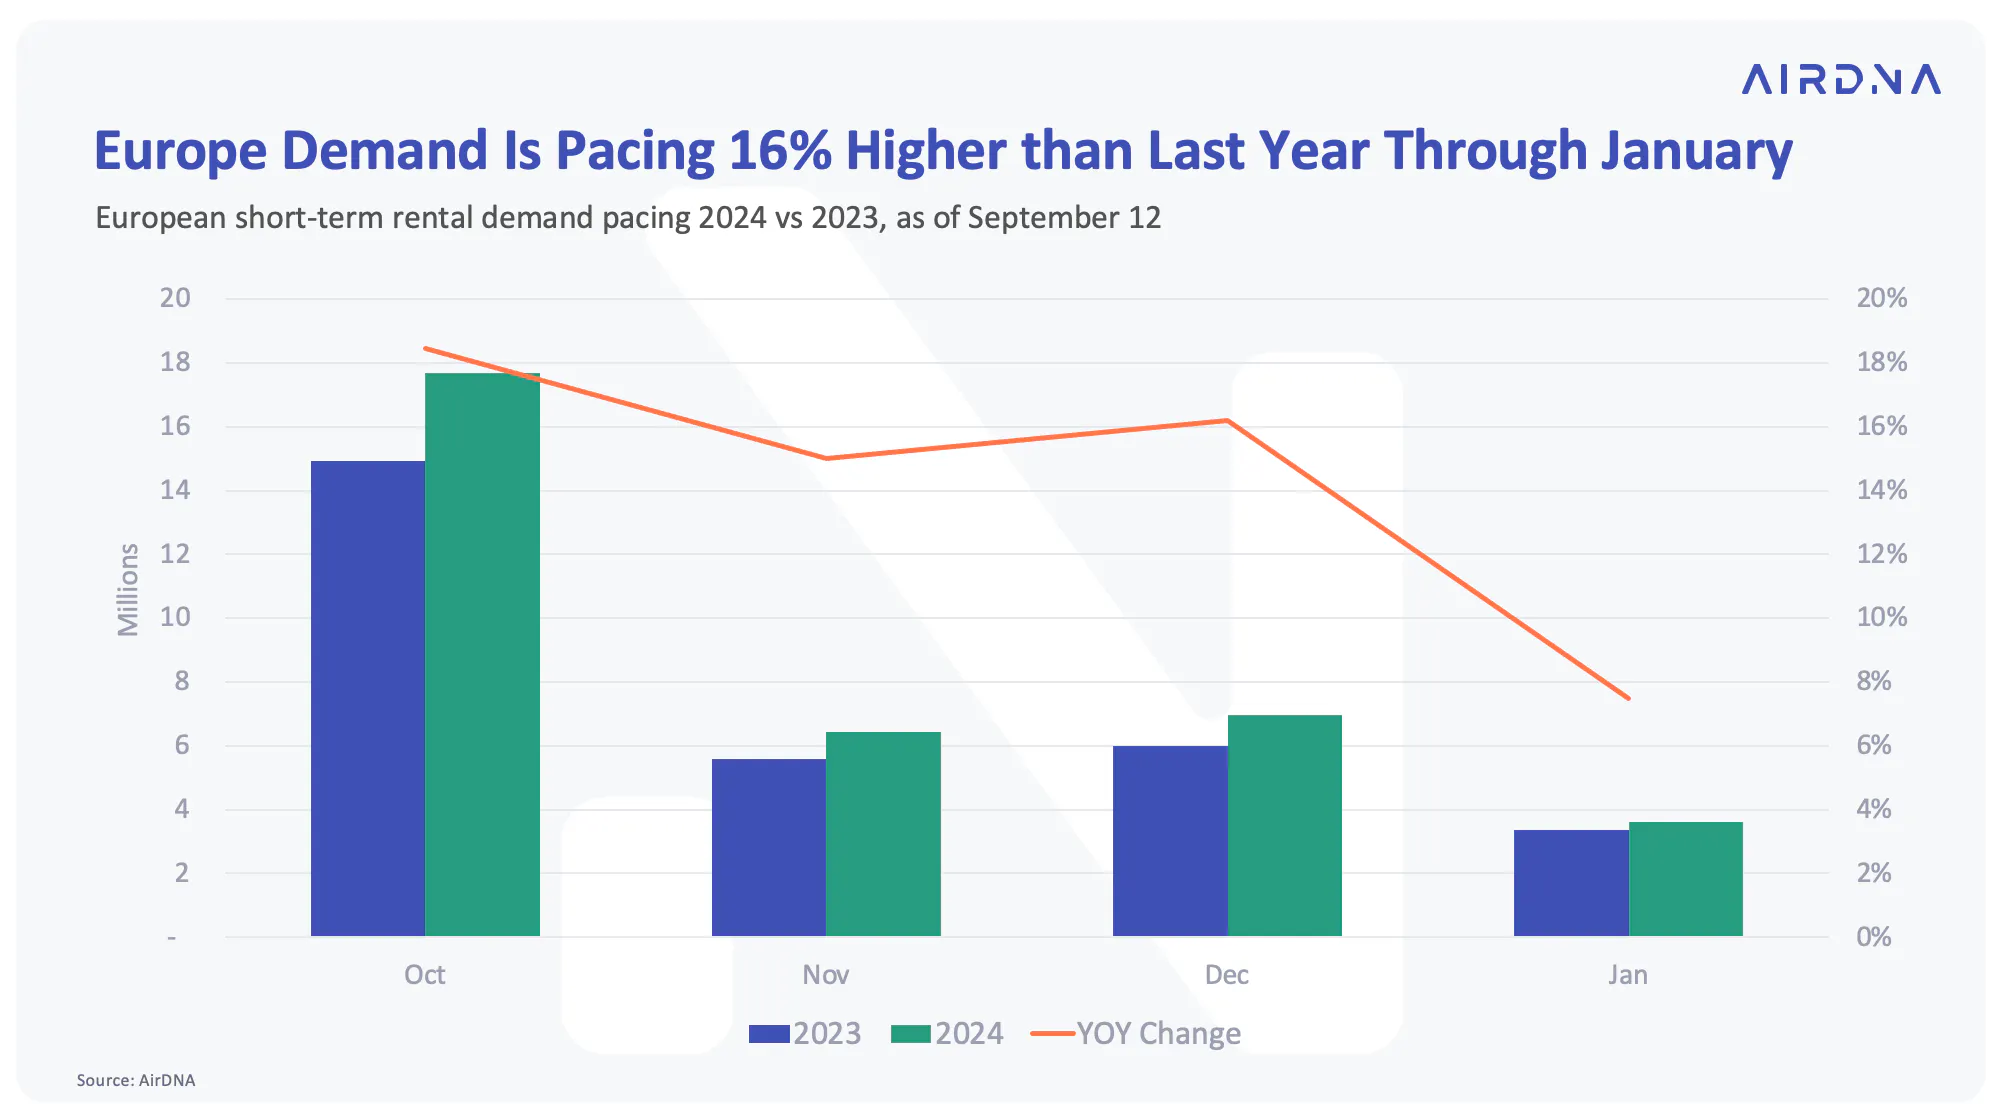
Demand Pacing for Europe is up 16% Through January
Demand pacing shows that European travel demand will continue to grow into the new year. Current demand on the books is up 18% for October, 15% for November, 16% for December, and 7% for January.
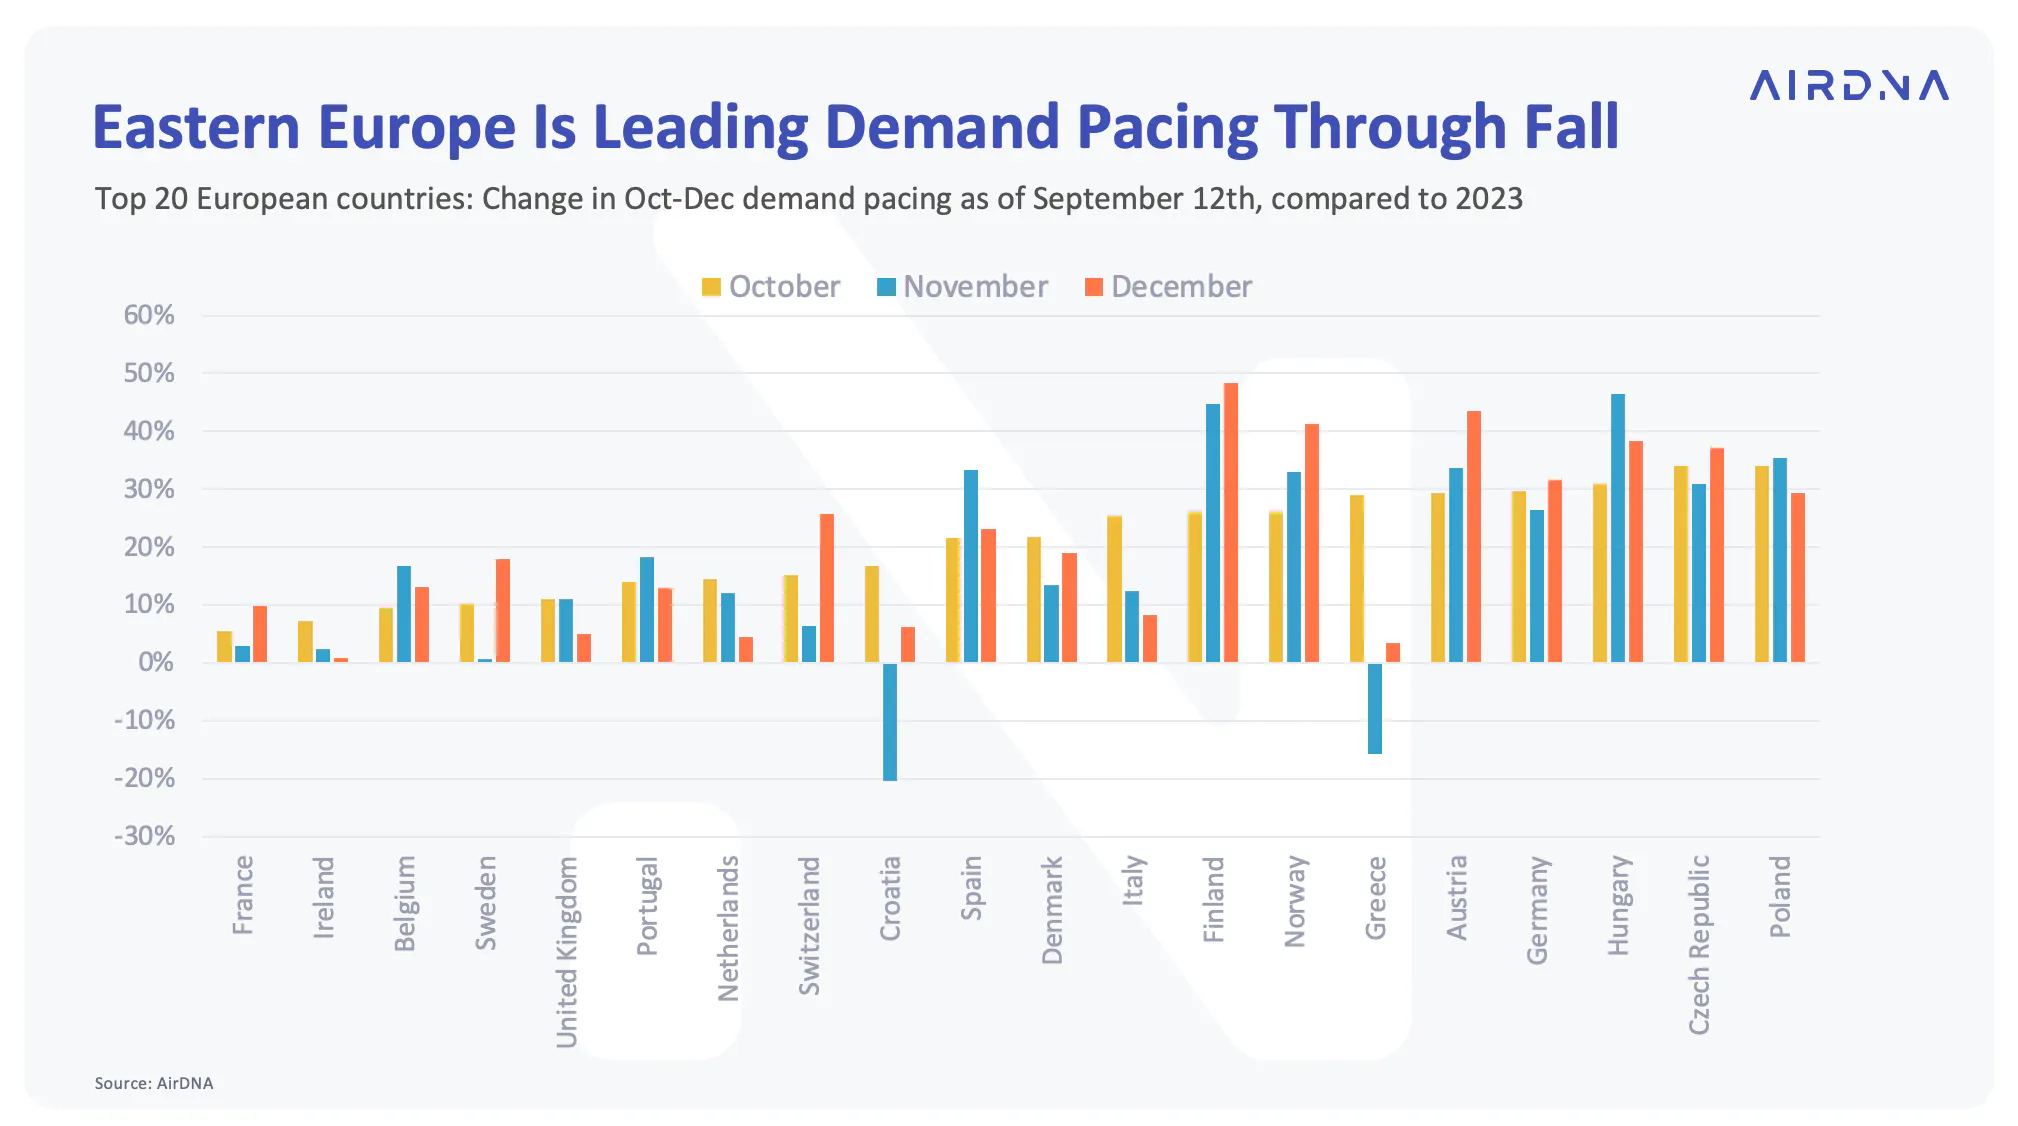
A few Eastern European countries are high on the list for growing travel demand this fall:
- Finland: +39% YOY
- Austria: +36% YOY
- Hungary: +36% YOY
- Czech Republic: +34% YOY
Lagging in demand are a few familiar countries that also lagged in demand this summer:
- United Kingdom: +9% YOY
- Croatia: +9% YOY
- France: +6% YOY
- Ireland: +5% YOY
Host Confidently
Know exactly how much to charge based on your vacation rental pricing strategy.
ARTICLE SUMMARY
August brings a record-breaking summer to a close, driven by strong demand in both budget and popular destinations in Europe. Looking ahead, fall and winter bookings are pacing up, and major events like Oktoberfest and Oasis’ 2025 tour promise continued growth opportunities for hosts.
Linda Rollins
Senior Research Analyst
Linda Rollins is a Senior Research Analyst at AirDNA and a self-managing short-term rental host, which means she understands the market as both an analyst and an operator. She writes research and blogs for AirDNA and for Adapt, its revenue management tool, making her work a go-to resource for investors trying to find and size up the right opportunities, and for operators looking to understand changing market dynamics and find concrete ways to improve occupancy, rates, and guest experience. Her data is regularly cited in major news outlets, and she has a knack for bringing both the numbers and the story behind them. In her free time, Linda enjoys spending time with her family, traveling, and looking for good eats.
