Calculate Revenue
 Research Markets
 Find For Sale Properties
 Compare My Listing
 STR Revenue Calculator
 Custom Comp Sets
 Submarket Insights
 Custom Search Filters
 Rate Recommendations
 Performance Benchmarking
 Competitor Comparison
 Owner Contact Details
 Property-level performance data
 Tourism Insights
 Real Estate Investment Analytics
 About Us
 Sales
 Support
 Press
Using Data to Advocate for the Future of Your Short-Term Rental | AirDNA
Published: June 7, 2023
Last updated: February 11, 2025

Dillon DuBois
The short-term rental (STR) industry is thriving—but will the looming threat of regulations bring it all crashing down? The discussions surrounding this hot topic are reaching a fever pitch in many destinations, with headlines about headaches for locals dominating the news and the stakes escalating ever higher for hosts and operators.
We’ve talked before about why hosts need to care about regulations and where to find information on them. But recognizing the significance of regulations is just the starting point. To start influencing the change rather than being surprised when new rules come in, it's time to go a step further and understand how you can become an advocate for fair regulations.
At AirDNA, we understand the transformative power of comprehensive data. Our robust range of insights offers tangible evidence of the true impact of STRs: from the types of travelers they attract to the rewriting of seasonality trends and the measurable benefits they bring to local economies. We firmly believe that basing your arguments and actions on accurate and reliable data is paramount.
That's precisely why we've partnered with Rent Responsibly and other industry advocates, and actively participated in this season of the How to Save Your Vacation Rental Business podcast. Through these alliances, we combine our expertise and resources to provide invaluable guidance and support to tell the true story of short-term rentals in each destination. Together, we aim to equip you with the necessary tools to become an effective advocate for your vacation rental business.
STR Data Lab Podcast
Listen to our economists Jamie Lane and Bram Gallagher break down the data on regulations and how short-term rentals impact communities and house prices.
The Vacation Rental Advocacy Health Scorecard
This season of the How to Save Your Vacation Rental Business podcast took on the task of creating a scorecard to help vacation rental managers (VRMs) find out where their destination is on its advocacy journey, and the next steps they can take to be part of the solution.
You can see the full scorecard here, and there are many resources available from AirDNA and Rent Responsibly that can help you to inform yourself and prove the real state of the industry in your city. (Some of them are listed below)
But first, what can you find in AirDNA’s tools to advocate for vacation rentals in your city?
How Many Listings Are There, Anyway?
Your city council might have one number, your local press another. The anti-STR lobby group will definitely have a different one. So how many listings are in your market, really?
Search for your market (you just need to register for a free account—no card details required) and you’ll see a big number next to the map: active rentals.
Let’s take the example of Phoenix, Arizona:
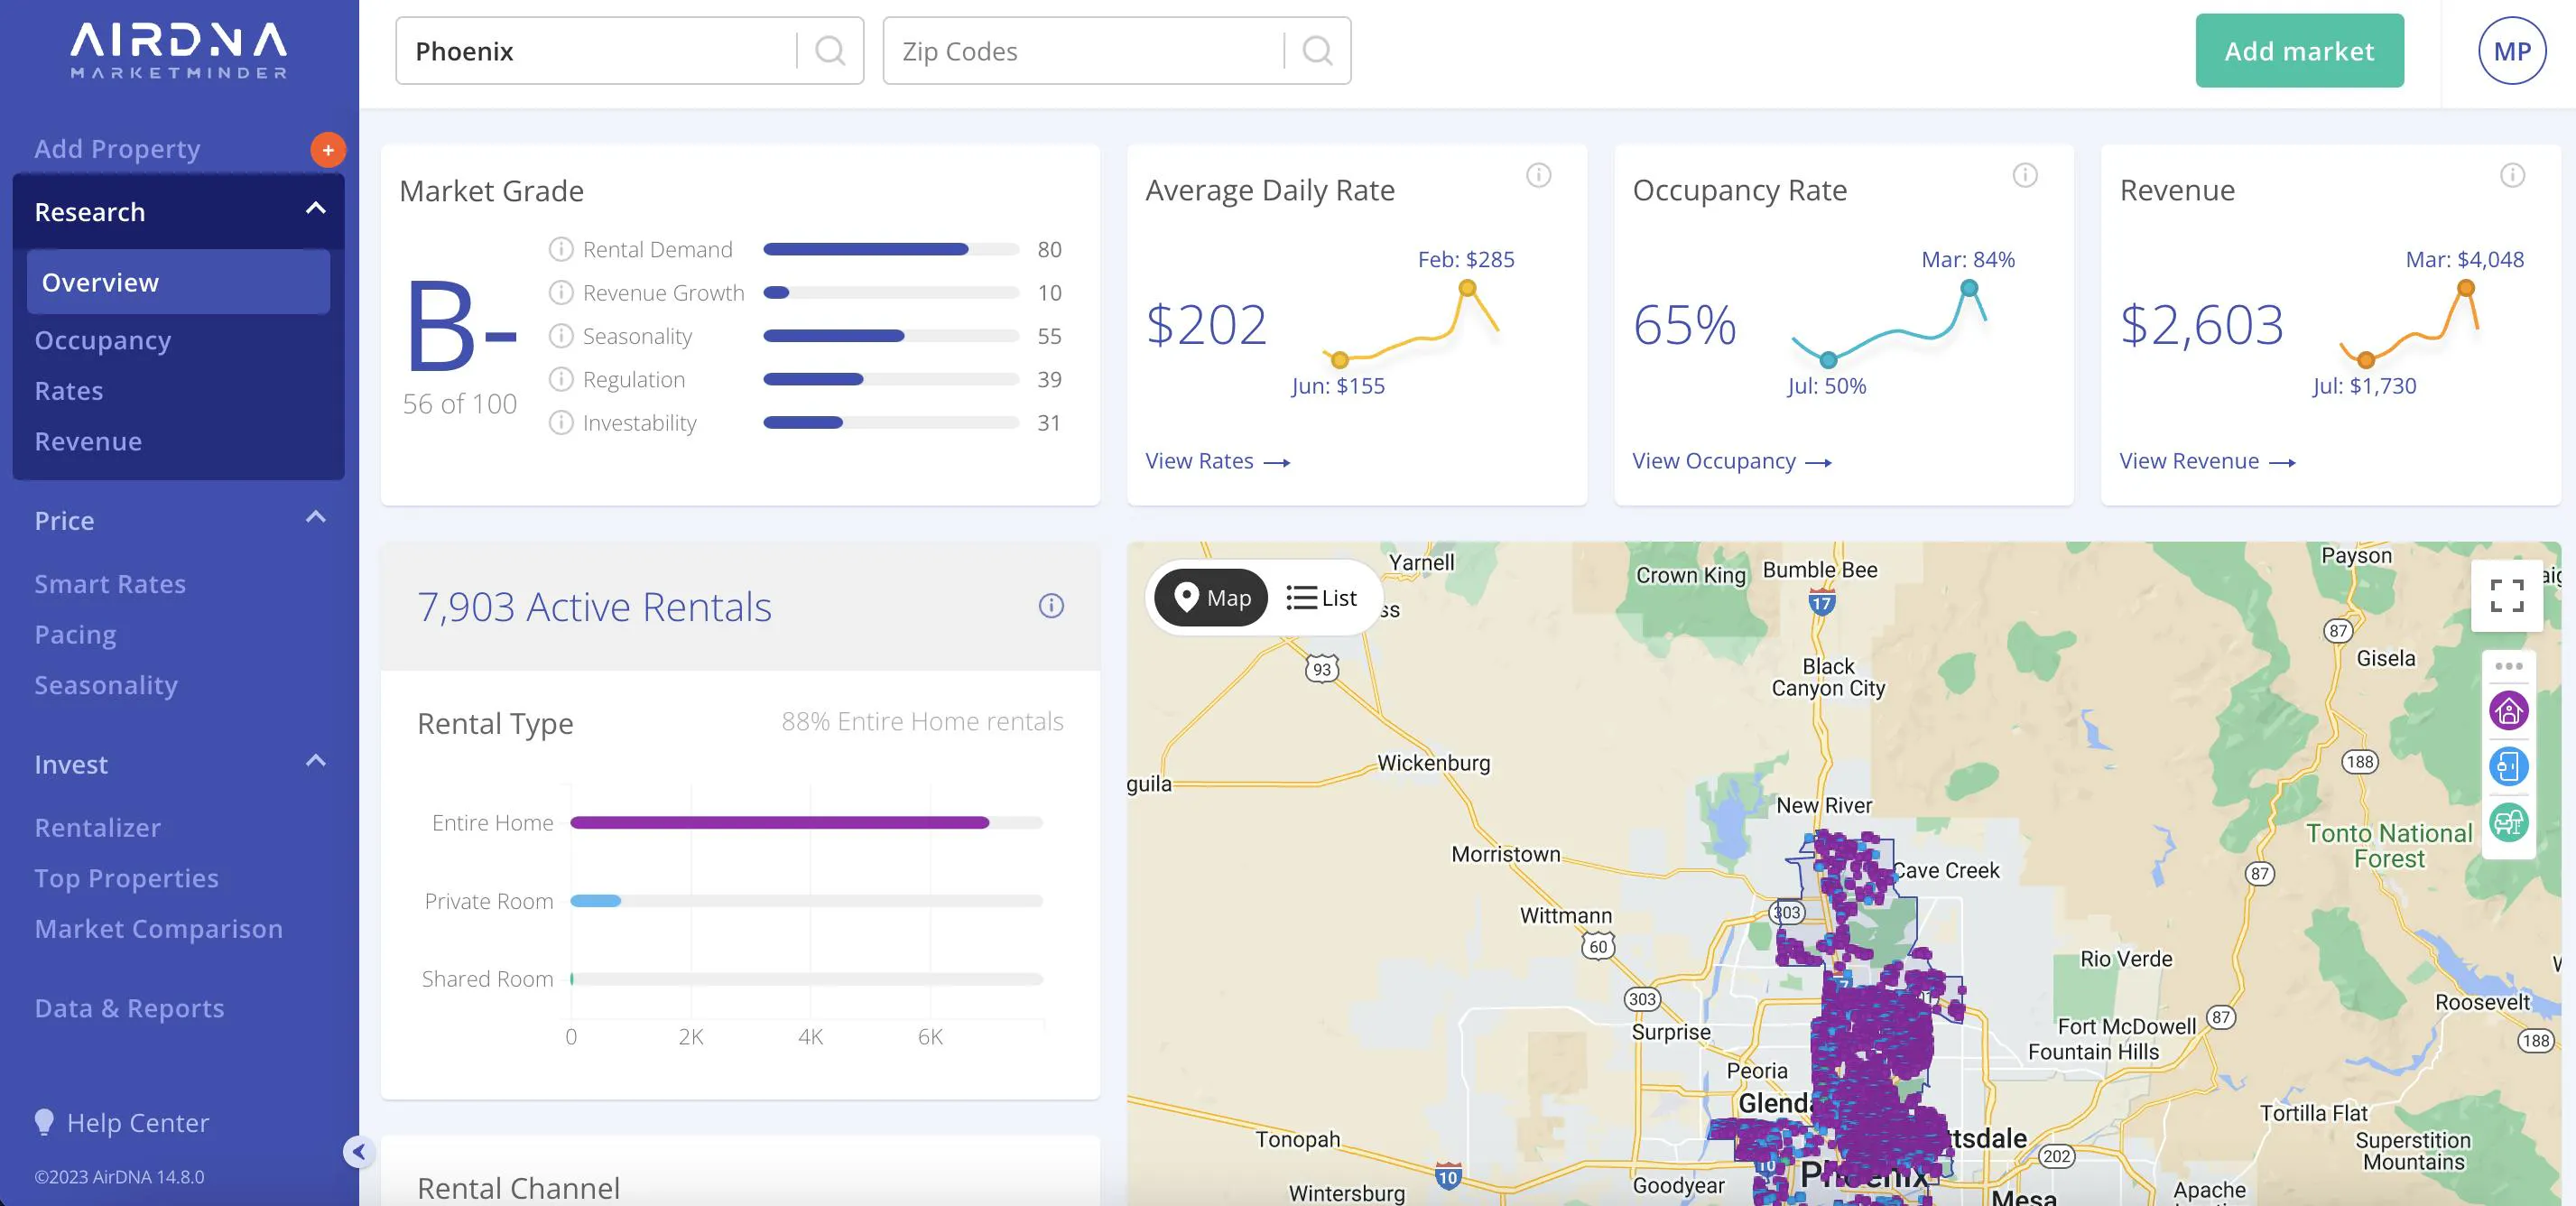
In the last month of data (in this case, April 2023), there were just over 7,903 rentals in the city of Phoenix with at least one day booked or available.
You can see how many listings are entire homes, private rooms, or shared rooms, and where they’re located on the map (to within 500 meters/550 yards). Usually, the conversation is more around entire homes, as private rooms are less likely to be seen as problematic given that the host is on-site.
So, in Phoenix, again looking at April 2023, there were 7,003 active entire place rentals that were available or booked for at least one day.
Wait, but why are there so many more on the map?
Short-term rental supply, unlike the number of hotel rooms, is very flexible. Listings can come online and go offline from month to month, depending on the owner’s situation, whether it’s high season, and many other factors. On the map, we can see all the listings that have been available in the last 12 months, but there aren’t really that many listings available at the same time.
How many properties are full-time short-term rentals?
If you scroll down on the Overview page, you’ll see a handy section called Rental Activity, where we separate listings by how many days they were available and booked in the last 12 months.
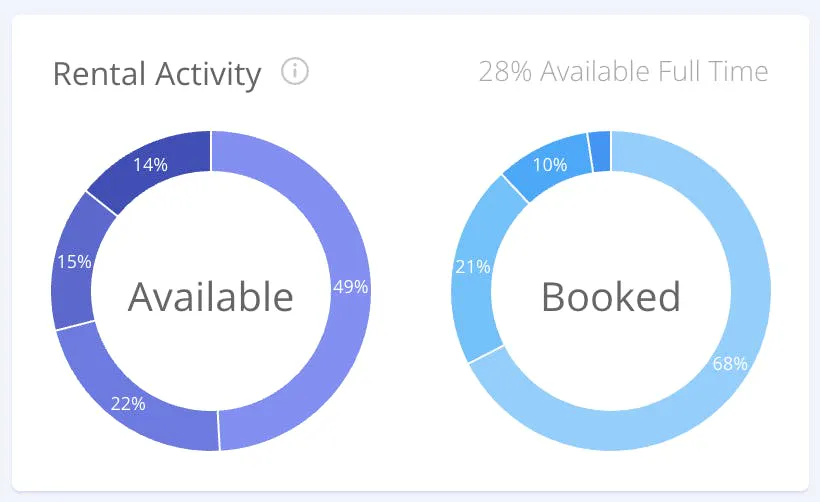
In this example, 49% of the properties in Phoenix were available for less than 90 days in the last 12 months. This could be anything from a few weeks when the owner was away, to even properties that came online solely for the Superbowl in February 2023, to accommodate some of the many football fans traveling for the game. A further 22% were available between 91 and 180 days.
In this case, only 28% (3,064 listings) were available what we might call “full-time”: that is, more than 181 days or half of the past year. In fact, only around 30% of short-term rentals in the whole U.S. are available full-time.
The Bigger Picture
So now we have a figure for true full-time rentals in our city, how can we show that in the context of the housing market and the wider economy?
To find out what percentage of housing short-term rentals represent in your area, the U.S. Census has helpful interactive tools to find out key figures for your area. Taking our example of Phoenix, we can see in the Census that there are 630,752 housing units in the city (2020 census).
We can then take the total full-time short-term rentals figure that we just reached, and divide the total short-term rentals by total housing and multiply that by 100 to get to a percentage of housing. For example, in Phoenix:
Full-time rentals: 3,064
Total housing: 630,752 units
3,064 / 630,752 x 100 = 0.5%
Even if we use currently available rentals (entire place only for a fair comparison), we get to a figure of just 1.1% (7,003 / 630,752 x 100 = 1.1%).
The Census data also gives you an insight into the number of vacant homes in your city, another useful figure to know. In the case of Phoenix, it’s over 47,000—over 6x the number of active short-term rentals.
Showing the Impact of Short-Term Rentals
A useful figure percentage to have to hand when talking with lawmakers is the percentage of GDP/employment in your area that is associated with hospitality.
You can find this in the interactive dashboard below, by searching for your MSA. The dashboard will show you the percentage of GDP and employment coming from accommodations and food in your area, based on data from Oxford Economics. In Phoenix, this sector represents around 2.88% of GDP and 8.73% of employment.
Note: the accommodation and food services sector comprises establishments providing customers with lodging and/or preparing meals, snacks, and beverages for immediate consumption, as defined by the North American Industry Classification System.
This is a little above the total for the whole country. Hospitality represents 2.61% of U.S. GDP and 8.68% of employment. But this may be higher if you’re in a very touristic area. In Cape Coral/Fort Myers, for example, hospitality is 4.21% of GDP and 11.92% of employment.
You could also supplement this data with your own knowledge: how many people do the property managers in your association employ? Are you paying a tourist tax on your short-term rental revenue? Remember that accommodation is only a small portion of your guests’ total spend in your area, and their spending in local businesses, restaurants, and activities is also a major benefit of short-term rentals, as opposed to guests staying in resort hotels who might only eat in the hotel restaurant and use the hotel pool.
Denver's STR Alliance, the Mile High Hosts conducted their own guest survey in 2020 to find out more about travelers’ preferences and spending habits. The survey found that 69% of the 400+ respondents bought groceries during their stay, 49% frequented local coffee shops, 65% participated in physical activities, and 45% went shopping. This information was used when giving public comment and proposing a secondary license type to Denver City Council, and for Good Neighbor Summit Events too.
Becoming an Advocate
So now that you have all this data, what can you do to bring about change and influence fair regulation in your destination?
The Scorecard is a good place to start, which you can access here.
This will help you to think more deeply about the situation in your market, and what the next steps should be, depending on how far along your journey you are. Don't wait for regulations to come. If you wait, your city will take matters into its own hands and could make blanket rules without your expert industry knowledge, based on guesswork and gut feeling, rather than knowledge and data.
Fair regulations benefit everyone, so if local communities are feeling the pressure, you need to start the conversation and work together for a solution.
Further Resources
AirDNA
- Literature Survey on the Effects of Short-Term Rentals on Local Housing Prices and Rents
- How regulations can impact your STR business
- Our latest research
Rent Responsibly
Dillon DuBois
AirDNA Senior Product Manager
Dillon DuBois is a seasoned expert in the short-term rental space, having worn many hats at AirDNA since joining in 2019. From driving B2B marketing initiatives to shaping product strategy, Dillon’s deep understanding of both the company and the industry makes him a key player in delivering innovative solutions. Now a Senior Product Manager, he leverages his experience to bridge the gap between data and user needs. He manages his own short-term rental in Medellín, Colombia, and enjoys all things outdoor adventure, travel, cooking, & surfing.