U.S. 2024 and 2025 Mid-Year Outlook Report
Published: July 9, 2024
Last updated: February 11, 2025

Jamie Lane
At the end of 2023, we anticipated that the short-term rental (STR) market would begin to grow at a more balanced and stable pace. Over the past two years, RevPAR (Revenue per Available Rental) experienced net negative changes due to rapid supply increases that outpaced demand. With the economy looking up, we expected demand to pick up again and supply growth to slow down in response to flagging unit-level performance and high interest rates.
Although there have been some big swings in monthly performance so far in 2024, the overall trends are aligning with our expectations. In May, supply growth was less than half of what it was in May 2023. Meanwhile, demand growth jumped to +11.4%, much higher in comparison to the -1.8% seen in May 2023. While not every month in 2024 has delivered such impressive results, we’re seeing an overall trend of stabilizing occupancy rates and positive rate growth. Unit-level performance is improving as a result.

2024 and 2025 Outlook Highlights
- Demand: In 2023, demand for short-term rentals grew by just 1.8% because high inflation made people cautious about spending. There was also uncertainty about how well the Federal Reserve could manage interest rates without causing a recession. Now, with inflation easing to more typical levels and recession fears fading, year-to-date demand is already 6.8% higher than in 2023. We expect this trend to continue, with demand growing by 5.9% by the end of 2024. Looking ahead to 2025, we anticipate even stronger growth of 6.8%.
- Supply: High mortgage rates are expected to continue through 2025, regardless of the Federal Reserve's actions this year. This will make it harder for people to invest in new properties. Despite this, we still expect supply growth to be slightly higher than demand growth in 2024. However, we anticipate this trend will reverse in 2025.
- Occupancy: Occupancy rates have been steadily declining since their peak in 2021 and are down by 1.5% so far this year. However, when looking at the average over the past twelve months, the decline has stopped and should stay stable for the rest of the year. In 2025, occupancy rates are expected to rise slightly for the first time since 2021 thanks to slower supply growth and continued demand.
- Average Daily Rates (ADRs): In 2023, ADR declined due to mix shift, or the introduction of new listings. This trend has already reversed in 2024, with ADRs up by 2.8% so far. These increases mostly happened during the off-season when even small positive changes can lead to larger percentage growth. We expect ADRs to rise by 2.0% for the entire year as the slower growth in available listings eases the impact of mix shift. In 2025, ADRs are projected to increase by about the same amount (2.1%).
- RevPAR: RevPAR began falling for the first time ever in 2022 and continued declining into 2023. However, 2024 will be the year that RevPAR grows again. While a slight drop in occupancy will slow down this growth, RevPAR should still improve by 0.6% by the end of the year. As occupancy rates stabilize and start to rise in 2024, RevPAR growth is expected to accelerate to 2.9% next year.

Economic Outlook: All Eyes on the Fed in Q2 2024
In March 2022, the Federal Reserve initiated the fastest interest rate hike in its history. The effect on inflation was nearly instantaneous. Inflation peaked in June 2022 at 9.0%, as measured by the year-over-year change in the Consumer Price Index (CPI), and then began to drop rapidly. Inflation is currently around 3.3%.
The Fed isn’t just focused on inflation– it also aims to keep employment as high as possible. This sometimes leads to a trade-off between slowing down the economy to control inflation and boosting it to support the labor market. Fortunately for the Fed, higher interest rates haven't hurt labor demand significantly so far. Unemployment is staying at or below 4.0%. On the other hand, the unemployment rate has been creeping up since the beginning of 2023.
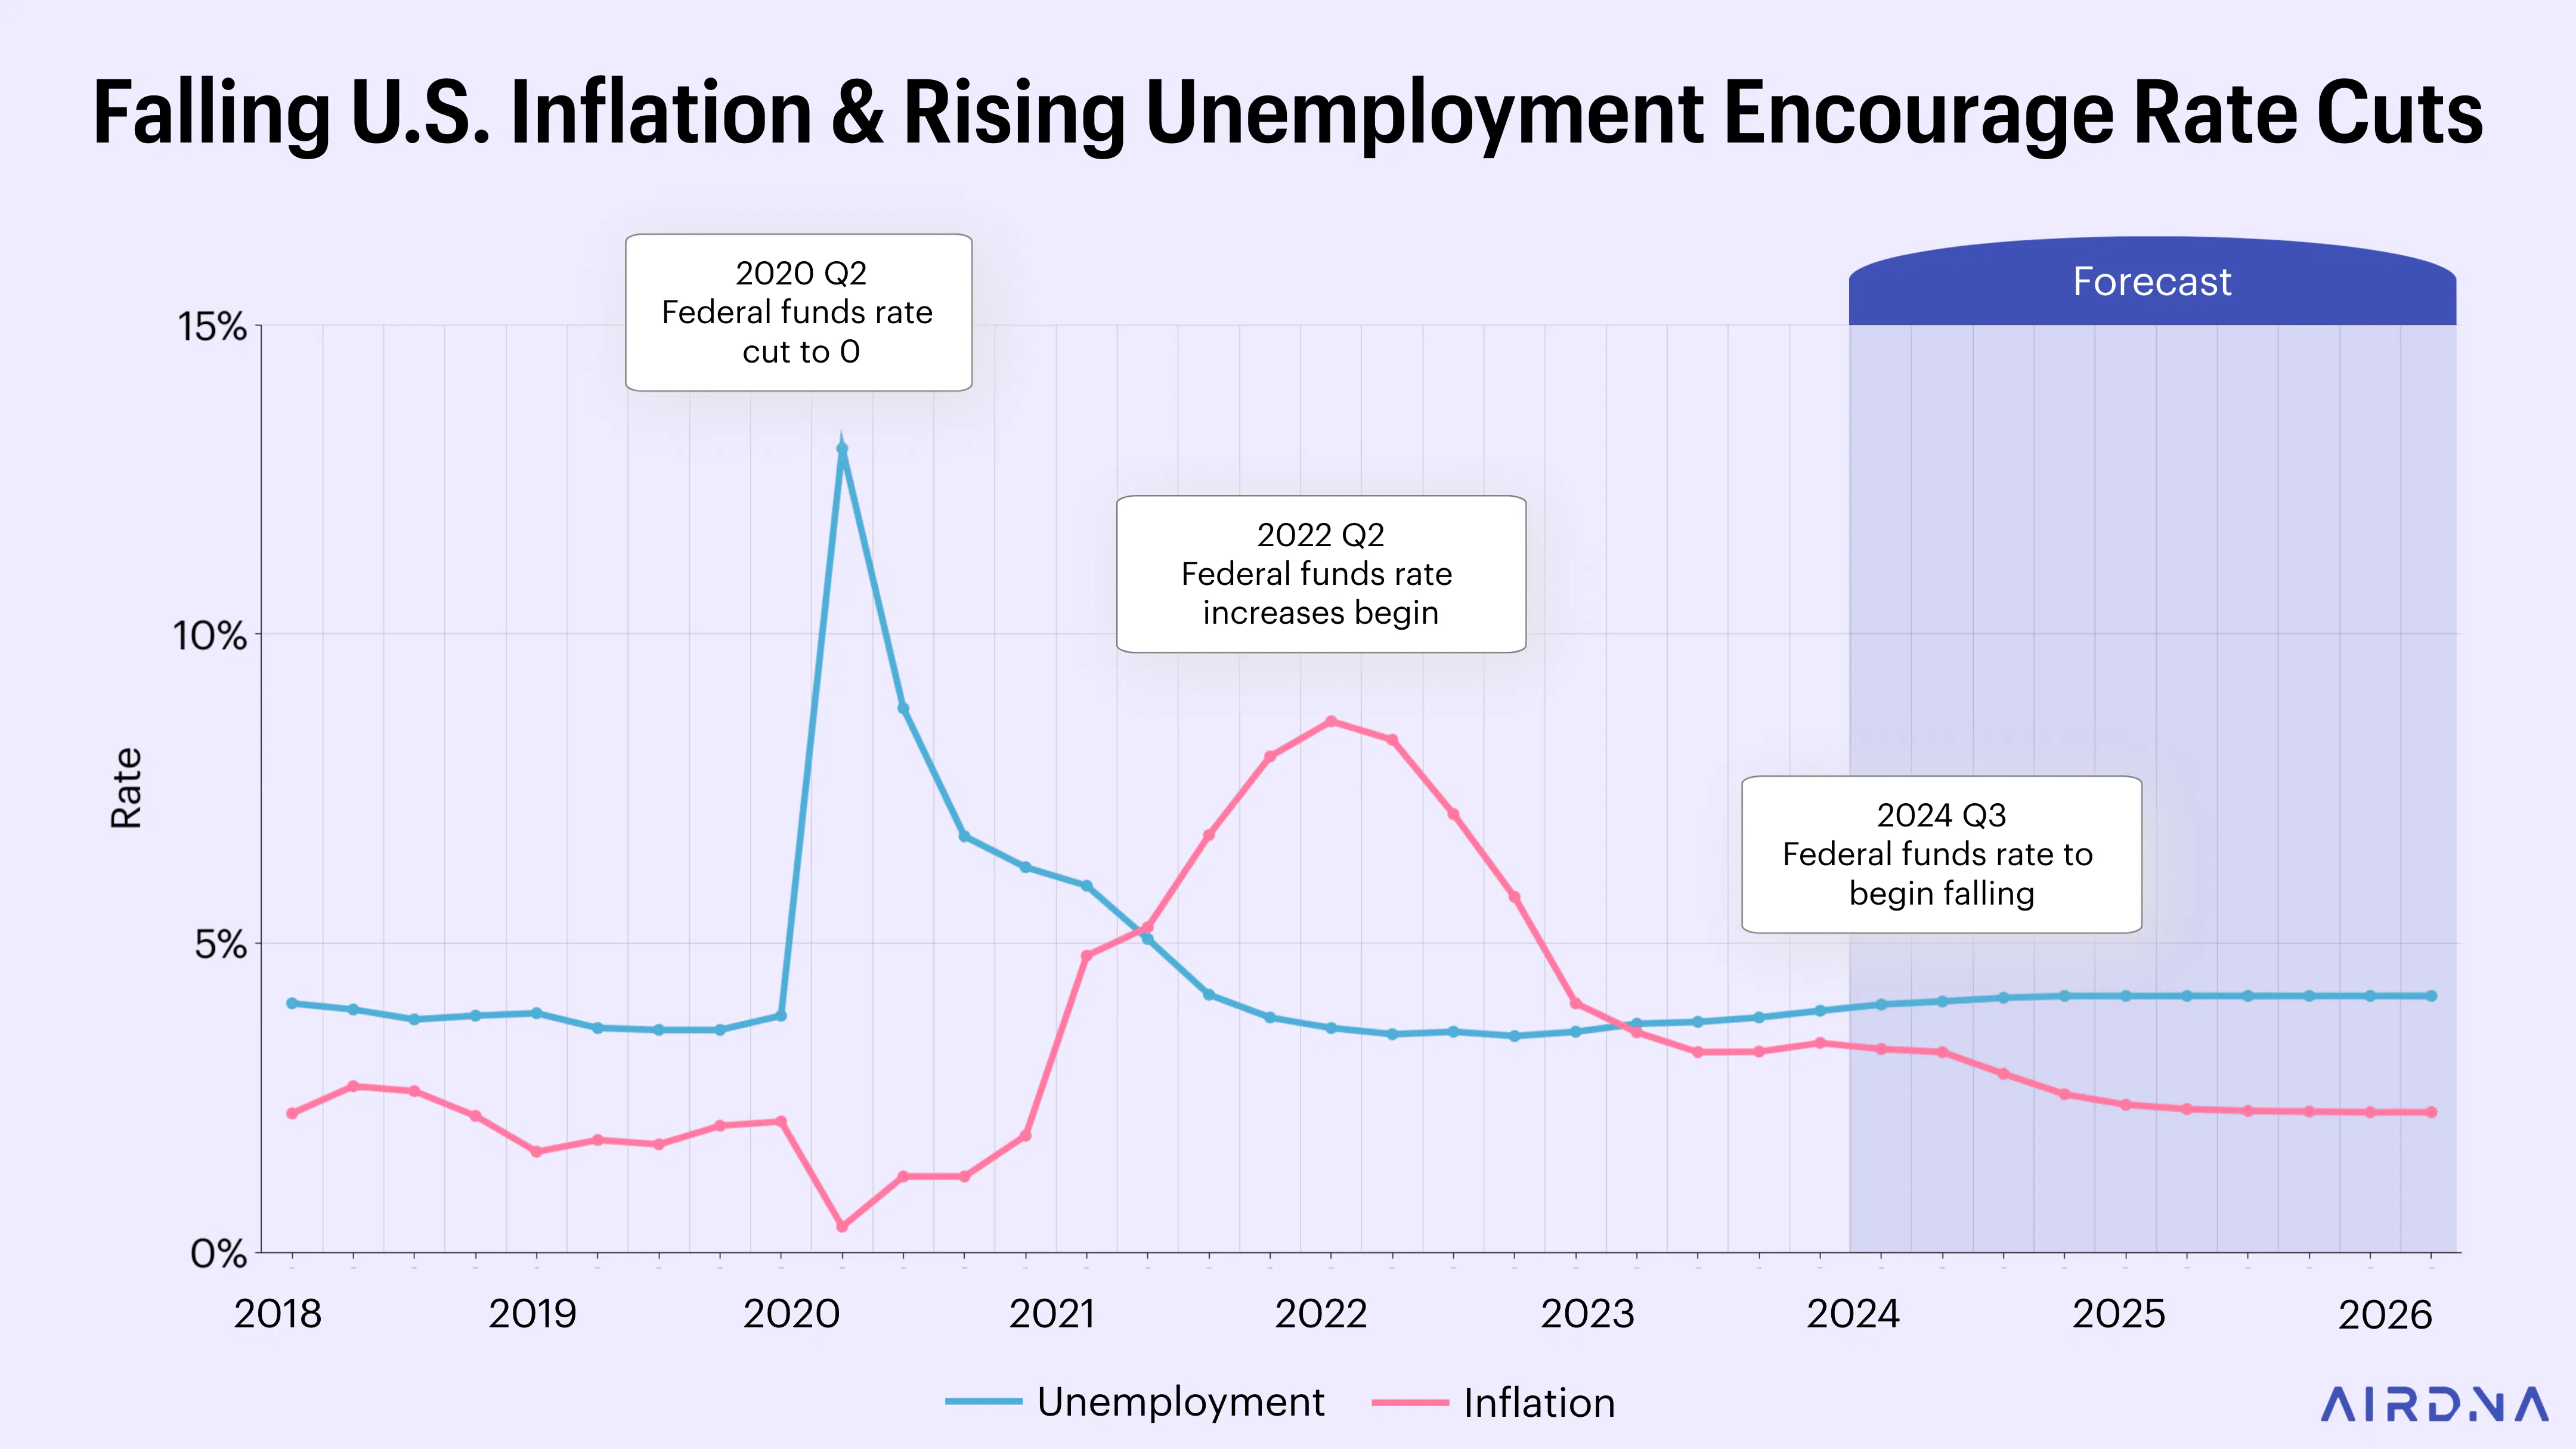
The Fed’s decision to cut rates depends on continued reports of declining inflation. Interest rates take time to fully impact the labor market, so Oxford predicts rate cuts in September.
However, rate cuts will likely be slower than the rate hikes. Keeping rates “higher for longer” will help keep inflation down, but it will also mean higher borrowing costs. This makes it more expensive to invest in new short-term rental properties compared to before the pandemic.
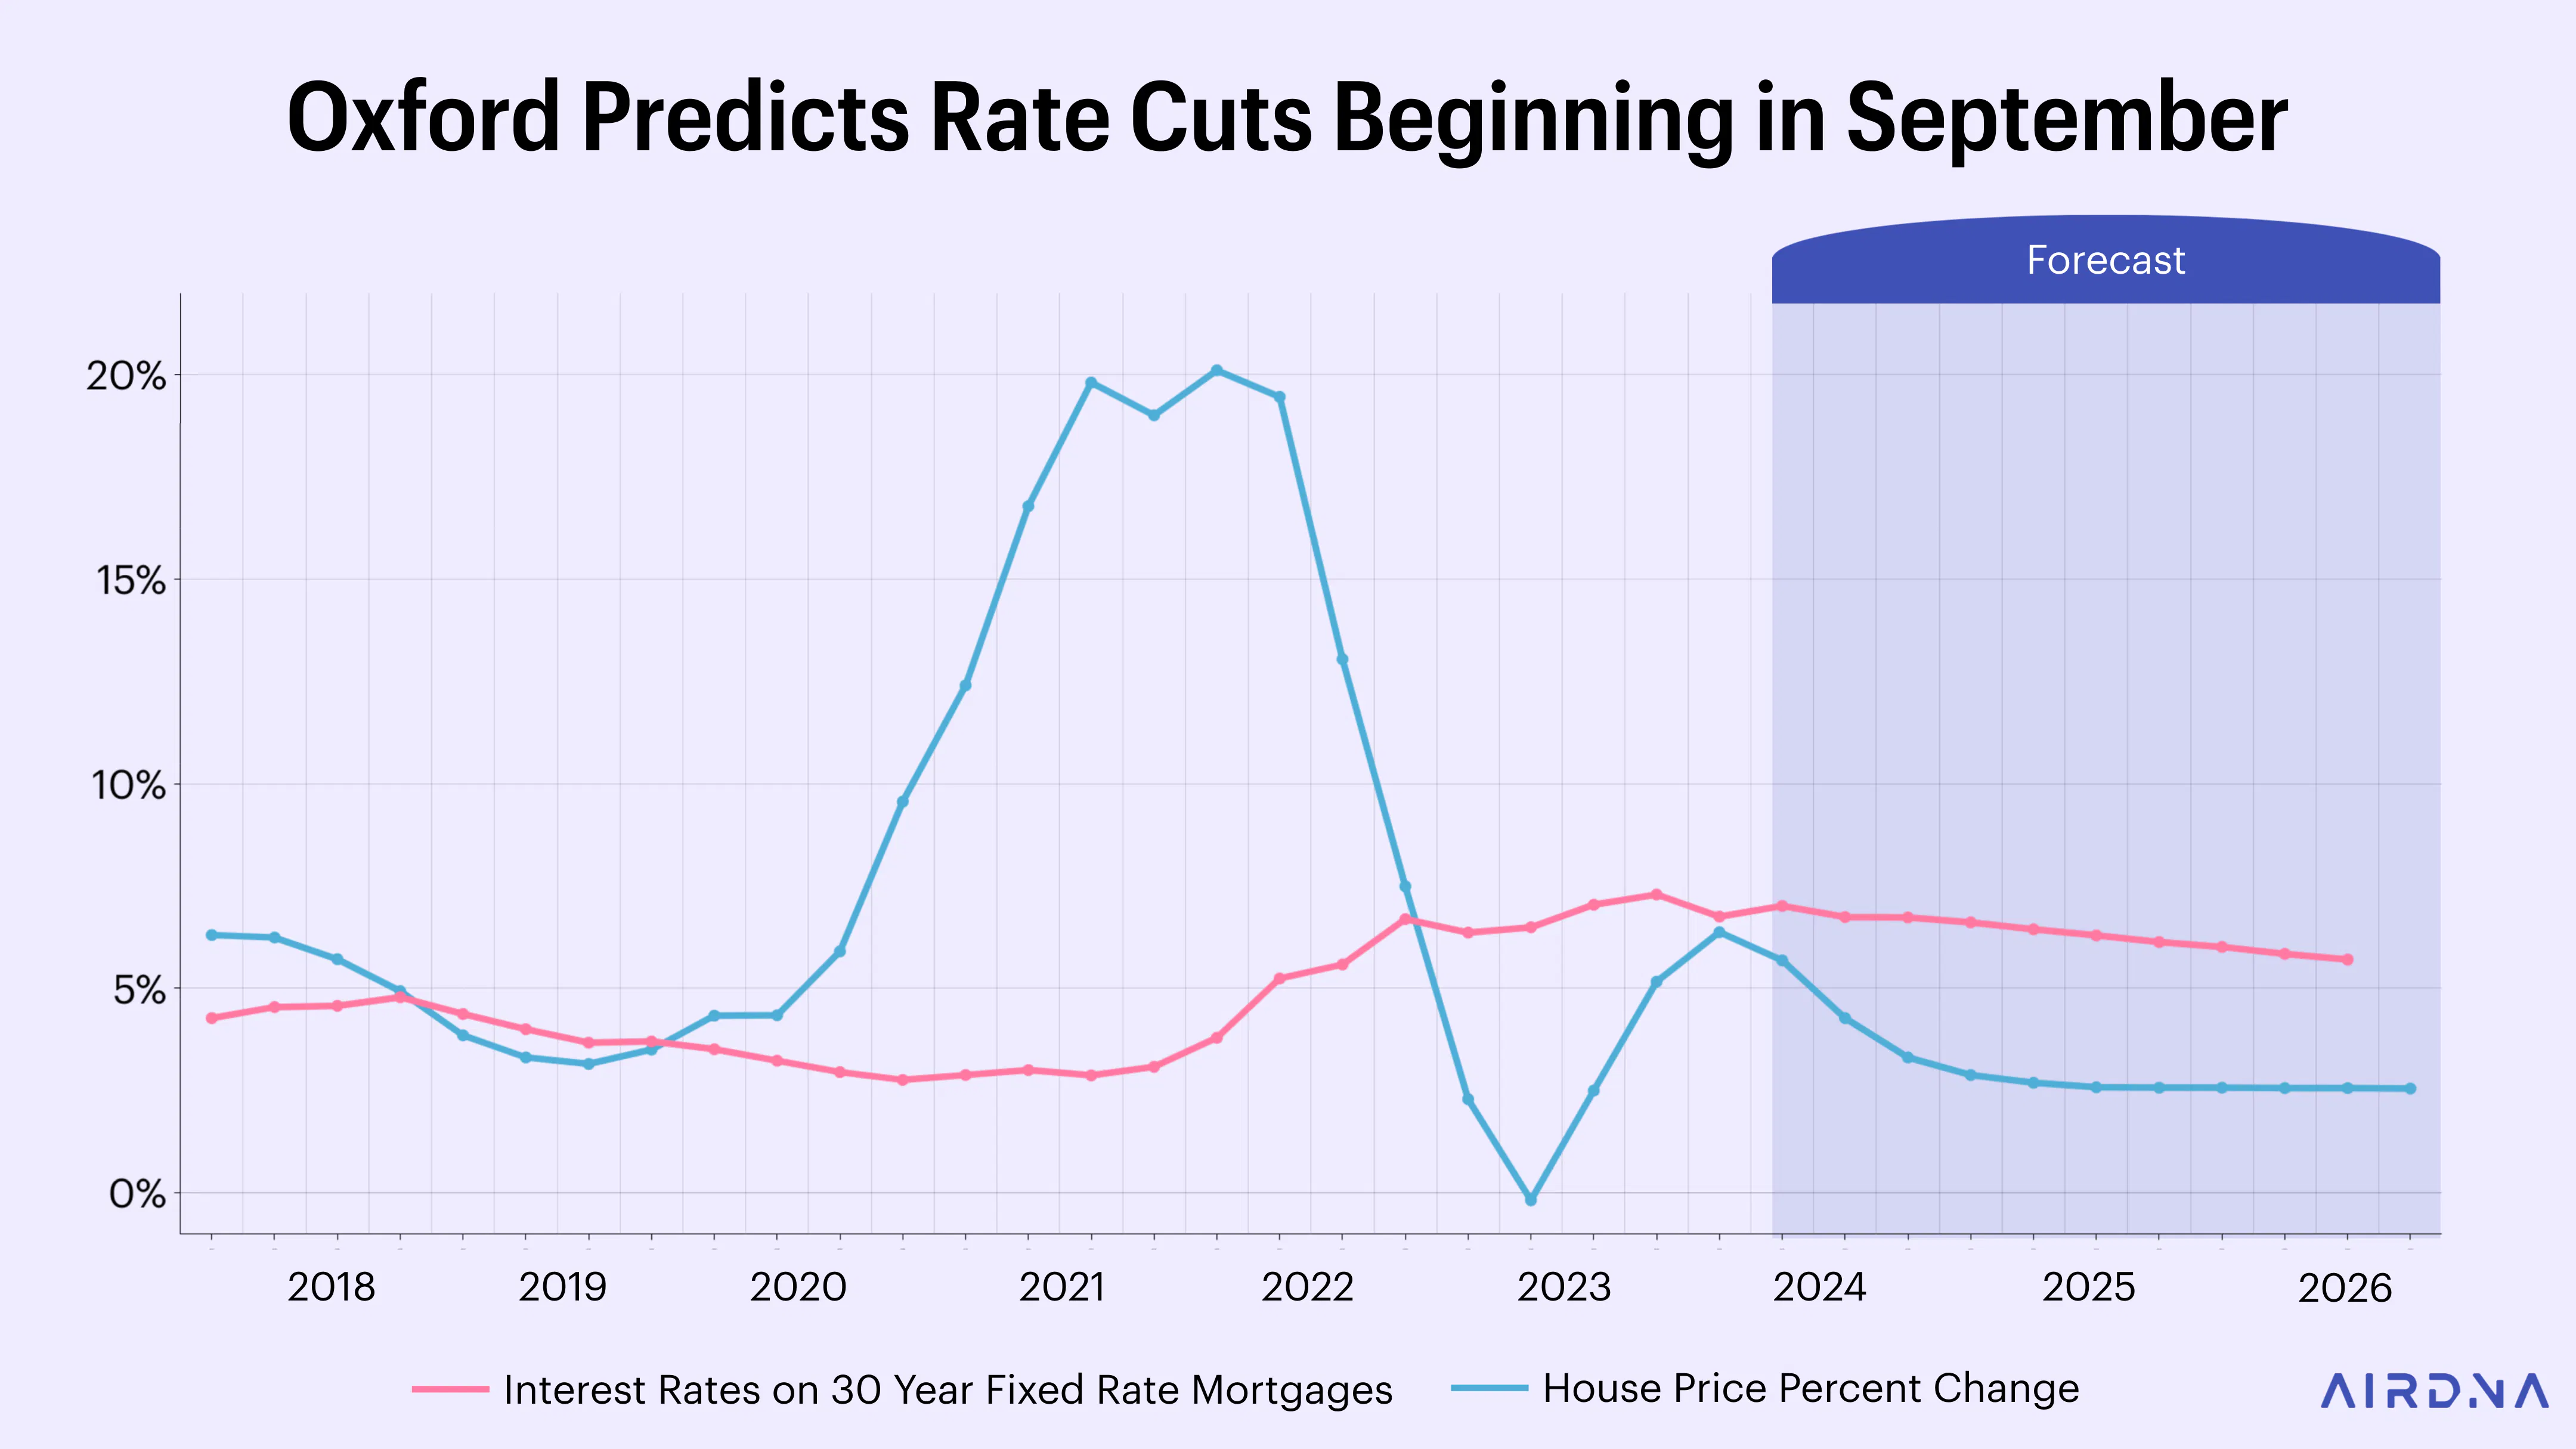
Speaking of investment costs, house prices have remained stubbornly high despite increasing interest rates. House prices declined only slightly by 0.18% in Q2 of 2023. Typically, higher interest rates lower housing prices because the added interest on home loans makes buying a home less attractive. The opposite happened in 2021 when record low interest rates led to a surge in home prices, with appreciation around 20% in a single year.
After the Fed begins to lower rates, the uncertainty around lending should ease. Appreciation in home prices should become less volatile. Oxford Economics expects housing appreciation to settle to just slightly above inflation, about 2.5%, by 2025. This rate is lower than pre-pandemic levels, but home prices won't drop or undo the big gains from 2021.
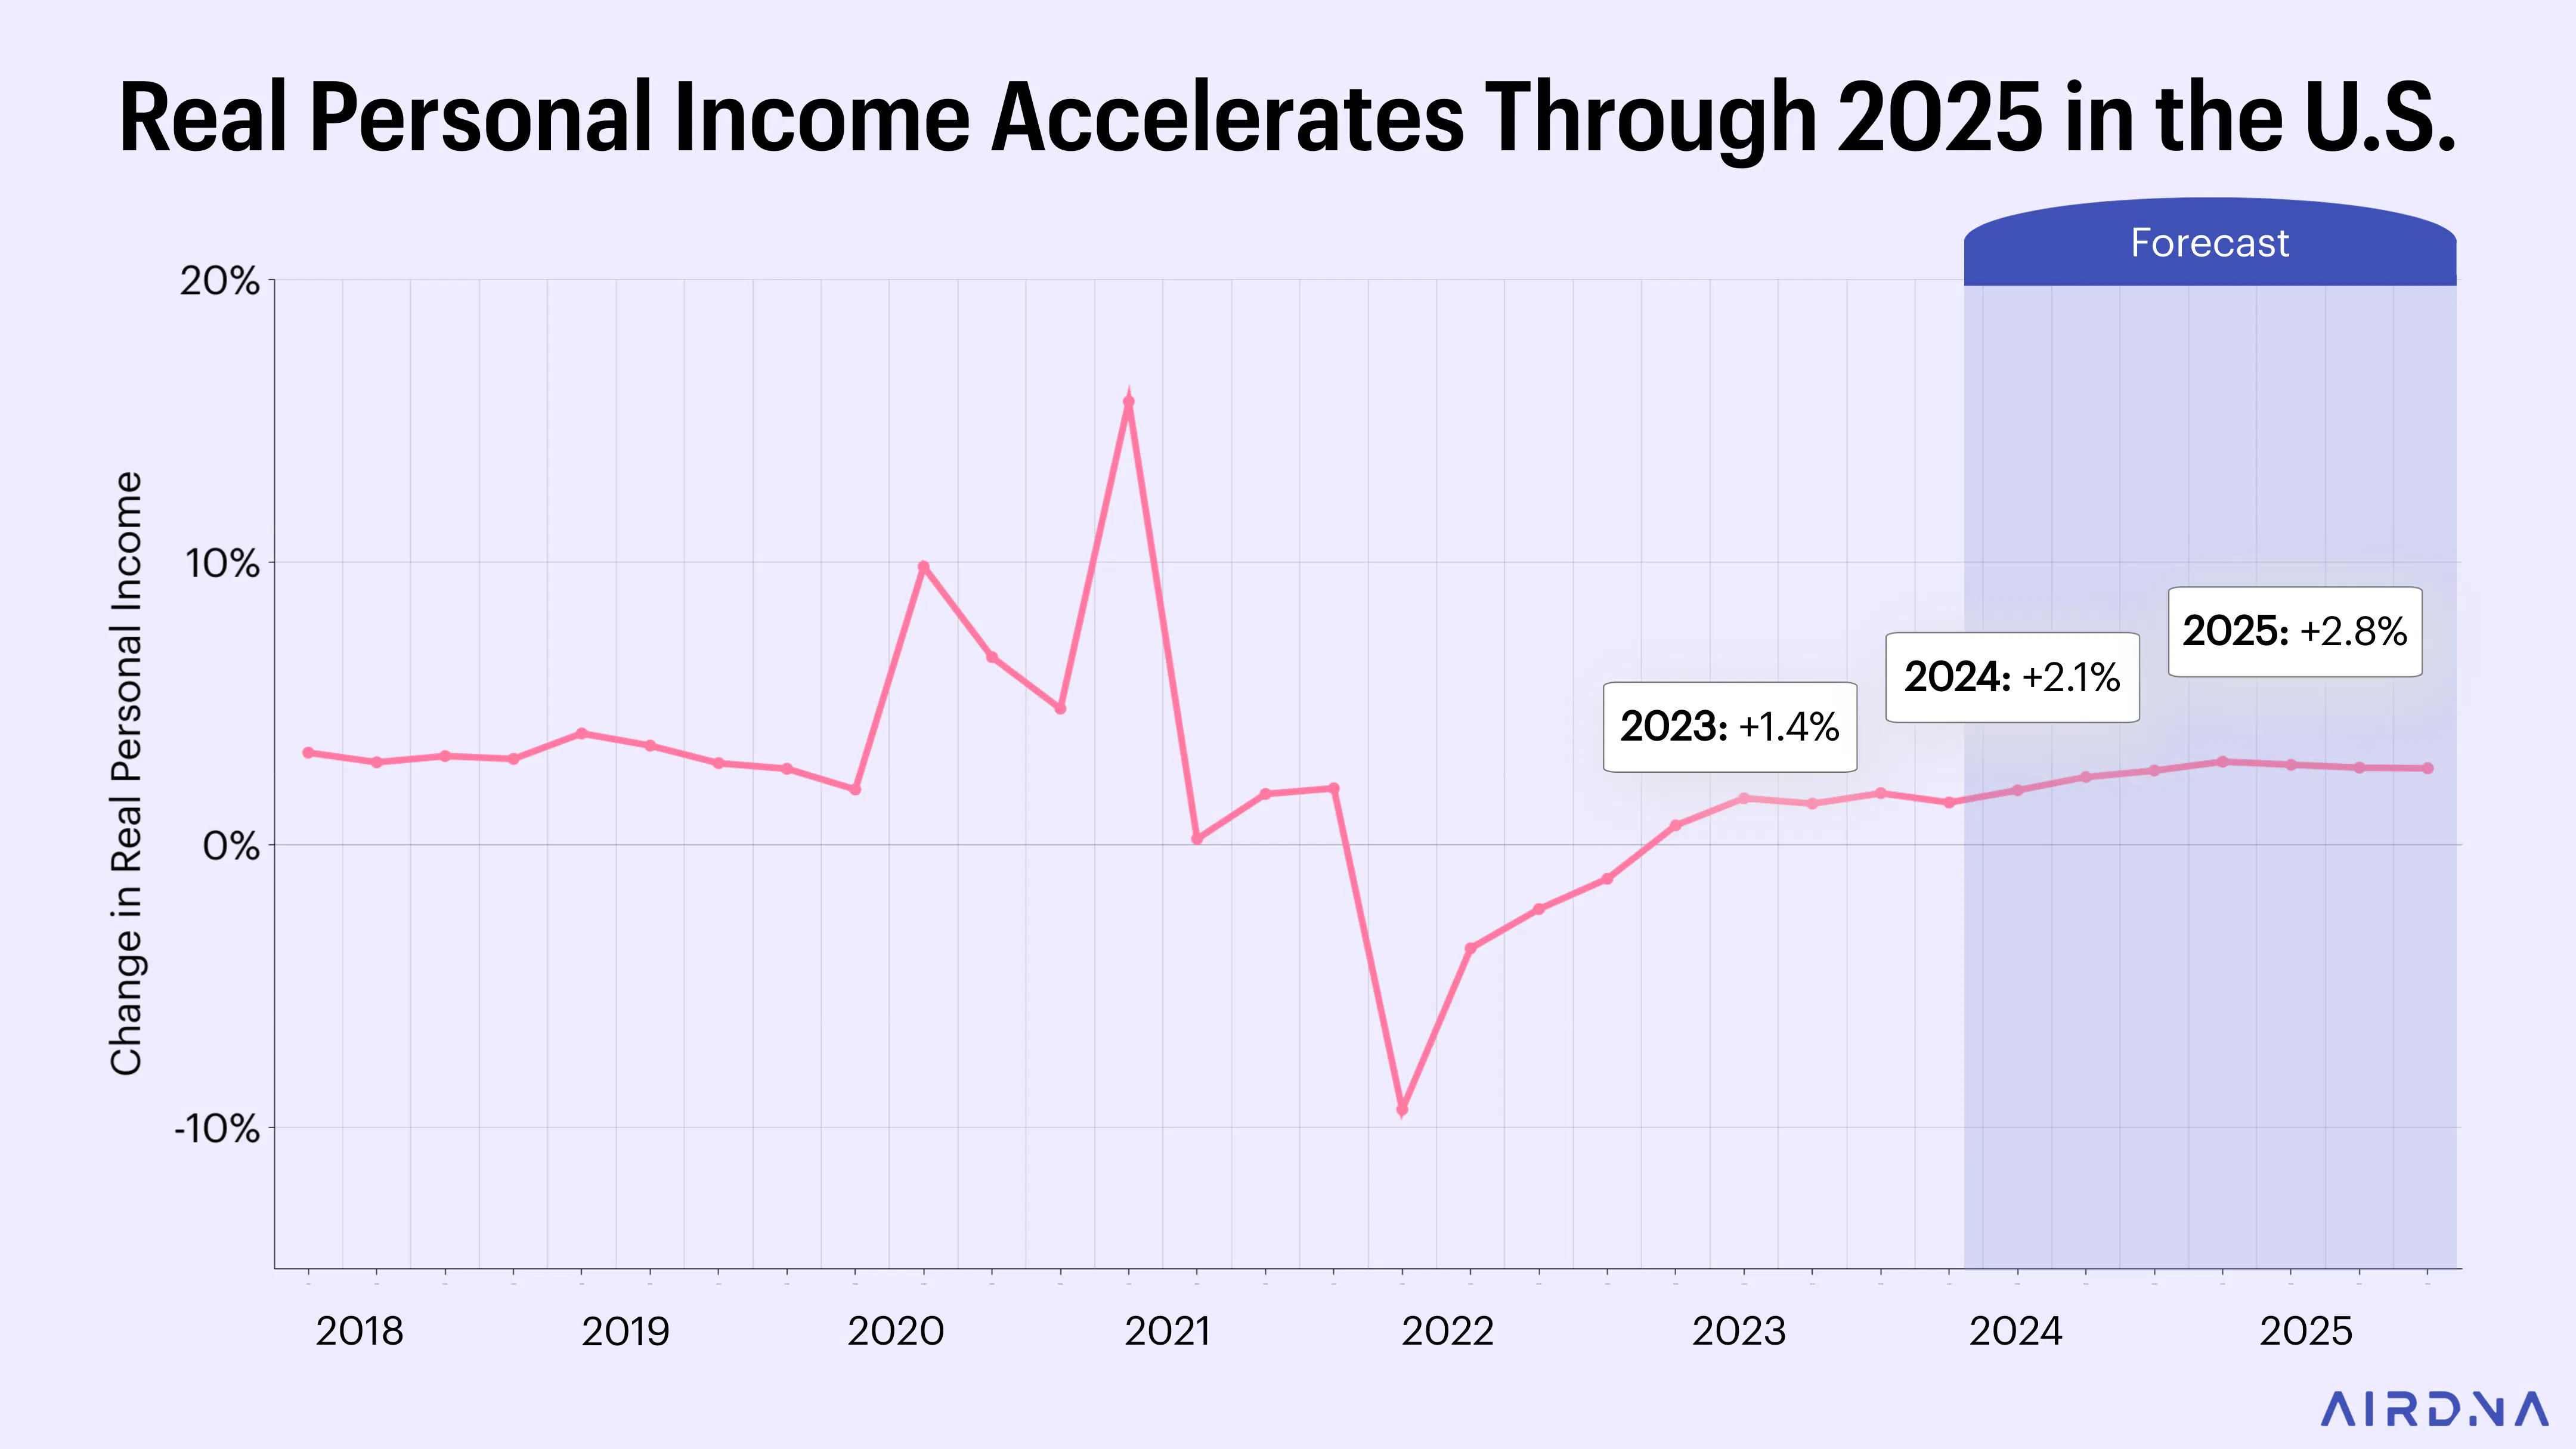
If high interest rates continue to hinder new investments, what factors are driving consumption and demand? Fixed payments refer to regular, unchanging expenses such as mortgages, loans, and rent. As inflation decreases, the relative cost of these fixed payments becomes more manageable, increasing overall purchasing power. Wages also started increasing faster than inflation in mid-2023. Oxford Economics predicts that real personal incomes, which have been growing positively since Q1 2023, will keep rising annually through 2025.
Supply Growth in 2024 and 2025 Will Continue to Slow
While inflation dropped quickly after interest rates went up, it takes longer for these rates to affect mortgage rates for short-term rental (STR) investors. Case in point—interest rates started rising in March 2022, but U.S. STR supply growth didn’t peak until February 2023. Since then, supply has been steadily decreasing. With interest rates staying high and home prices remaining elevated, supply growth will keep slowing. In 2024, supply growth will match demand. By the end of 2025, supply growth will be lower than demand growth.

Another way to see the slowing pace of supply is by looking at the number of new listings. Strong STR performance in the summer of 2021 led to a surge of new listings starting in March 2022, peaking at over 80,000 new listings in May of that year. Although this number quickly dropped to below 70,000 by September 2022, new listings stayed between 60,000-70,000 per month throughout 2023. In January 2024, new listings fell to about 54,000 and have remained under 60,000 since then. The pattern of new listings in 2024 is so far more similar to 2021 than to 2022 or 2023.

Let’s talk about locations. We expect the delayed impact of high interest rates to slow supply growth everywhere. In addition, regulations have dramatically impacted supply in large cities. Large cities often have higher housing costs and more direct competition from traditional lodging, making them more vulnerable to strict regulations like those seen in New York City.
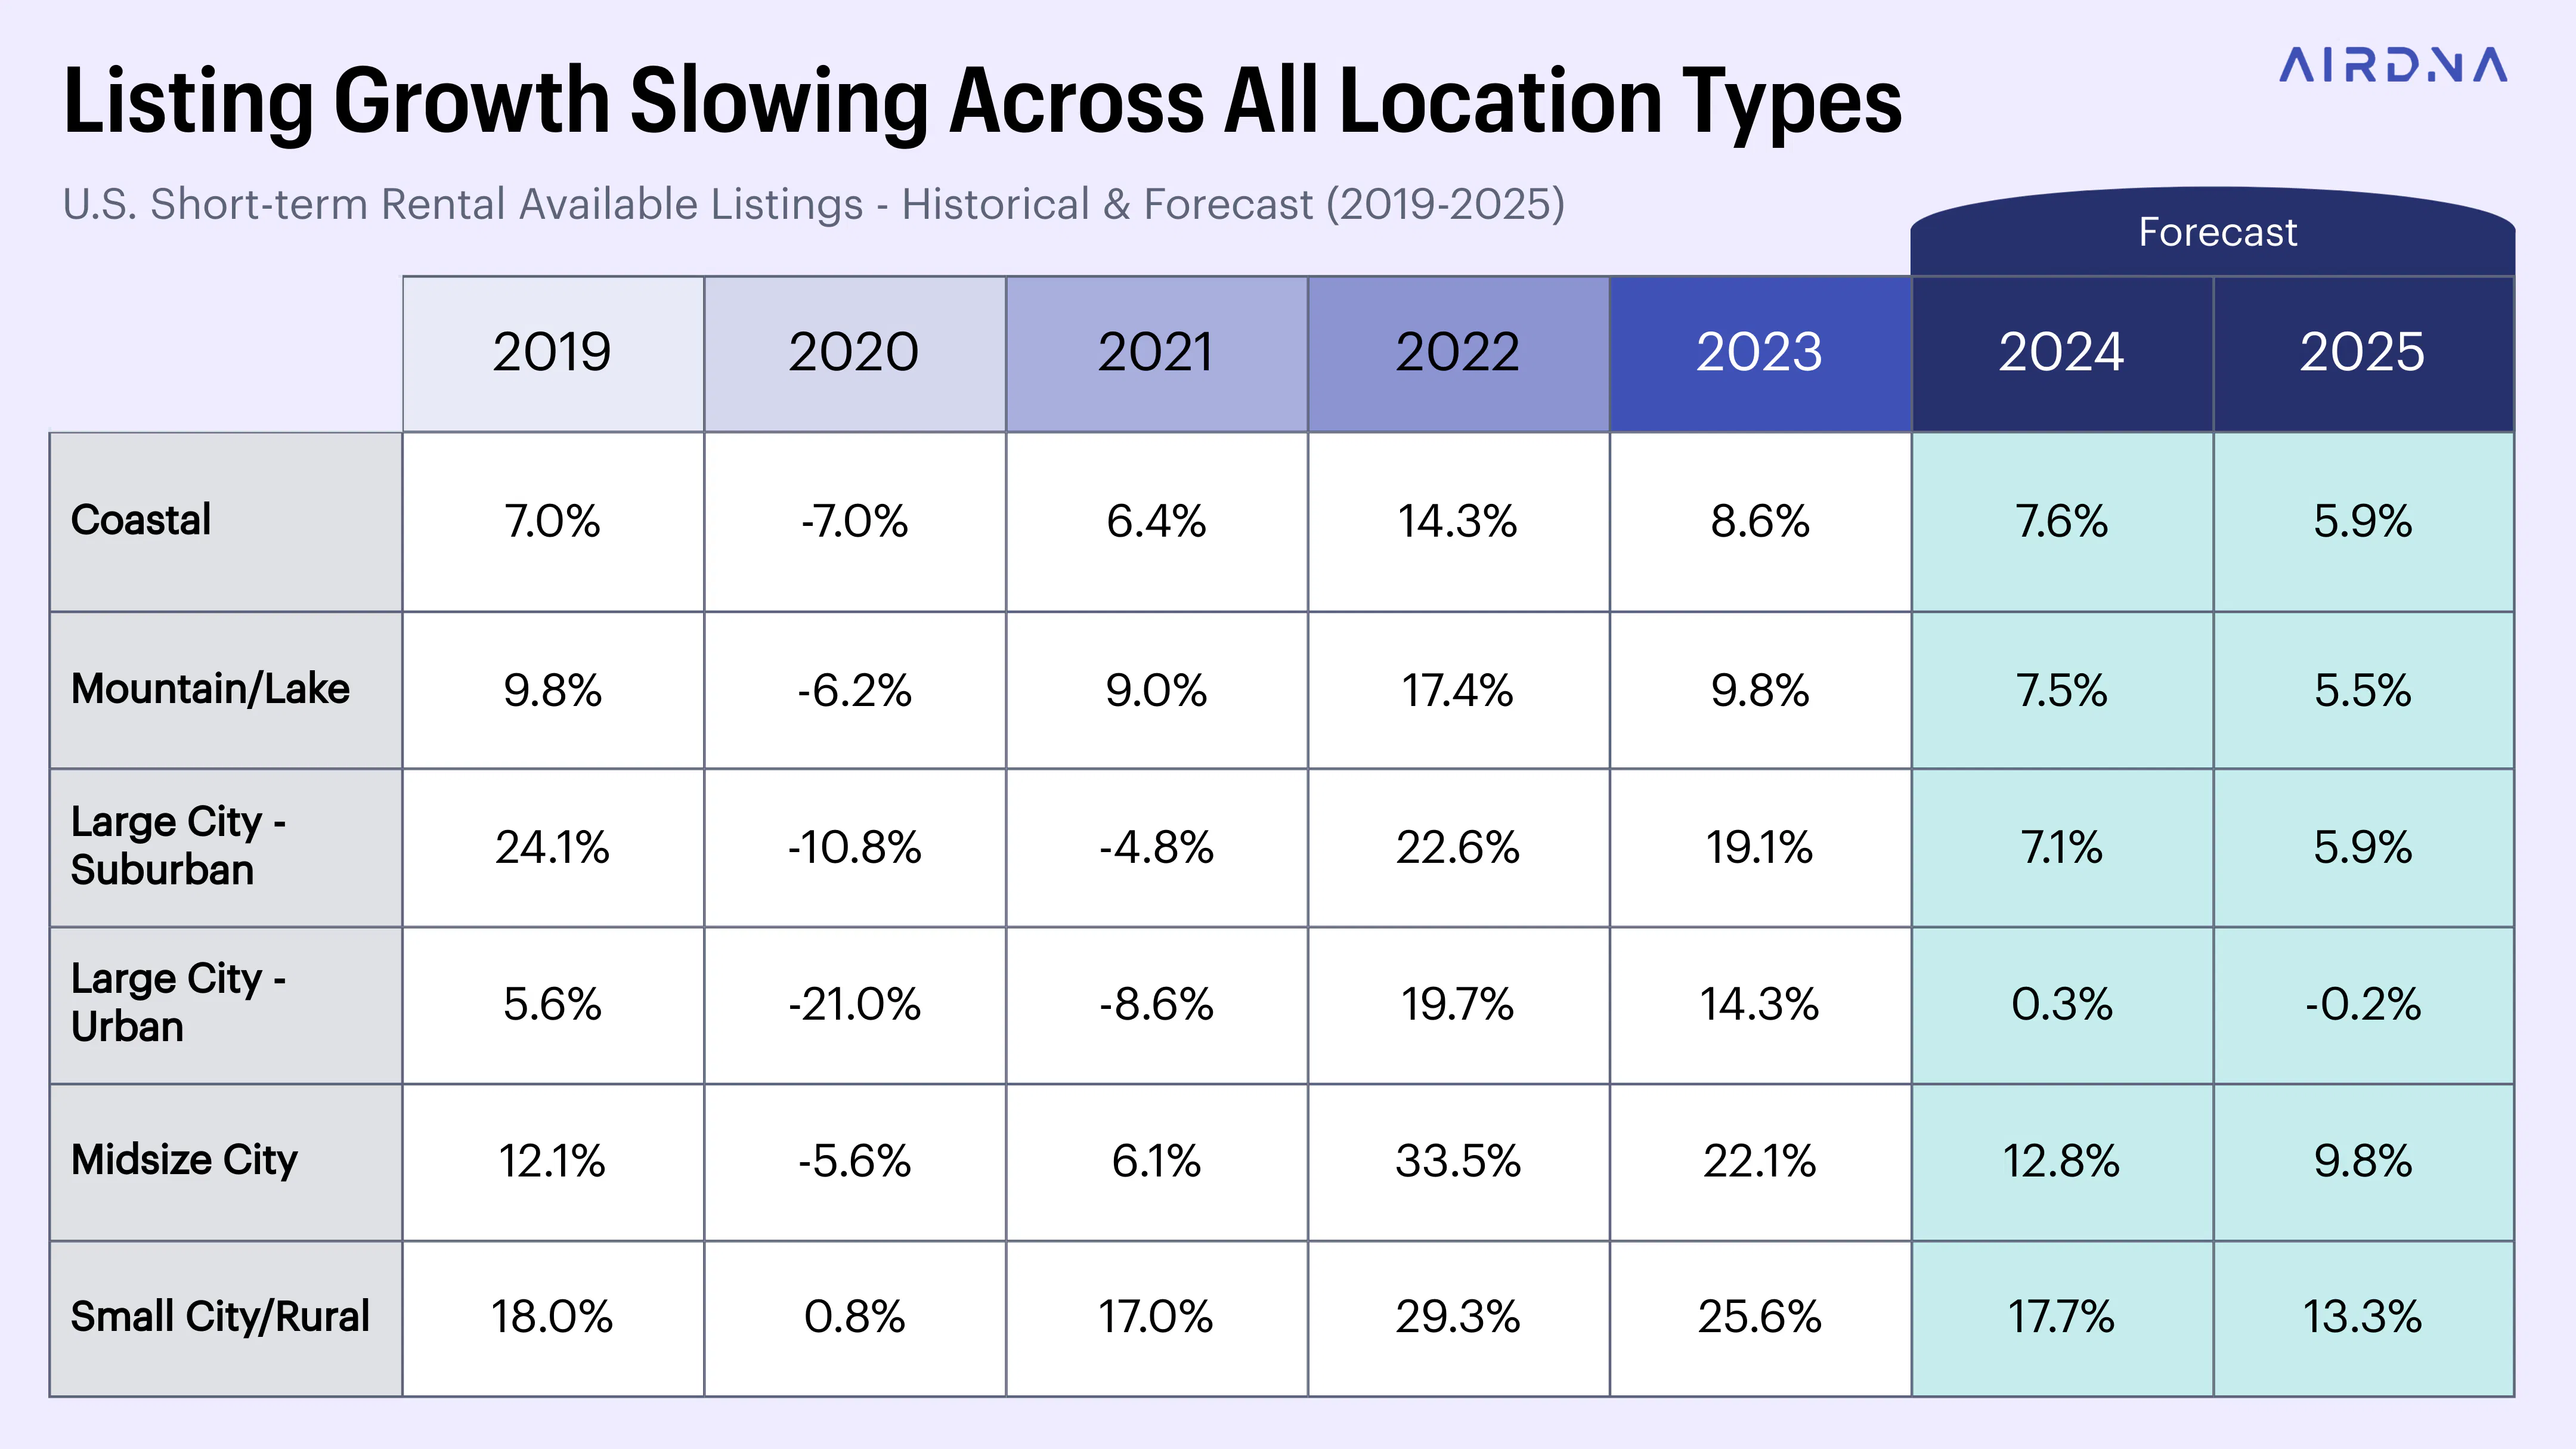
In fact, the supply in New York’s once large market dropped significantly after the enforcement of short-term rental restrictions. While supply is slowing across location types, large urban areas have already seen a negative year-over-year change in listings. Suburban areas around these cities have also experienced a spillover effect. In February 2024, their growth rate fell below that of mountain, lake, and coastal resort locations. This comes after two years of much faster growth.
Demand Picking Up Steam in Most Locations
So far, demand growth in 2024 has been quite variable. January and April saw flat growth, while February, March, and May experienced impressive year-over-year increases. In January, a cold snap in the northern half of the country and low snow levels led to weak demand growth at just 0.1%. However, better skiing conditions in February resulted in 11.3% demand growth. Similarly, the shift of Easter and Spring Break from April to March moved much of the demand, resulting in flat growth of 0.1% in April but a strong 10.3% increase in March.
Fortunately, May was able to produce a high demand growth rate of 11.4% without detracting from another month. The year-to-date demand growth is 6.8%, which represents a much higher average growth rate than in 2023 (1.8%).
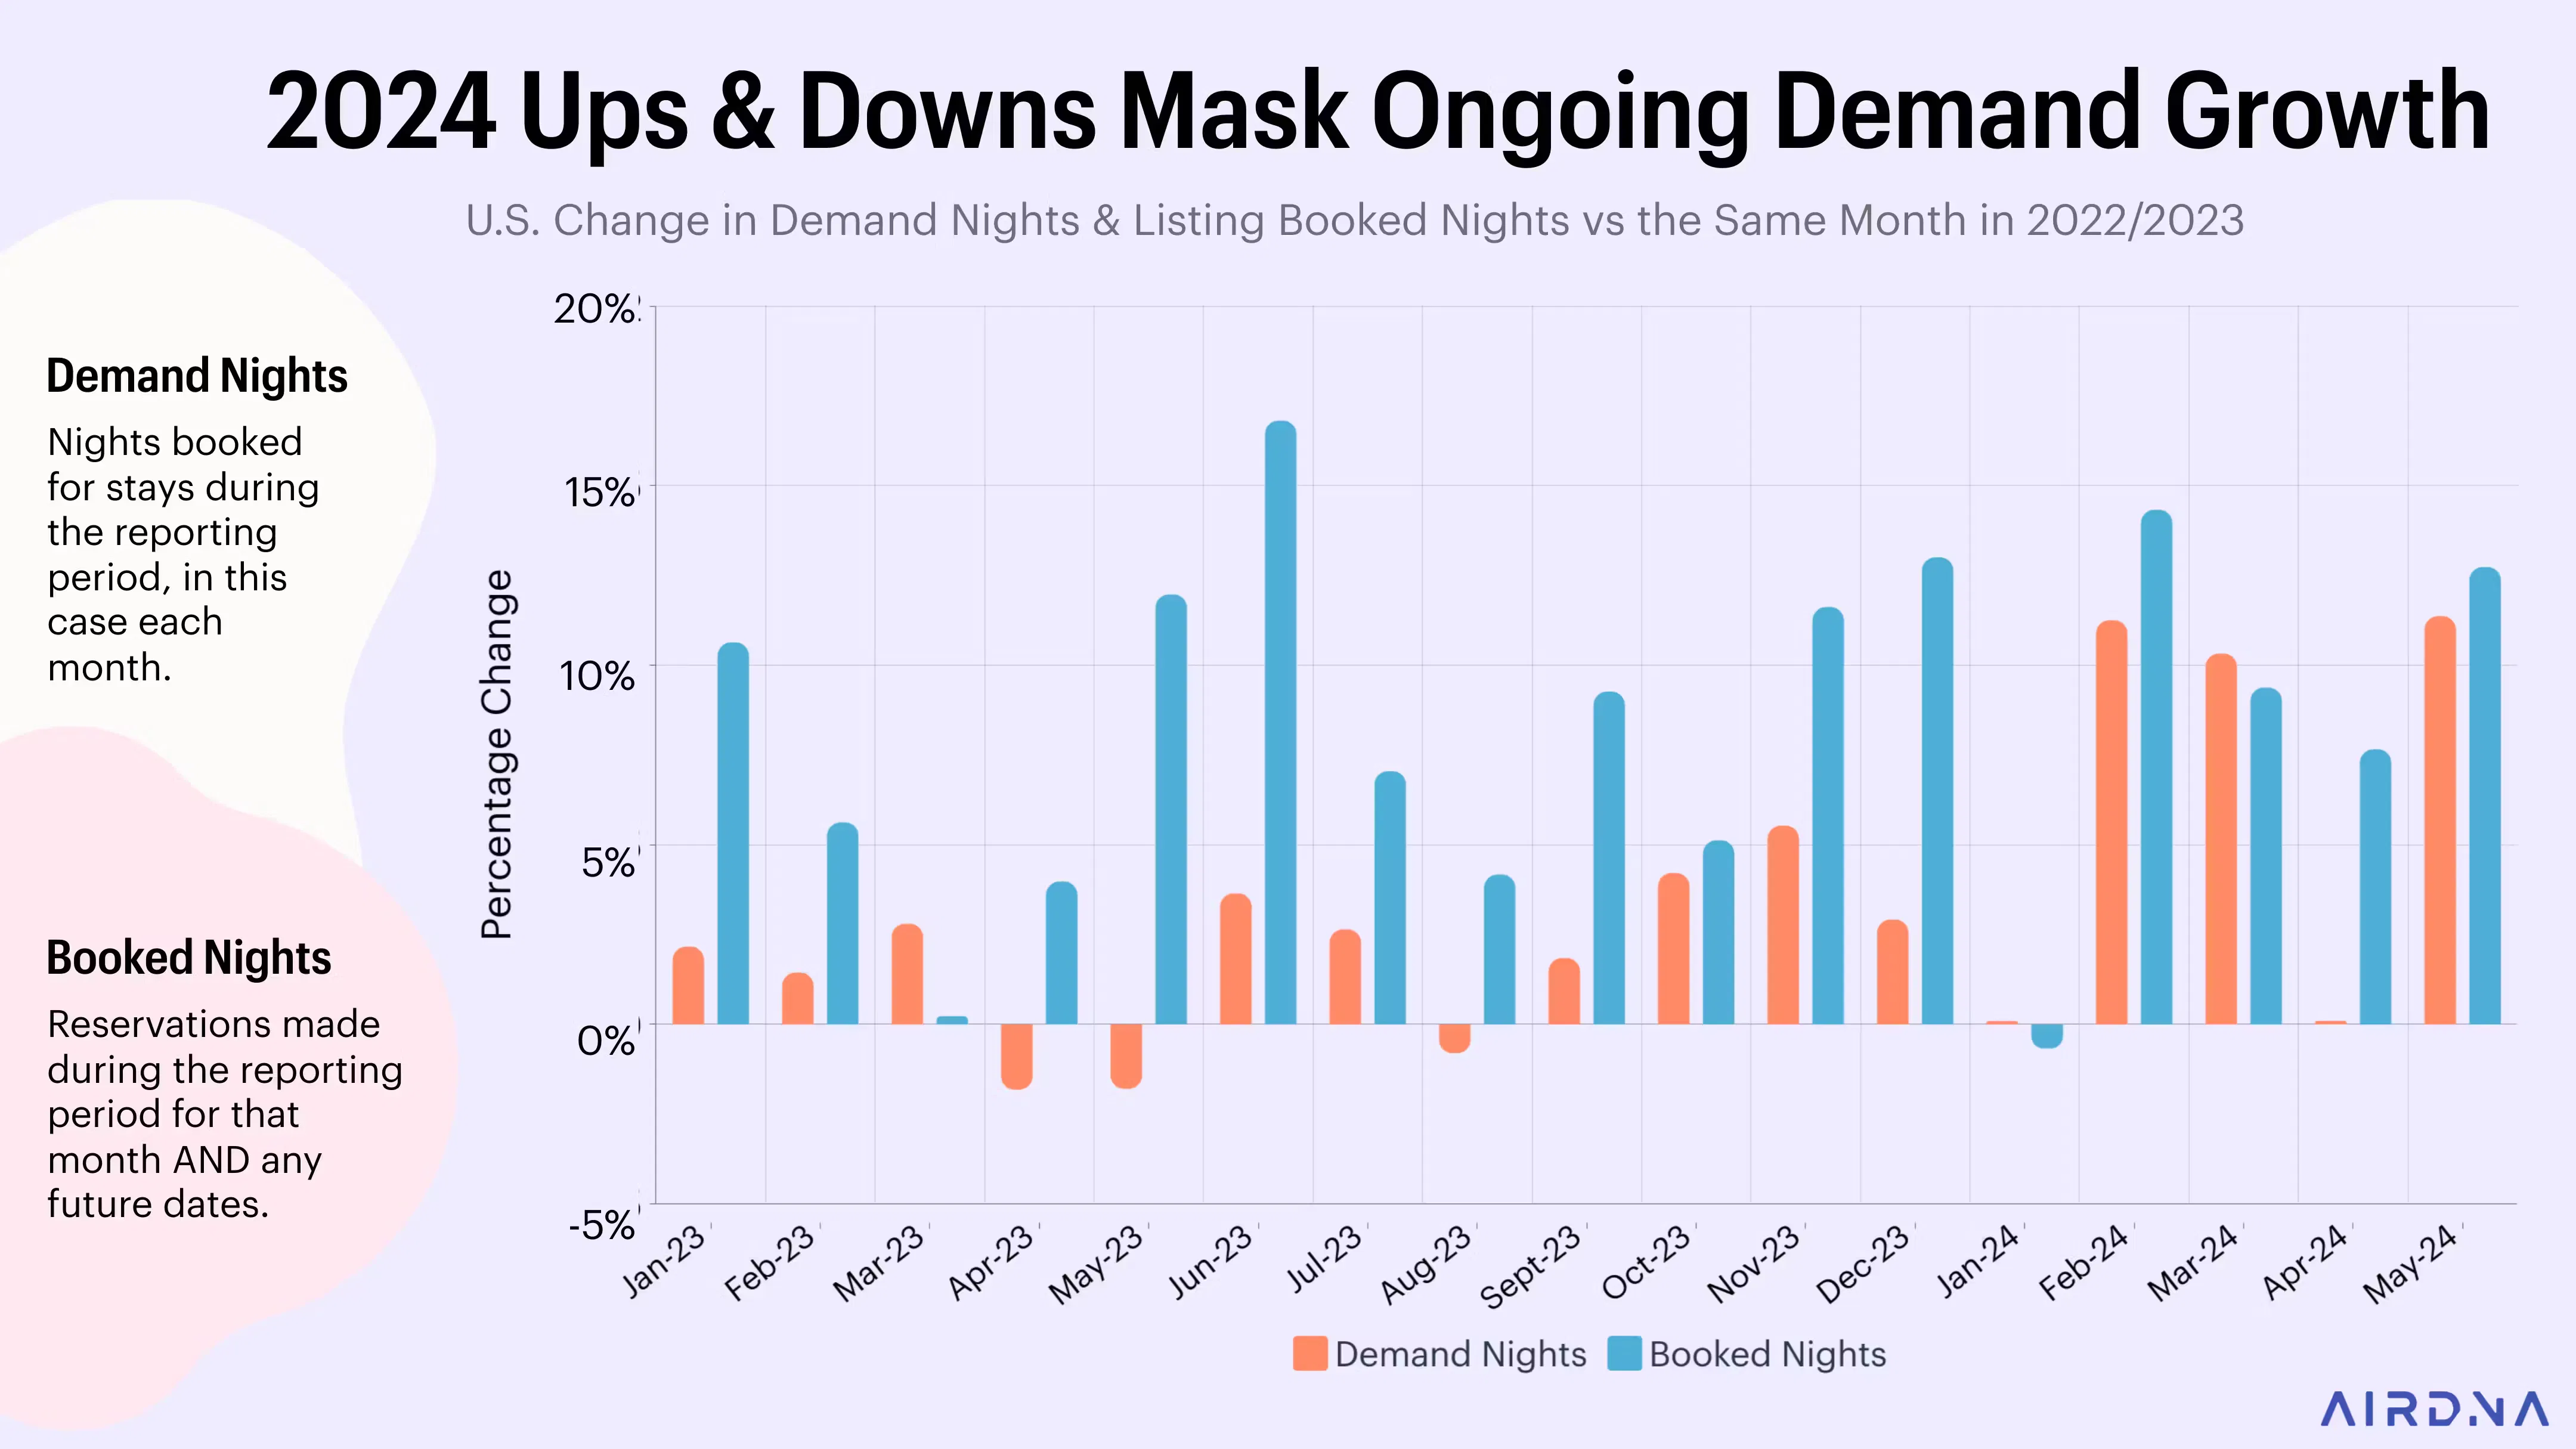
The first five months of the year typically make up the off-season, so small changes in the number of demand nights can result in large percentage changes. As we move into peak season, however, demand growth will level out. The average annual growth rate will be 5.9% year-over-year.
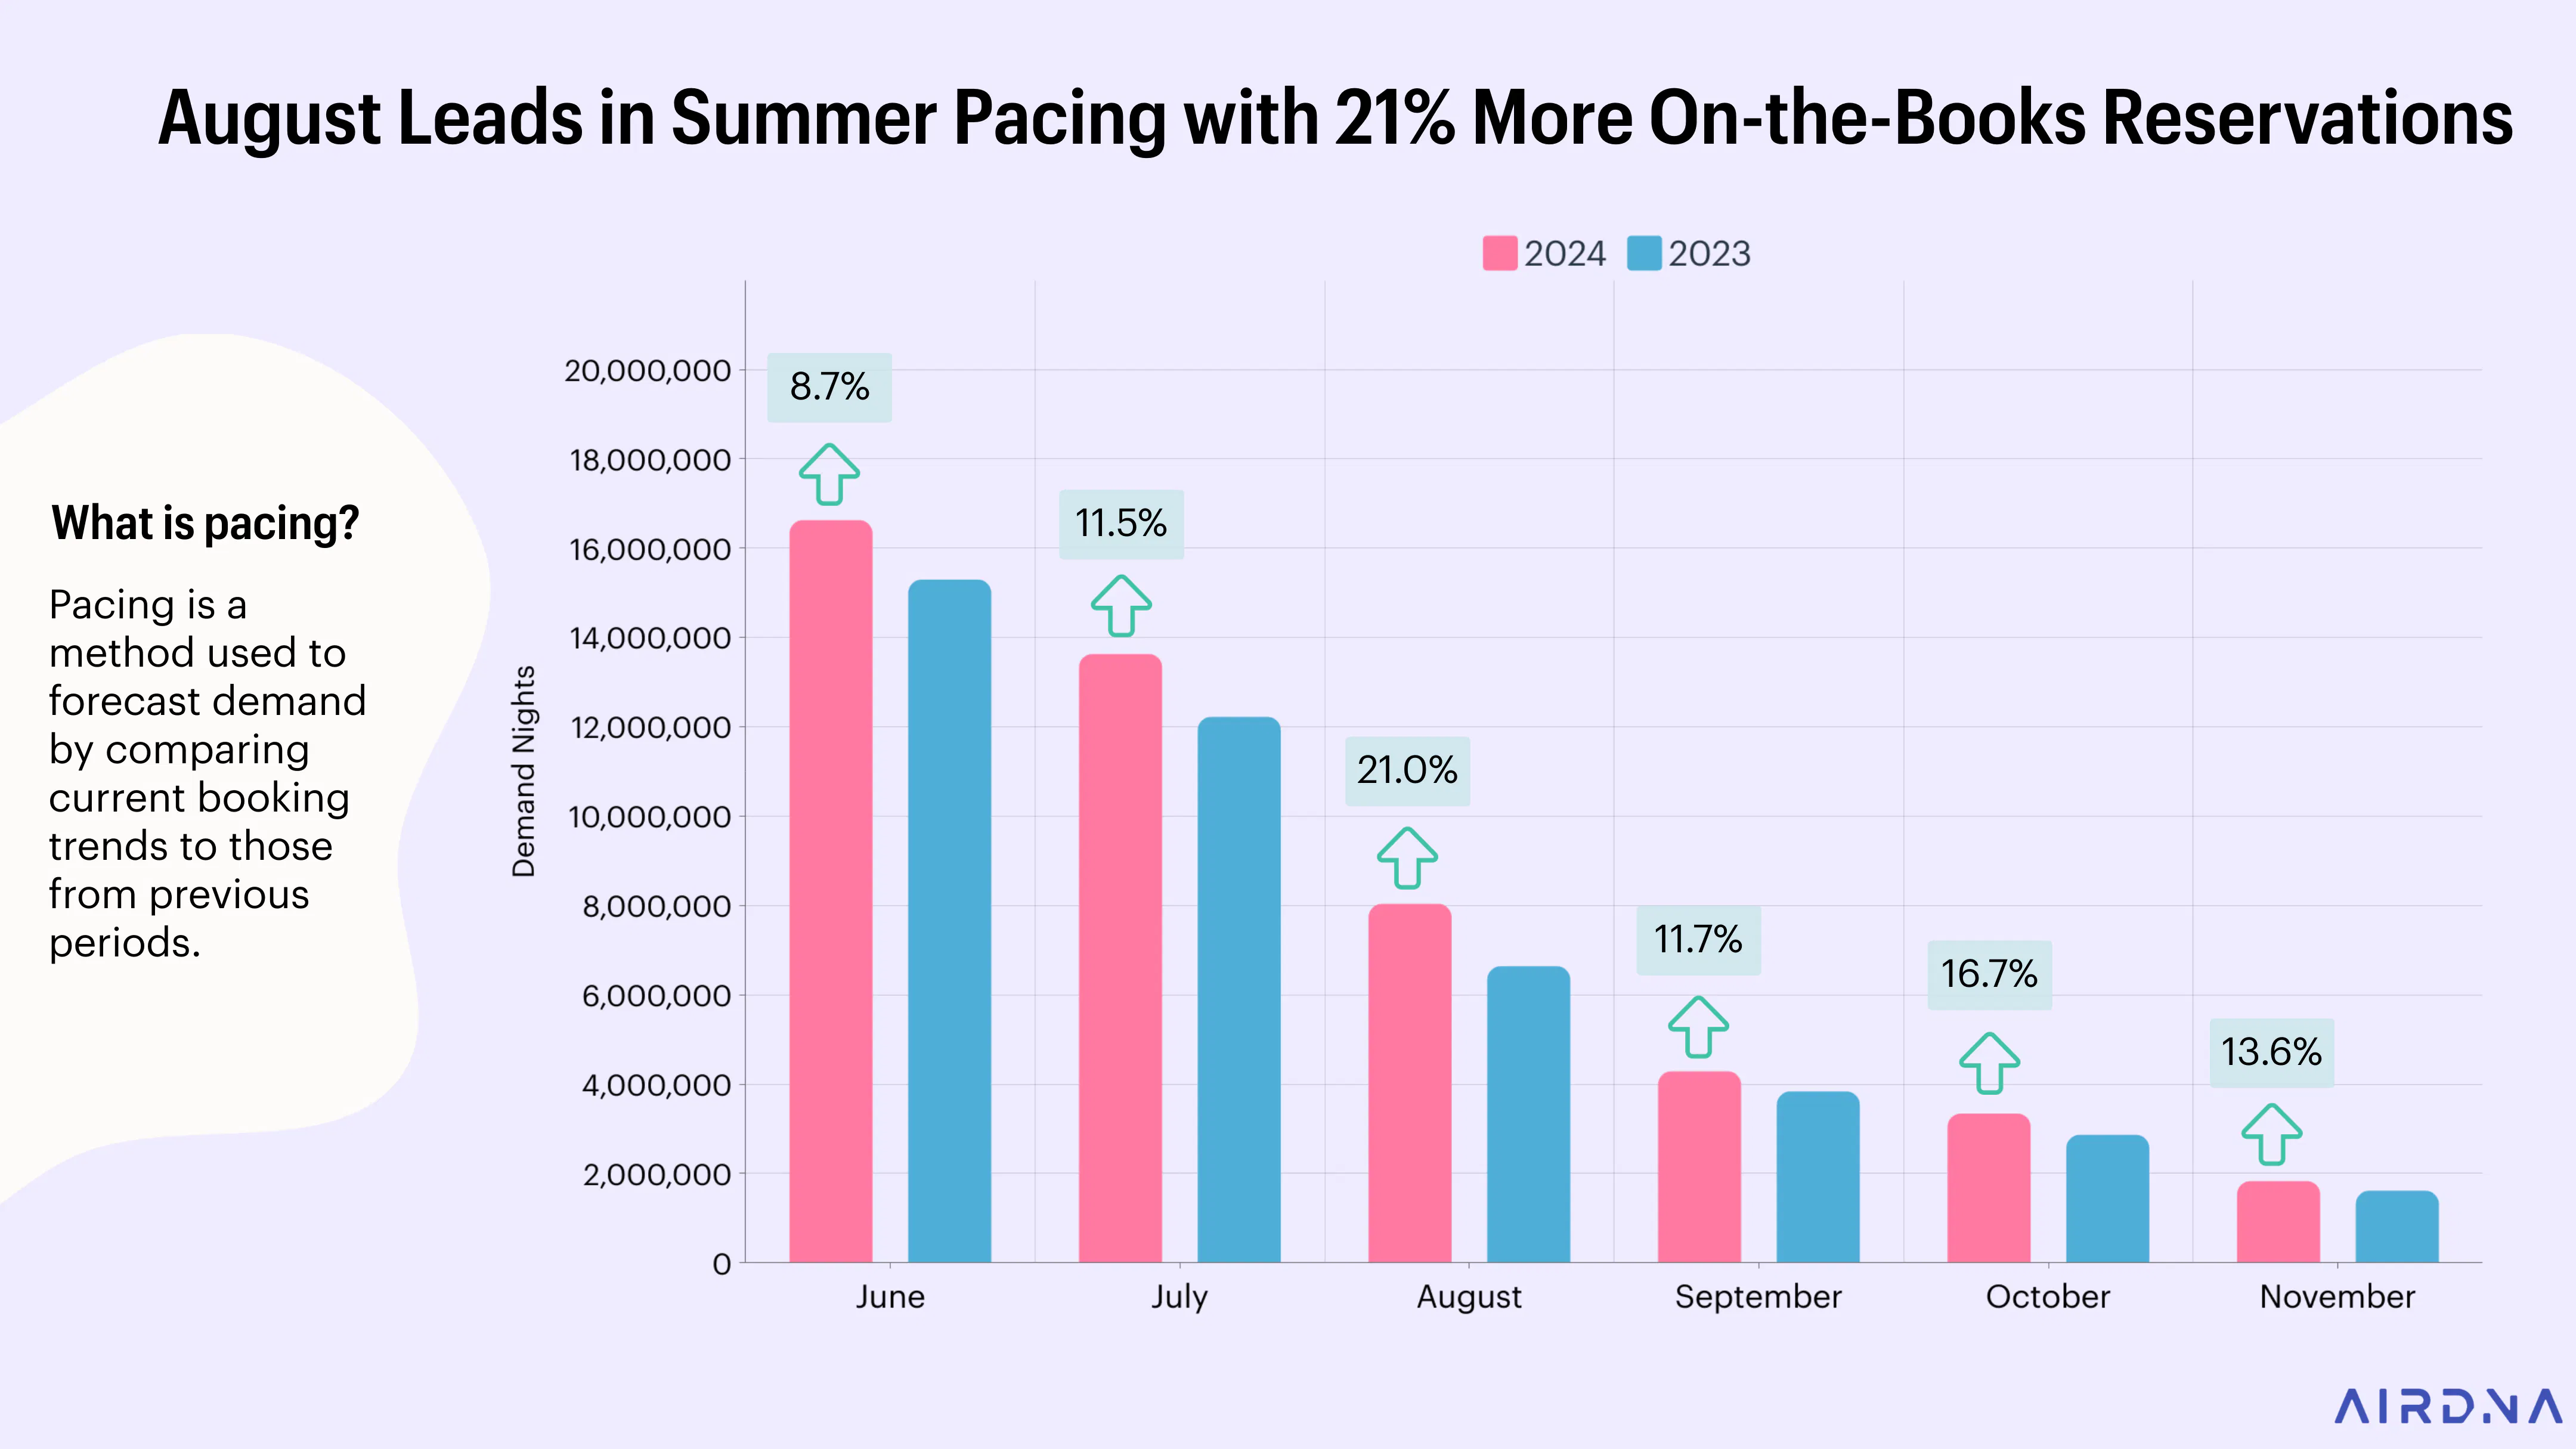
Pacing is a method used to forecast demand by comparing current booking trends to those from previous periods. It’s conventionally been an important part of demand forecasting. However, forecasting demand has become more difficult in recent years due to booking lead times that never recovered their pre-covid levels.
In 2019 and 2018, the median lead time was just over 40 days on average. During the initial COVID-19 outbreak, guests were booking much closer to their check-in date—just 23 days in advance. The highest average lead time post-COVID was about 35 days in June 2022. By May 2024, however, median lead times had decreased to fewer than 30 days. This shortened lead time makes it harder to predict future demand accurately.
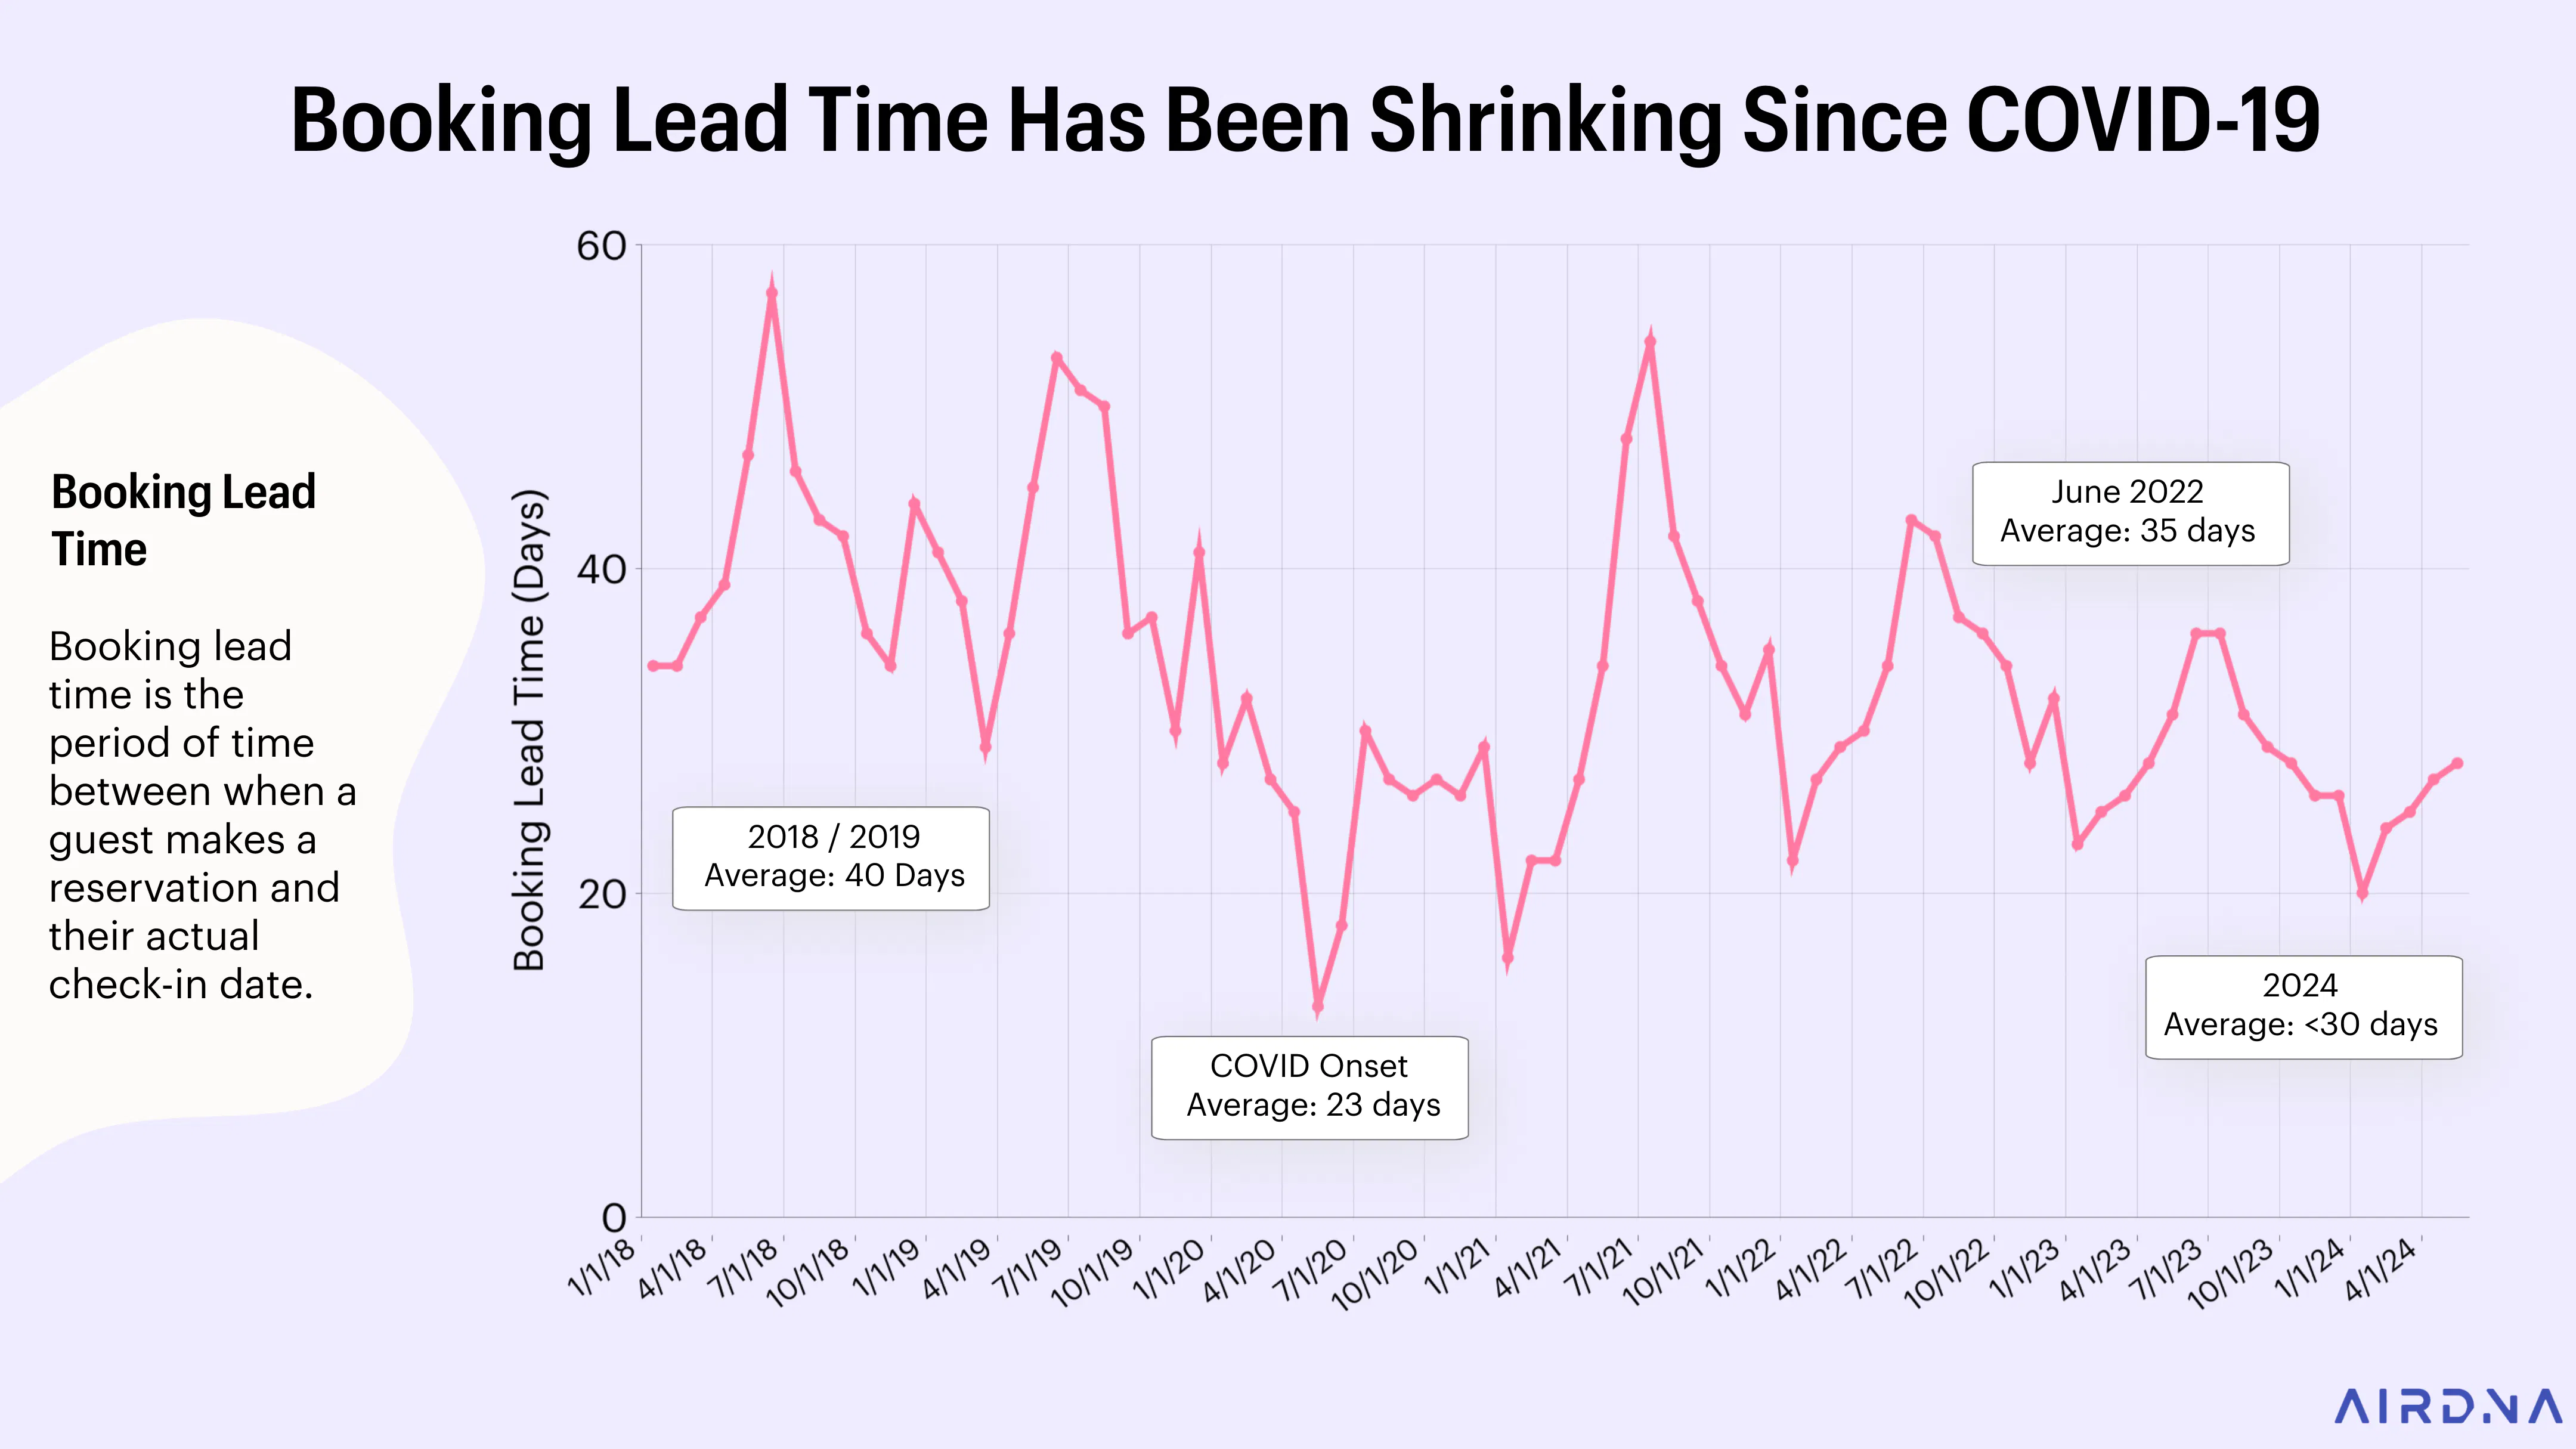
Shorter lead times mean there is less early data available, making pacing data harder to interpret. Nevertheless, the outlook for summer is positive, with on-the-books demand 9-15% higher than this time last year. August shows particularly strong growth due to Labor Day weekend falling in August this year instead of September.
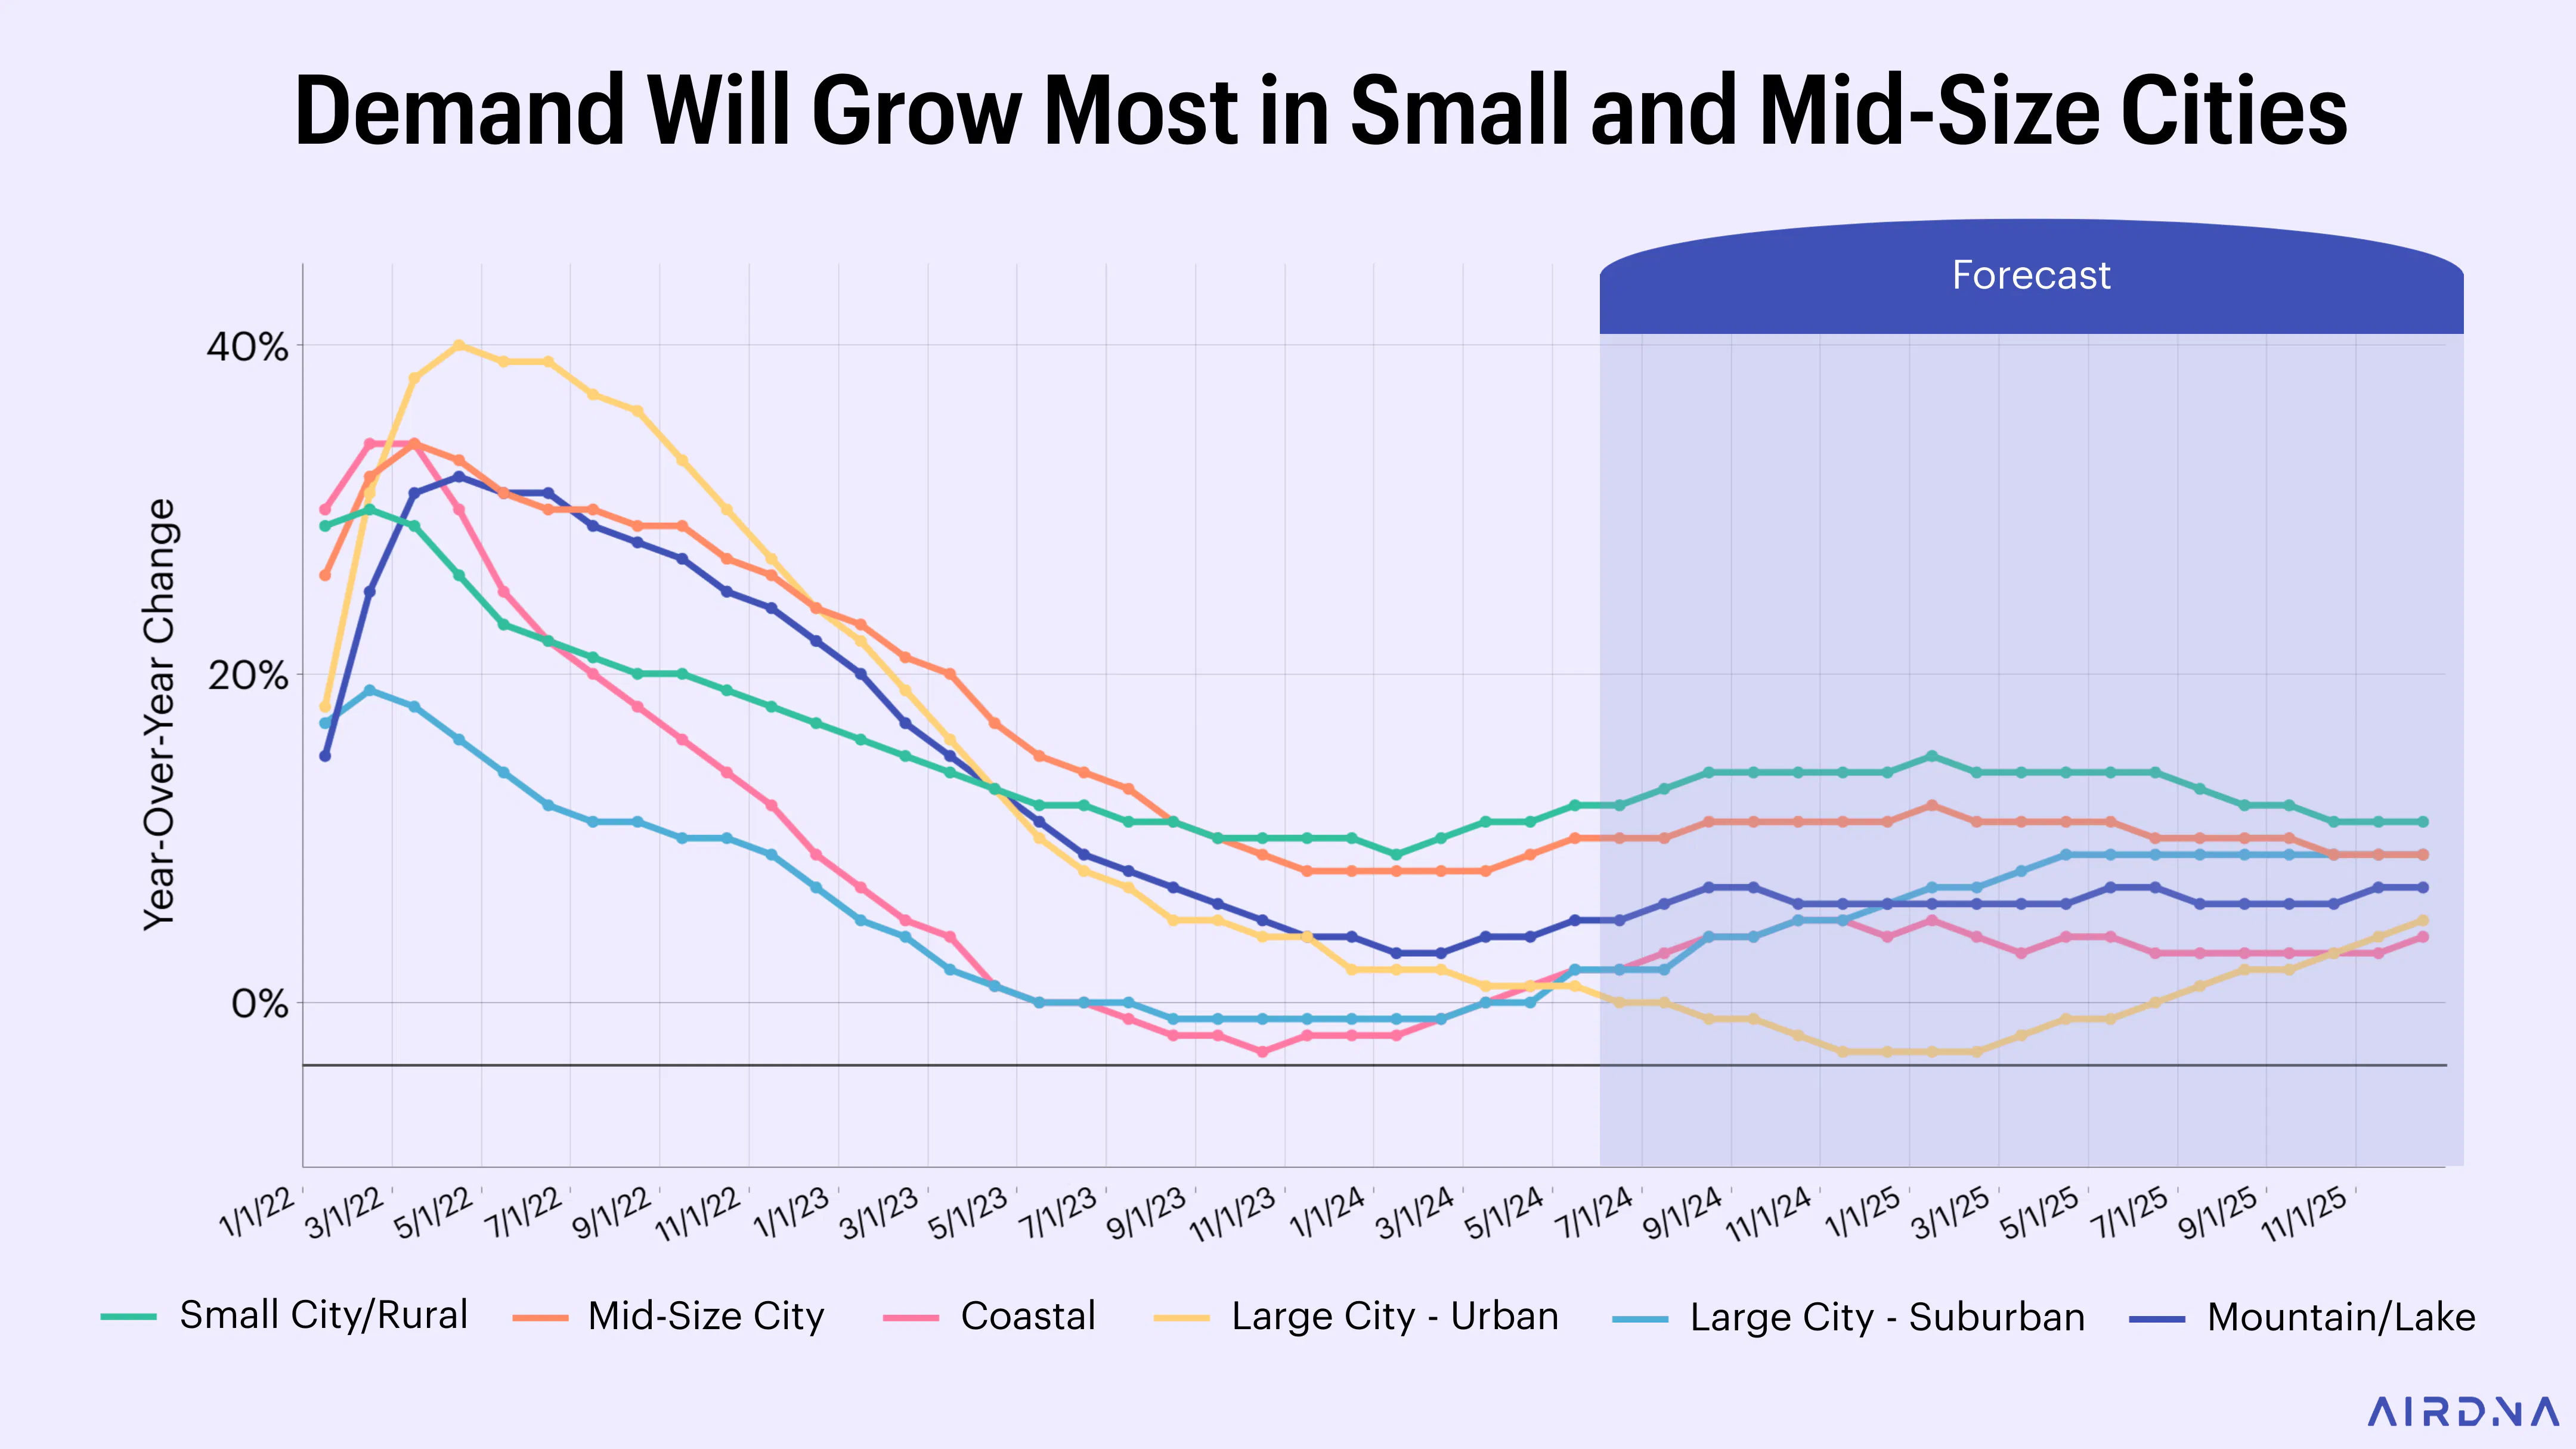
Most locations have already seen their lowest point in demand growth. For the rest of 2024 and into 2025, demand in these areas will either improve or stay steady. Resort locations recovered the quickest and were the first to hit their low point in demand growth. In contrast, urban locations have been slower to recover because of stricter regulations and will continue to struggle through the rest of 2024. Small cities, rural areas, and mid-size cities hit their low point shortly after resort locations and are already improving. We expect these location types to continue leading in demand growth through 2025.
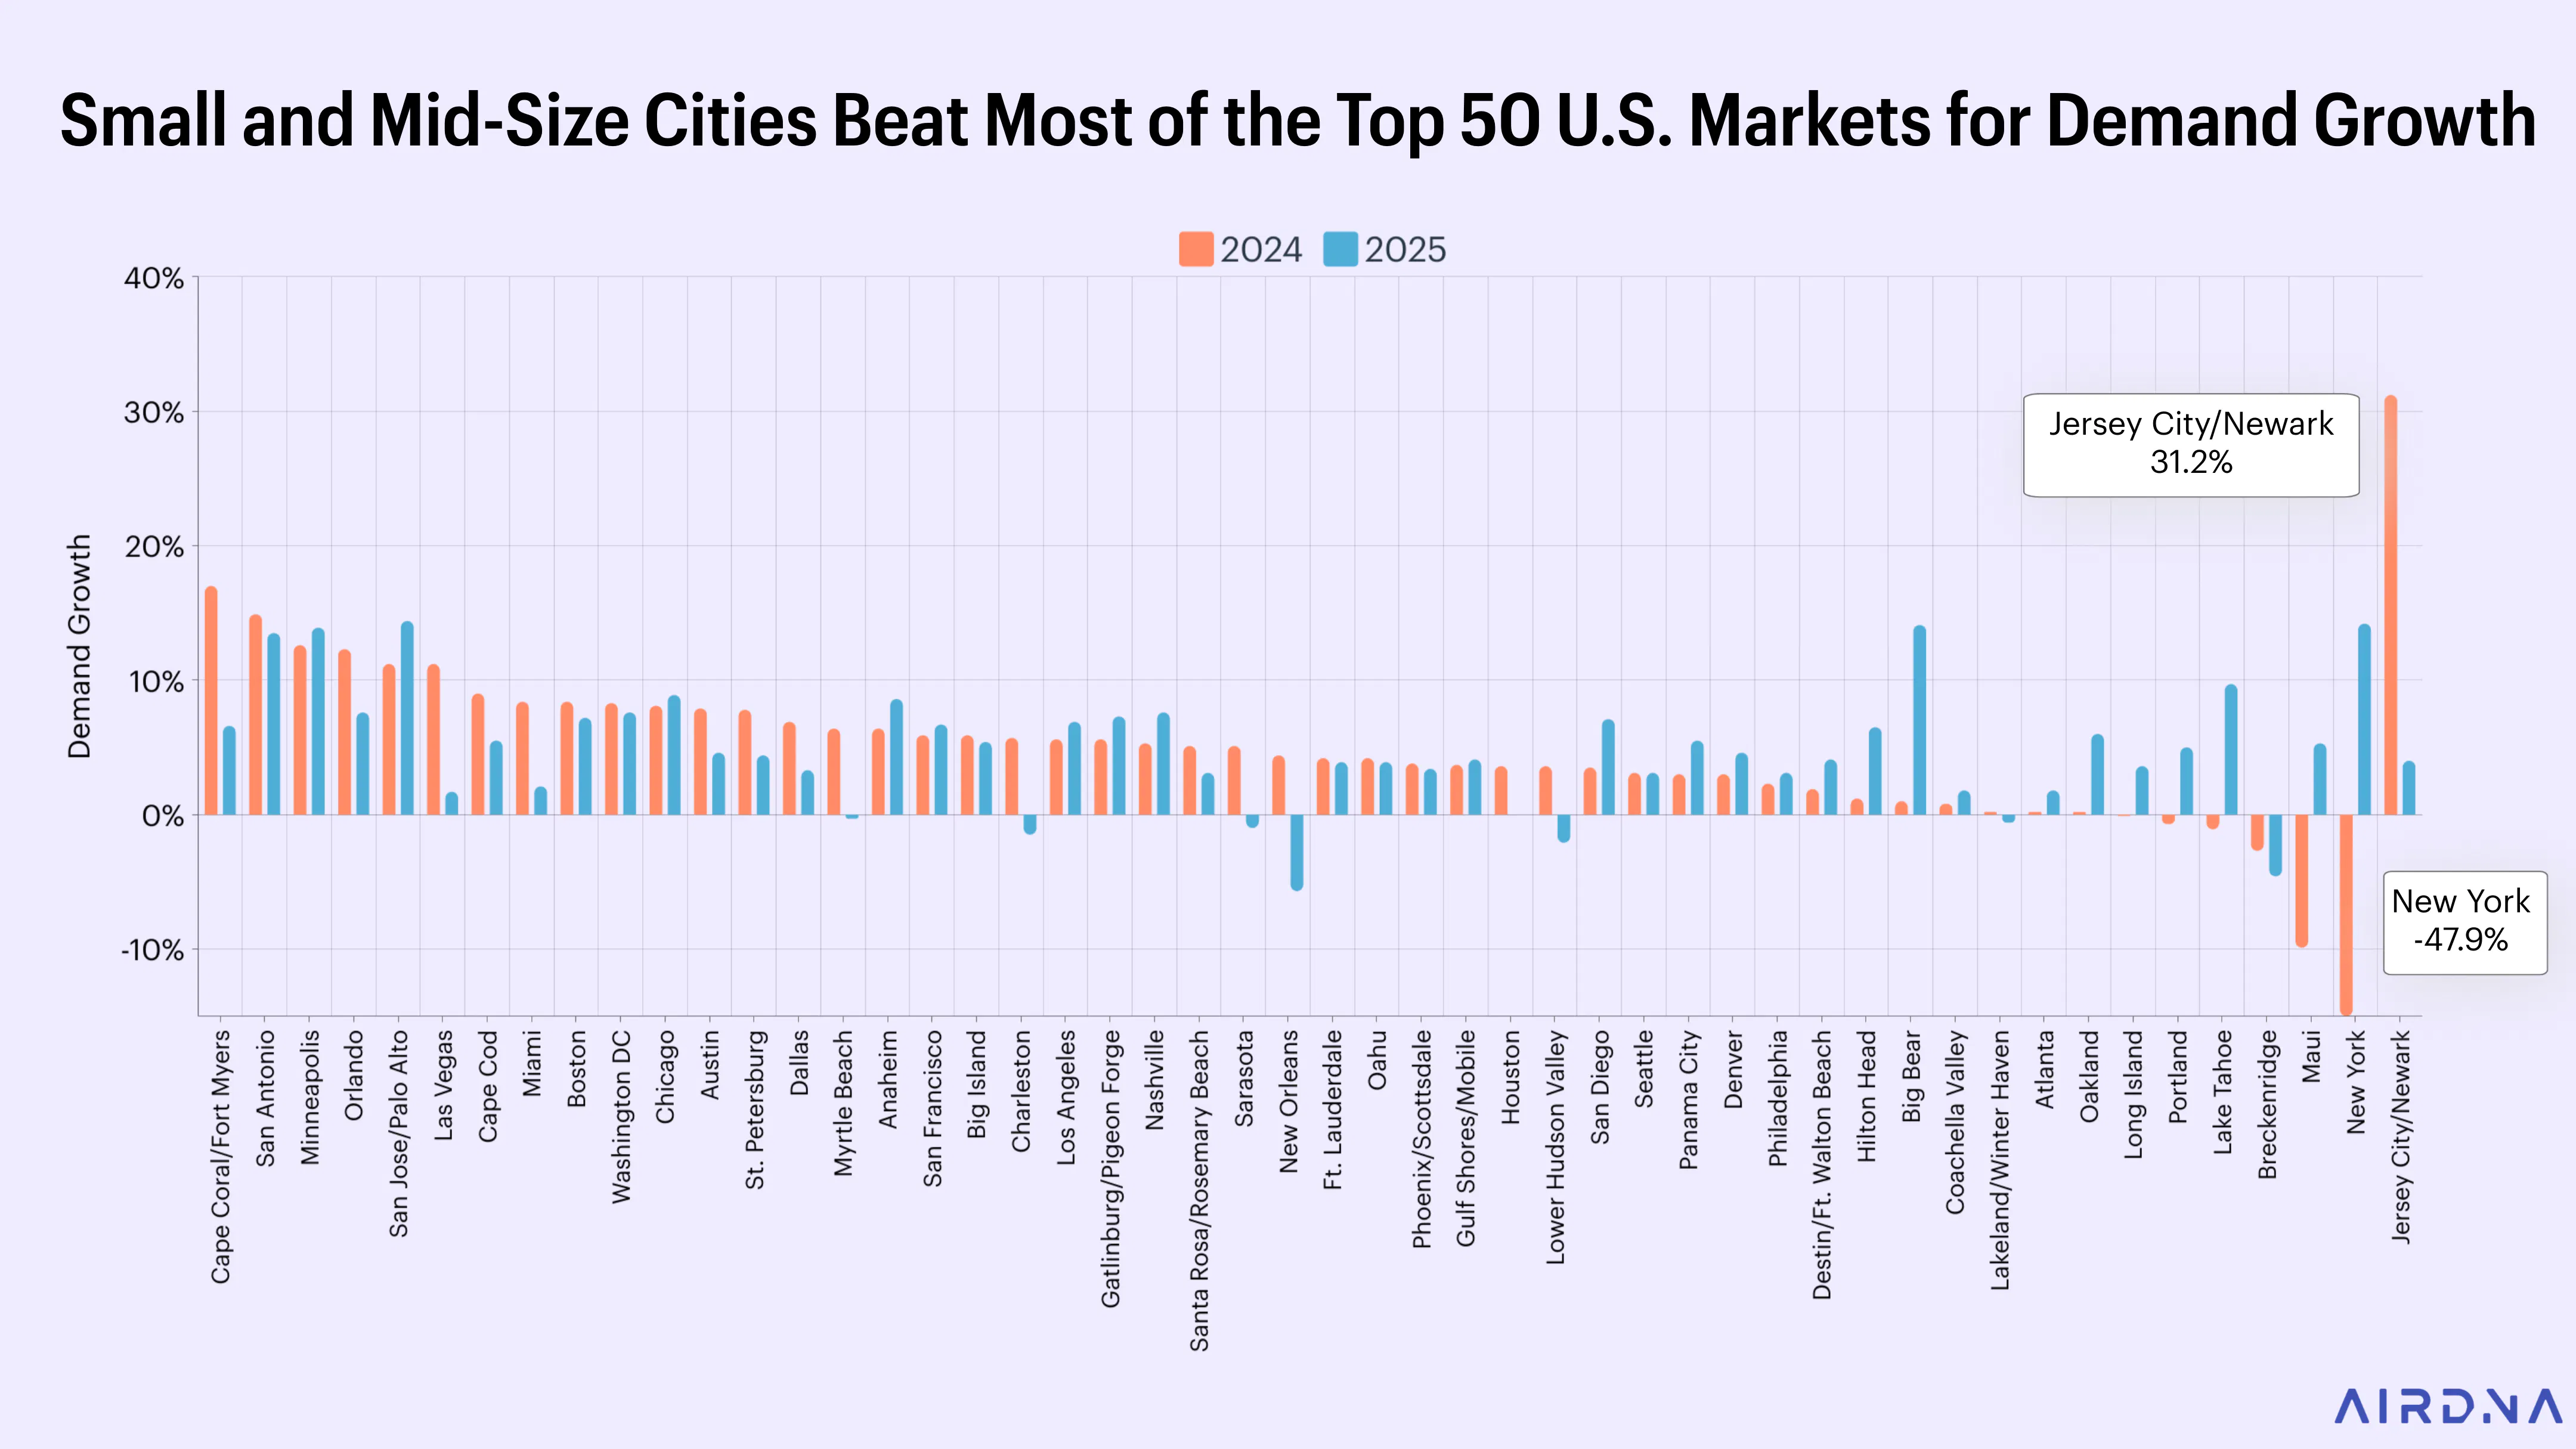
Market demand for the top 50 U.S. markets is led by a diverse group of cities and locations. Predictably, small city/rural locations and mid-size cities have faster demand growth than many of the top 50 markets. Almost all U.S. regions are represented in this growth.
Jersey City and Newark in the Northeast have seen a 31.2% increase in demand in 2024 due to stricter regulations in neighboring New York City that eliminated many short-term rentals. However, this growth is not expected to continue at the same rate in 2025.
On the other hand, San Antonio has a 14.9% increase in demand in 2024 and is on track to continue that growth into 2025. Sant Antonio benefits from strong population growth in Texas and other Sunbelt cities from which its travelers originate.
Minneapolis and Orlando also show strong demand growth, with increases of 12.6% and 12.3% in 2024, respectively.
Occupancy and Rates
Slowing supply growth and increasing demand have ended a trend that started in 2021: rapidly shrinking occupancy rates from the highs of that year. This decline has almost stopped, and we expect it to slowly reverse in the coming years, though very gradually. High interest rates have slowed supply, but we expect the Fed to cut rates before the end of the year and continue doing so until they've balanced inflation control and labor market strength. Supply growth will slow gradually for the rest of 2024 and 2025.
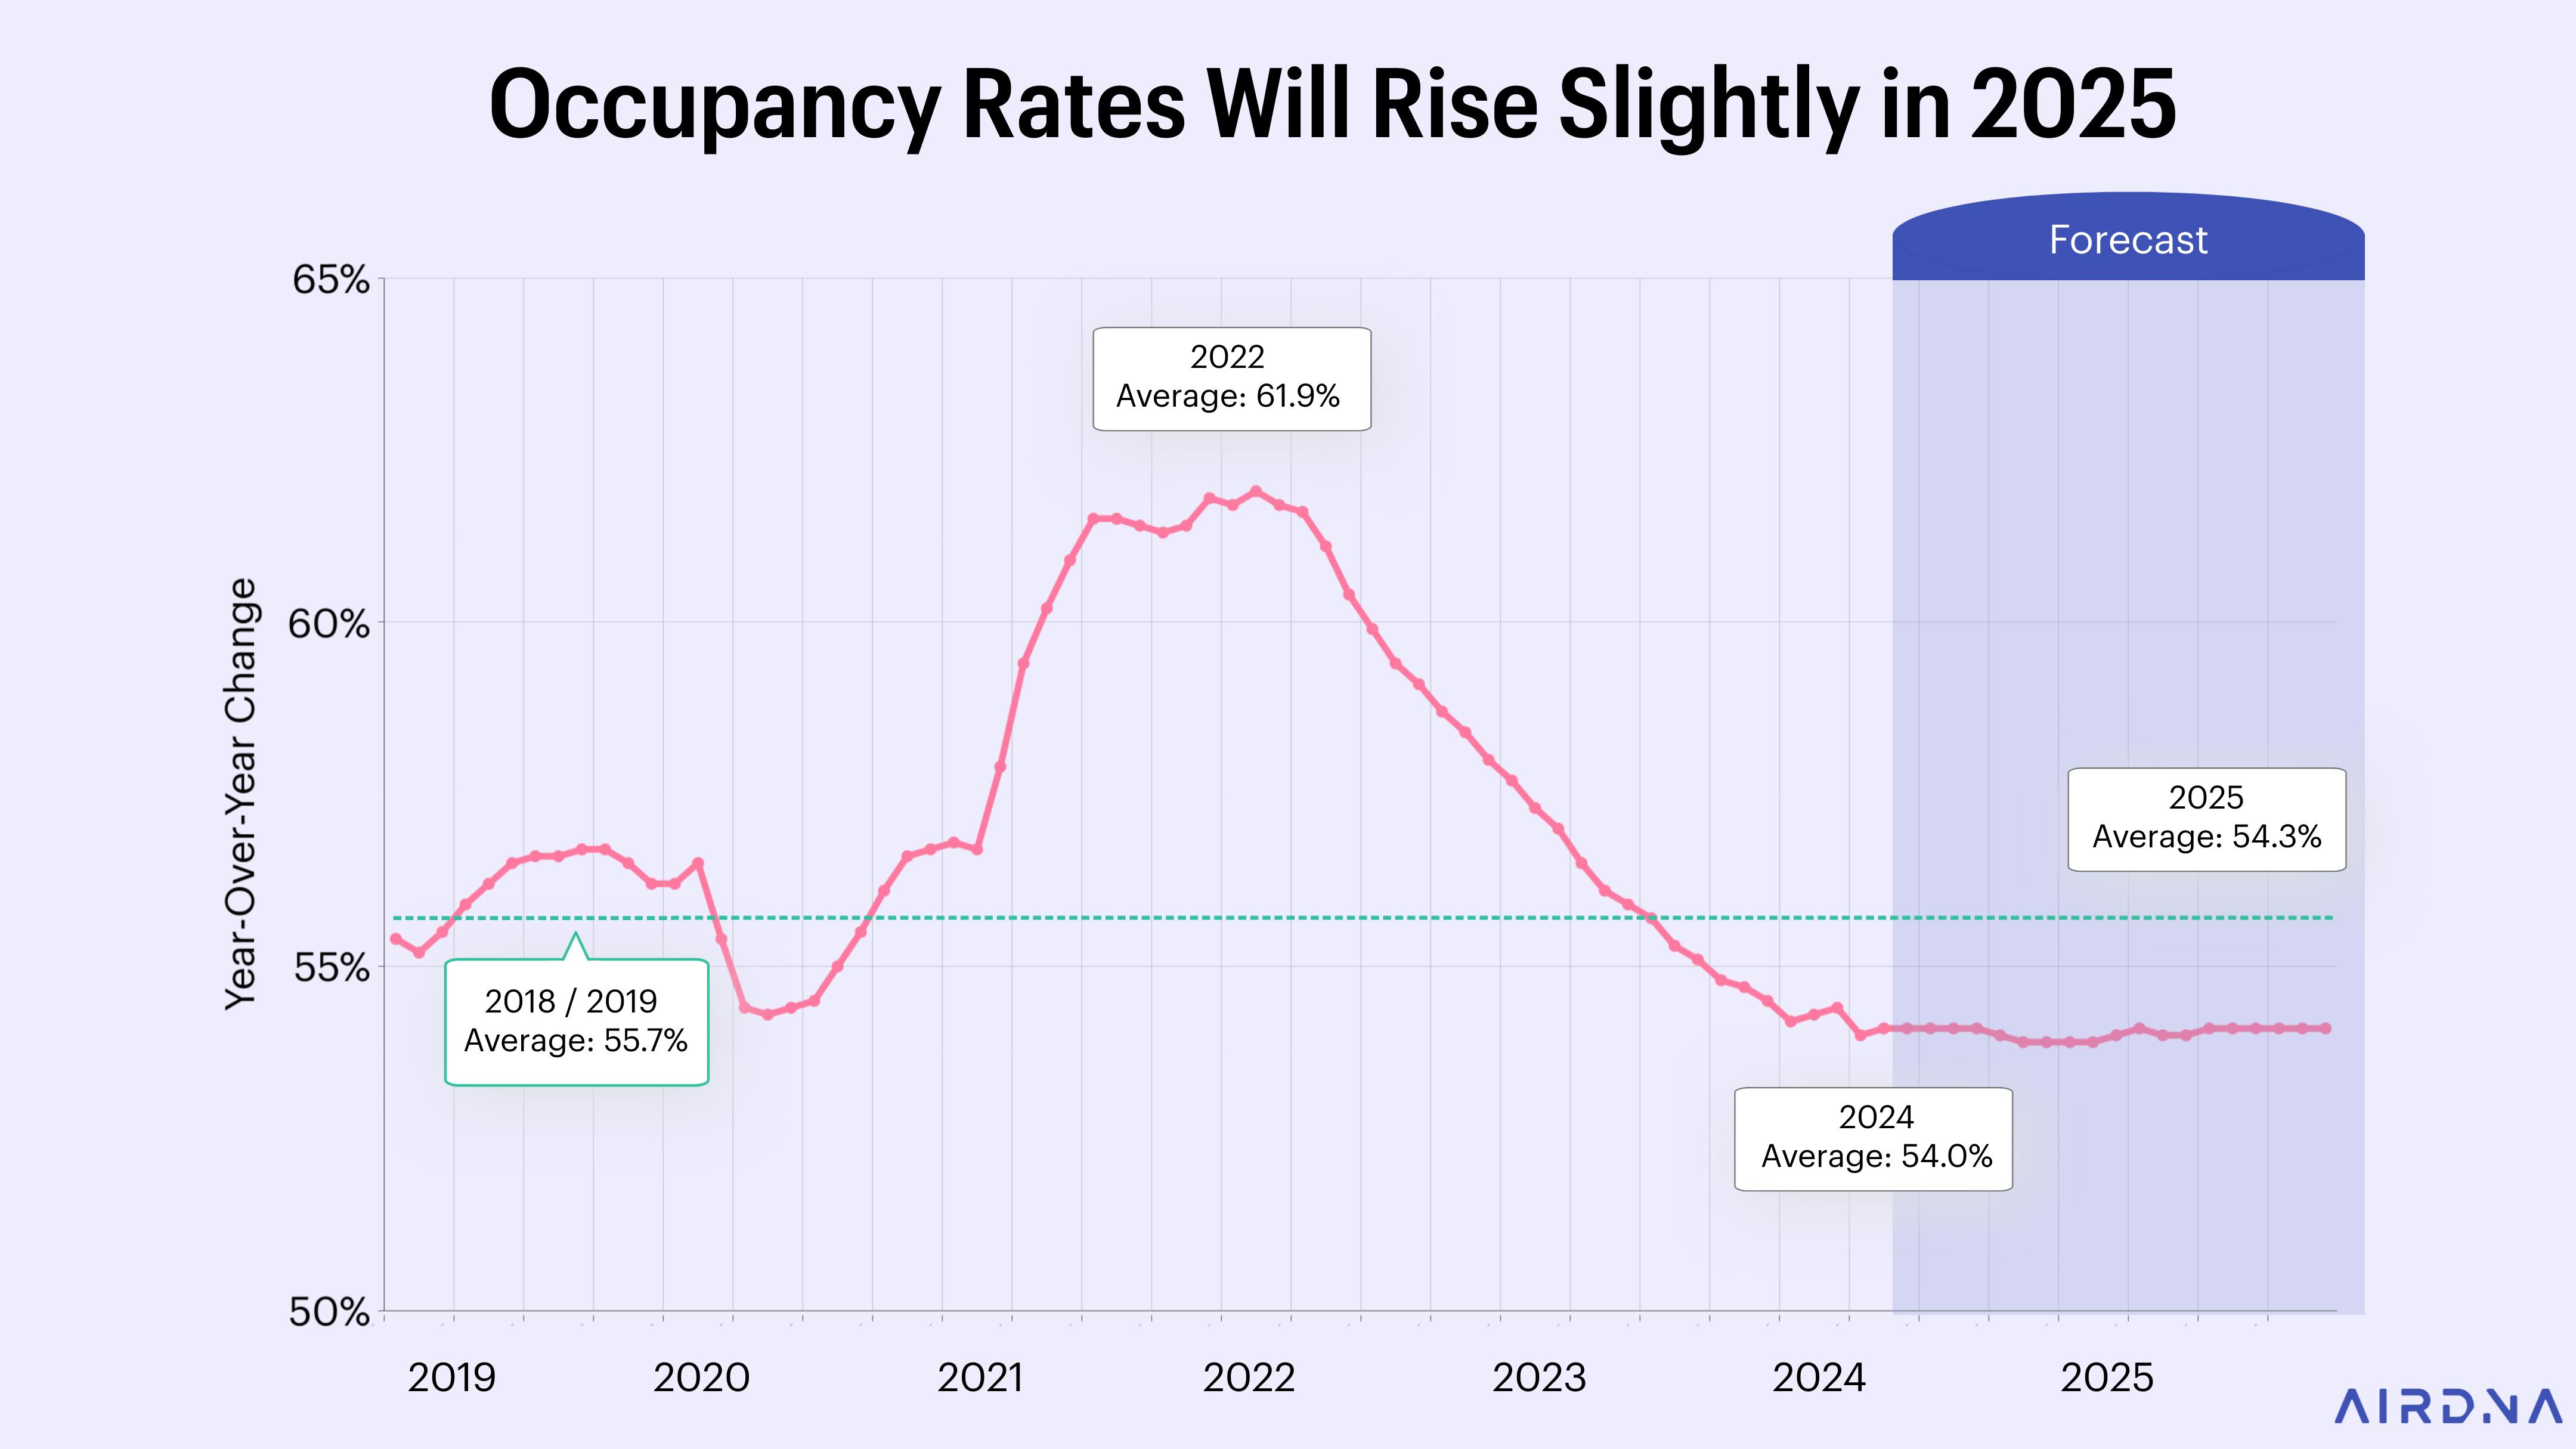
When financial markets stabilize, there may be a period of attrition, which means a reduction in the number of available rentals as some hosts leave the market. This could affect occupancy rates. However, we currently expect occupancy to stabilize at a rate slightly below pre-pandemic levels. The end of falling occupancy will give hosts more pricing power.
In 2023, tight budgets and economic anxieties impacted how hosts chose to price their rentals. The AirDNA Repeat Rent Index (RRI), which tracks the price changes of existing rentals, showed flat or minimal growth between April and December 2023. This means that prices for existing properties barely changed. ADR growth was lower, ranging between -2% and -4% during the same period. This means that new listings in 2023 generally had lower rates than existing supply, indicating hosts were trying to attract budget-conscious travelers. It’s possible that lower prices were even an attempt to undercut existing rentals.
In 2024, there is a growing sense of optimism about the economy. Inflation has dropped to nearly a third of its peak, and talk of a recession has mostly disappeared among economists. With supply growth slowing, occupancy rates have stabilized, giving hosts more pricing power.
Together, these conditions spurred a simultaneous uplift in growth rates for both ADR and RRI at the beginning of 2024. This positive trend has continued through May and is expected to continue through 2025.
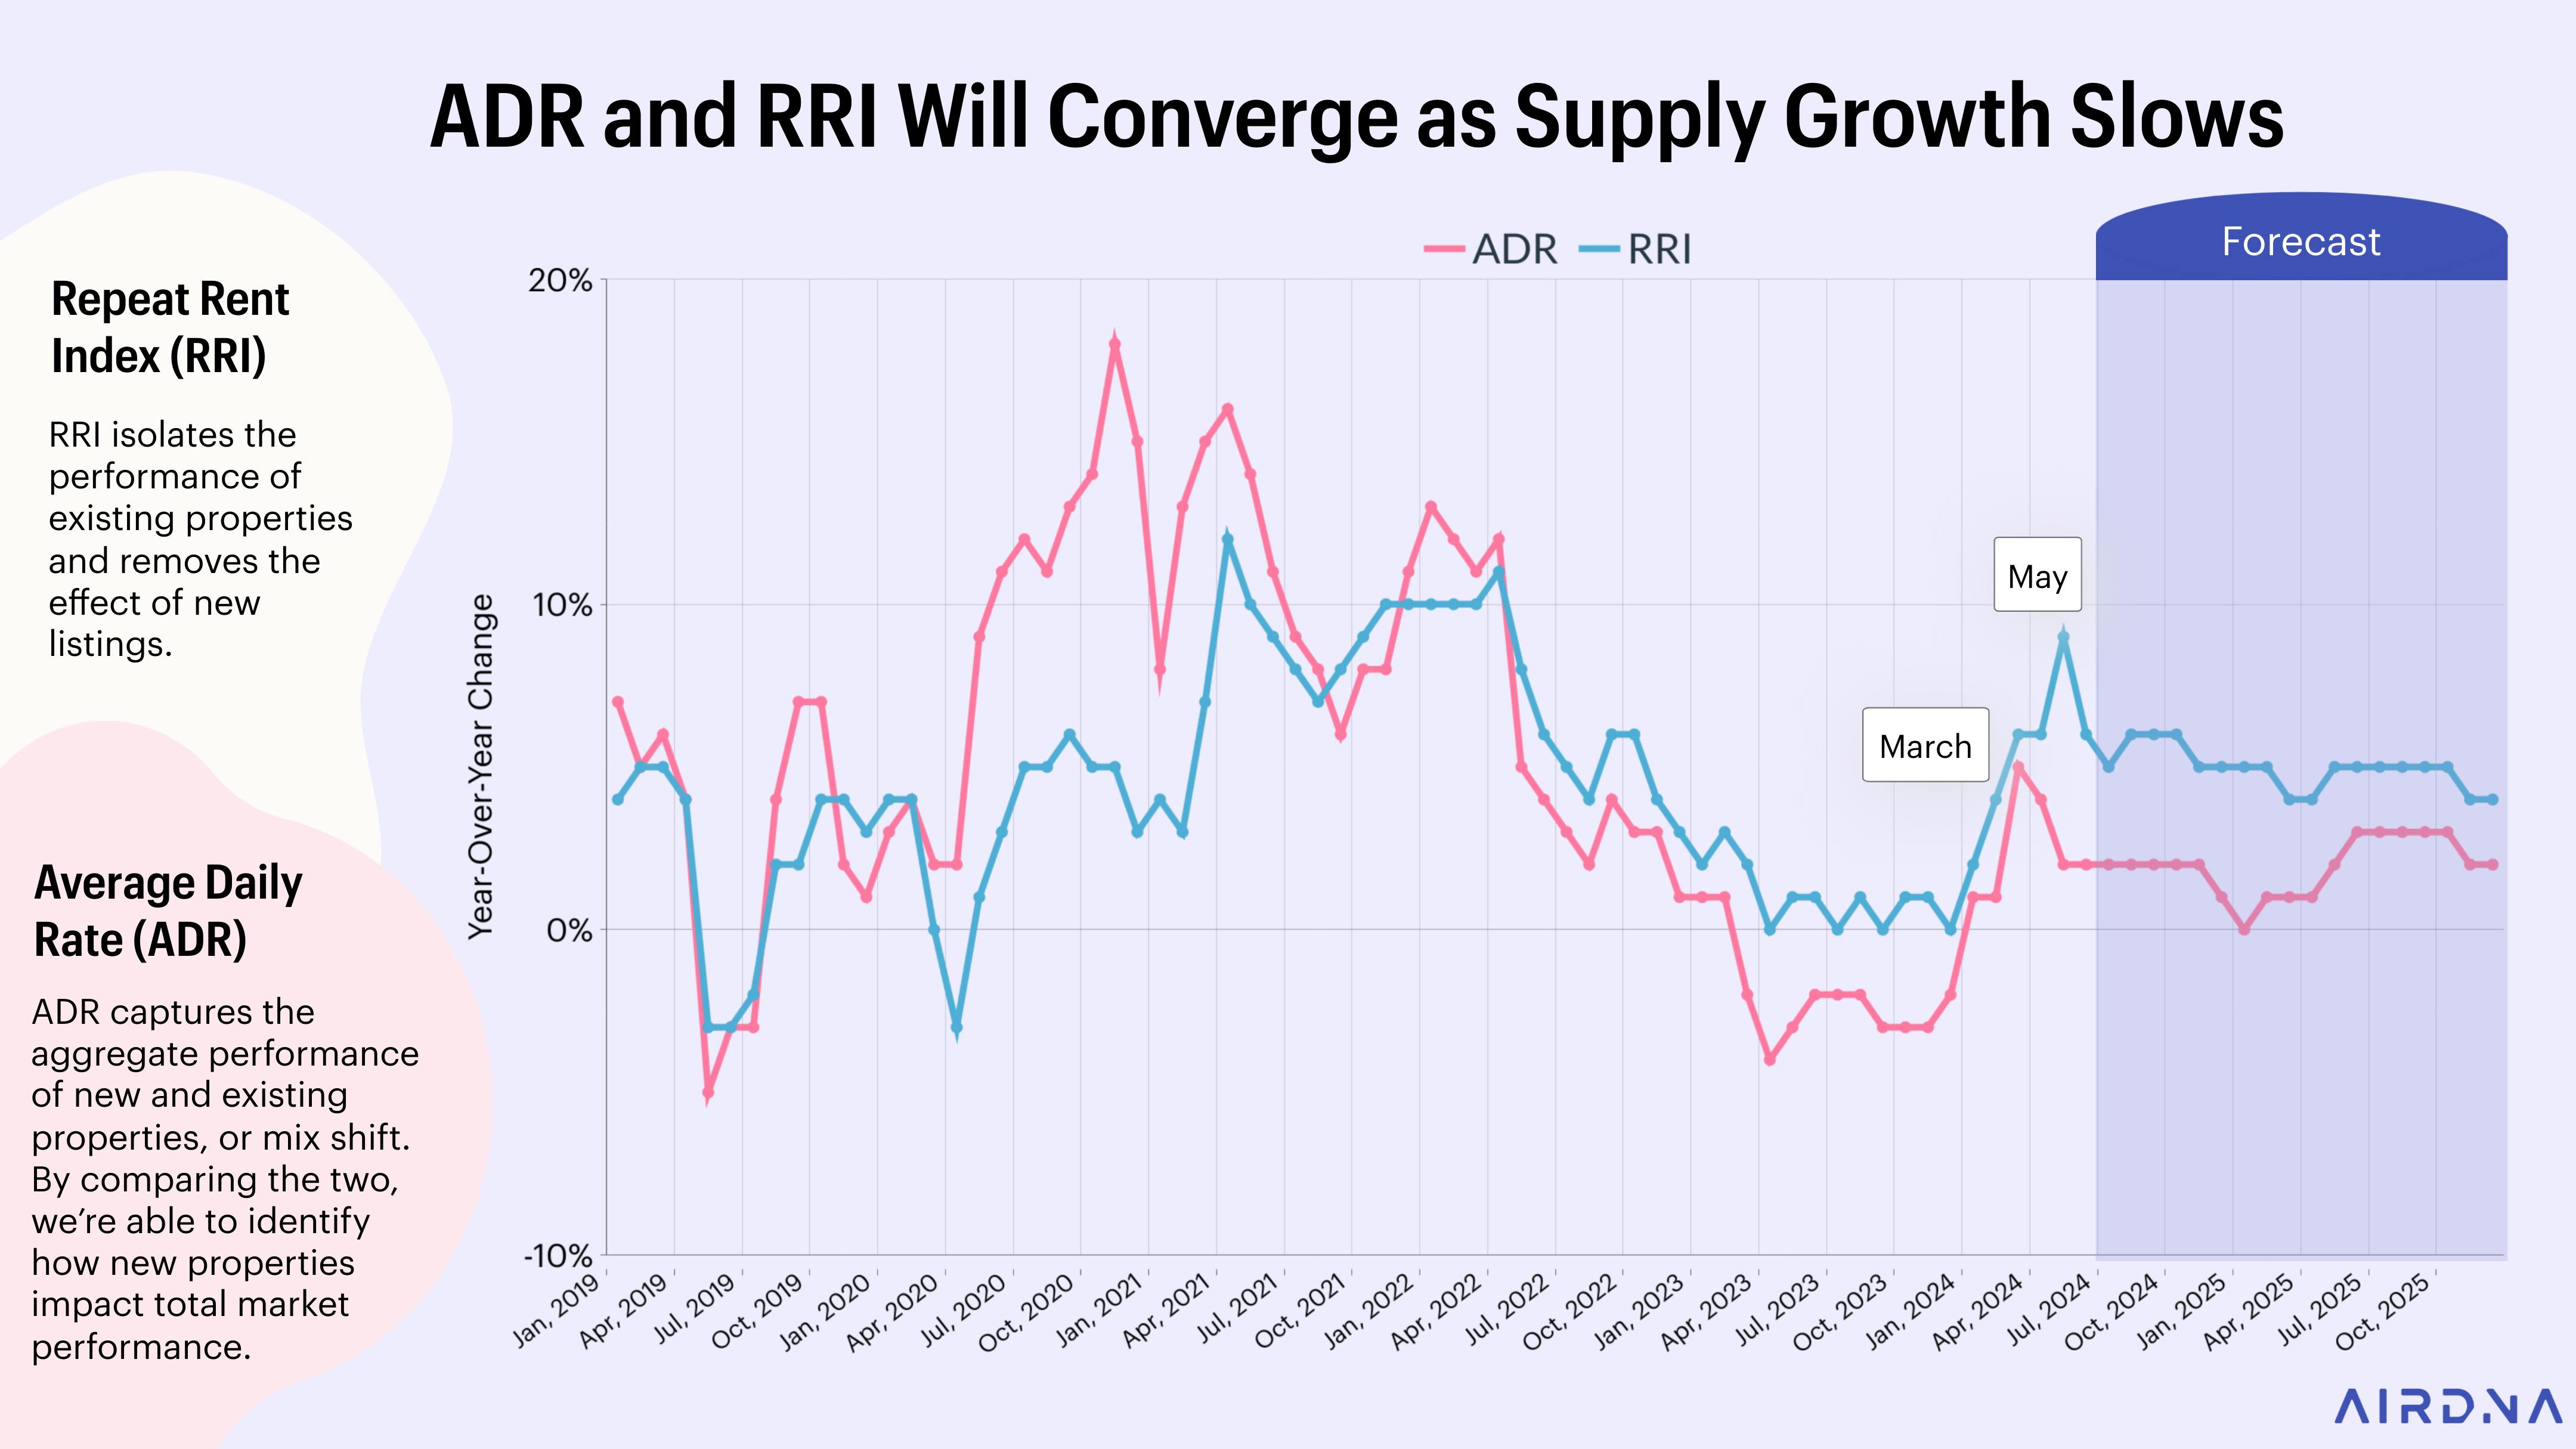
Average Daily Rates (ADR) and the Repeat Rent Index (RRI) briefly converged in March, which indicates that the mix shift had little impact on ADR during the Easter shift to March. Additional spring break demand allowed existing hosts to raise prices.
On the other hand, the two rate series diverged again in May at the start of the summer travel season. RRI spiked, showing that hosts were able to raise rates even as considerably lower-priced new properties entered the market. We expect these two measures to start aligning as supply growth slows and new listings start to resemble the existing properties in the U.S. STR market.
ARTICLE SUMMARY
AirDNA’s economists explore trends in the STR market for 2024 and 2025. The forecast is positive as the market begins to stabilize with rising demand and improving occupancy rates.
Jamie Lane
AirDNA Chief Economist
He is responsible for data analysis, thought leadership, and leveraging advanced analytical techniques to provide new insights into short-term rental market trends. Native to Atlanta and an Airbnb host himself, Jamie enjoys cycling, mountain biking, backpacking, running, and playing in a dart league in his free time.