

 Calculate Revenue
 Research Markets
 Find For Sale Properties
 Compare My Listing
 STR Revenue Calculator
 Custom Comp Sets
 Submarket Insights
 Custom Search Filters
 Rate Recommendations
 Performance Benchmarking
 Competitor Comparison
 Owner Contact Details
 Property-level performance data
 Tourism Insights
 Real Estate Investment Analytics
 About Us
 Sales
Sales Support
 Press
PressU.S. Market Review: May Demand Surges and Supply Slows. Is Occupancy on the Mend?
Published: June 24, 2024
Last updated: February 24, 2025

Bram Gallagher
Key Takeaways
- May saw an 11.4% increase in demand and a 3.1% rise in occupancy, signaling strong recovery and growth in the short-term rental market.
- Coastal and rural locations are thriving with high demand, while urban areas face declines due to high interest rates and stricter regulations.
- Summer bookings, particularly beach reservations for July 4th, are seeing substantial growth.
Demand for short-term rentals in May jumped by 11.4% compared to the same time last year, marking the biggest increase since June 2022. This is great news after a rollercoaster start to 2024, which had some dramatic performance swings. January struggled due to a cold snap and low snowpack, but things picked up in February.
The change in Easter’s timing (and many Spring Breaks) boosted March’s numbers, though it hurt April's performance. Overall, the first four months of 2024 were 5.4% higher than the same period in 2023. With May’s increase, the year-to-date performance is now 6.8% higher than last year.
While demand was booming, the Federal Reserve's rapid interest rate hikes to control inflation created major obstacles for new investments, slowing down supply growth. In May, available listings increased by just 7.2%, marking the slowest growth in listings since July 2021.
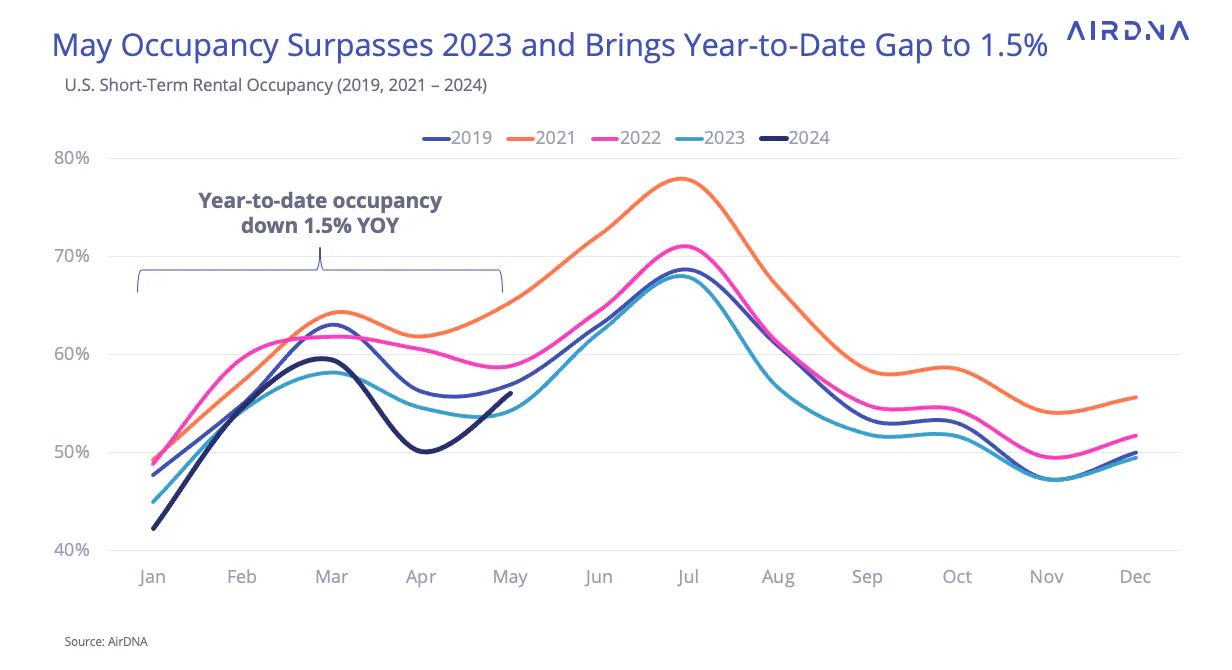
The surge in post-pandemic demand pushed short-term rental (STR) occupancy to record levels in 2021 and 2022. However, monthly occupancy has been declining every since. Although occupancy year-to-date is still down by about 1.5%, May saw a growth rate of 3.1%—the highest monthly increase since early 2022. This was just before new supply, taking advantage of pandemic-level occupancy, started to impact individual unit performance.
While AirDNA predicted that 2024 would be a turning point for the STR industry, the year's ups and downs have made it hard to say for sure. Thankfully, a fantastic May and strong forward-looking pacing data are some of the best signs yet that the industry is on a growth path again—and has been throughout 2024.
Employment and Inflation
Just like the STR market, the entire U.S. economy is at a delicate turning point. The high inflation that reminded economists of the stagflation era of last century has mostly been controlled by quickly raising central bank rates starting in March 2022. A strong labor market has made it easier for the Fed to achieve its goals of low inflation and full employment. Even with interest rates at their highest in decades, the consistently low unemployment rate has allowed the Fed to keep policies that support reducing the money supply.
Recently, the labor market has shown some changes. In May, 272,000 jobs were added, which is more than April's 165,000. However, the Bureau of Labor Statistics (BLS) reported that unemployment rose to 4.0%, up from 3.9% in April and 3.8% in March. Although this is a small increase, it's the highest unemployment rate since early 2022, around the same time U.S. STR occupancy started to decline.

At the same time, year-over-year (YOY) inflation, measured by changes in the Consumer Price Index (CPI), dropped to 3.3% for the second month in a row. The CPI tracks changes in the prices of goods and services, reflecting the cost of living. While this is still above the Federal Reserve's 2% target, the delayed effects of higher interest rates mean inflation could keep falling even if the Fed starts lowering rates.
Timing is crucial because waiting too long to cut rates could hurt employment. Currently, Oxford Economics predicts two rate cuts in 2024, with the first expected in September. These rates are particularly important for the STR market because they impact both general economic activity and lending rates for new mortgages.
At a Glance: Key U.S. STR Performance Metrics for May 2024
- RevPAR increased 4.7% YOY to $167.27
- Available listings were 1.69 million, up 7.2% YOY
- Total demand (nights) rose 11.4% YOY
- Occupancy was 3.1% higher YOY at 56.0%
- Average Daily Rates (ADR) increased 1.6% YOY to $298.92
- Repeat Rent Index (RRI) increased by 8.7% YOY
- Nights booked increased by 12.7% YOY

Supply Growth Slows in May
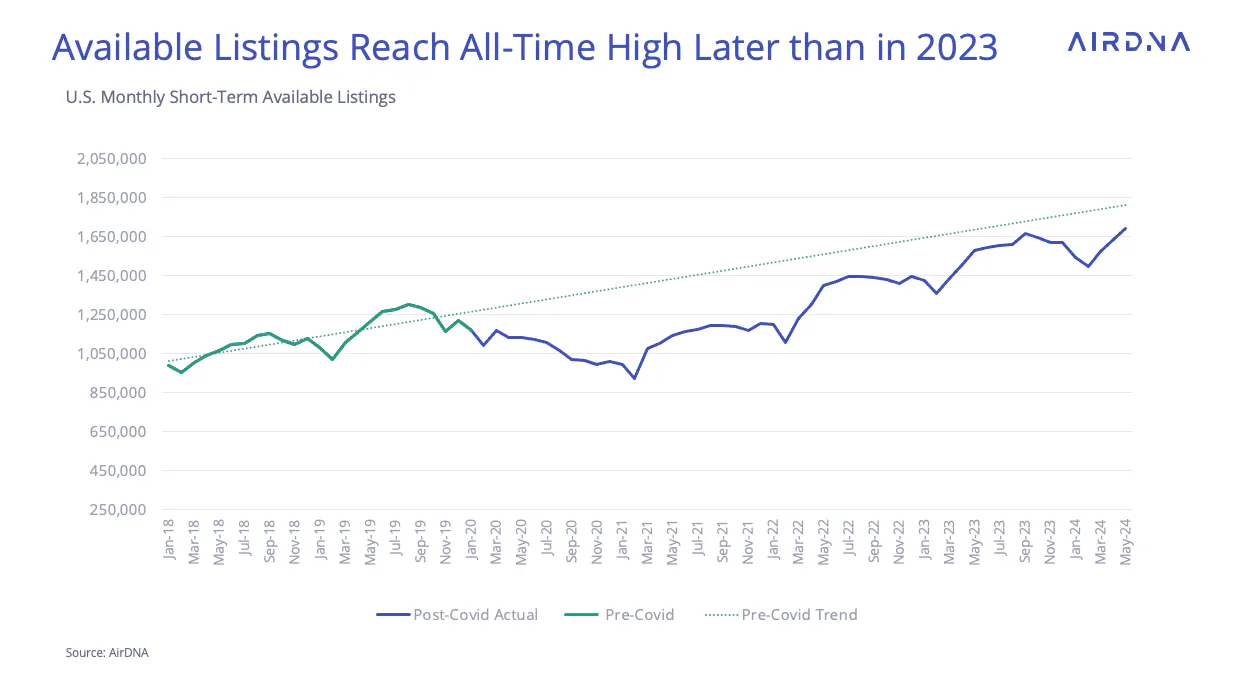
One of May's most surprising statistics is the slowdown in supply growth that has emerged over the past year. In May, available listings hit a new high of 1.69 million in the U.S. However, between 2021 to 2023, we typically reached the peak number of available listings in late March and early April.
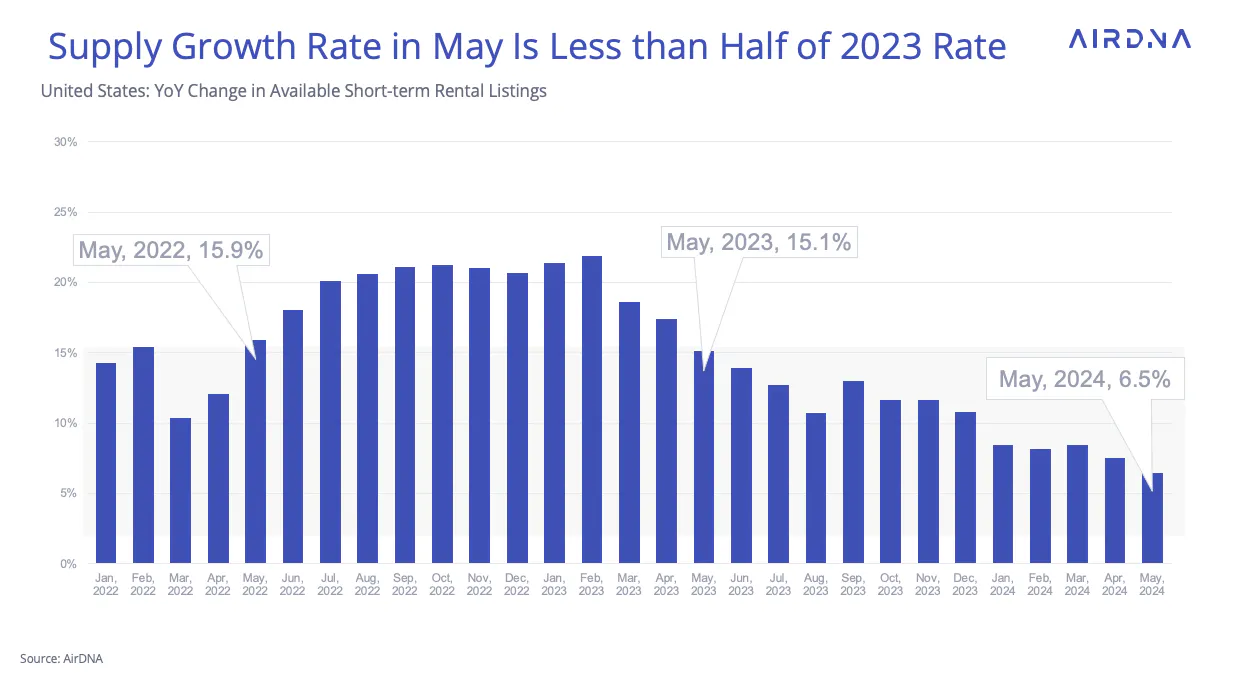
When we look at the monthly year-over-year change in available listings, the slowdown is clear. Since the peak of 21.9% in February 2023, the growth rate has dropped significantly. In May, the increase was just 6.5%, less than half of the 15.1% growth seen in May 2023. This slowdown shows the delayed impact of rising interest rates, as supply growth continued to increase for about a year after the Fed began tightening its monetary policy.
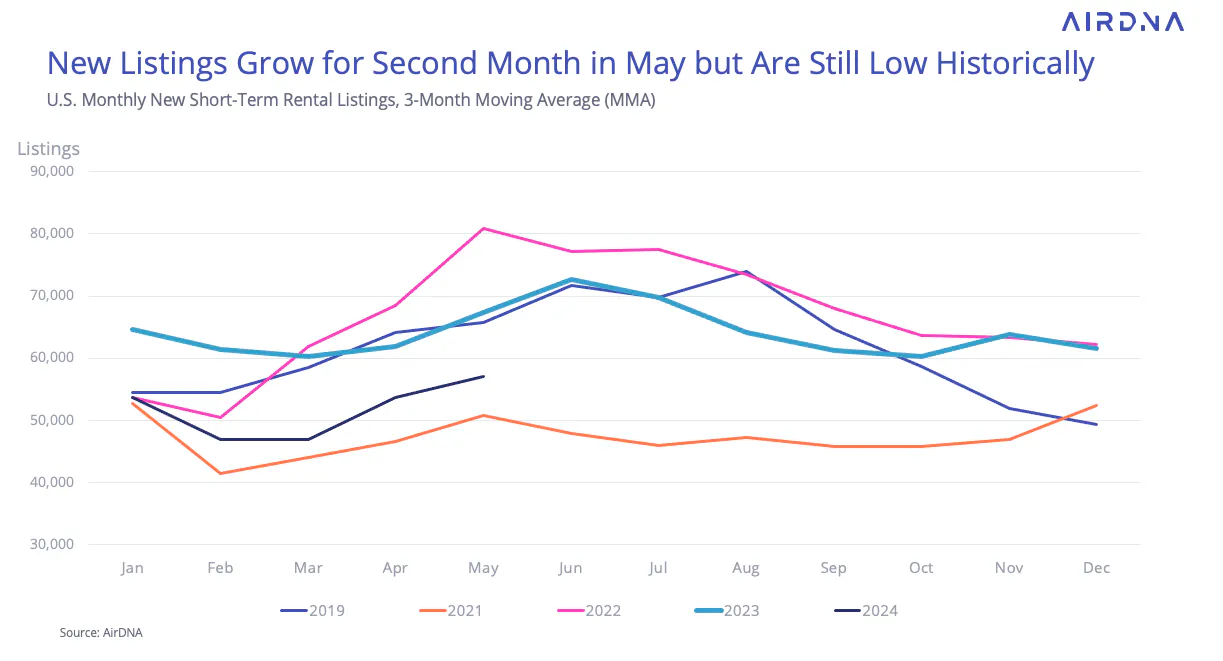
New listings, which are a key part of supply growth, started 2024 at about the same level as in 2019 and 2022. Since then, however, the rate of new listings has fallen significantly behind those years and has followed the slower pace of 2021, when many were still practicing social distancing due to Covid. Although growth picked up in May, it remained well below the levels of 2023, 2022, and 2019, even as the overall market size has increased.
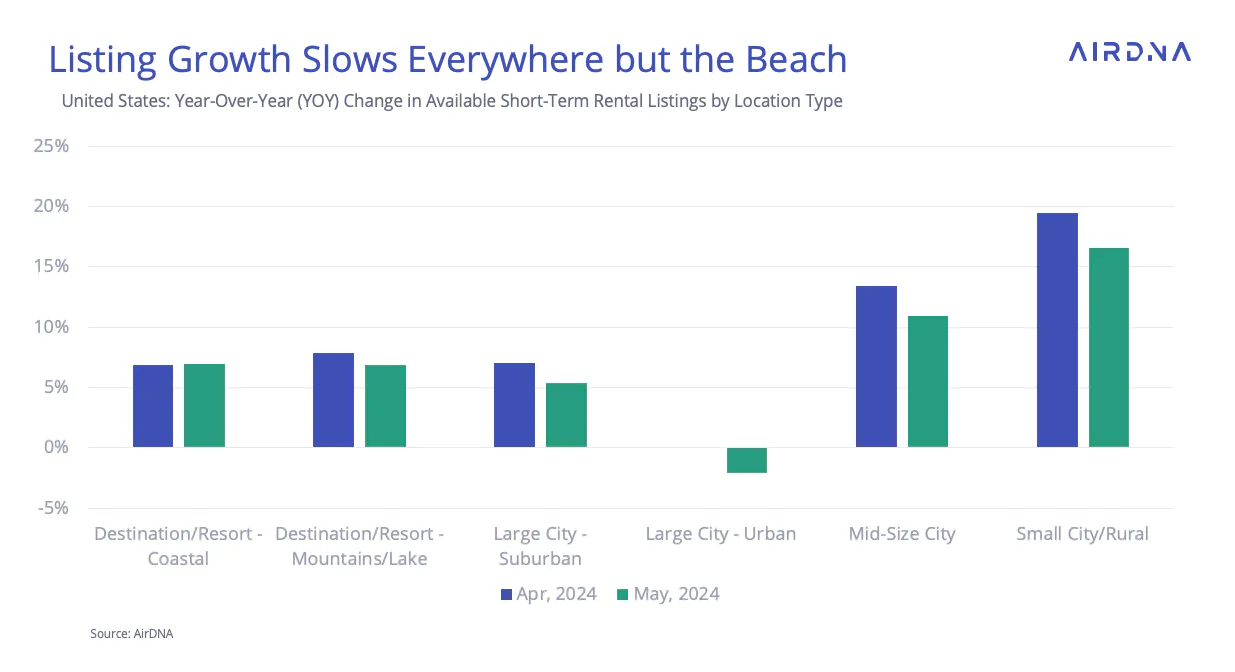
While high interest rates and lower occupancy rates are the main reasons for the declining supply, this trend hasn't affected all areas equally. For example, coastal resorts saw an increase in supply in May. The dollar exchange rate is weaker than last year's highs, and price increases in the U.S. have been relatively low. As a result, coastal operators might be expecting renewed interest in domestic vacations and an increase in international visitors over the summer.
Conversely, supply in urban locations has recently shifted into the negative. This isn't just due to high interest rates and home prices, but also because of stricter regulations in New York and other densely populated cities. Although AirDNA has expressed doubt that regulating short-term rentals will effectively improve housing affordability in large cities, the housing crisis remains a hot topic in political discussions. Urban markets are particularly vulnerable because housing affordability issues are felt acutely in these types of locations.
Demand Growth Is Widespread
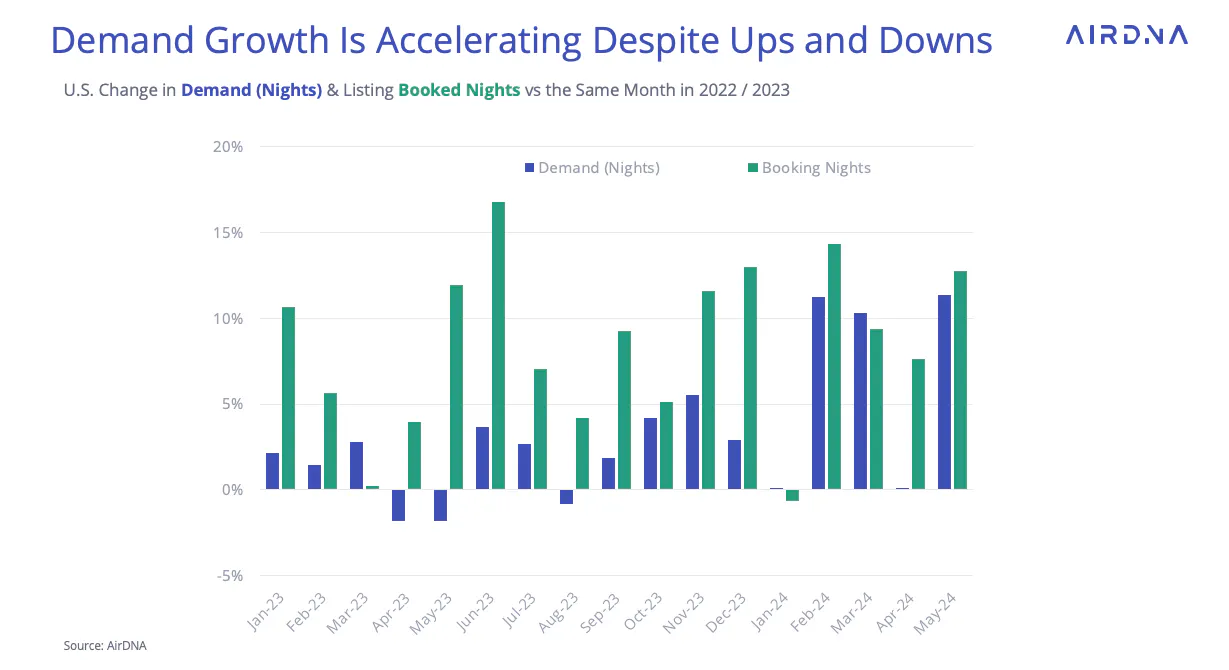
Demand for rentals has been picking up speed just as supply has been slowing down, and May was a dramatic example. The growth rate hit 11.4%, surpassing even February's 11.3%, which had been boosted by a low off-season base and delayed ski trips from January. The last time demand growth in May was this high was during the peak of 2022.
Another positive sign was that booking growth in May was even higher than demand, reaching 12.7%. Booking growth has stayed strong for the past four months. While it often matches demand, it also acts as an indicator of future demand growth.
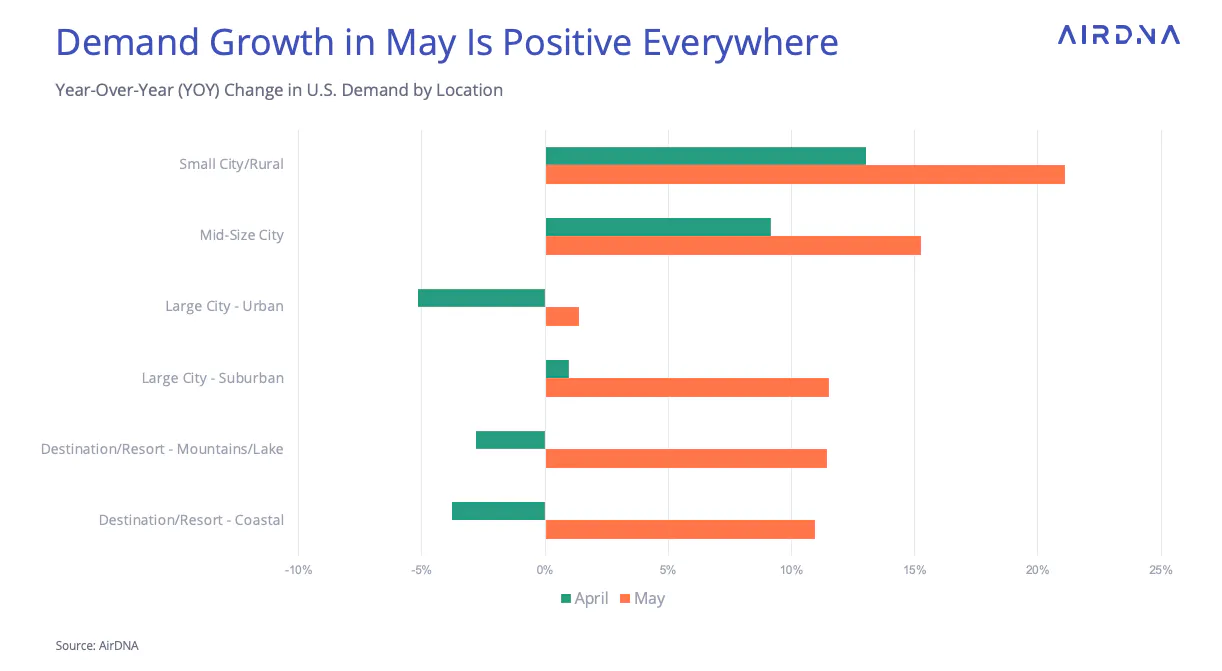
Turning to markets, demand growth in May increased across all locations. This even includes urban areas, where total listings decreased and April demand dropped by over 5% year-over-year (YOY). Small town and rural locations led the way with an impressive growth rate of 21.1%.
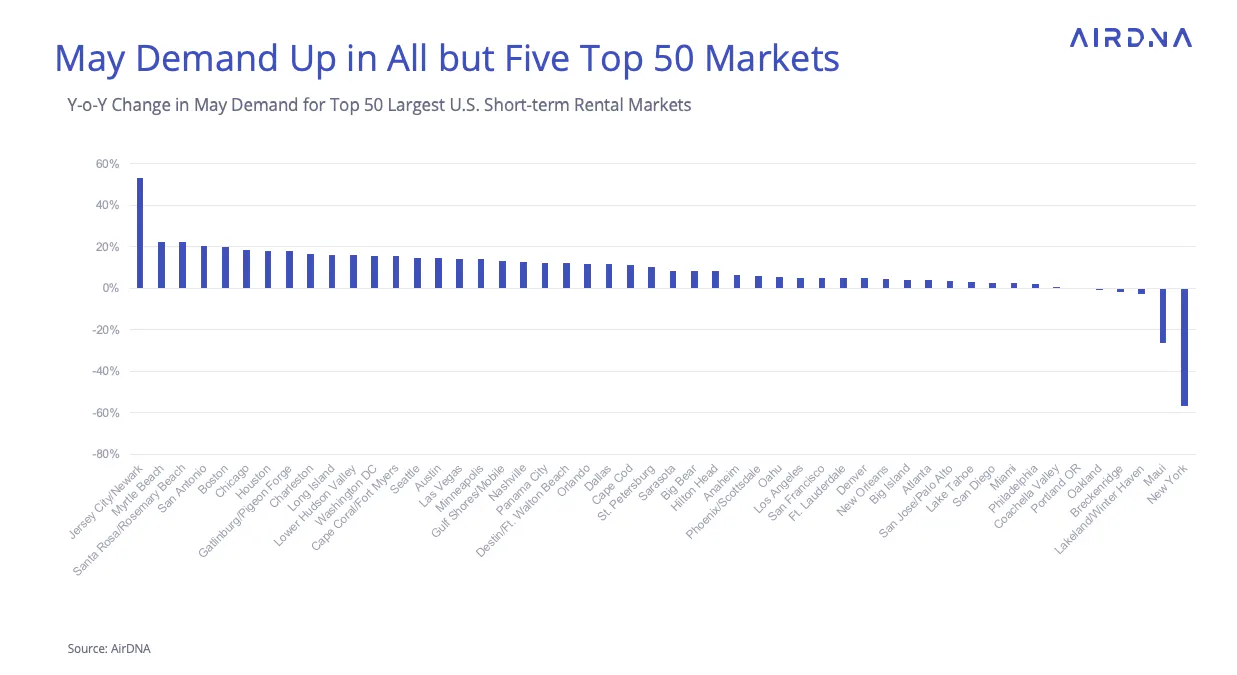
The top 50 markets also showed widespread demand growth, with all but five experiencing increases compared to 2023. The two biggest declines were in New York, down 56.9% due to significant supply reductions from stricter regulations, and Maui, down 26.3%, due to continued recovery from devastating wildfires.
Meanwhile, Jersey City/Newark (+53.1%) are still happy to accommodate turned-out travelers looking to rent an STR adjacent to New York city. Popular coastal resort locations Myrtle Beach, South Carolina (+22.5%) and Santa Rosa/Rosemary Beach, Florida (+22.3%) are getting a head start on the summer beach season.
May Marks a Turning Point for Occupancy Growth
In May, the accelerating demand decisively outpaced the slowing supply, leading to a YOY occupancy gain of 3.1%. February 2024 ended 23 months of continuous occupancy declines, and despite a dip in April, May saw the highest gain so far this year. Although year-to-date occupancy is still down about 1.5%, the strong summer performance expected ahead suggests that May marked a significant turning point for occupancy growth.
ADR Growth Positive but Hampered by Inflation
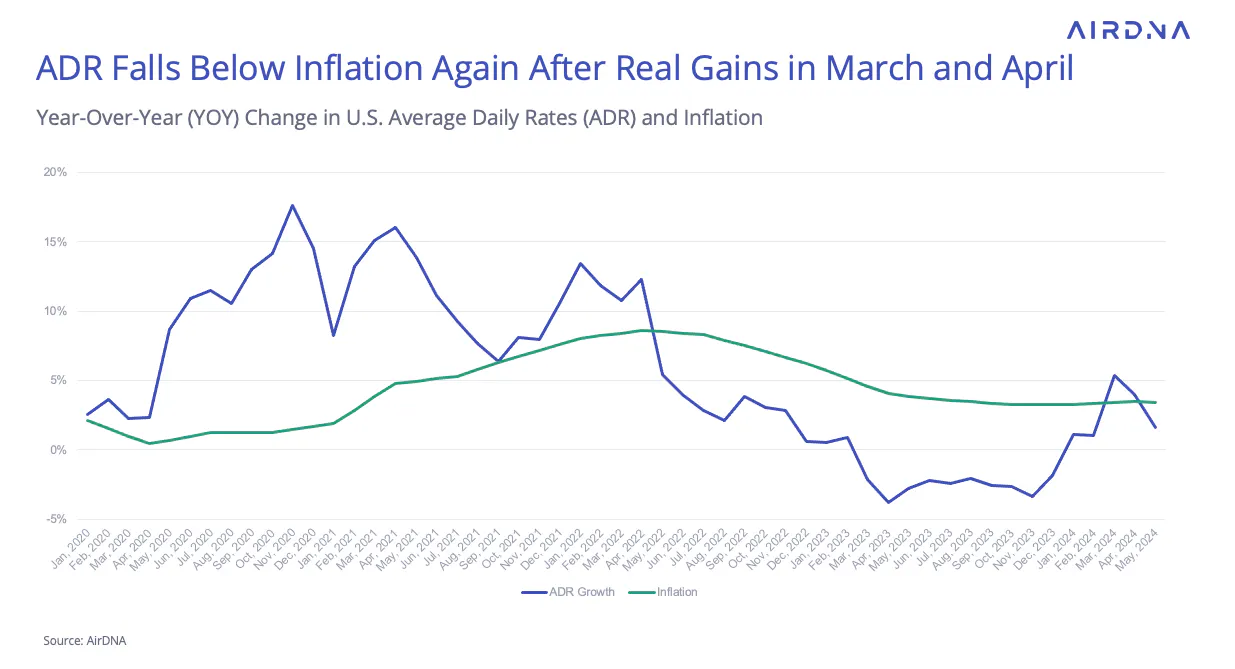
The upward trajectory in occupancy hasn’t been lost on operators this year, who are expressing some pricing power compared to 2023. While average daily rates (ADR) generally declined each month after February 2023, ADR growth turned positive in January 2024 and has remained positive since.
However, due to persistently high inflation, ADR growth needs to be significant for operators to see real gains. This happened in March and April. In May, the ADR growth rate fell below the inflation rate, though it remained positive.
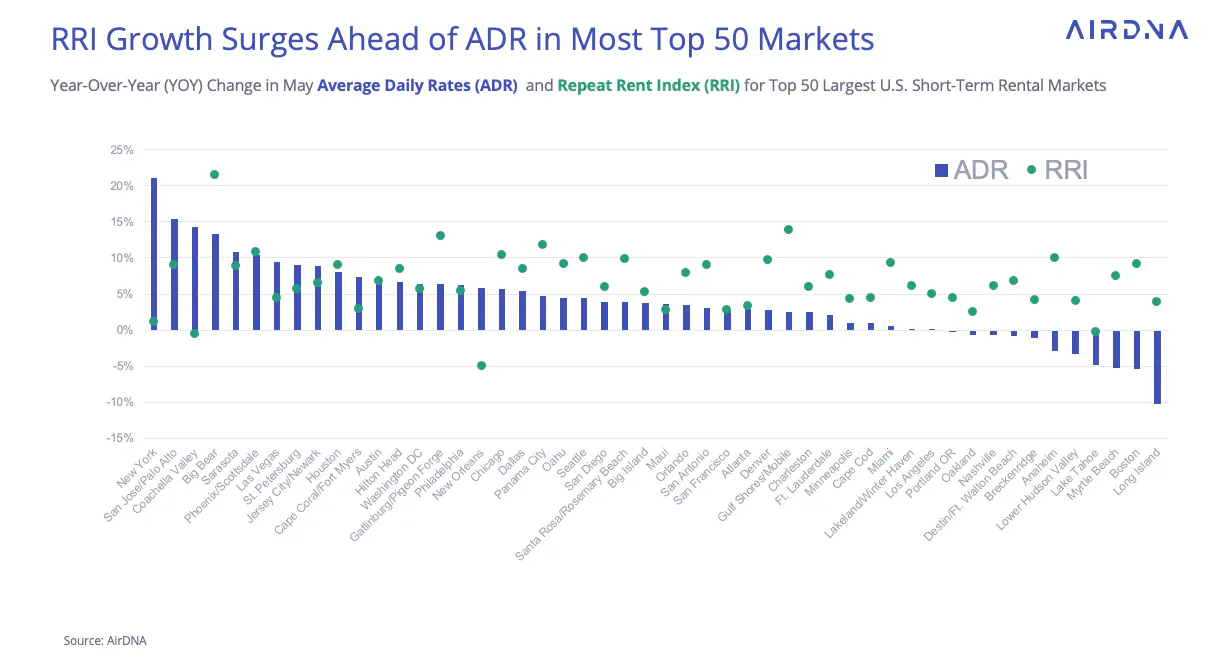
When turning to markets, there's a clear trend: the growth in the AirDNA repeat rent index (RRI), which accounts for the changing mix of listings, is significantly higher than ADR in many places. This suggests that operators can raise prices even as new listings bring down the average ADR. That being said, 39 out of the top 50 markets still saw an increase in ADR.
Pacing Data Suggests Strong June, July and August
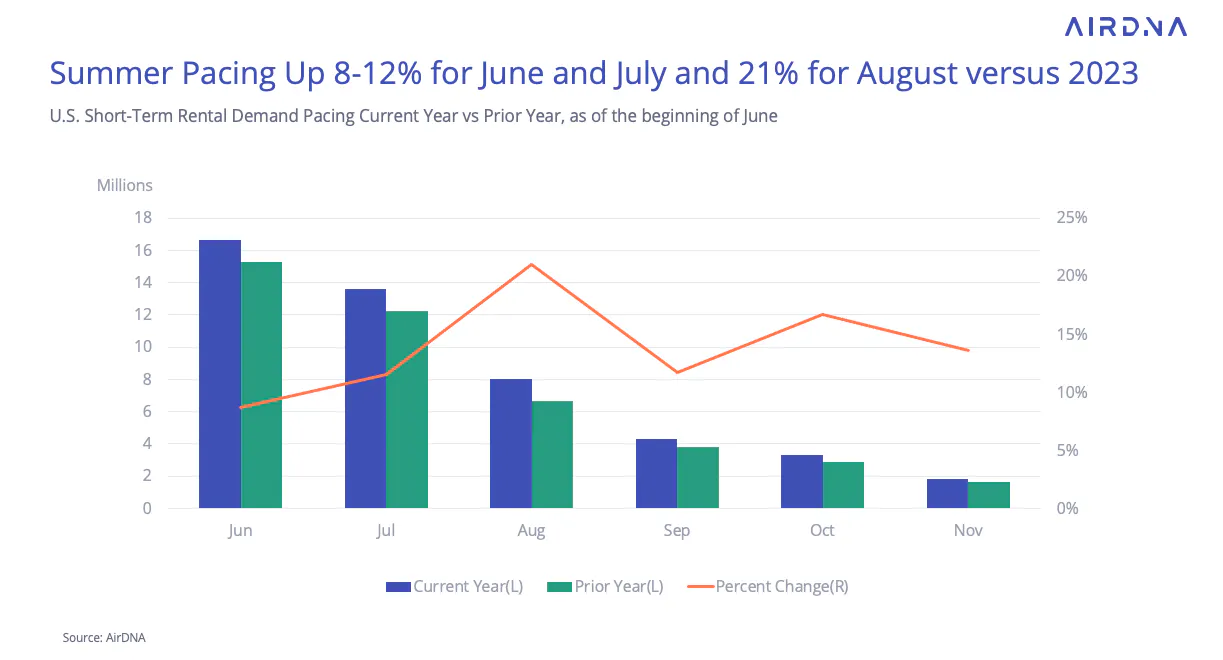
Will the positive news continue? Pacing data suggests it will, with June and July tracking 8-12% ahead of on-the-books demand compared to this time last year. August is pacing 21.0% ahead, although the weak performance in August 2023 somewhat reduces the impact of this figure. Even so, it indicates a stronger summer in line with the accelerating demand trend.
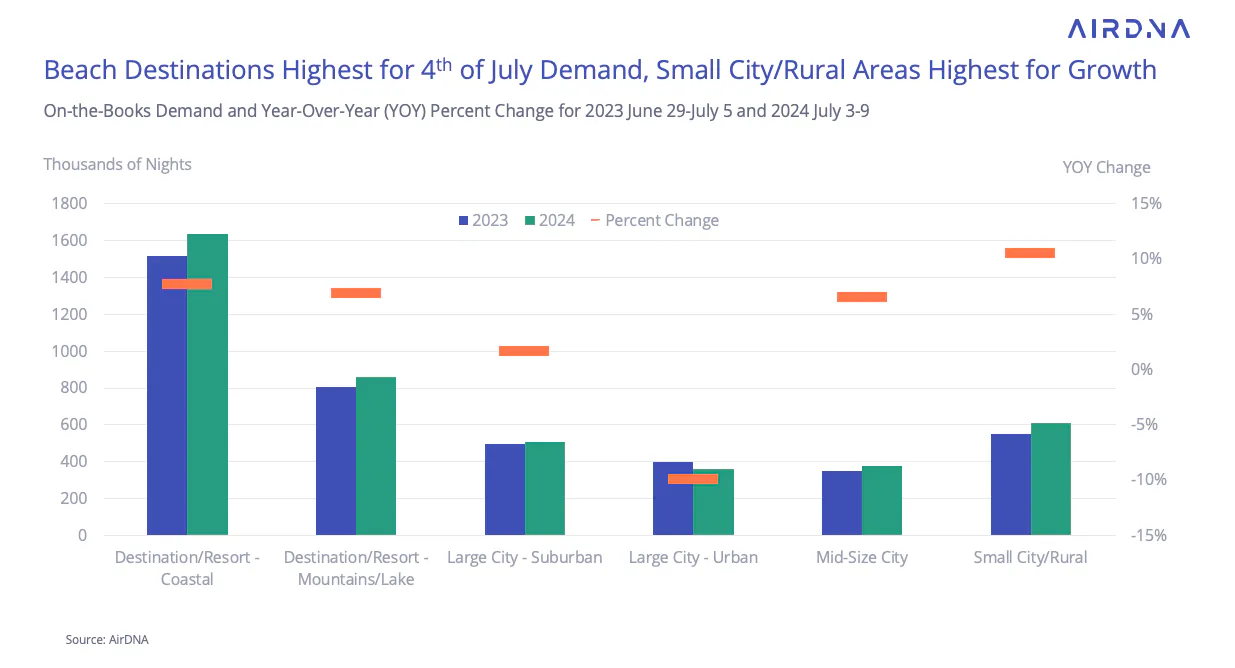
Looking specifically at the week surrounding July 4, most locations are expecting considerably higher demand in 2024. The exception is in urban locations (-10.0% YOY), where reduced supply may be limiting demand.
Coastal locations are the most popular, with 1.63 million nights already booked—a 7.7% increase over the same time last year. Small City/Rural locations are experiencing the largest growth, with demand 10.6% higher than at this time in 2023.
Beaches Dominate Top 4th of July Destinations
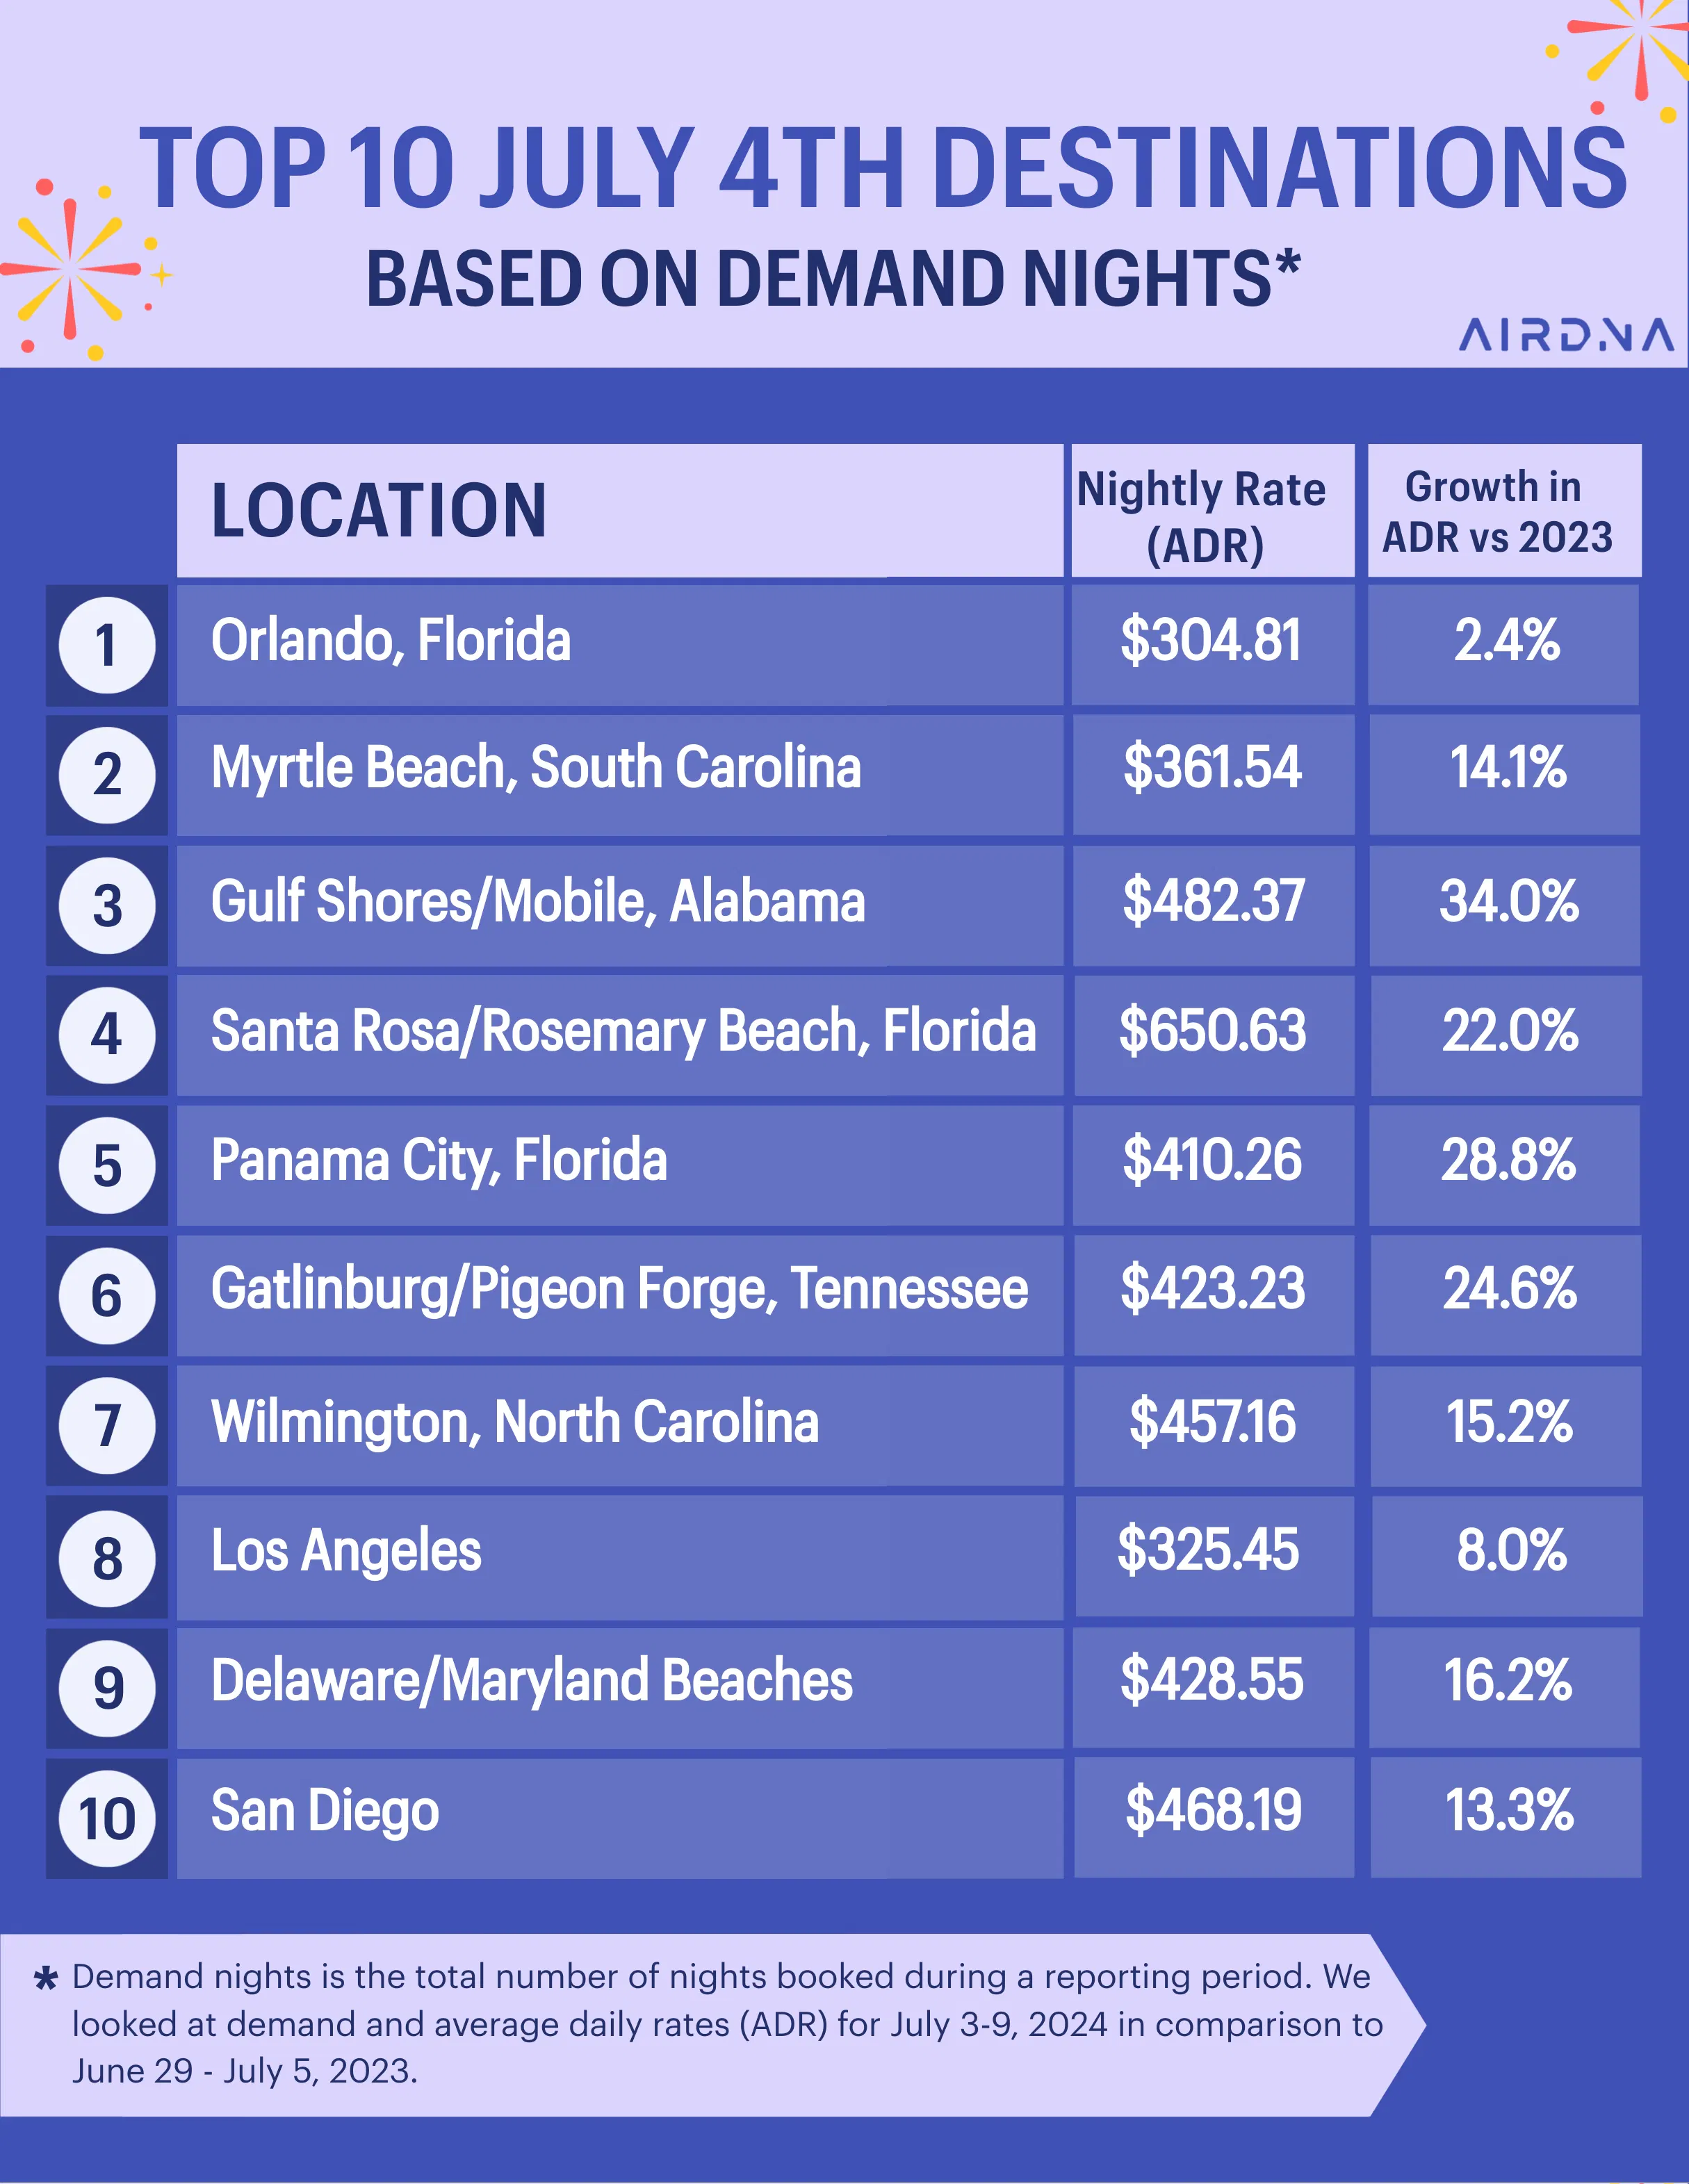
Turning to markets, our list of the most popular July 4th destinations includes many familiar names. However, New York, which used to be a top 10 market for July 4th, has dropped out and been replaced by the Delaware/Maryland Beaches. This shift continues the trend of growing popularity for Atlantic beaches, led by Myrtle Beach, South Carolina.
The following beach locations continue to be popular, with hosts there capitalizing with higher ADRs for booked rooms (YOY growth rate in parentheses):
- Gulf Beaches (+34.0%)
- Santa Rosa/Rosemary Beach, Florida (+22.0%)
- Panama City, Florida (+28.8%)
Most Expensive July 4th Destinations
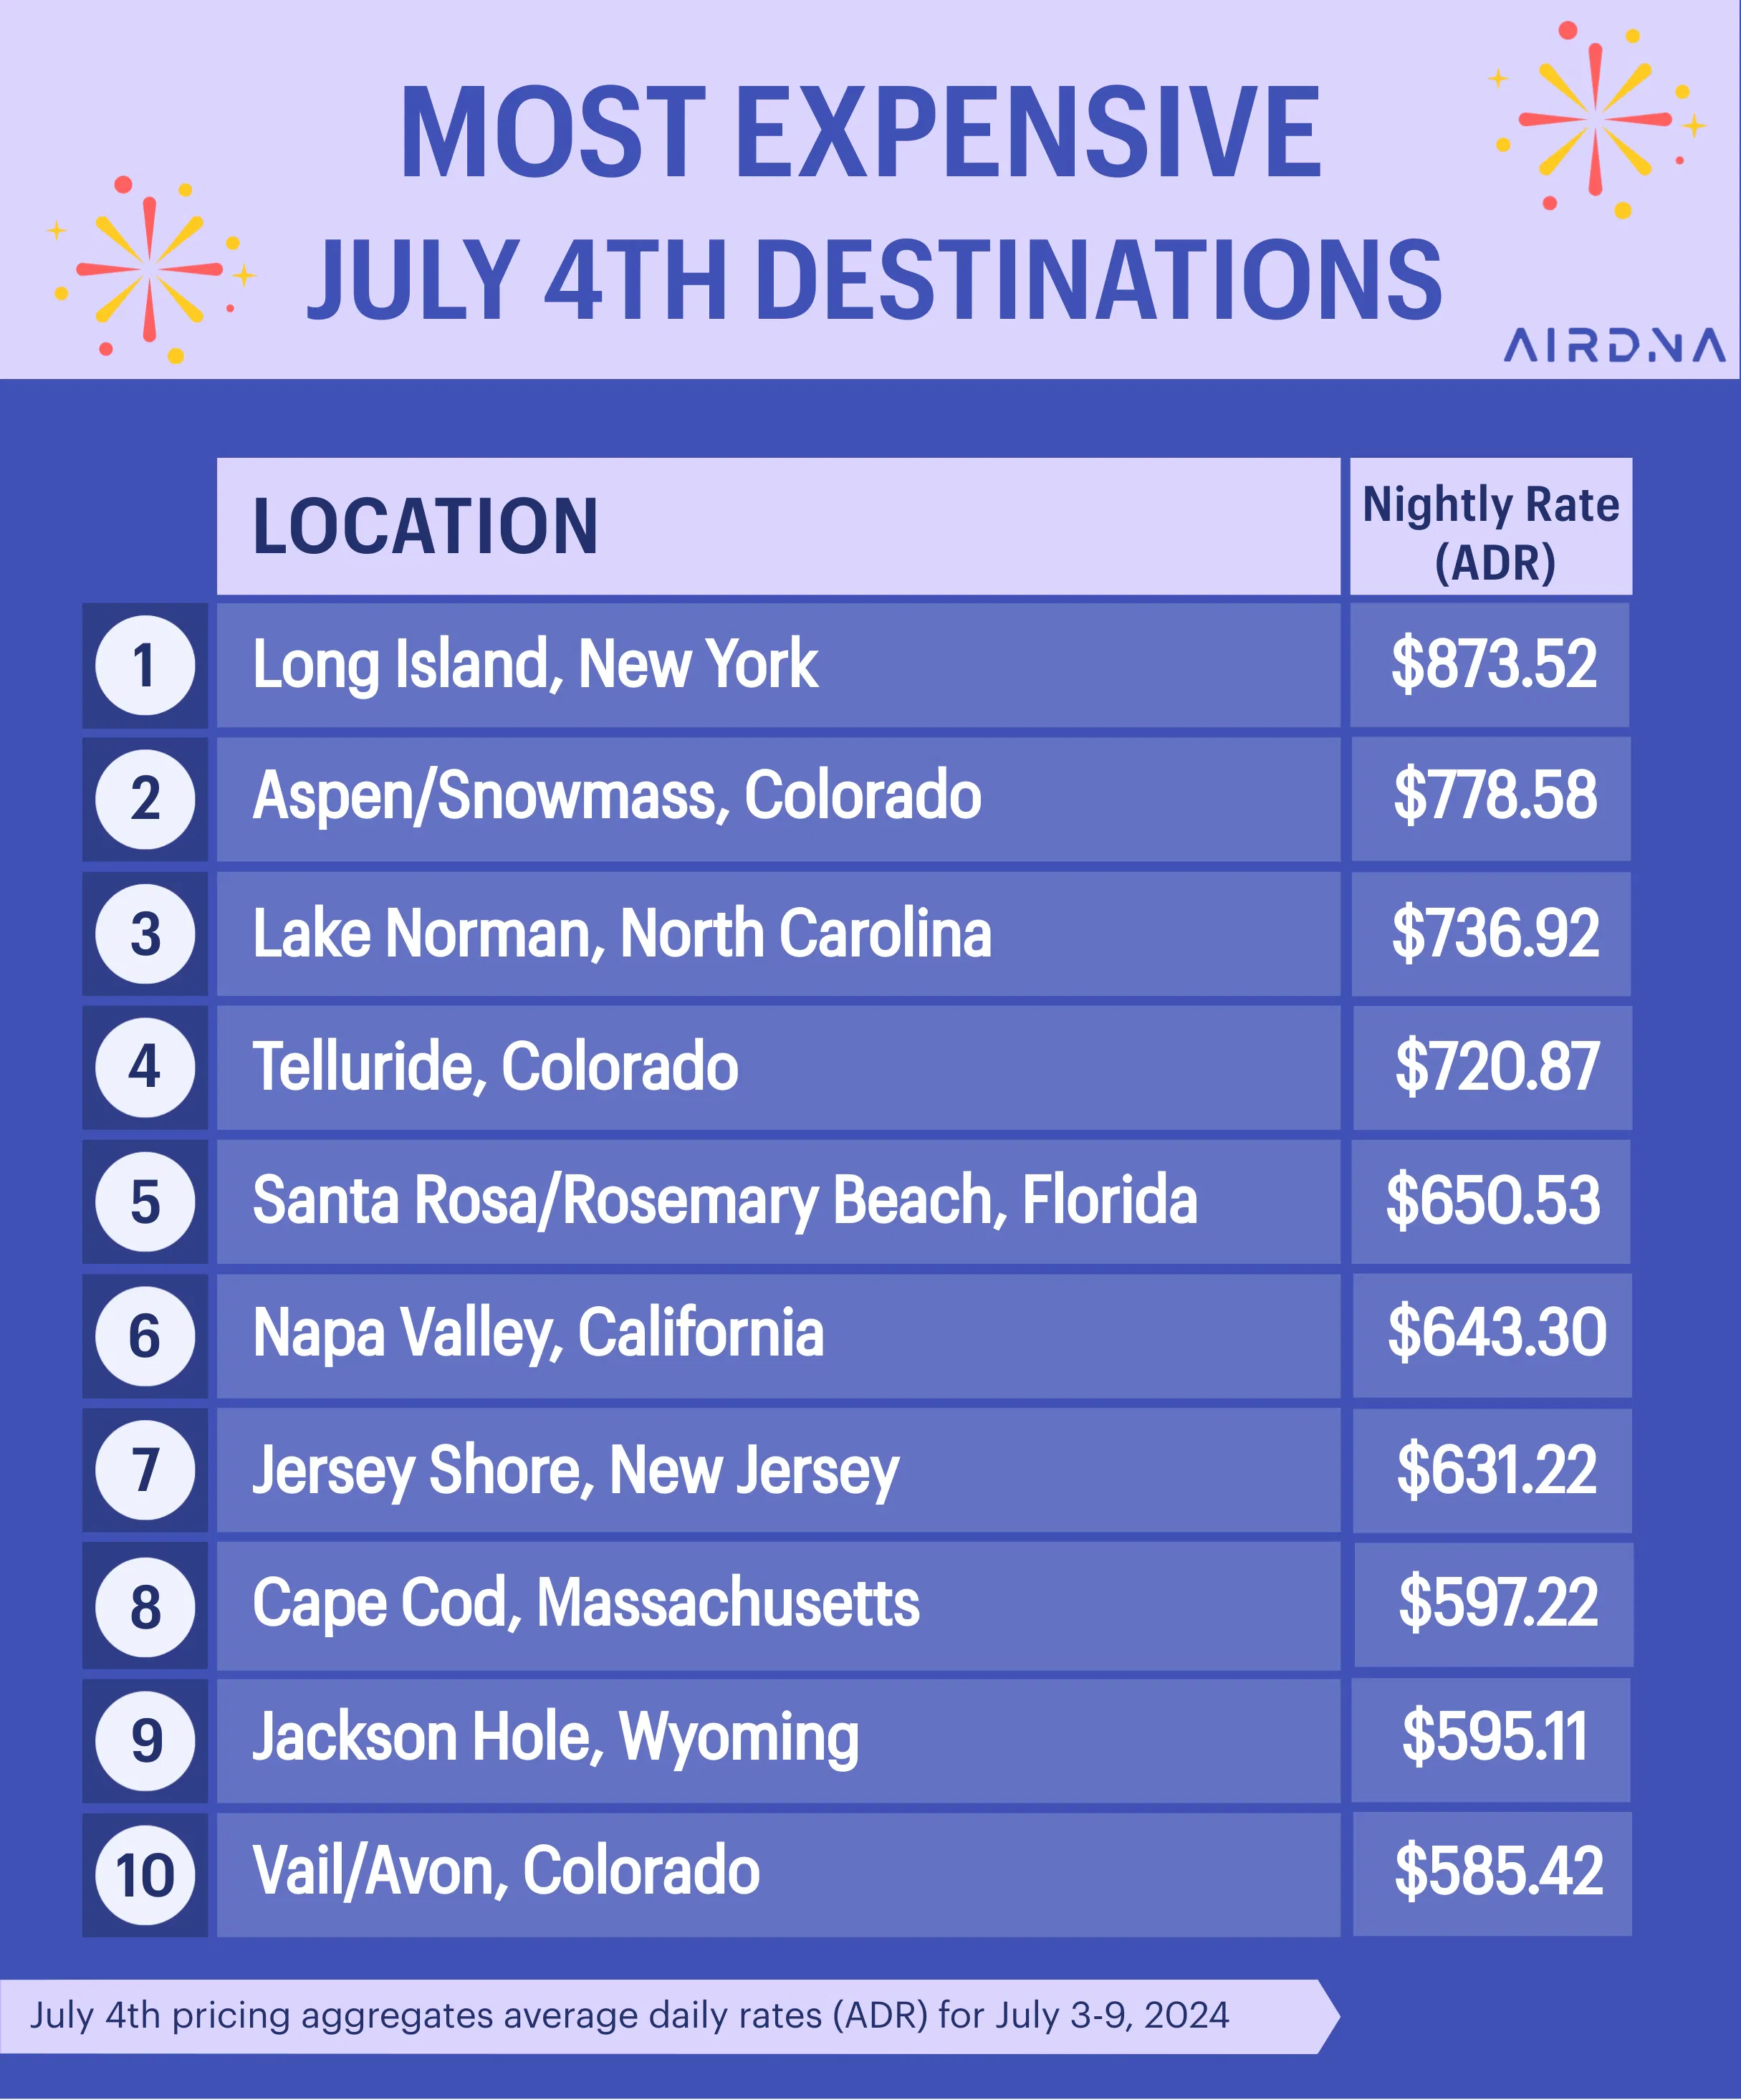
Rates in Santa Rosa/Rosemary Beach (#4 for demand nights) are so high that this market now ranks among the top ten most expensive locations for the week of July 4th, with an average price of $650.63 per night. Other pricey locations include Long Island, a summer retreat for New York’s elite since the 19th century, and surprisingly, Aspen/Snowmass and Telluride. Although these two latter markets are typically known as ski resorts, hosts are attracting summer visitors as well—Telluride has seen a 28.0% increase in demand year-over-year (YOY) compared to this time in 2023!
Most Affordable July 4th Destinations
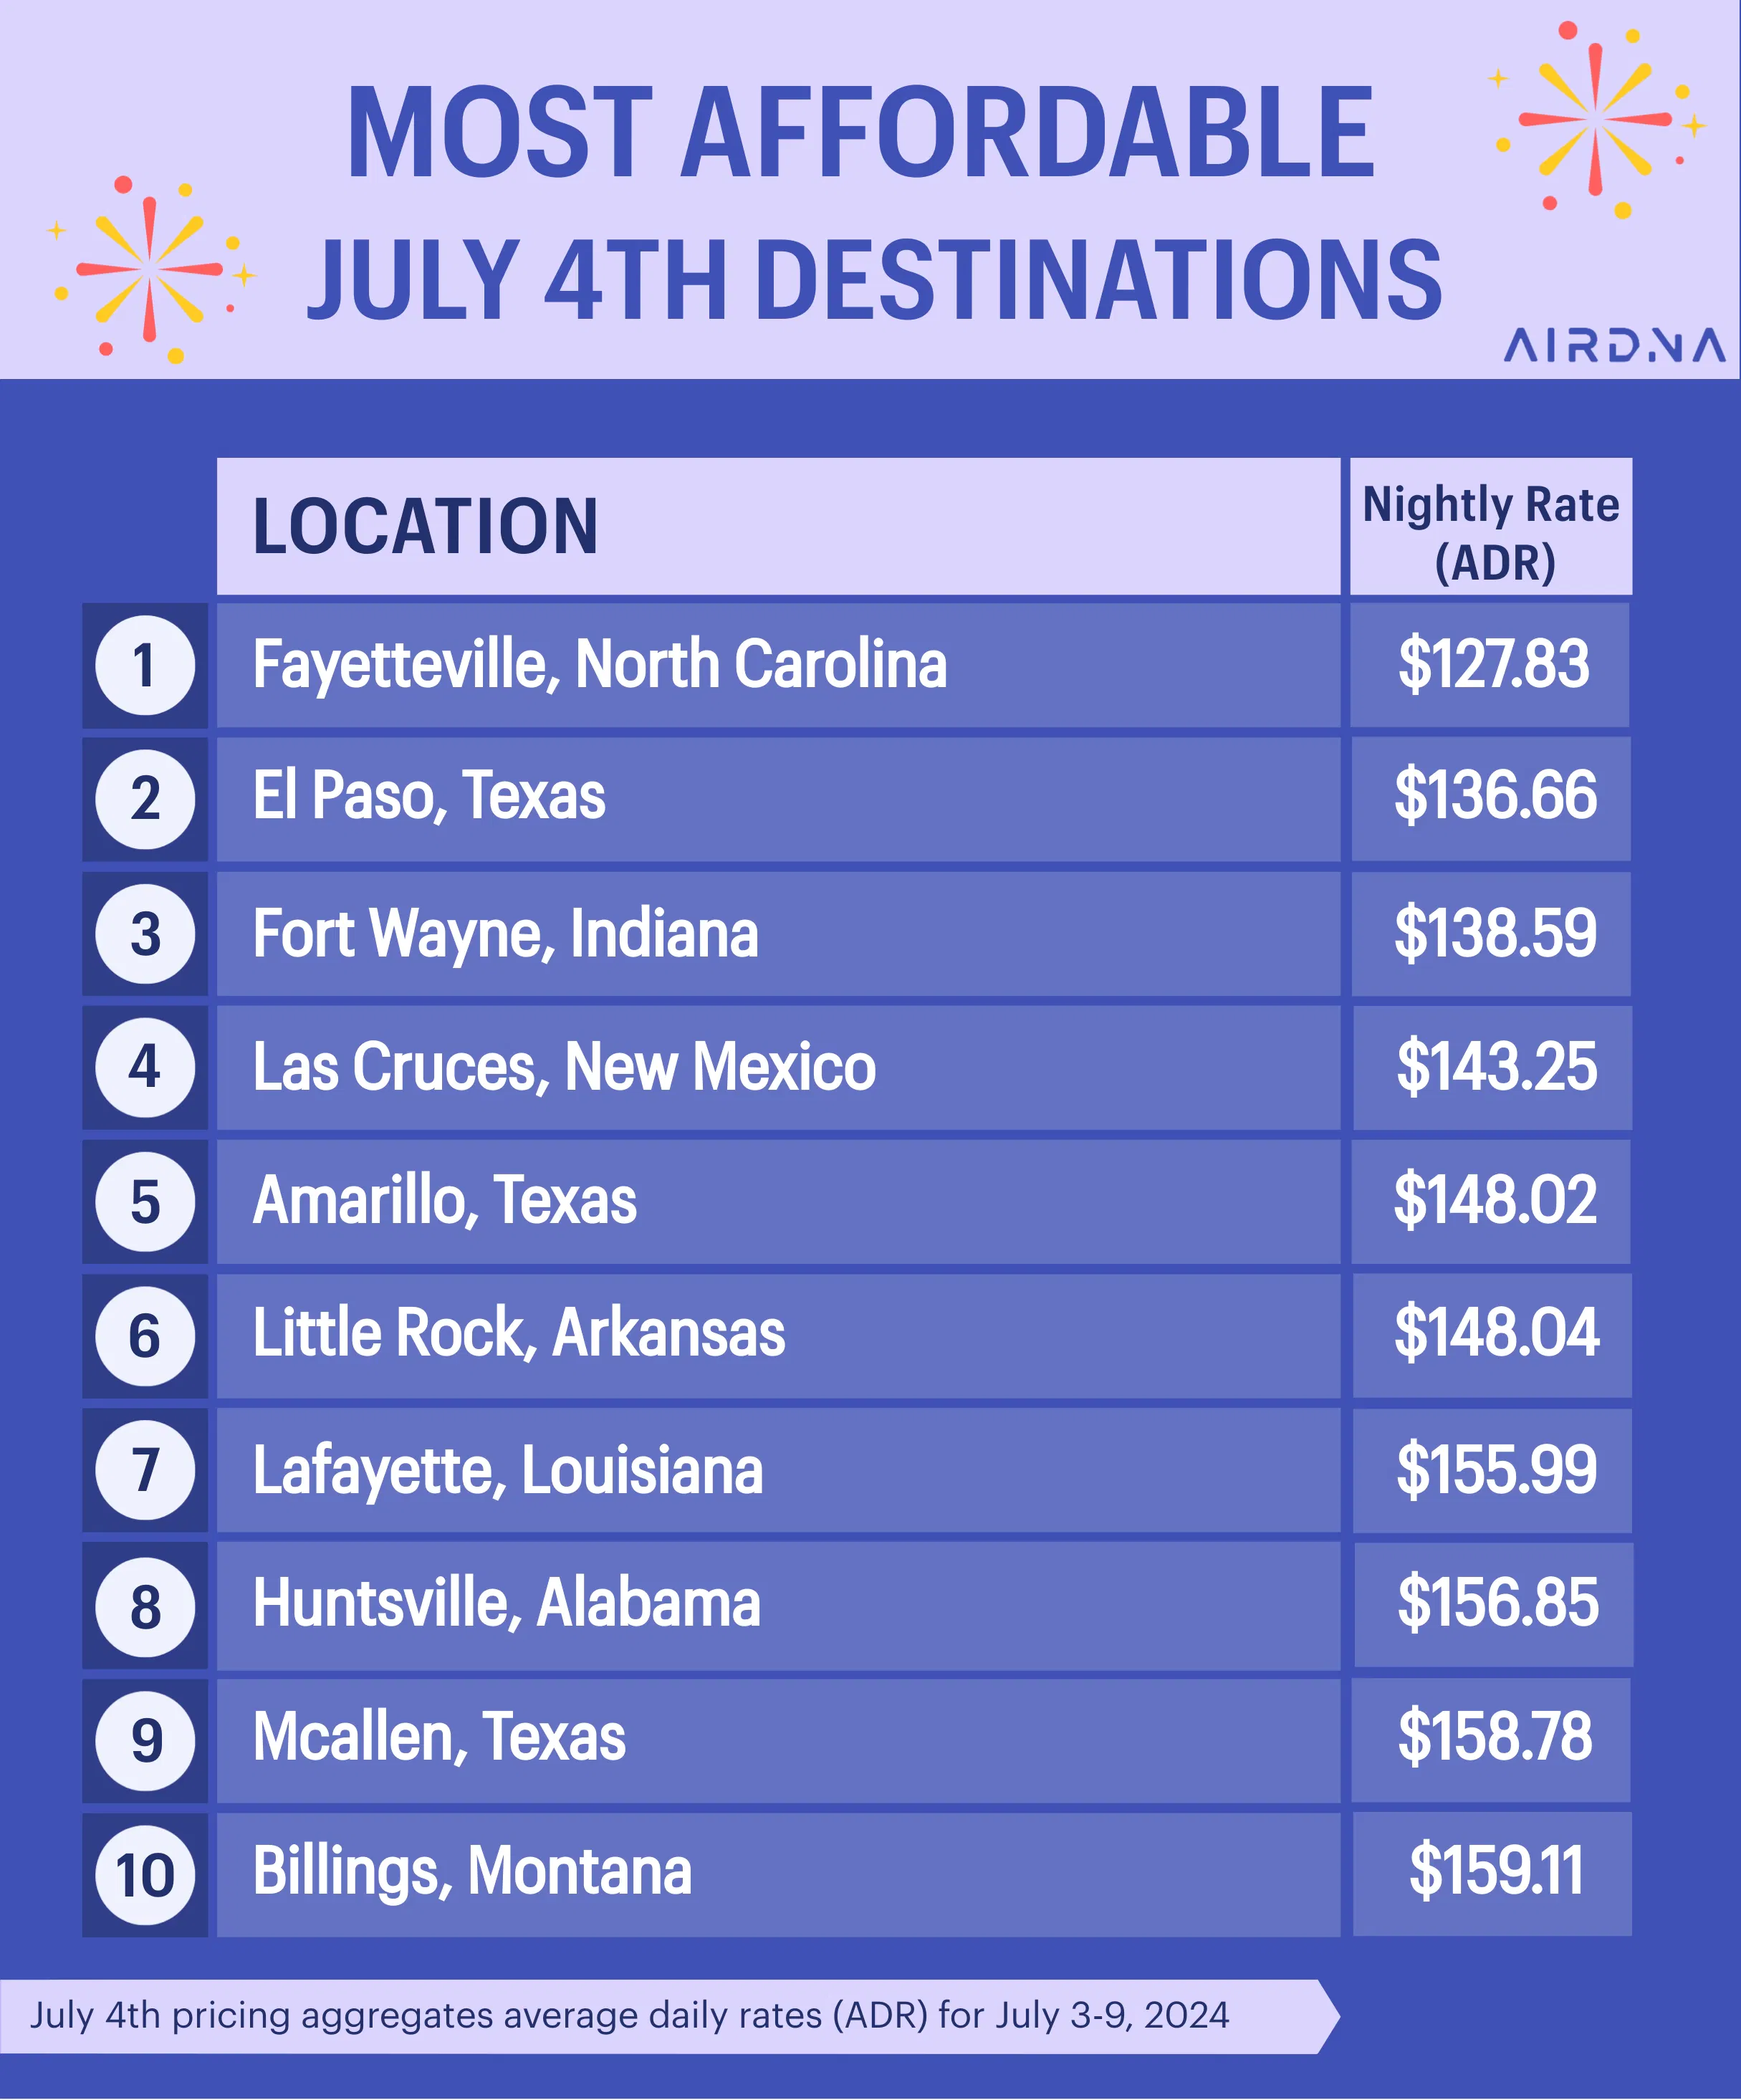
Our list of the most affordable places is light on beaches, but it includes scenic locations with abundant outdoor recreation. The list ranges from destinations in the Midwest to the Southwest, although geography isn’t the only factor. The top affordable market, Fayetteville, North Carolina, is situated between Lake Norman (one of our most expensive markets) and Myrtle Beach and Wilmington (two of our most popular spots).
Best Last-Minute Beach Vacation Spots
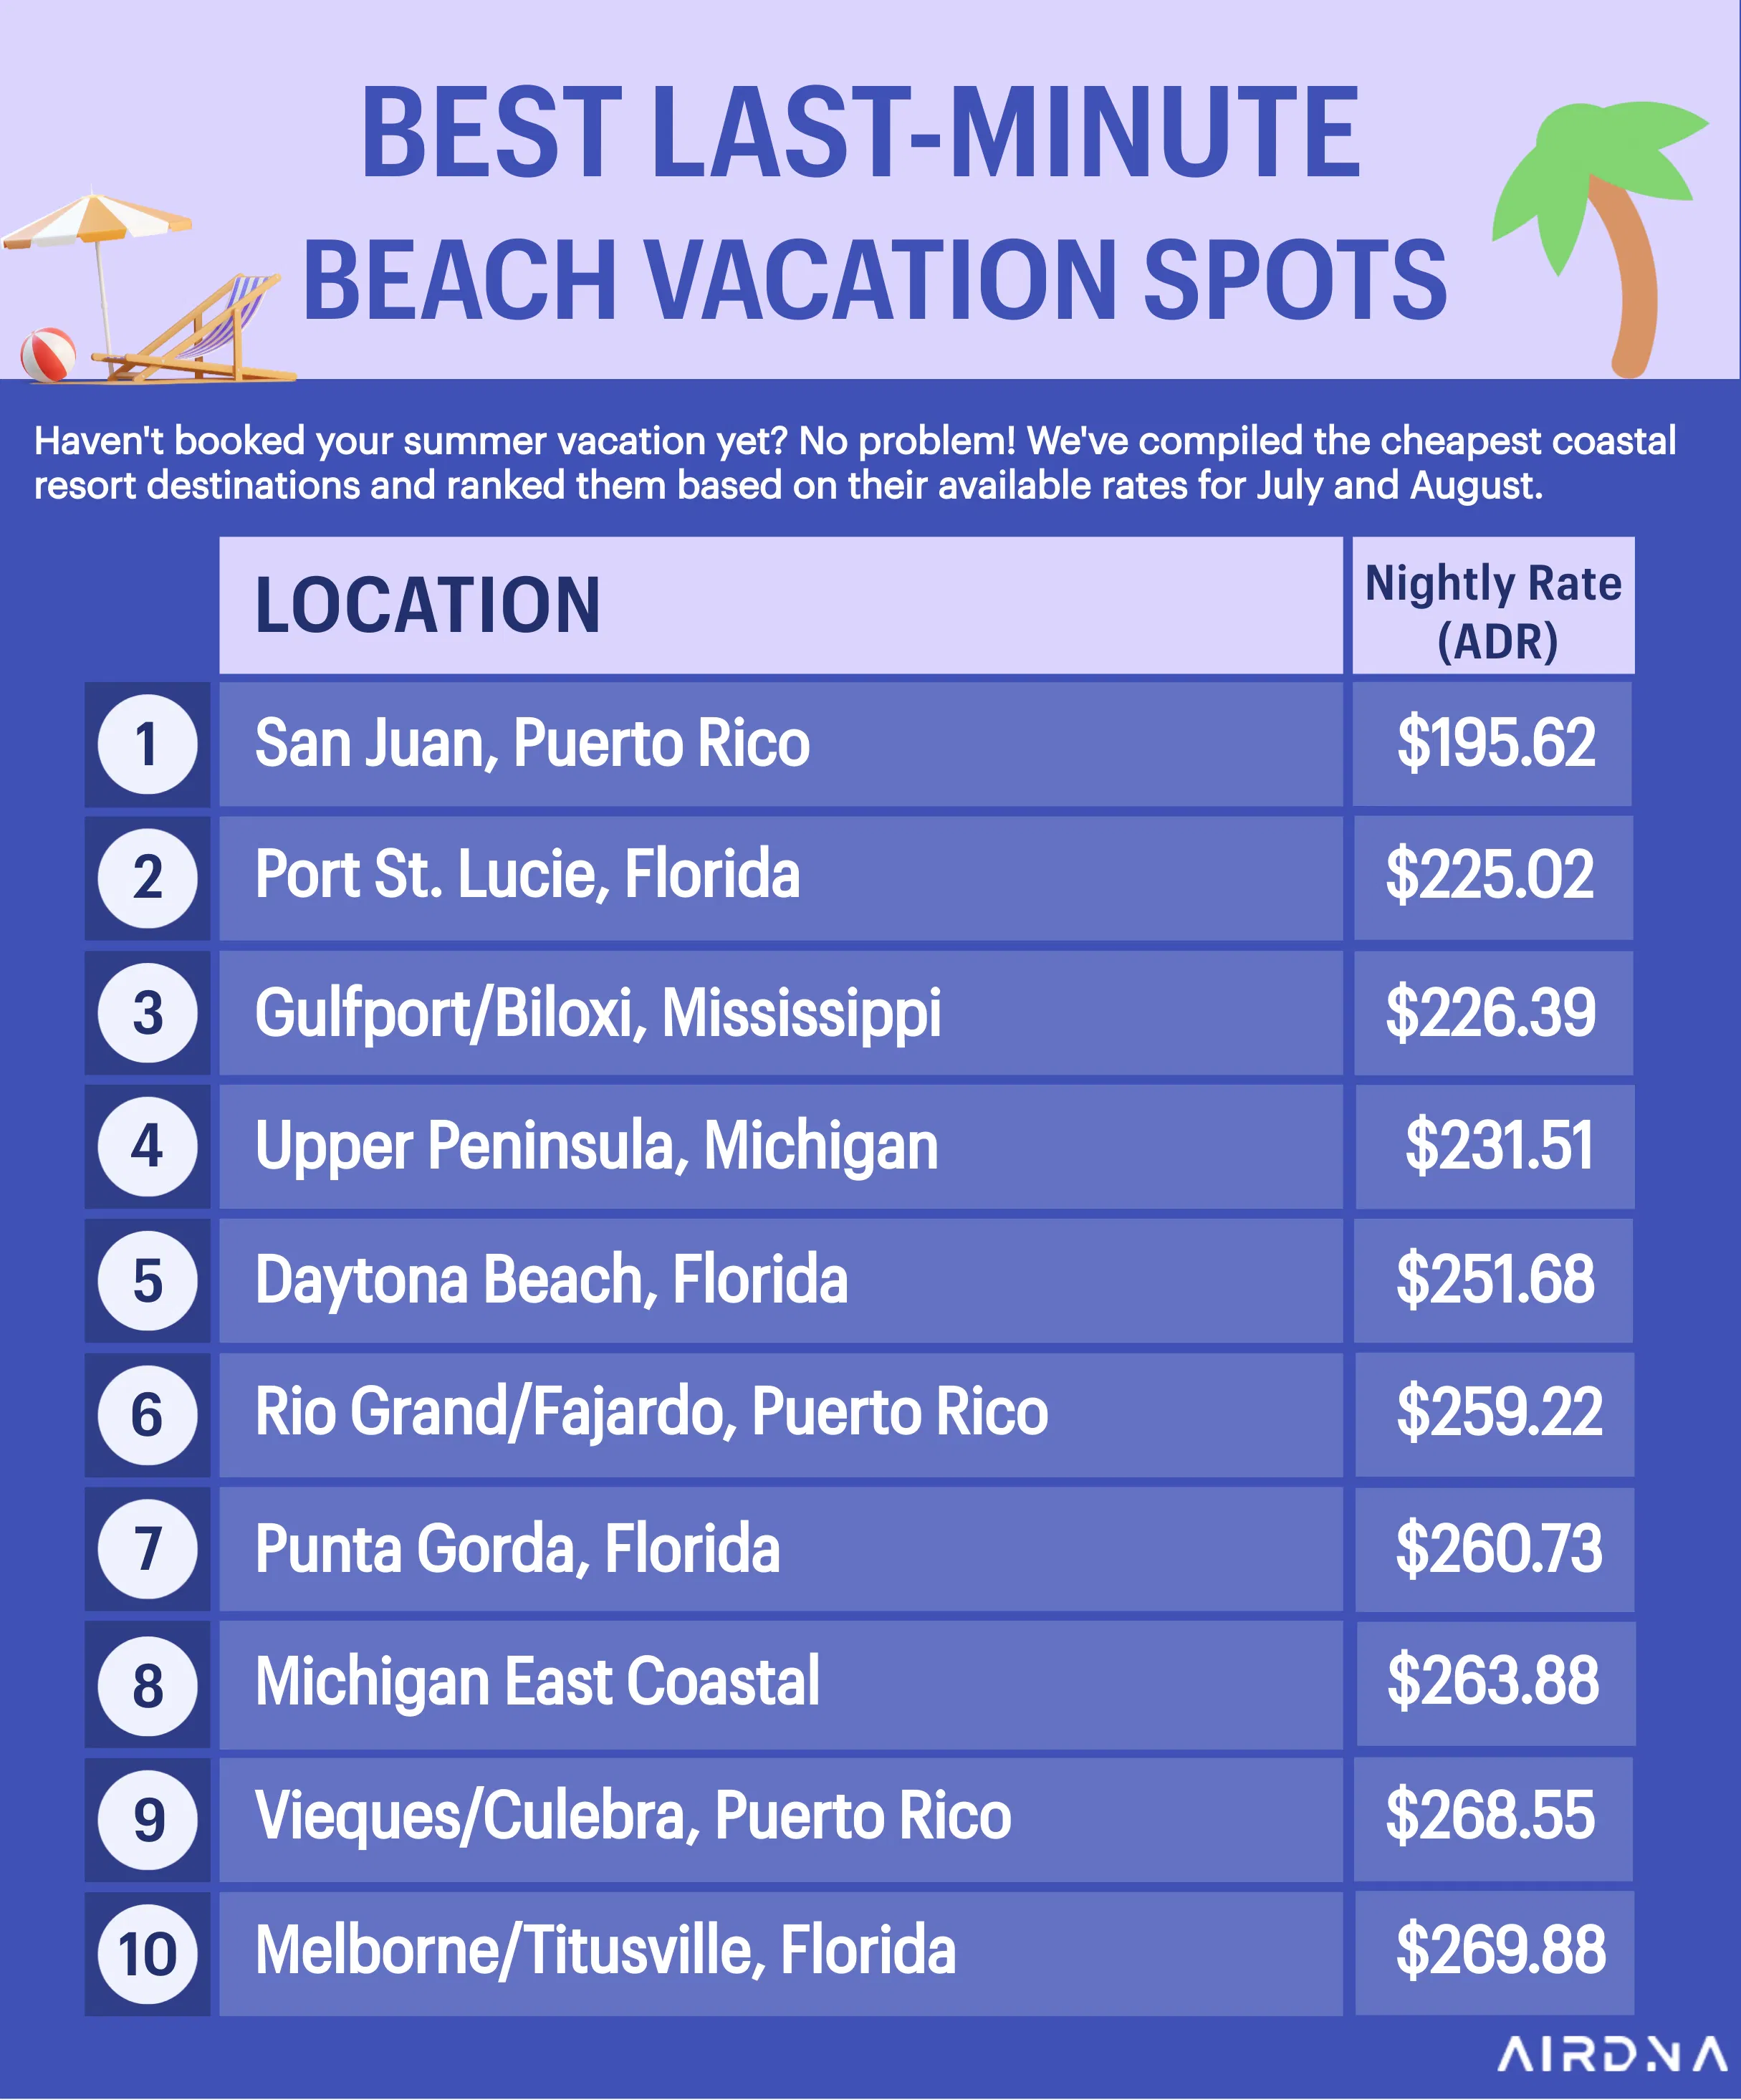
Don’t worry if you haven’t booked your summer vacation yet! Our data shows the top 15 coastal markets in the US with the lowest rates available for July and August, aggregated. While many operators in these areas have increased their rates compared to last year, Daytona stands out with rates down 14.8% YOY, offering great value. On the other hand, San Juan and Port St. Lucie have seen significant rate increases (+16.8% and +12.3%, respectively) but still offer some of the lowest rates among coastal markets.
ARTICLE SUMMARY
May short-term rental (STR) performance highlights strong recovery and growth in the industry, driven by rising demand and increased summer bookings, particularly in coastal and rural areas. Despite challenges in urban markets due to high interest rates and stricter regulations, the overall trend points to a robust and promising summer season.
Bram Gallagher
AirDNA Director of Economics and Forecasting
Bram Gallagher is an Economist at AirDNA, specializing in uncovering insights that drive smarter short-term rental decisions. He put his Ph.D. in Economics from the University of Georgia to work researching and forecasting hotel data with CBRE prior to joining AirDNA, as well as teaching economics at a number of universities. In his spare time, Bram enjoys making wooden furniture with hand tools.
