


U.S. Market Review: Demand Accelerates with Big Booking Bump | AirDNA
Published: July 14, 2023
Last updated: May 5, 2026

Scott Sage
The busiest summer travel season yet for the short-term rental (STR) industry is well underway. With inflation cooling even as the labor market stays strong, more travelers stayed in an STR this past June than any June on record. STR hosts and operators also had cause for celebration, as the tremendous boom in STR supply seen in 2022 hasn’t rematerialized in 2023.
Inflation has been hurting operators both on the expense side, as basic supplies become more expensive, and on the revenue side, as consumers are increasingly price sensitive amid the increase in essentials such as rent and food. The good news is that the rate increases the Fed started last March, easing supply chain tensions, and wages that have remained stickier than other prices have helped inflation approach the target rate of 2% historically quickly.
According to the Bureau of Labor Statistics (BLS), inflation as measured by the year-over-year percent increase in the seasonally adjusted consumer price index slowed to 3.1% in June, down from 4.1% in May and only about a third of the 8.9% rate seen in June 2022. Although within striking distance of the 2% target inflation rate held by the Federal Reserve, the consensus among economists is that at least one more rate hike is in store.
The employment situation also remains strong, with June adding about 209,000 new jobs. This was below May’s 306,000 jobs but was still a healthy increase, and the unemployment rate dropped slightly, hovering around its lowest level since the late 1960s. In all, June economic data was unambiguously positive for the STR market, giving little reason for consumers to postpone holiday travel.
At a Glance: Key U.S. STR Performance Metrics for June 2023
- RevPAR fell 2.8% YOY to $201.18
- Available listings reached 1.53 million, up 15.2% YOY
- Total demand (nights) rose 9.7% YOY
- Occupancy was 1.8% lower YOY at 62.38% (+0.9% vs. 2019)
- Average daily rates (ADRs) fell 1% YOY to $322.51
- Nights booked increased 20% YOY
Occupancy has been declining on a YOY basis for the past 16 months as property-level performance returned to more sustainable levels after the highs seen in 2021. In June, this occupancy slide slowed to just 2.6% below last year.
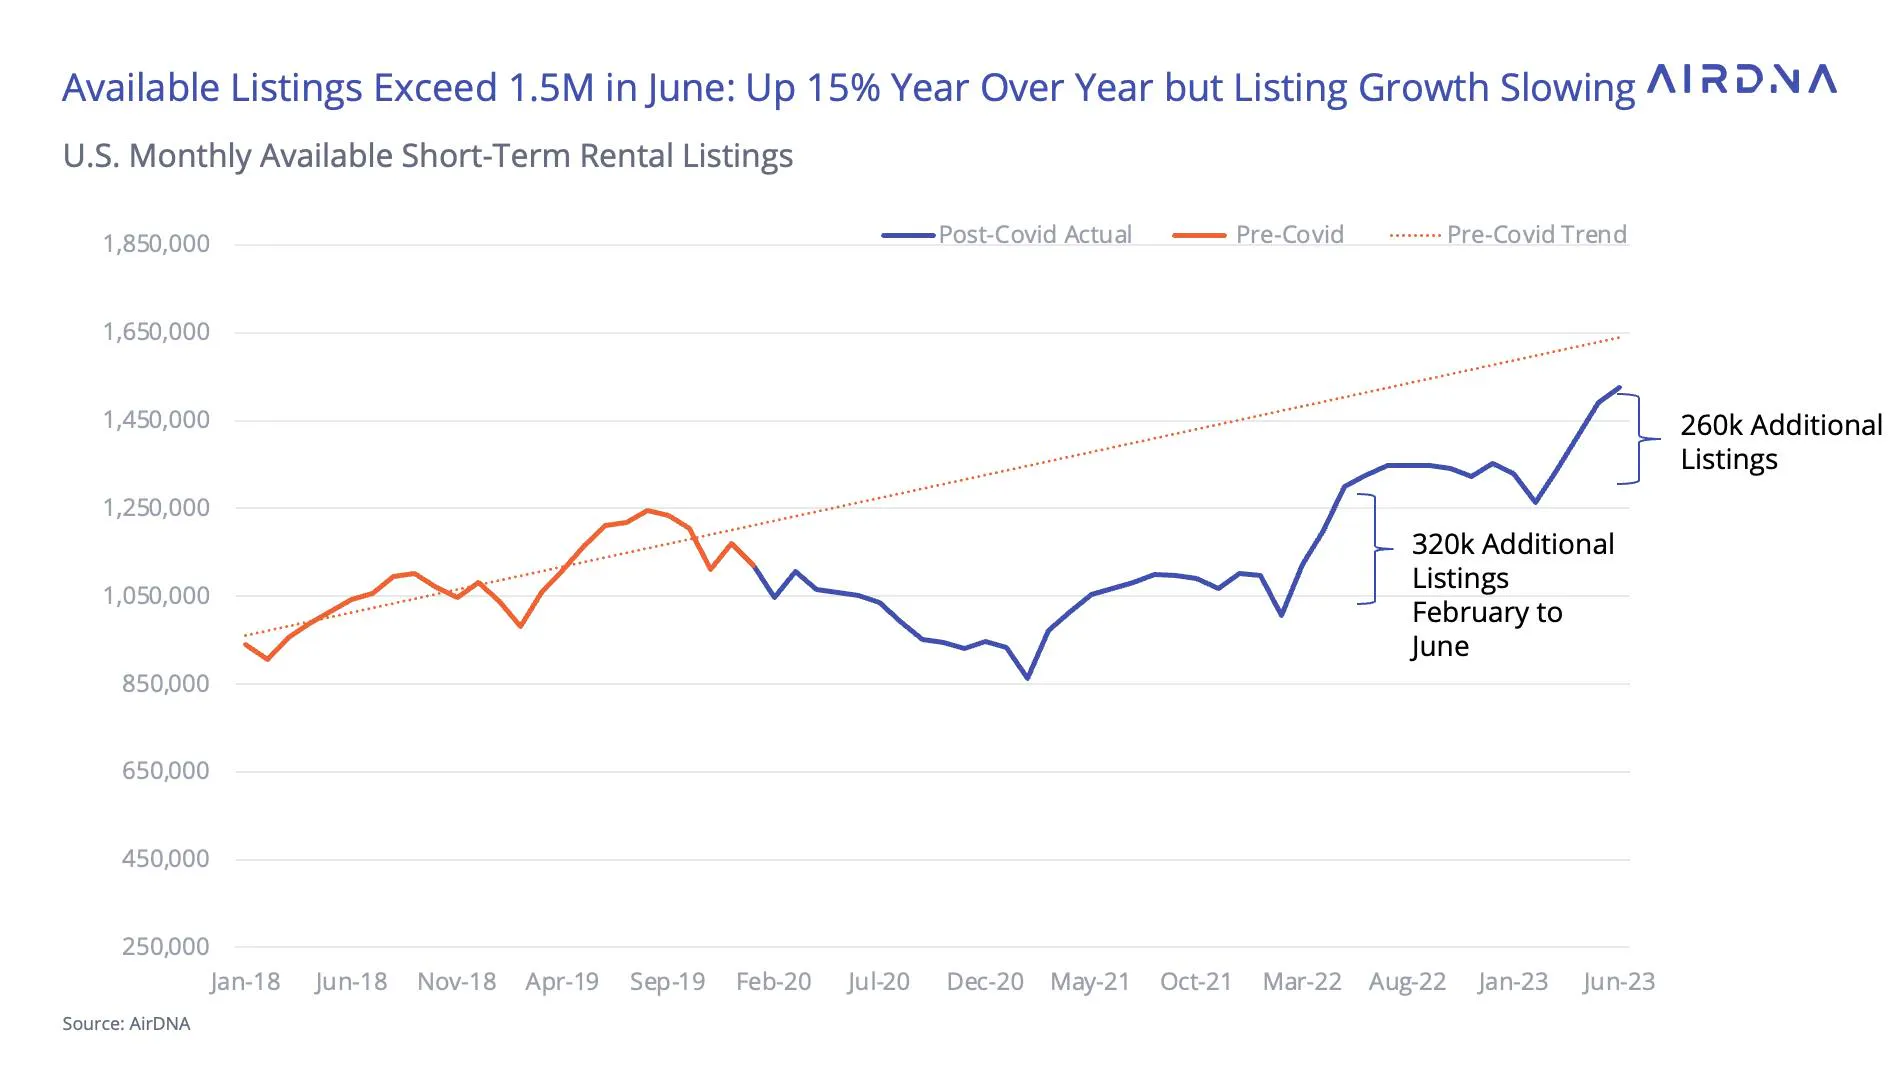
The occupancy rate decline was slowed by a combination of supply growth slowing in May and June from the frenetic pace of 2022, as high as 24.5% in some months, to a relatively moderate 14.8% YOY increase in May and a 15.2% YOY increase in June.

Available listings reach a seasonal low point in February, and increase towards the summer, following demand patterns. The number of additional available listings from February to now in 2023 is nearly 20% less than in 2022. Historically, significant additions to available listings occur between February and July as hosts prepare for the summer travel season. Listing counts generally stay steady after that point until the following year. Although June’s available listings pushed the closest to the pre-COVID linear trend level, at about 150,000 listings shy of the pre-pandemic trend, we expect this gap to widen until next year.
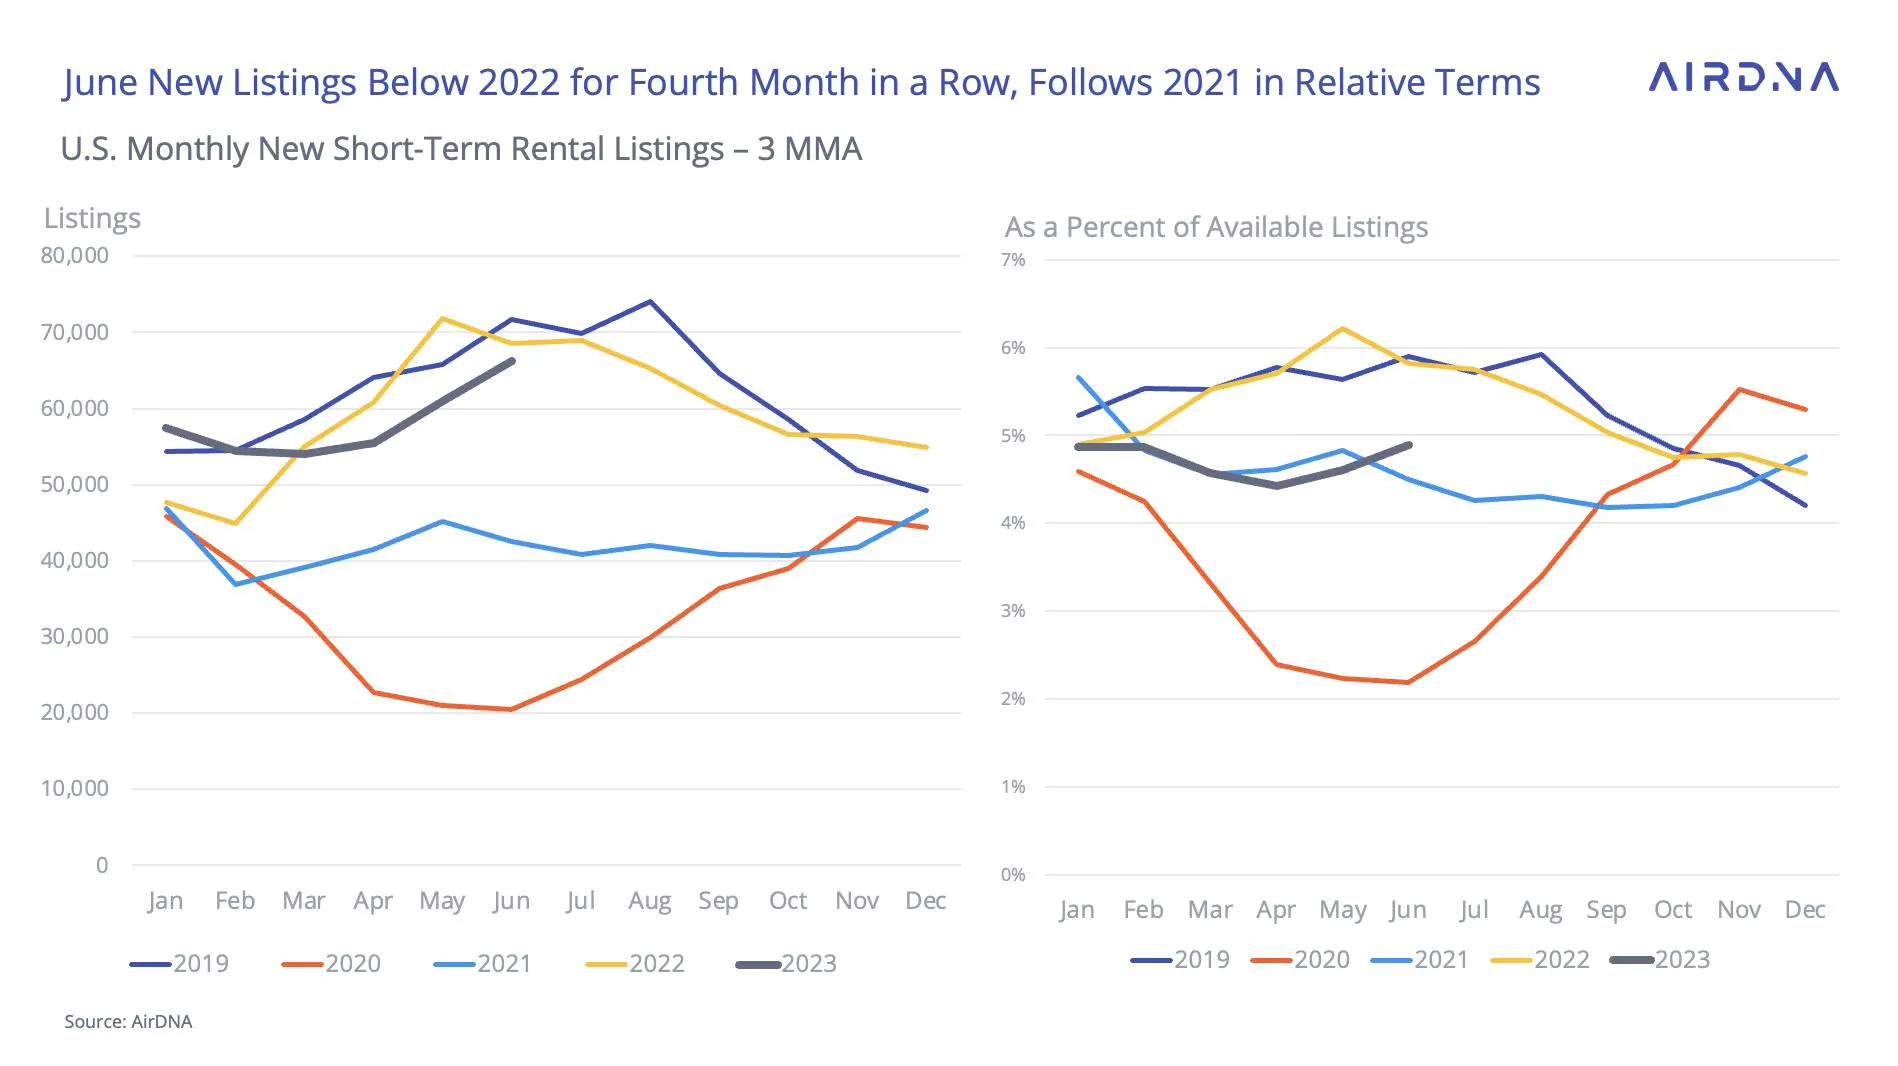
New listings coming online are following a slower pace from the highs of 2022 as well. For the past four months, there have been fewer new listings joining each month than last year. Furthermore, new listings in 2023 are following the path taken in 2021 much more closely rather than either 2022 or even in 2019.
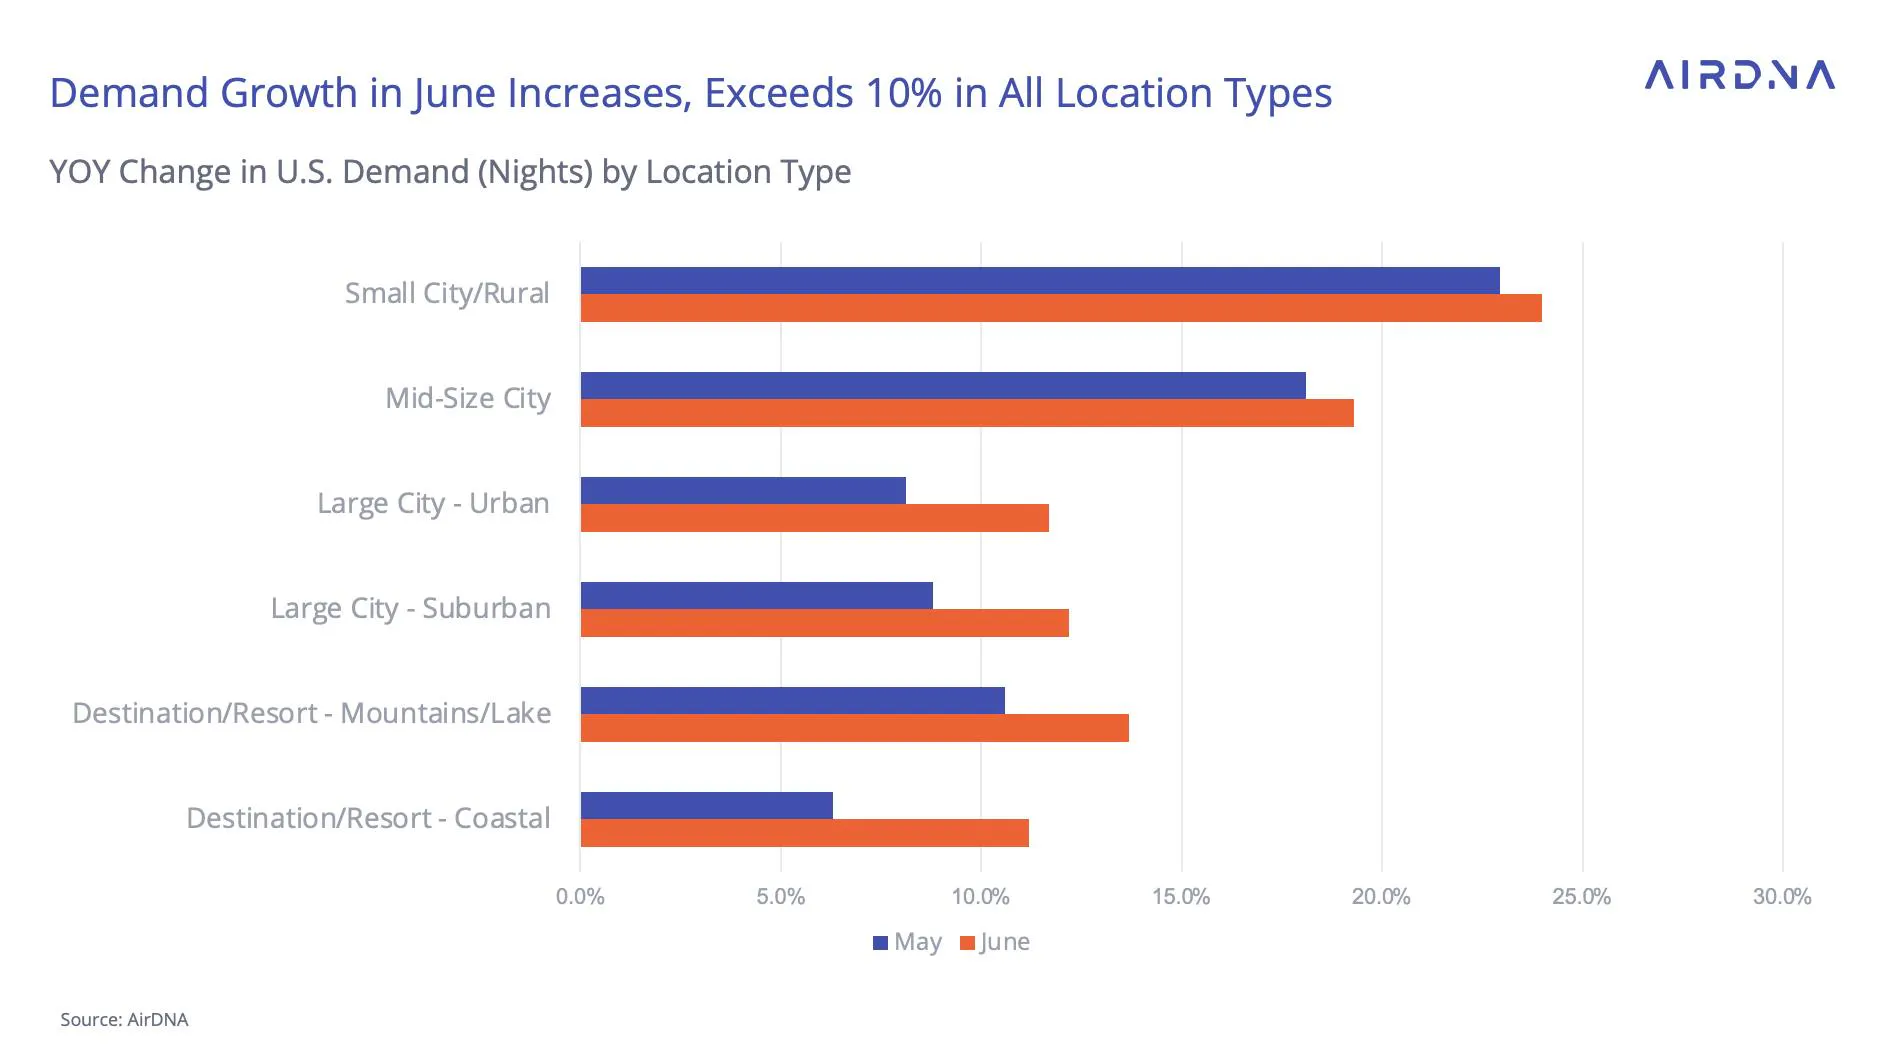
On the demand side of the occupancy calculation, the surge in new bookings seen in May translated into a reacceleration of demand in June with YOY growth of 9.7%, up from 5.3% in May. Moreover, the surge in new bookings for future travel continued in June, with YOY growth of 20%, up from 15.8% in May and 7.5% in April. If looming economic difficulties kept some guests from booking earlier in the year, the surprising strength in the economy encouraged them to make travel arrangements in June.

The reacceleration in demand occurred in all location types, and each location type saw demand growth in June of greater than 6% YOY, outpacing the predicted growth from what we saw in booking pace in previous months. Properties in small cities and rural locations as well as midsize cities experienced the fastest growth YOY in demand of 18.4% and 13.5%, respectively. Coastal resorts saw the largest acceleration, however, and quadrupled May’s growth rate of 1.7% to 8.3% in June.
Nationally, ADR fell 1% YOY on average, down from 0.7% in May. The spread between inflation and ADR widened slightly in June.

Unlike demand growth, every location type saw a slower pace of ADR growth compared to a month earlier. Large City-Urban areas saw the largest drop, falling from 2.9% YOY growth in May to 0.2% in June.

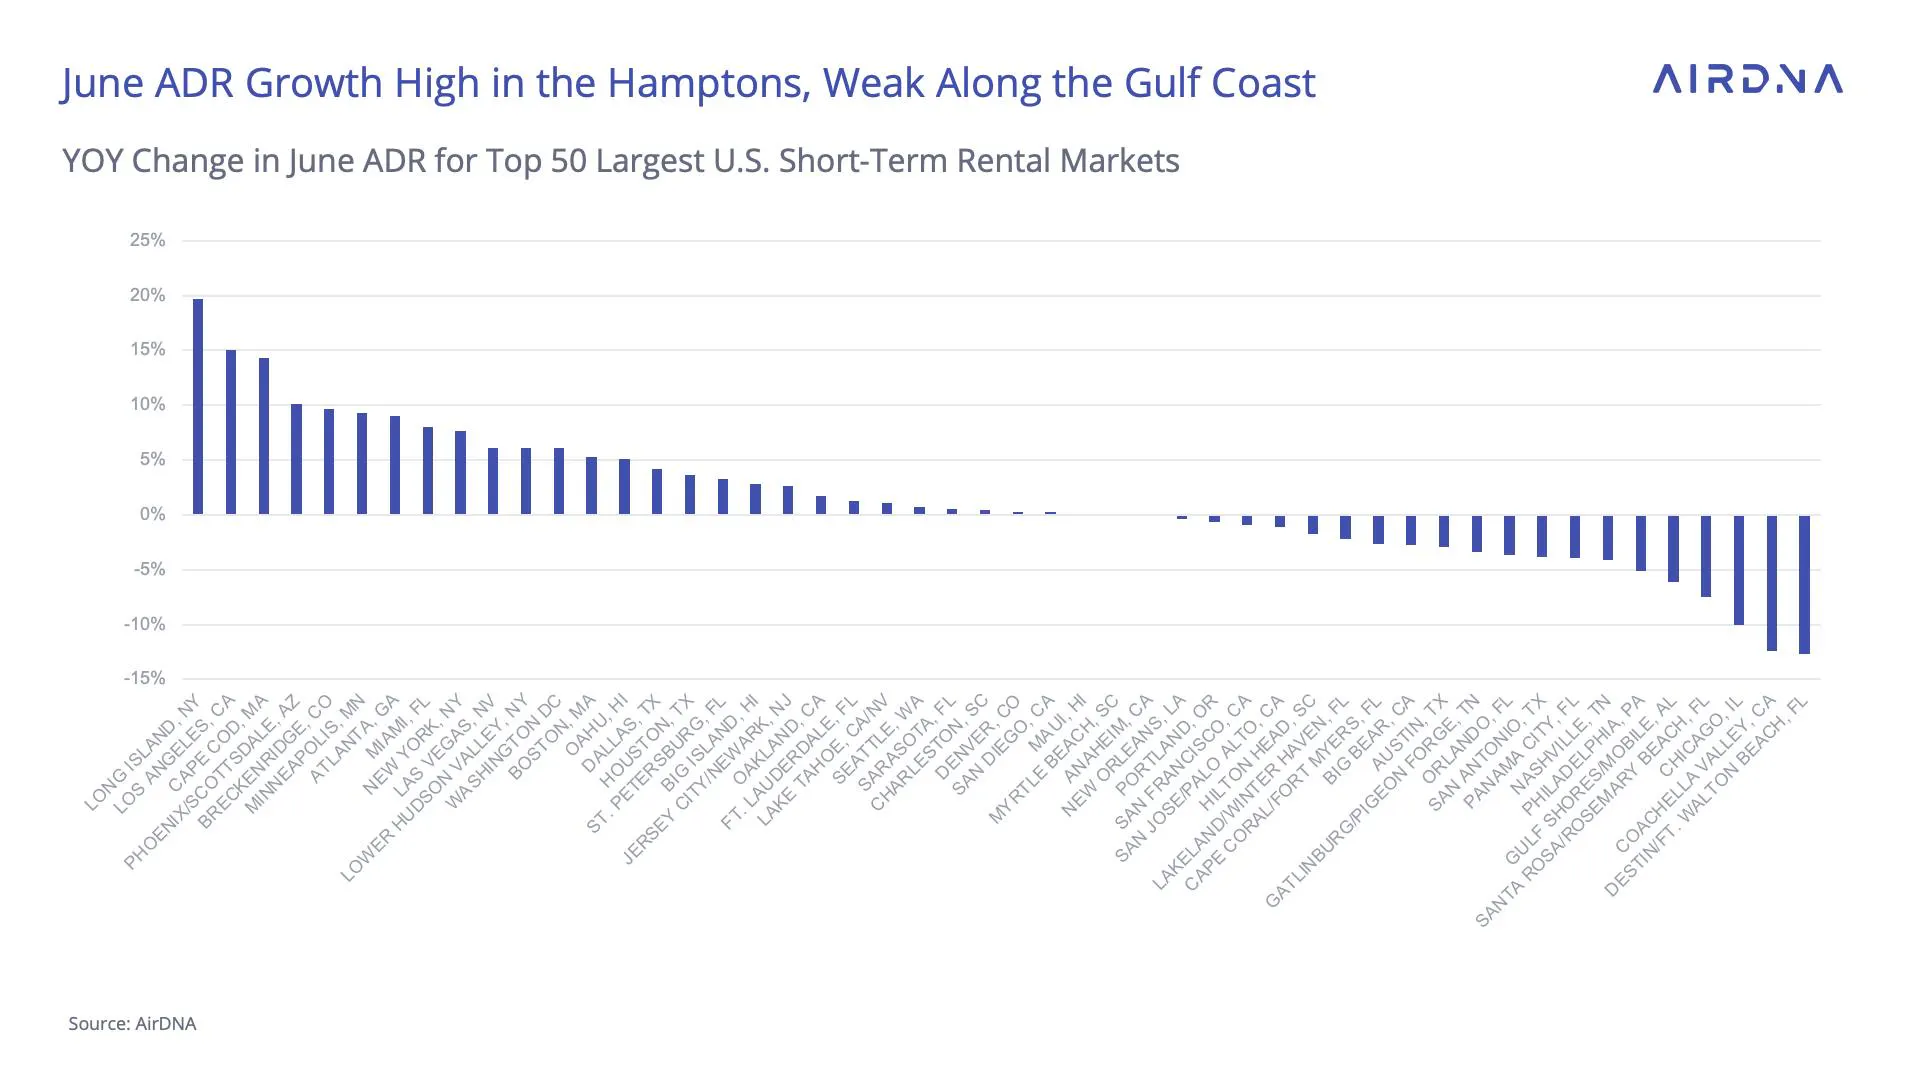
When examining the top 50 markets, the weakness in coastal locations is particularly pronounced on the Gulf coast, with many summer holiday mainstays such as Panama City (-3.9), Destin/Fort Walton Beach (-12.6%), Santa Rosa/Rosemary Beach (-7.5), all Florida, and Gulf Shores/Mobile (-6.1%), Alabama, seeing decreases in ADRs. However, St. Petersburg, Florida, is a notable exception, seeing growth of 3.3% YoY. Competition from international destinations thanks to the strong dollar could be forcing hosts to lower rates in these typical vacation destinations.
On the other hand, topping the ADR growth rankings are high-end Northeastern coastal resorts Long Island and Cape Cod, with ADR growth of 19.7% and 14.3% YOY, respectively. Large cities Los Angeles (15.0%) and Phoenix (10.1%) also had high ADR growth, which was especially notable as these markets also experienced very high listing growth of 23.4% and 33.5% YOY, respectively, suggesting that a changing mix of home sizes and quality in the market might be impacting ADRs.
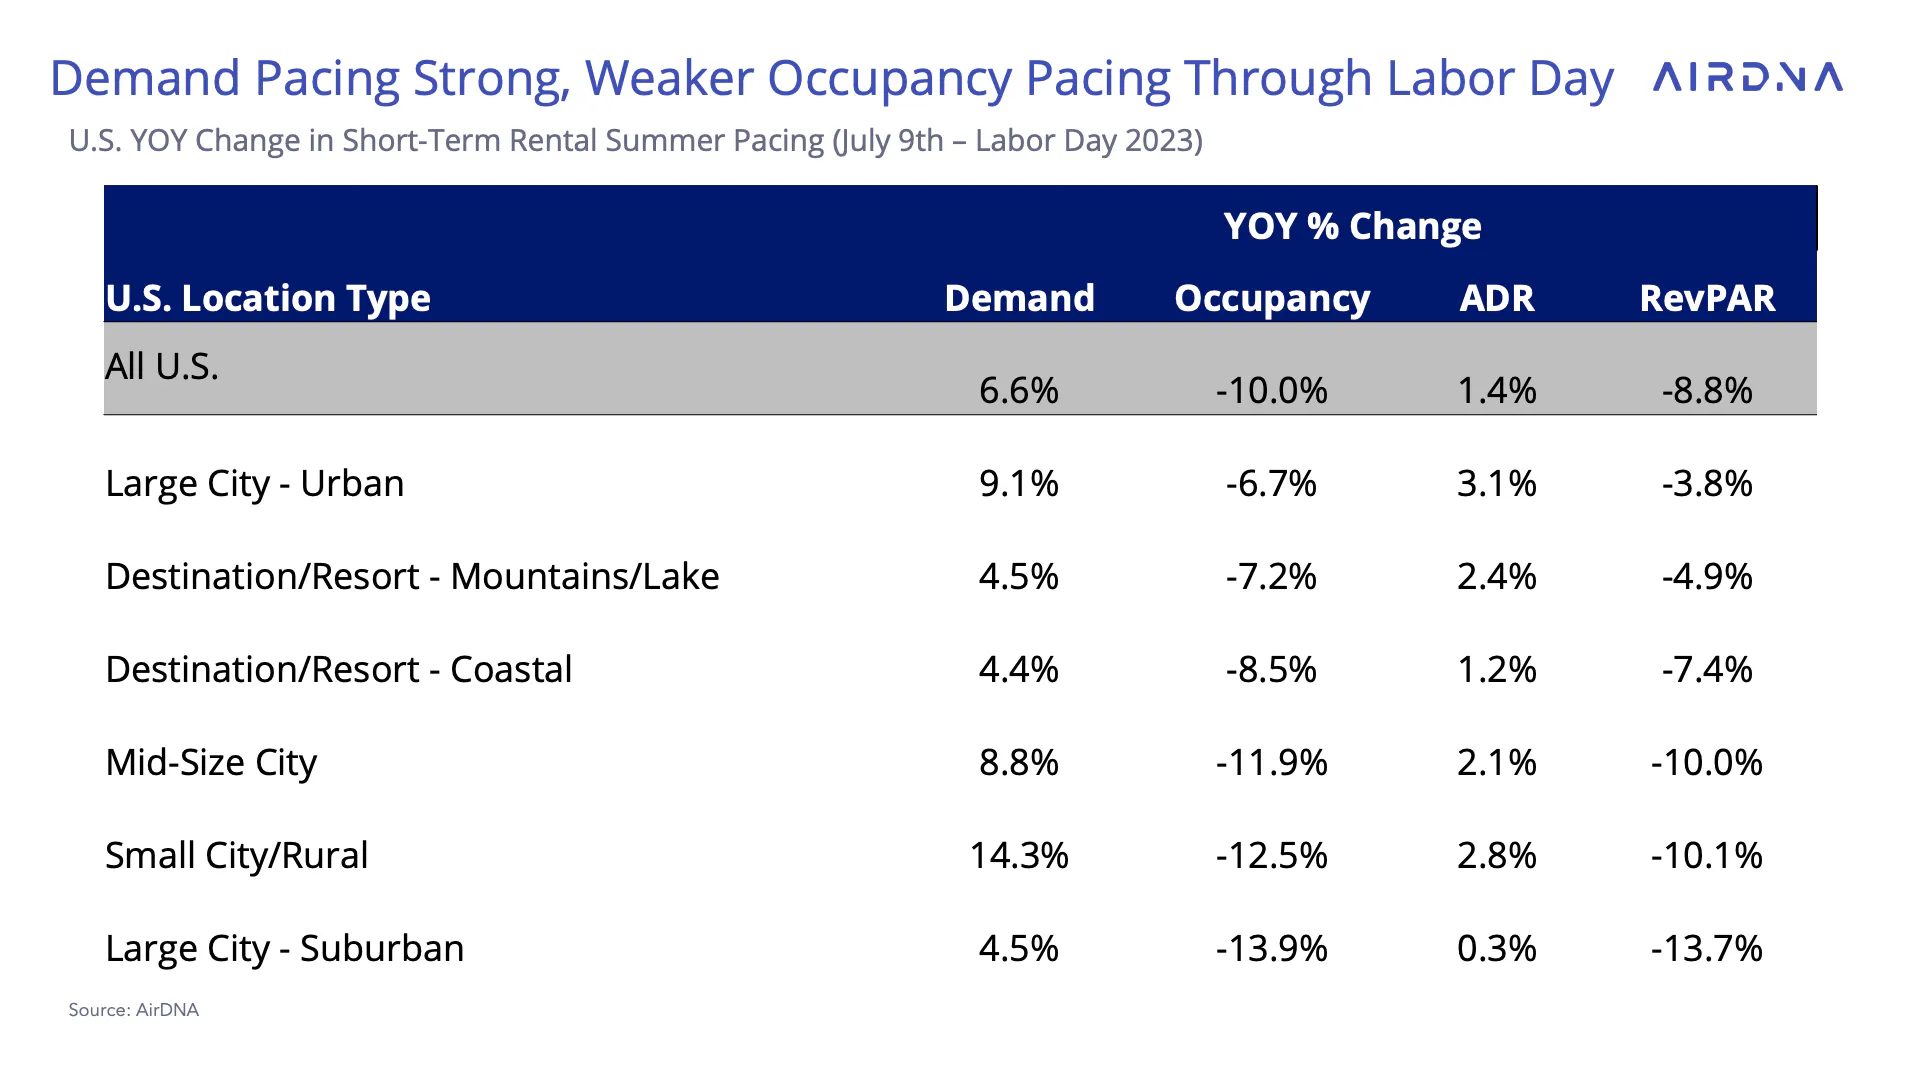
With the uptick in bookings over the past two months, we have seen a steady increase in pacing trends for the back half of the summer and moving into fall. For the rest of summer, through Labor Day, demand is pacing 6.6% higher than at the same time in 2022. However, demand is not pacing as high as the uptick in the number of available listings, pushing occupancy levels down further, with the biggest declines in small and midsize cities.
ADR growth will continue to moderate, pacing up 1.4% for the rest of summer, matching the 1.5% growth rate in June. If pacing holds, hosts will earn about 8.8% lower revenue per available rental night (RevPAR).
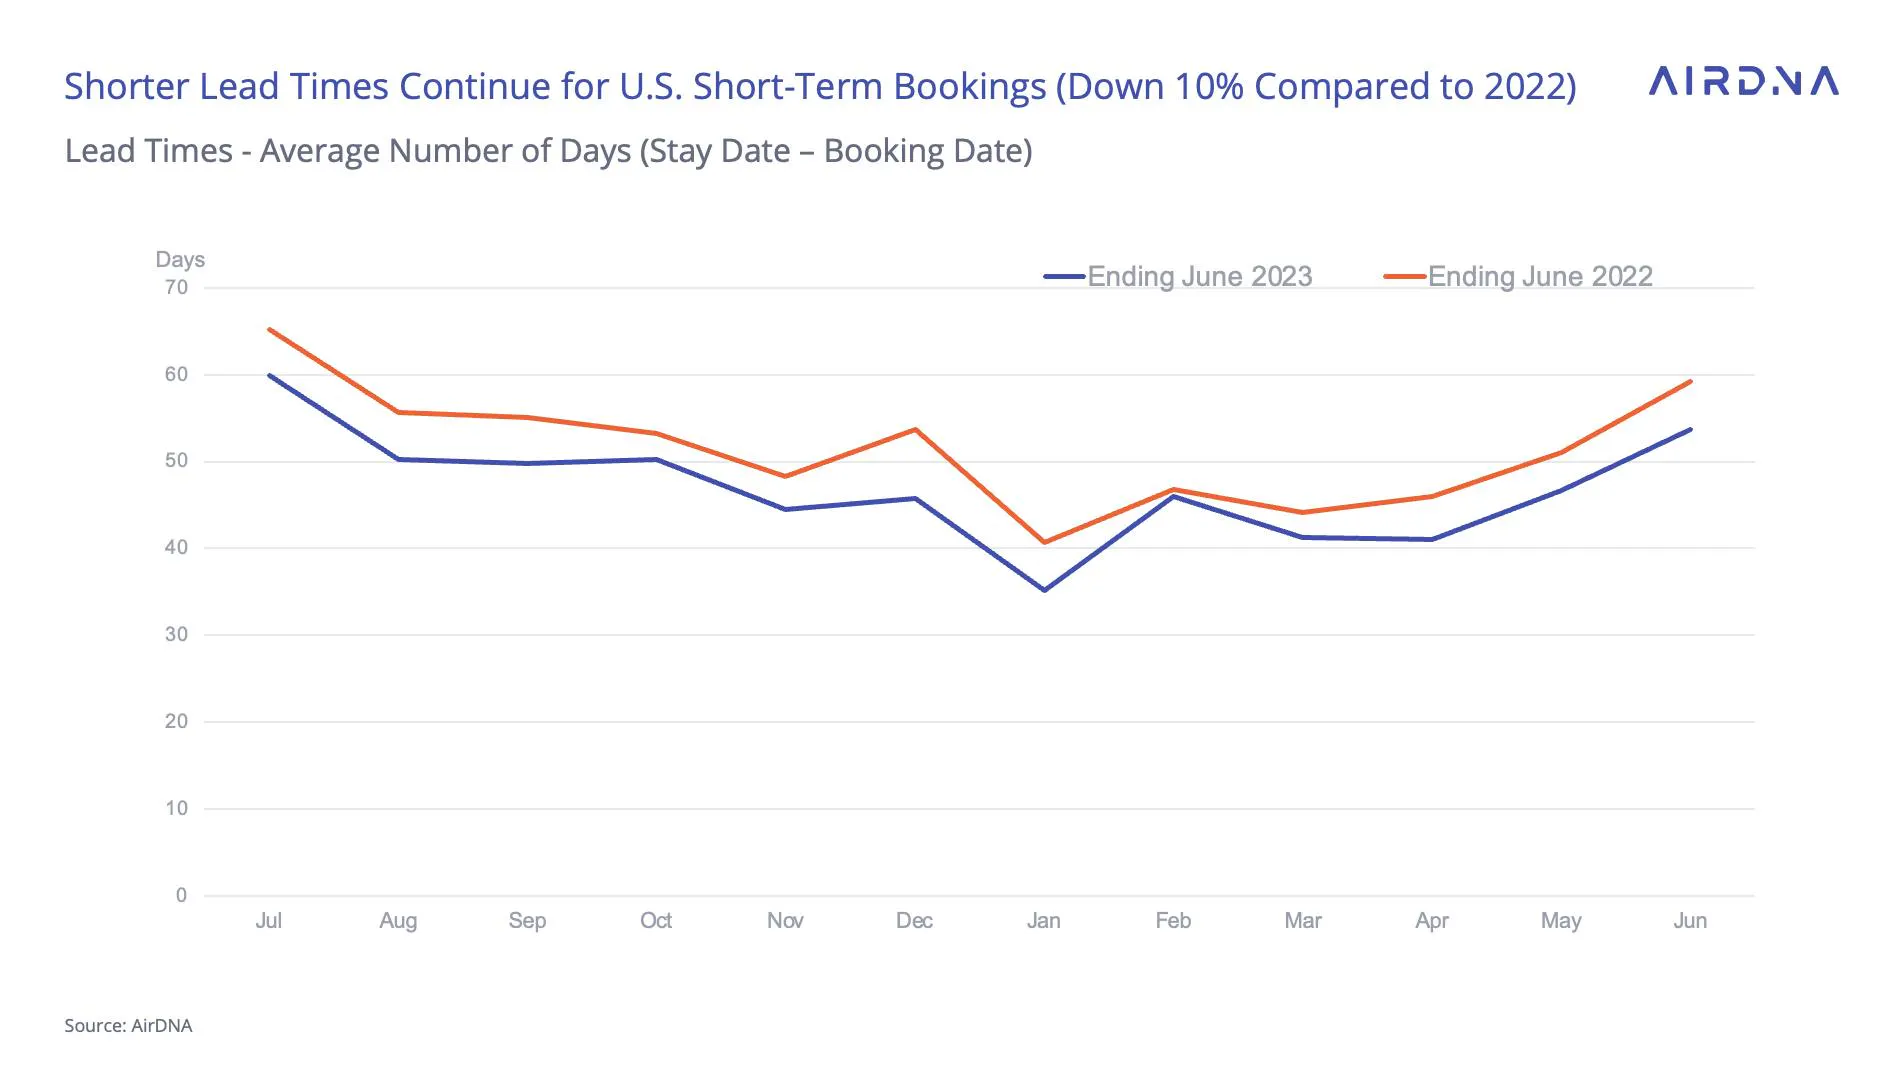
That said, we expect both demand and occupancy to end the summer meaningfully higher than how they are pacing now. This is primarily because of a shorter booking window than last summer and lead times shrinking. Simply put: guests are booking more last-minute. The average lead time for a stay in June fell from 54 days in 2022 to just 44 days in 2023, a 9.3% decrease. With fewer people booking far out in advance and more bookings coming in last minute, as long as economic growth remains robust, we expect bookings to continue to roll in.
As part of our ongoing commitment to accuracy, we continuously implement data methodology improvements, leading to updates to some of the information in this report as of December 20, 2023. For further questions, please contact us.
ARTICLE SUMMARY
U.S. short-term rental demand saw a boost in June, with last-minute bookings and strong economic performance encouraging more guests to stay in a vacation rental this summer.
Scott Sage
Senior Vice President, Marketing & Customer Experience
Scott is an Airbnb Superhost and industry pro, having founded Home Base BnBs—a short term rental management company that scaled to 200+ units. Scott combines his experience and passion for hosting to empower AirDNA customers' success. When he's not thinking about STRs, he is hiking, playing basketball, or playing pickleball.
