U.S. Review August 2025: RevPAR Hits All-Time High Despite Occupancy Dip
Published: September 15, 2025
Last updated: October 30, 2026

Bram Gallagher
Key Takeaways:
- August marked record highs for both monthly RevPAR ($237.08 in July) and the trailing twelve-month average RevPAR ($172.69), even as occupancy dipped slightly year-over-year.
- Available listings climbed to an all-time high of 1.79 million, with ADR growth of 4.7% driving most of the revenue gains.
- Demand accelerated for the second straight month, led by resort markets, while large and mid-size cities continued to struggle with softer international and business travel demand.
August closed out a summer that, on paper, looked modest, with demand and supply both growing between 3–5% and occupancy slightly down year-over-year.
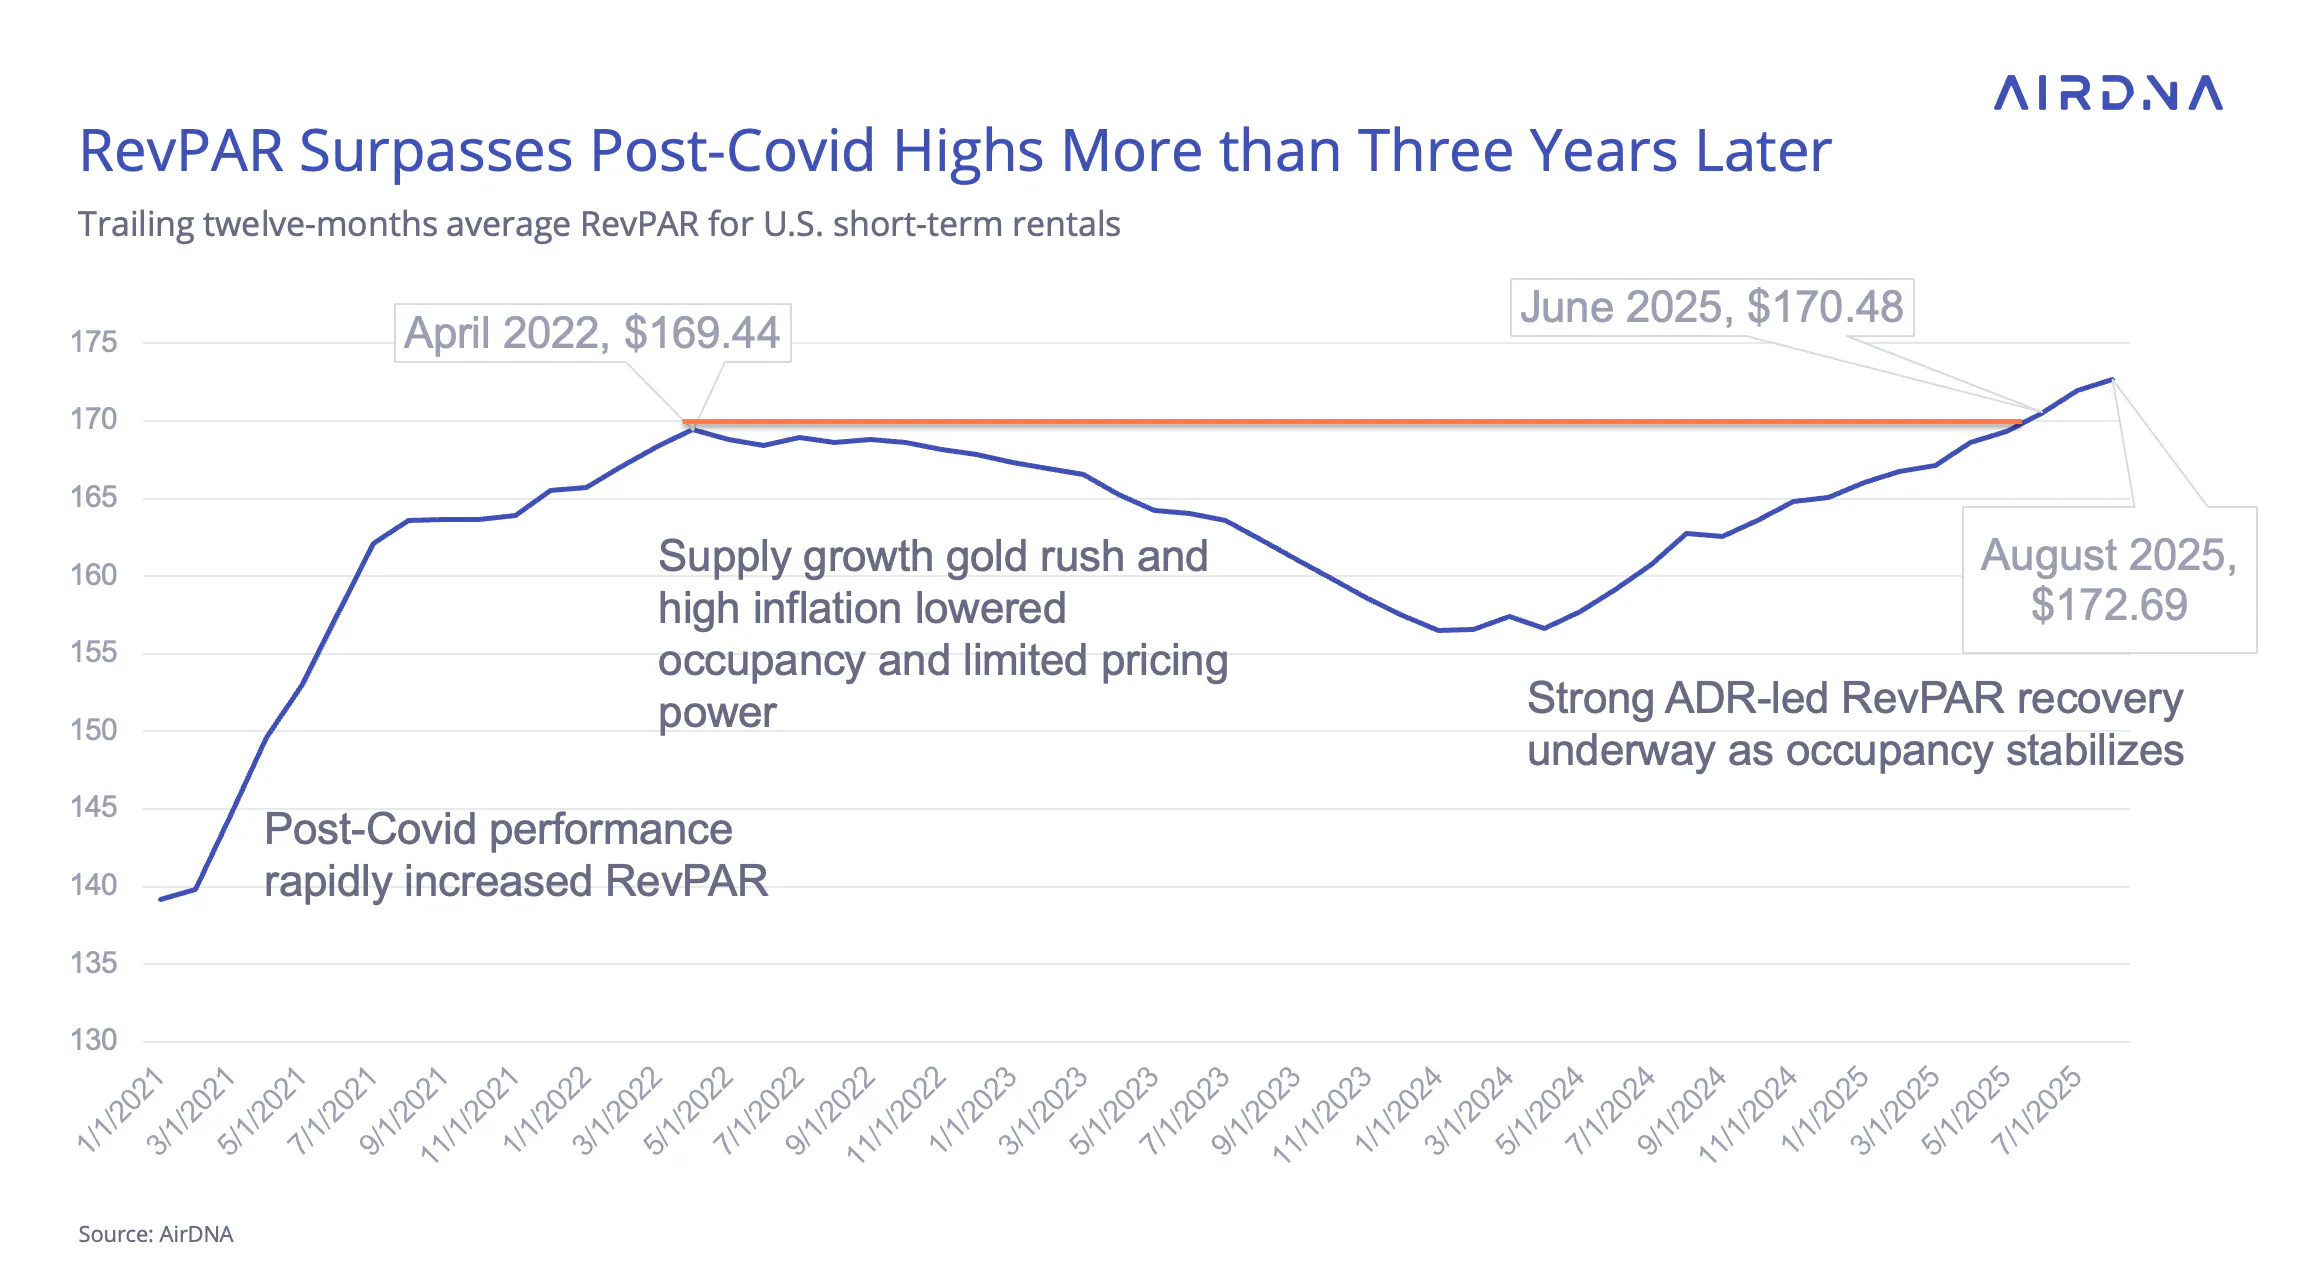
Yet, two milestones made this season remarkable. July set a new all-time monthly revenue per available rental (RevPAR) record at $237.08, surpassing the previous July 2021 peak of $230.87 during the post-Covid short-term rental (STR) boom. In August, the trailing twelve-month average RevPAR also reached its highest level ever at $172.69. These records came even as available listings hit an all-time high of 1.79 million, meaning strong revenues were spread across more properties than ever before.
Still, the industry faces difficulties and headwinds. Modest summer demand growth and a weakening labor market (now looking more fragile than it did just a month ago) remain key risks heading into the fall.
Economic Outlook
Revisions to employment data continue to fuel speculation about earlier and more frequent rate cuts. The Bureau of Labor Statistics recently released comprehensive “benchmarking” revisions that lowered total employment by more than 900,000 jobs over the past year — roughly three times the size of a typical revision. This followed last month’s update, which erased an additional 250,000 jobs from recent months.
Although the unemployment rate remains little changed by these adjustments, the weaker job data has increased expectations that the Federal Reserve will cut rates at its September meeting, which will be the first cut of 2025. The immediate impact will likely be felt in short-term rates, though it may take longer to filter through to long-term borrowing costs such as mortgages.
Mortgage rates are already responding to a combination of rate expectations and a stalled housing market. According to Freddie Mac, 30-year mortgage rates dropped 200 basis points in August to 6.5%, which is the lowest level of 2025 so far. Lower rates should encourage renewed investment in STR properties, with supply tailwinds likely to strengthen further heading into 2026.
Rate cuts are expected to provide a broader economic boost, potentially improving household confidence and reigniting consumer spending, which has been largely stagnant through 2025. However, the Fed will remain cautious. Inflation climbed to 2.9% year-over-year in August, up from 2.7% the previous month, partly due to tariff-driven price pressures. Rising prices risk limiting discretionary spending, which could weigh on travel demand if they persist.
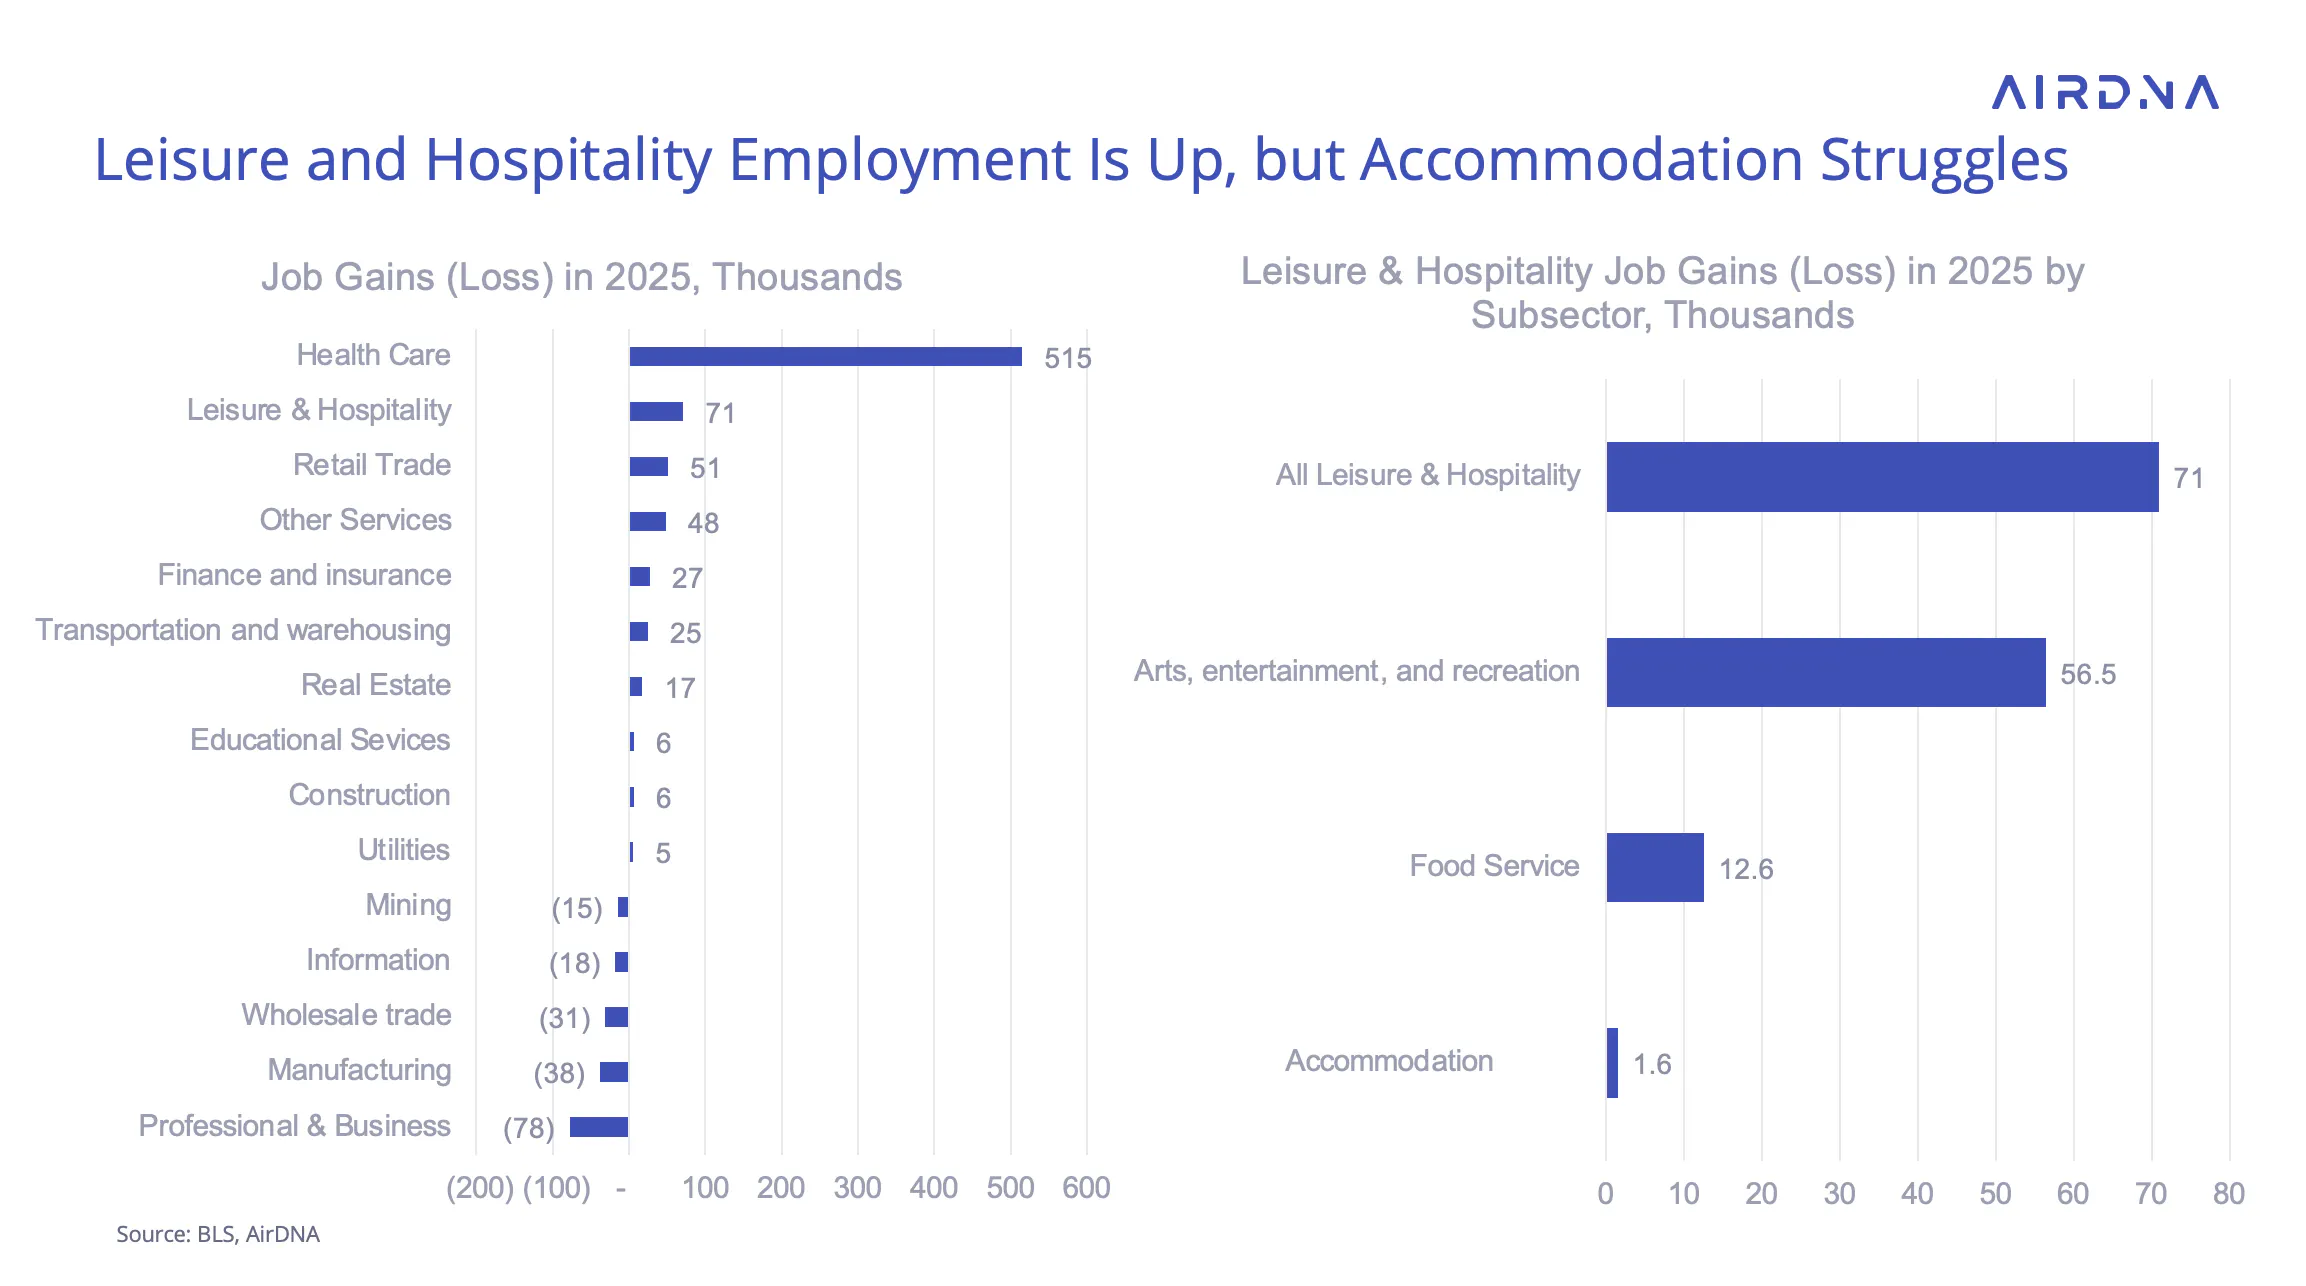
Job market trends also remain uneven. While Leisure and Hospitality continues to add jobs, most gains have been concentrated in “Arts, entertainment, and recreation,” which added 56,500 jobs in 2025. The “Accommodation” category (critical for STR demand) grew by only 1,600 jobs, highlighting slower recovery in that segment.
At a Glance: Key U.S. STR Performance Metrics for August 2025
- Revenue per Available Rental (RevPAR) increased 3.6% year-over-year (YOY) to $194.871
- Available listings reached 1.79 million, a 4.2% increase YOY
- Demand nights rose 4.1% compared to August 2024
- Occupancy averaged 58.6%, down 1.0% YOY
- Average Daily Rates (ADR) climbed to $332.46, up 4.7% from last year
- The Repeat Rent Index (RRI) rose 4.1% YOY
- Total nights booked were up 2.6% from August 2024.

Supply Growth Stays Under 5% For Now
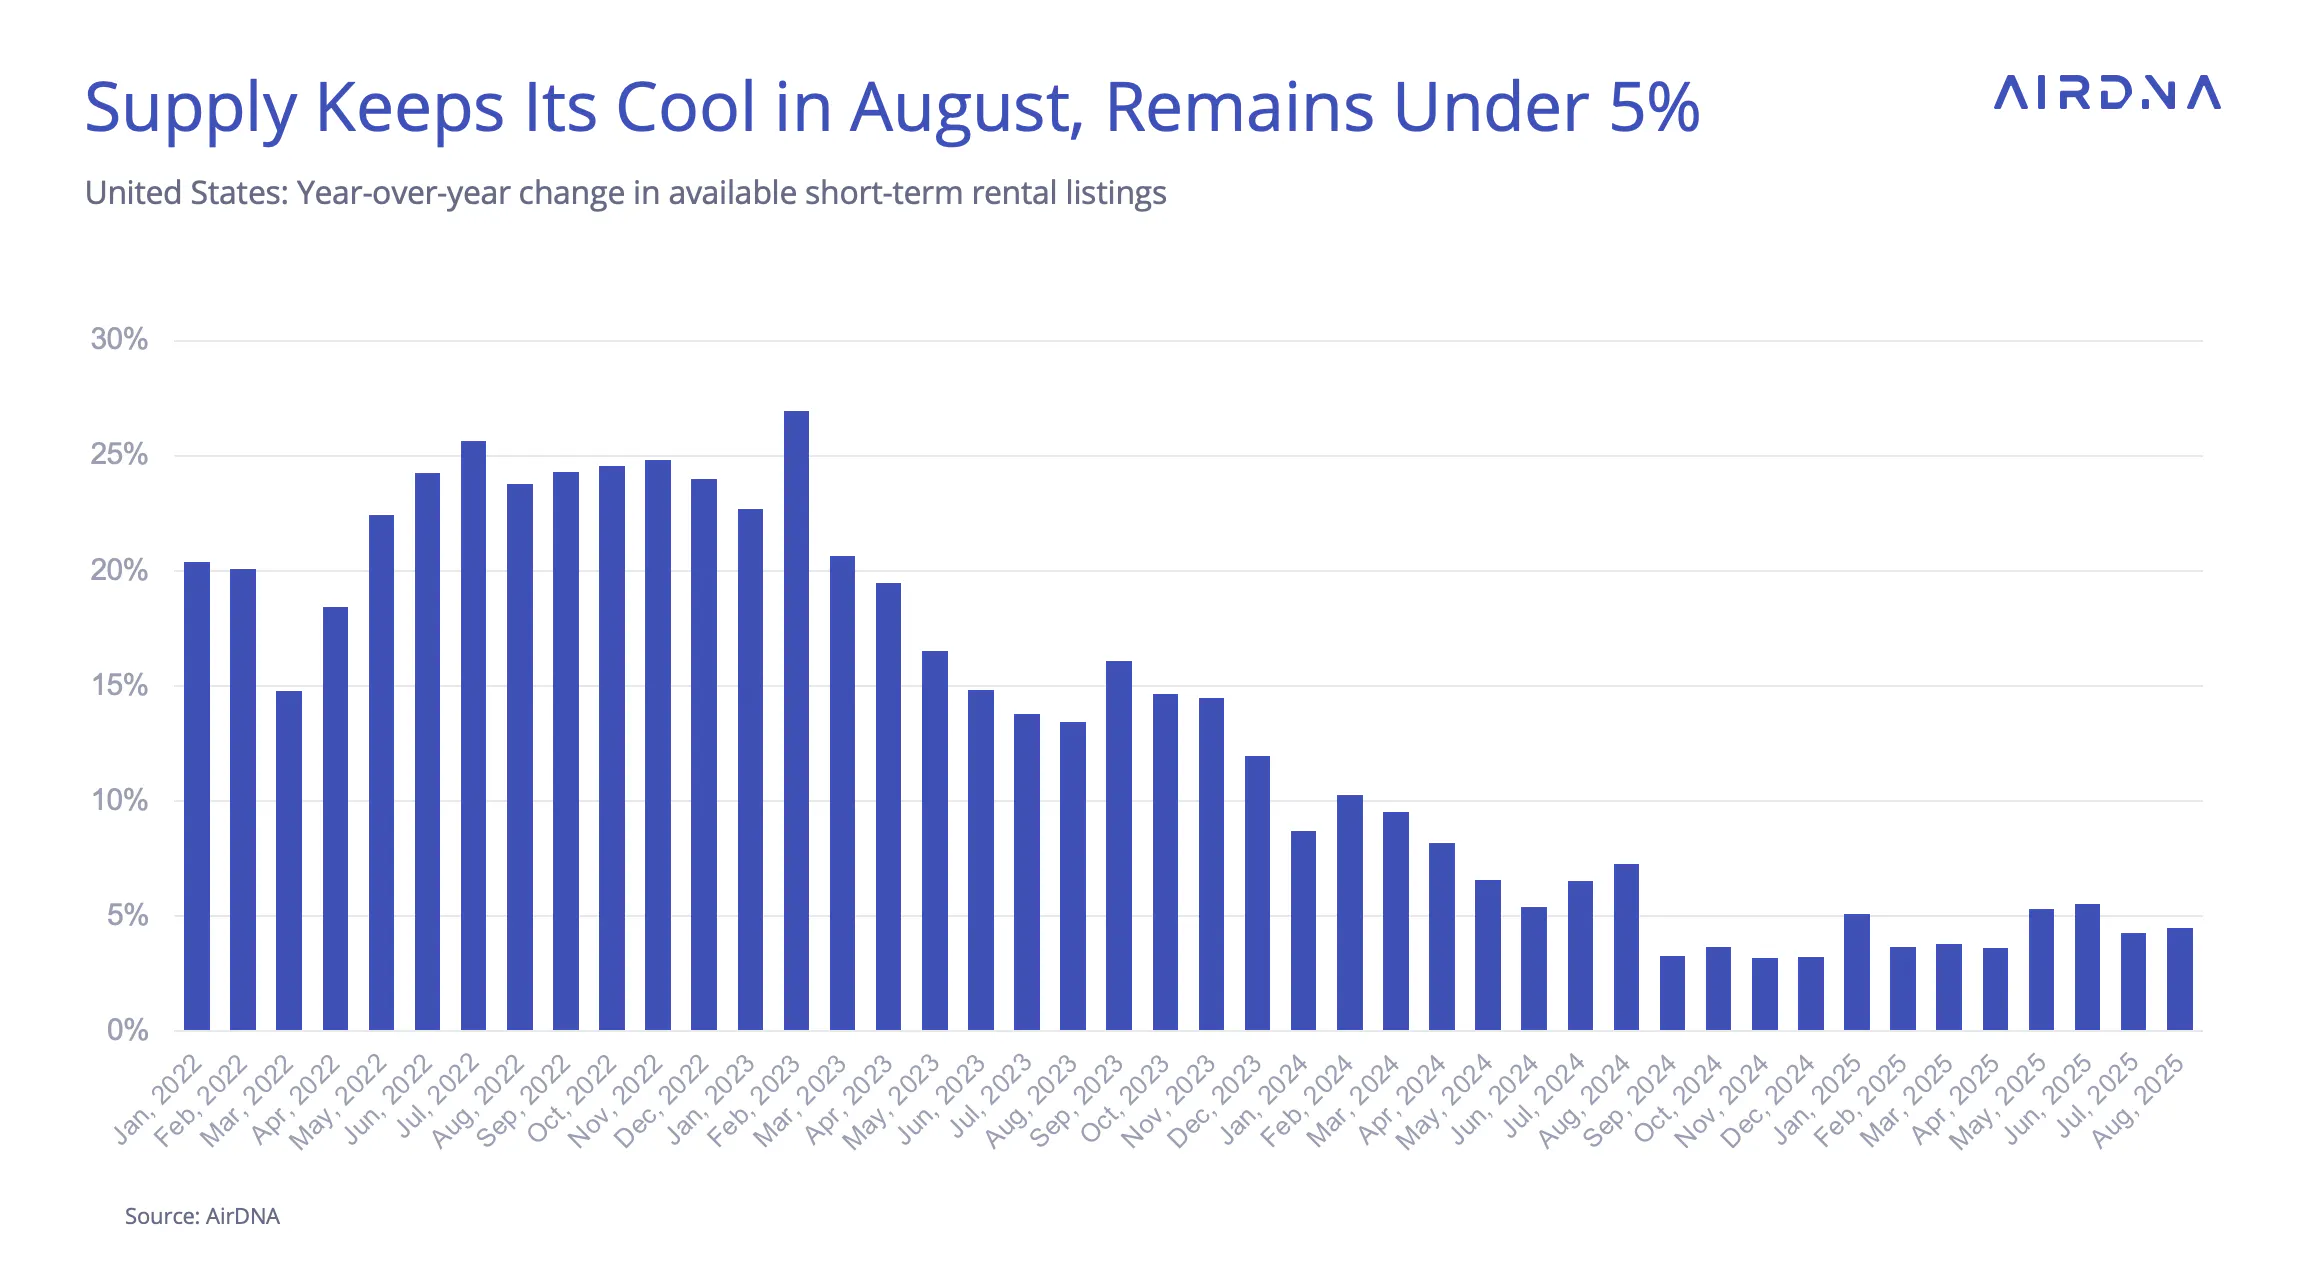
Available listings hit a new U.S. record in August, reaching 1.79 million. Despite this milestone, year-over-year listing growth remained modest at 4.5% – only slightly above July’s 4.3% and still below the 5% growth rates seen in May and June.
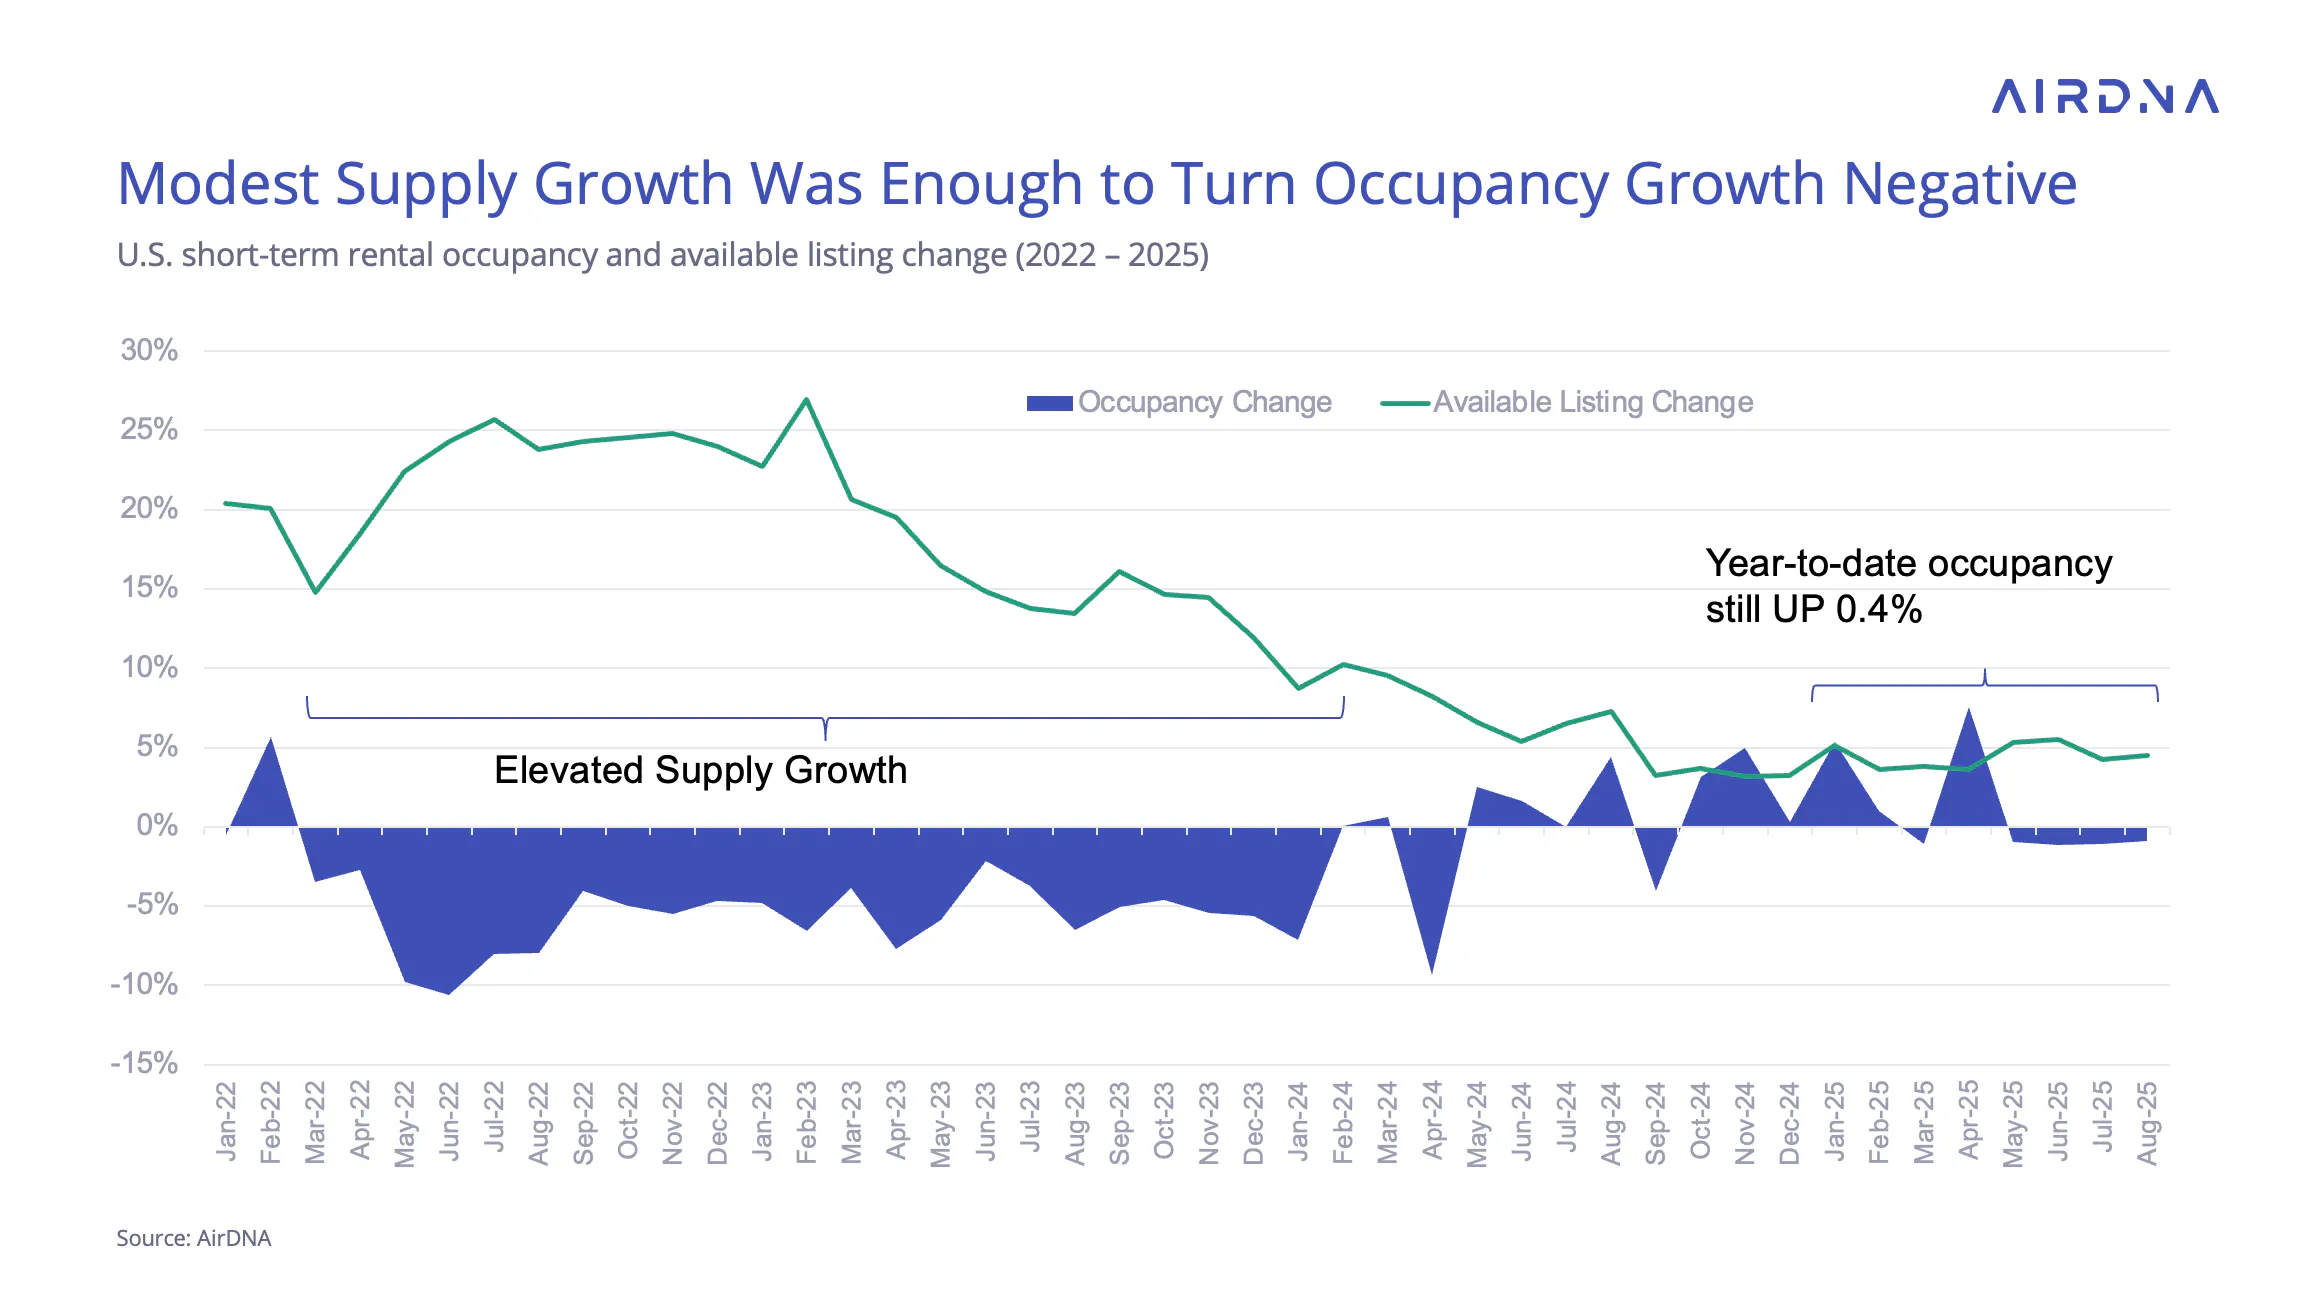
Those two months initially suggested a possible reacceleration in supply growth, which could have put pressure on unit-level performance. However, the slowdown in July and August kept occupancy declines limited to under 1%.
With downward revisions to employment data, a September Fed rate cut now appears almost certain. While short-term rates are expected to fall quickly, the effect on supply growth will take time to materialize. Mortgage rates dropped to 6.5% by the end of August, down from 6.7% in July. Part of this decline may reflect weaker demand for new mortgages as home prices remain elevated and transactions slow.
Compounding this, the process of purchasing a home and bringing it to market as a short-term rental often takes months, meaning supply pressures are more likely to build gradually, especially into 2026.
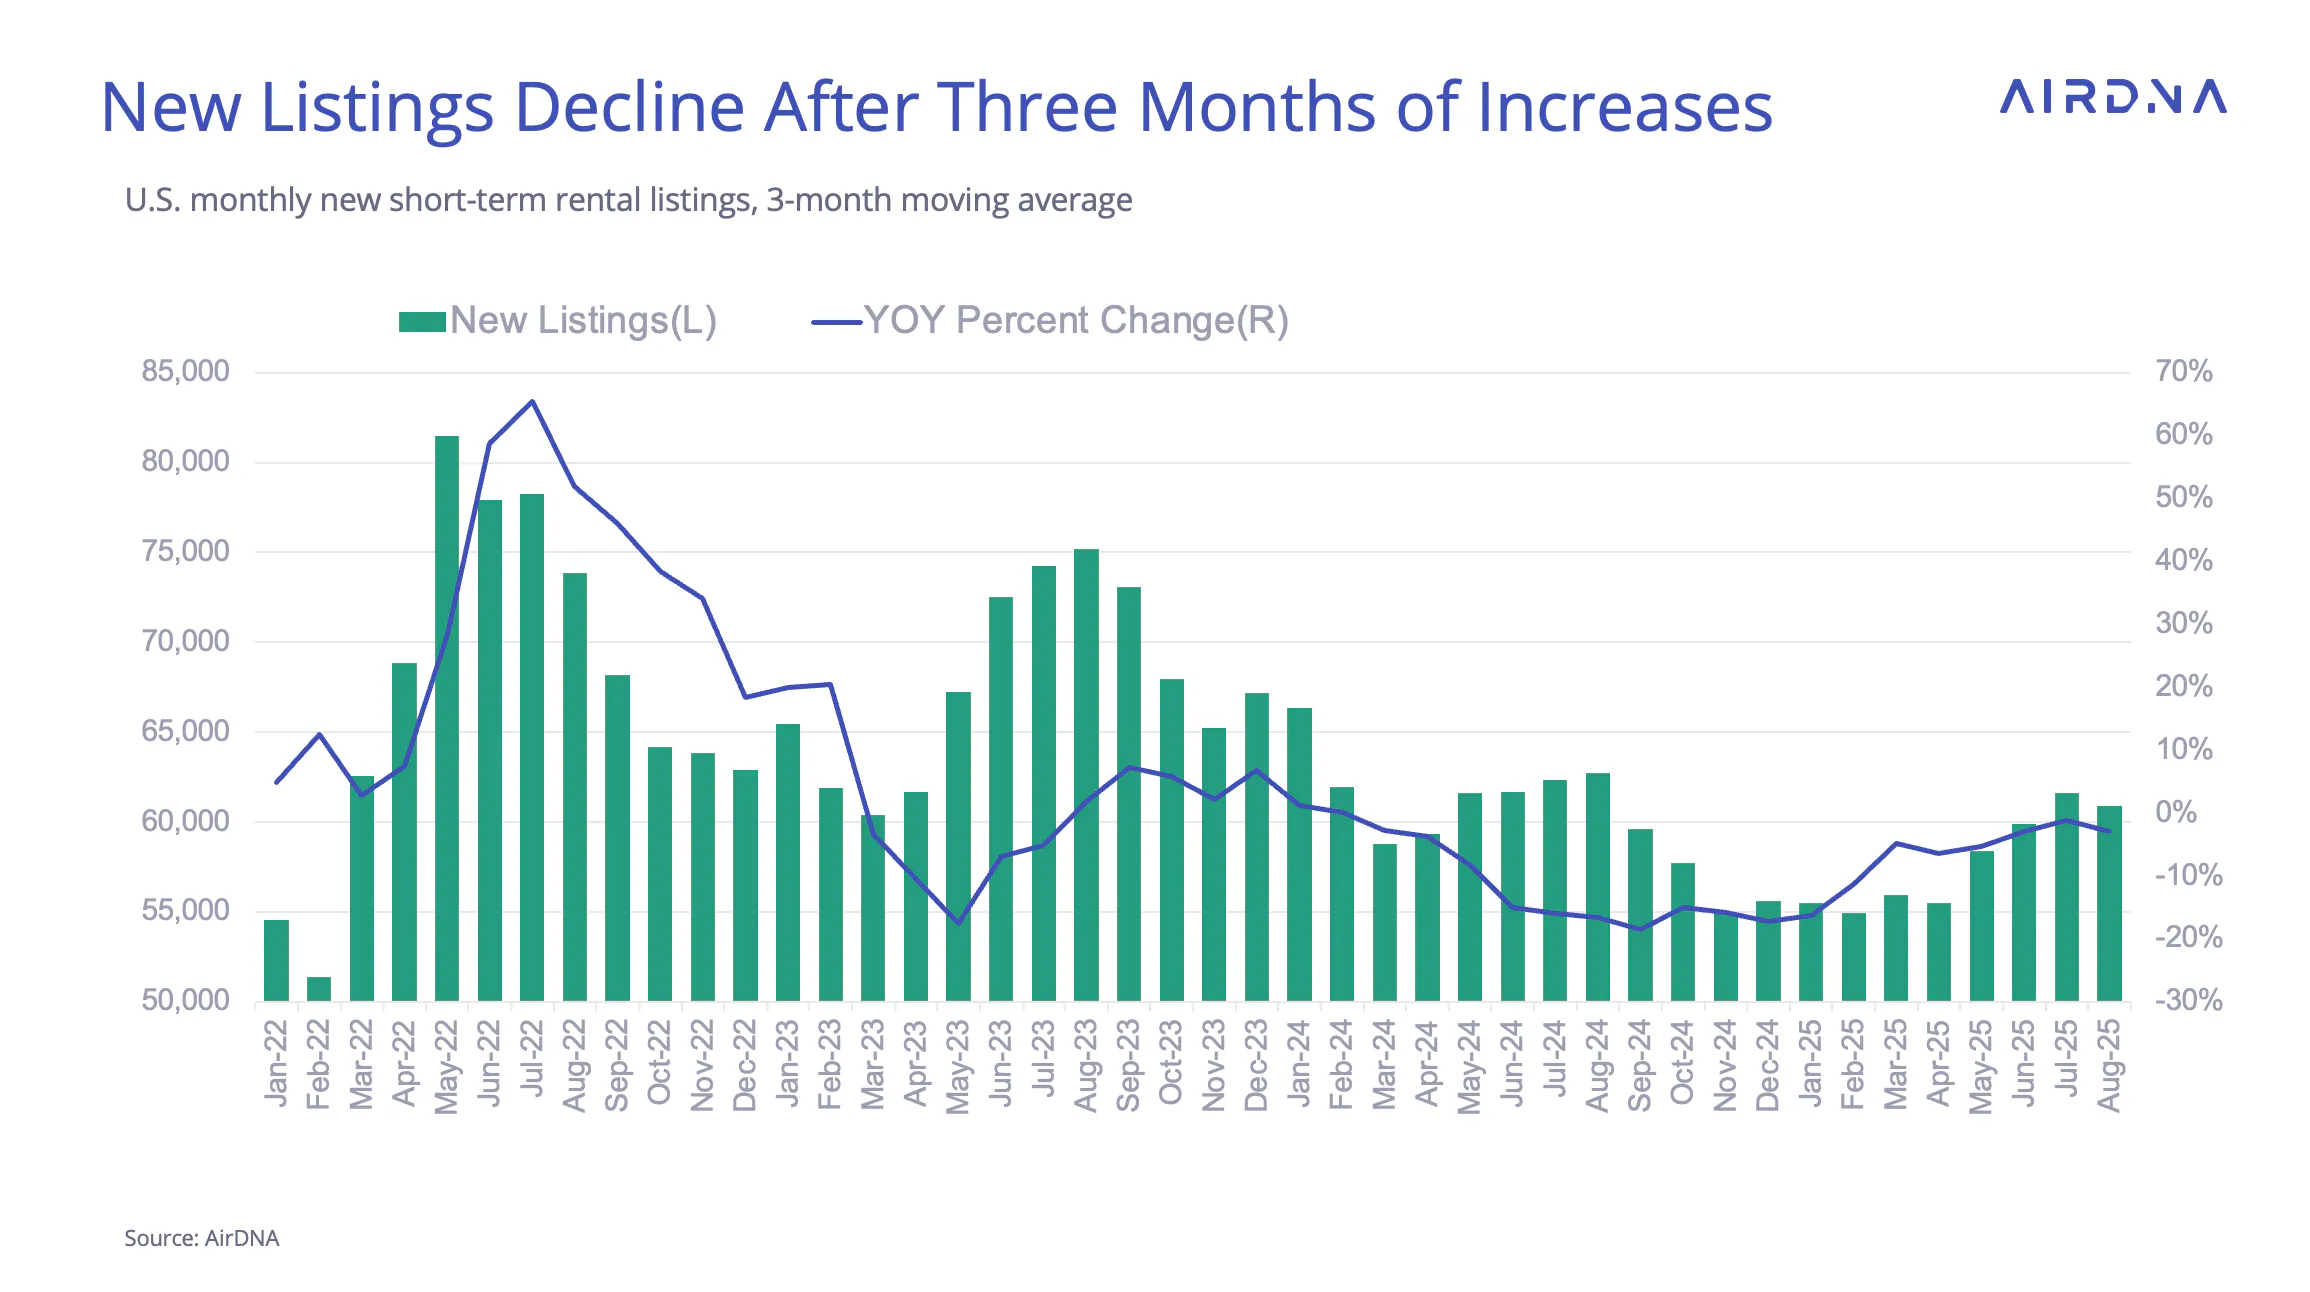
Supporting this tempered supply growth environment is the trend in new listings. After rising between April and July, new listings fell again in August, pushing YOY growth back into negative territory at -2.9%.
Demand Growth and Occupancy
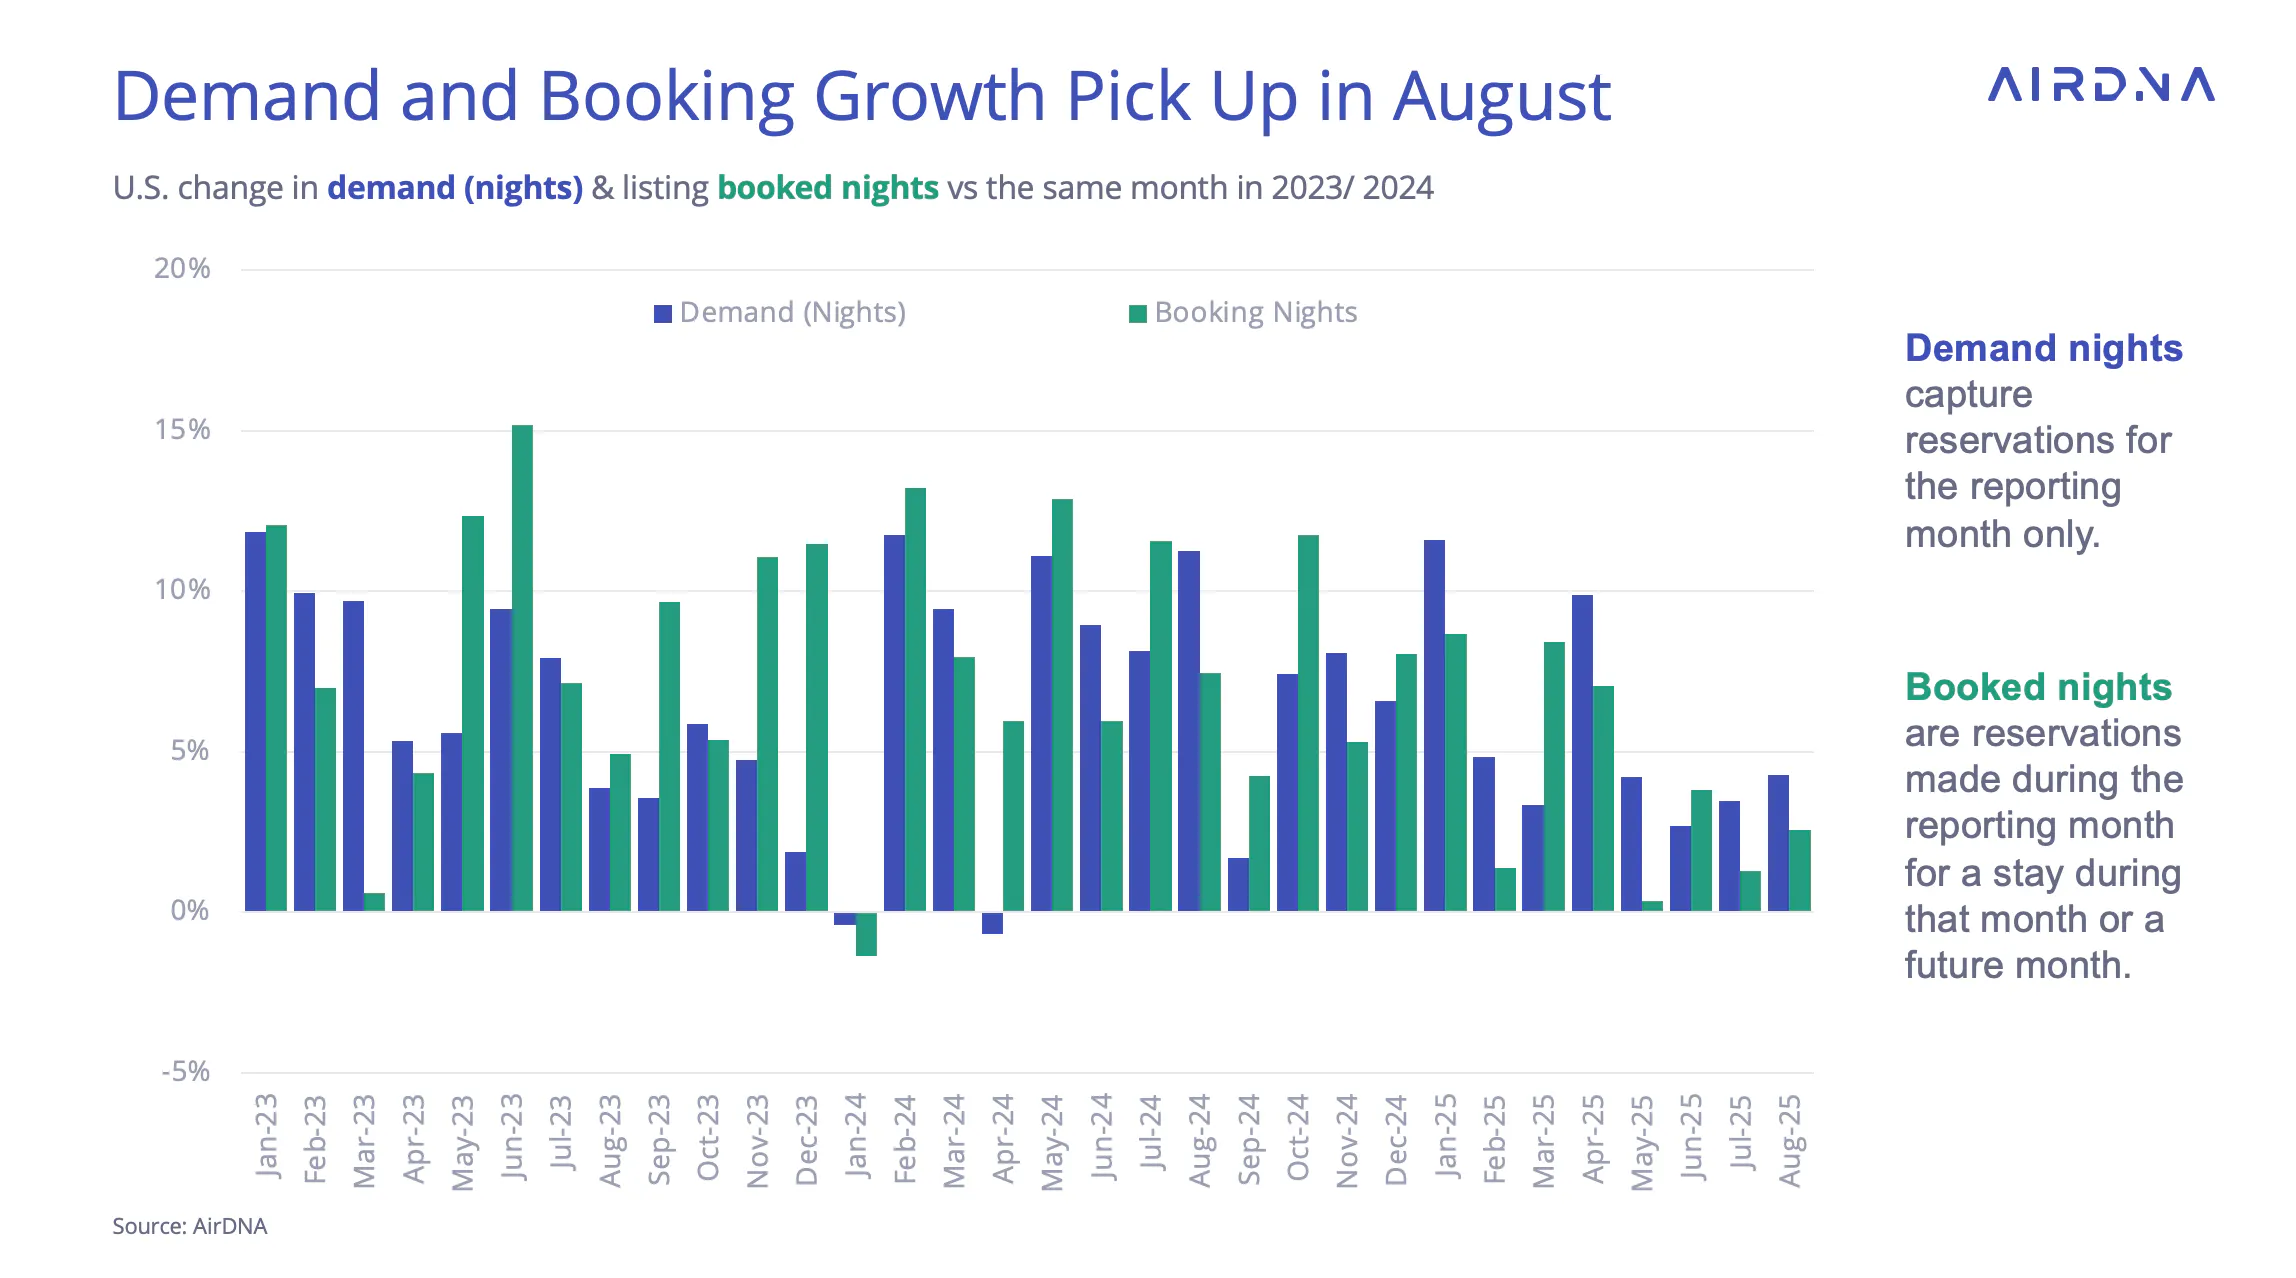
While new listings declined, demand accelerated for the second consecutive month in August, rising 4.3% year-over-year, up from 3.5% in July. Booking growth also improved, climbing to 2.55% from 1.3% in July.
It’s worth noting that Labor Day fell on the earliest possible date in September this year, meaning one day of the holiday weekend shifted from September into August. As a result, some of August’s growth likely came at the expense of September’s figures.
Occupancy has been down about 1% since April, though strong performance earlier in the year has kept year-to-date occupancy slightly positive.
Despite the negative comparisons, this summer’s small declines are relatively stable compared to the sharp occupancy losses seen after 2021, when supply surged in response to the post-Covid boom. In 2024, occupancy grew largely because supply growth slowed, whereas 2025’s dip is more closely tied to softer demand rather than excess new supply.
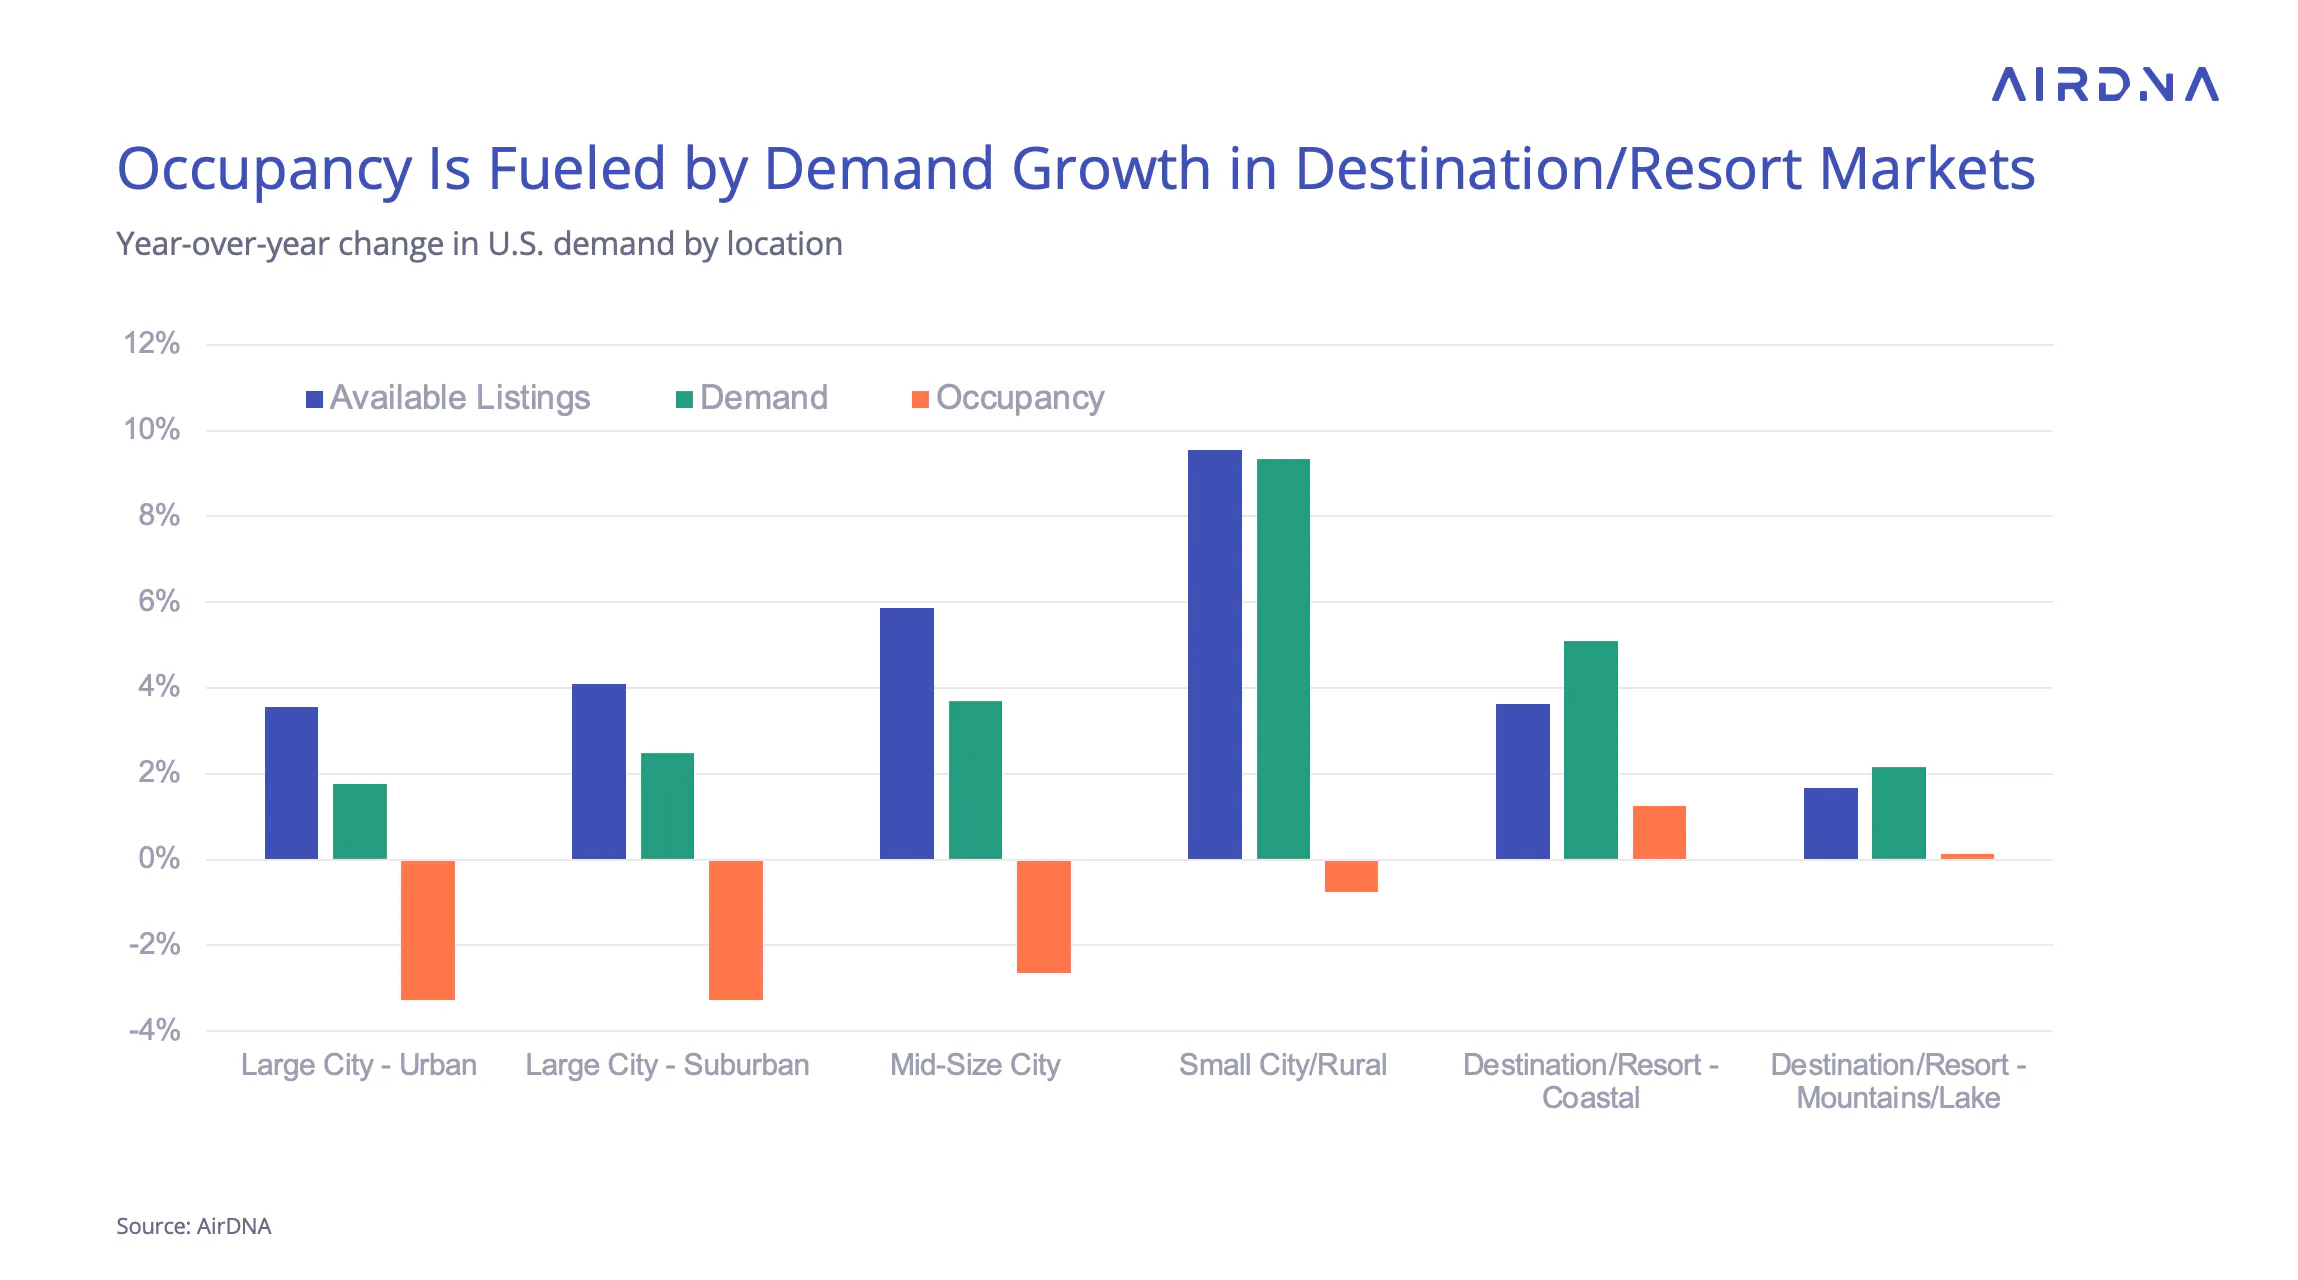
By location type, Large City Urban and Mid-Size cities are facing the steepest challenges, with demand struggling to keep up with supply. These markets rely more heavily on international and business travel and compete more directly with hotels, which have also reported a difficult year, likely contributing to weakness in STR performance.
Resort markets, on the other hand, have seen slower supply growth. In August, Mountain/Lake resorts recorded the lowest supply growth of any location type, while Coastal Resorts nearly matched Urban markets for second-lowest growth. Small City/Rural markets continue to lead in supply growth but have posted only minimal occupancy losses thanks to strong demand growth.
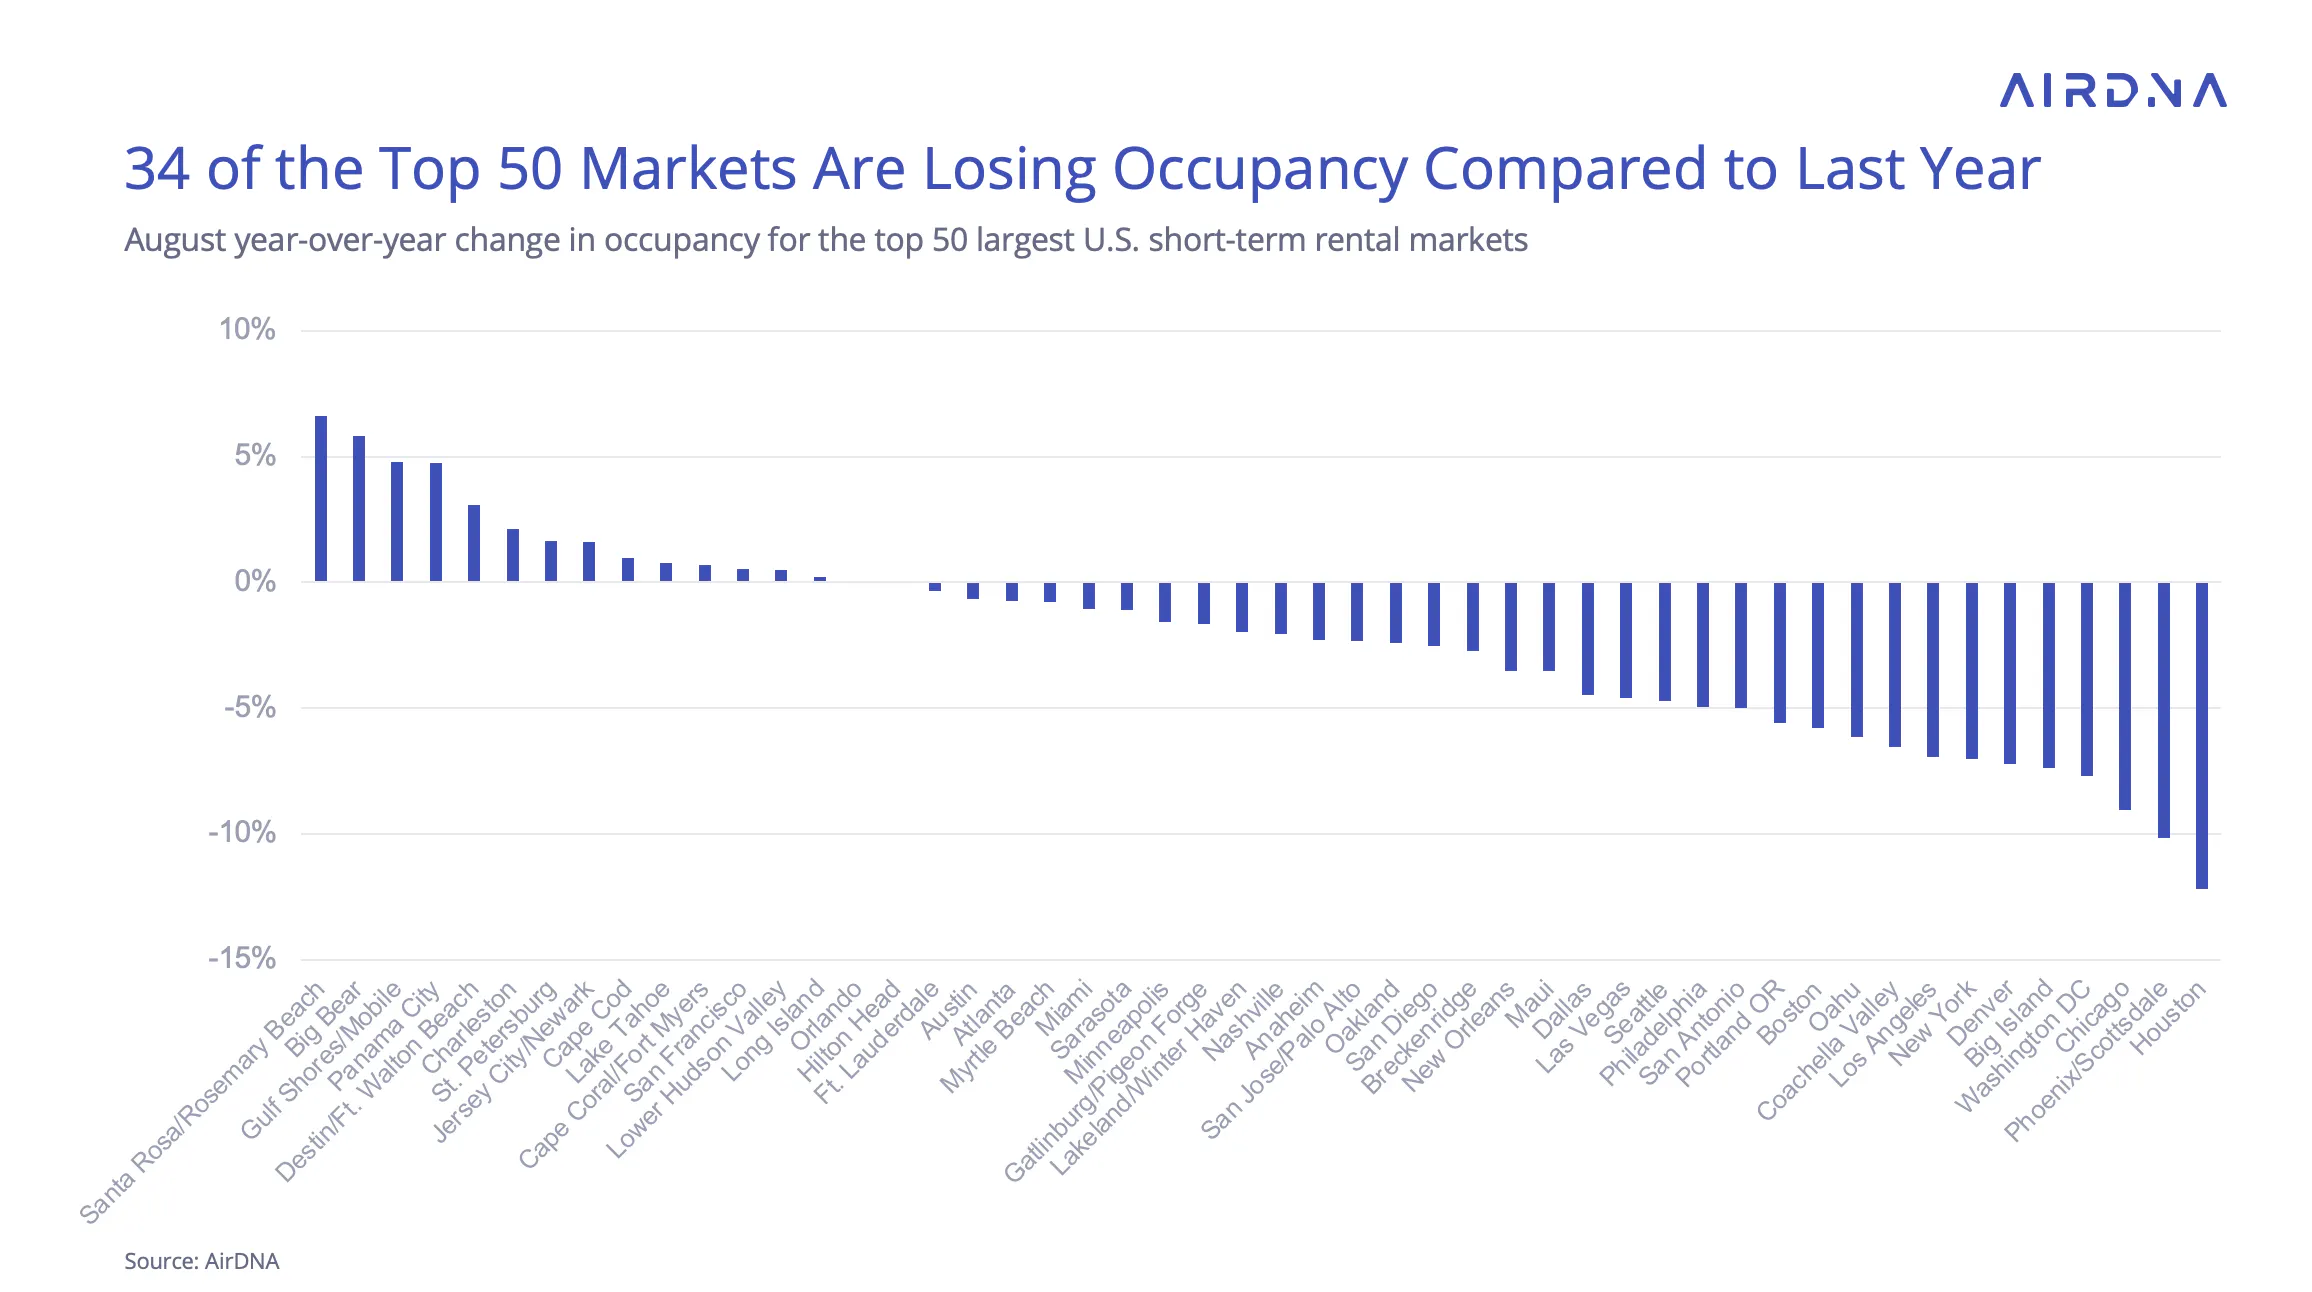
At the market level, just 16 of the top 50 markets recorded occupancy gains in August. The top performers were all resort-heavy locations:
- Santa Rosa/Rosemary Beach, Florida: +6.6%
- Big Bear, California: +5.8%
- Gulf Shores/Mobile, Alabama: +4.8%
- Panama City, Florida: +4.8%
- Destin/Ft. Walton Beach, Florida: +4.8%
Nightly Rate Growth Dips Slightly, But Remains Strong
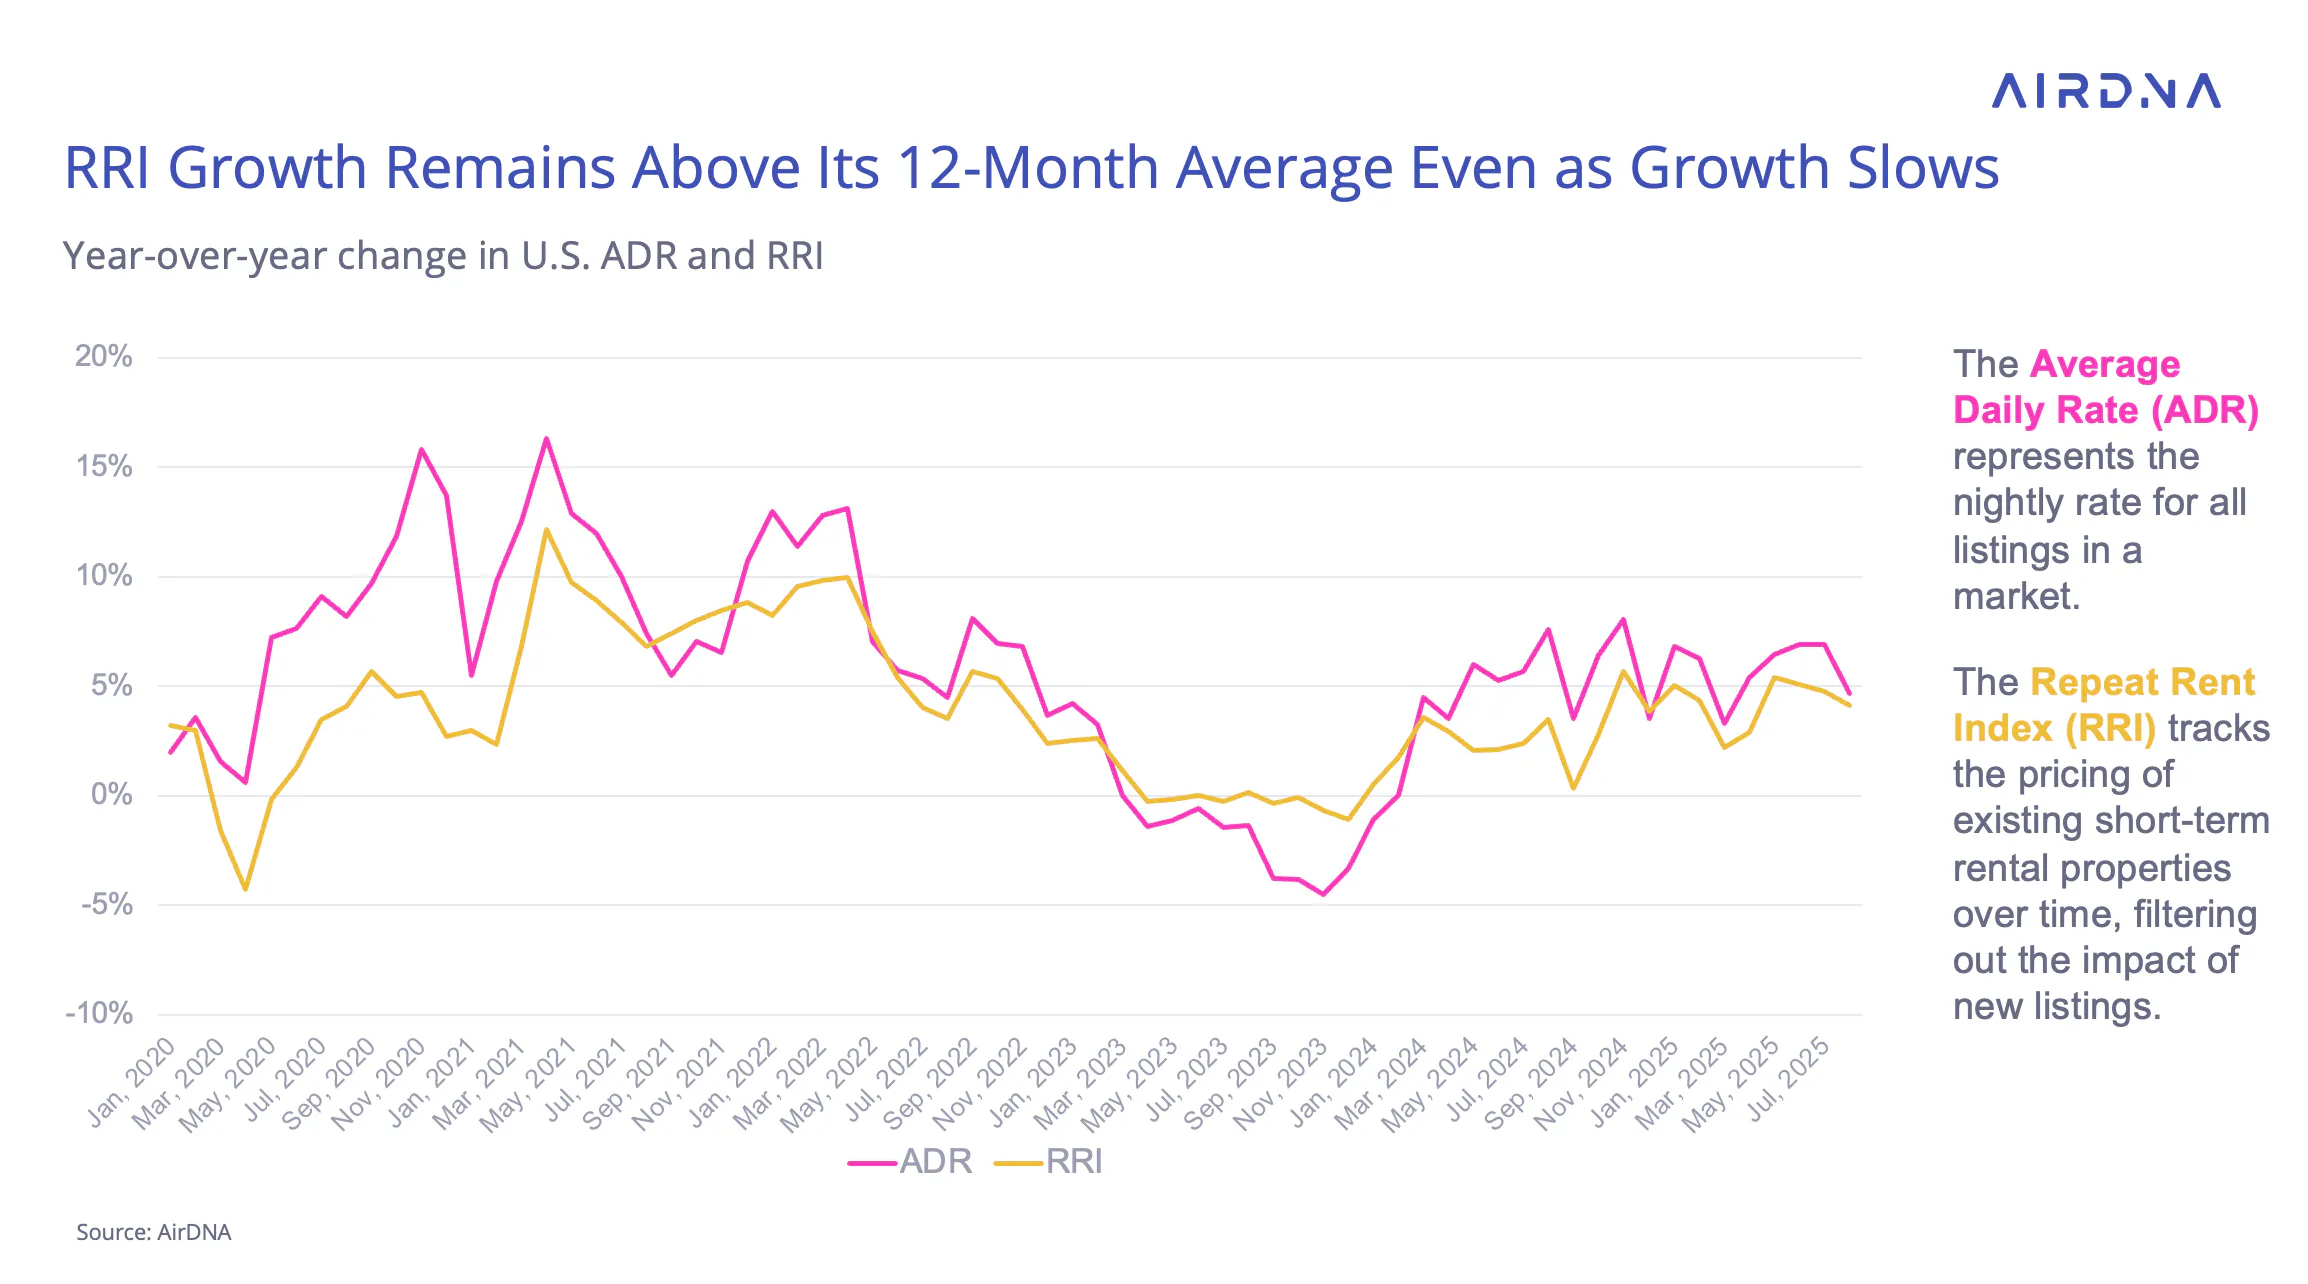
Average daily rate (ADR) growth eased in August, rising 4.7% year-over-year compared to July’s 6.9% increase.
The Repeat Rent Index (RRI), which measures pricing changes among existing operators and excludes the effect of new listings entering the market, also slowed to 4.1% from 4.8% in July. Despite the dip, RRI growth remains above its twelve-month average of 3.8%. With supply growth staying muted, ADR and RRI are moving closely together, as fewer changes in the listing mix are influencing rate trends.
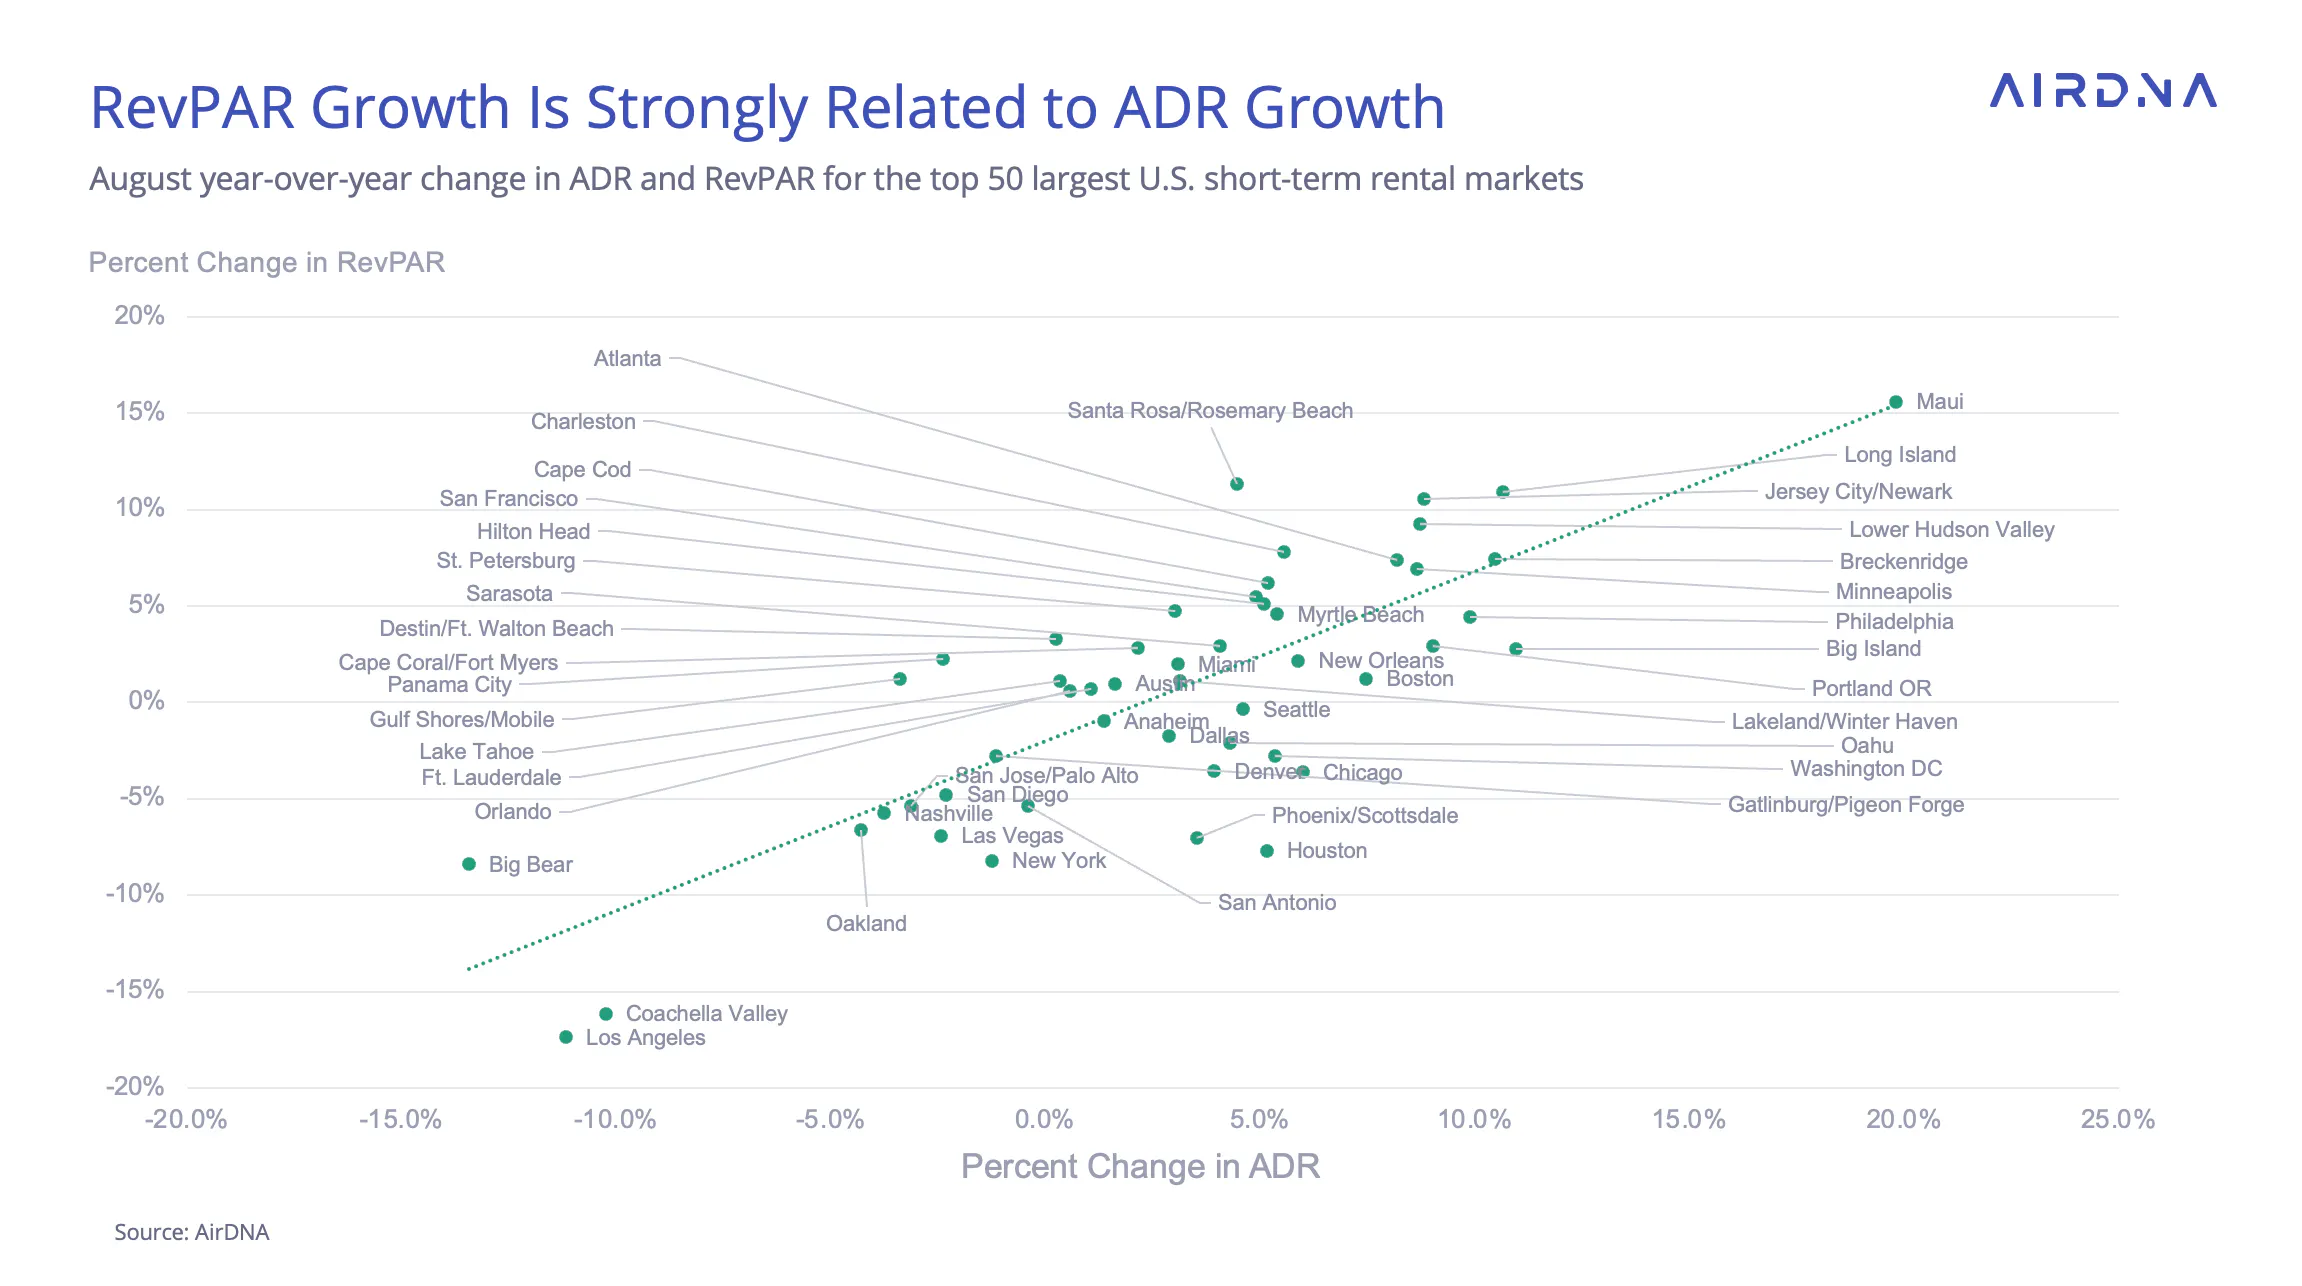
In 2025, ADR growth has become the primary driver of RevPAR, as occupancy has remained relatively stable. Among the top 50 markets in August, ADR growth explained nearly two-thirds of the variation in RevPAR growth, roughly twice as much as occupancy changes.
This strong rate performance has pushed national RevPAR to a new milestone. On a trailing twelve-month basis, U.S. RevPAR has exceeded the post-Covid high of $169.44 every month this summer, with August reaching a record $172.69, marking the highest twelve-month average ever recorded.
Labor Day Calendar Shift Pulls Some Demand Into August
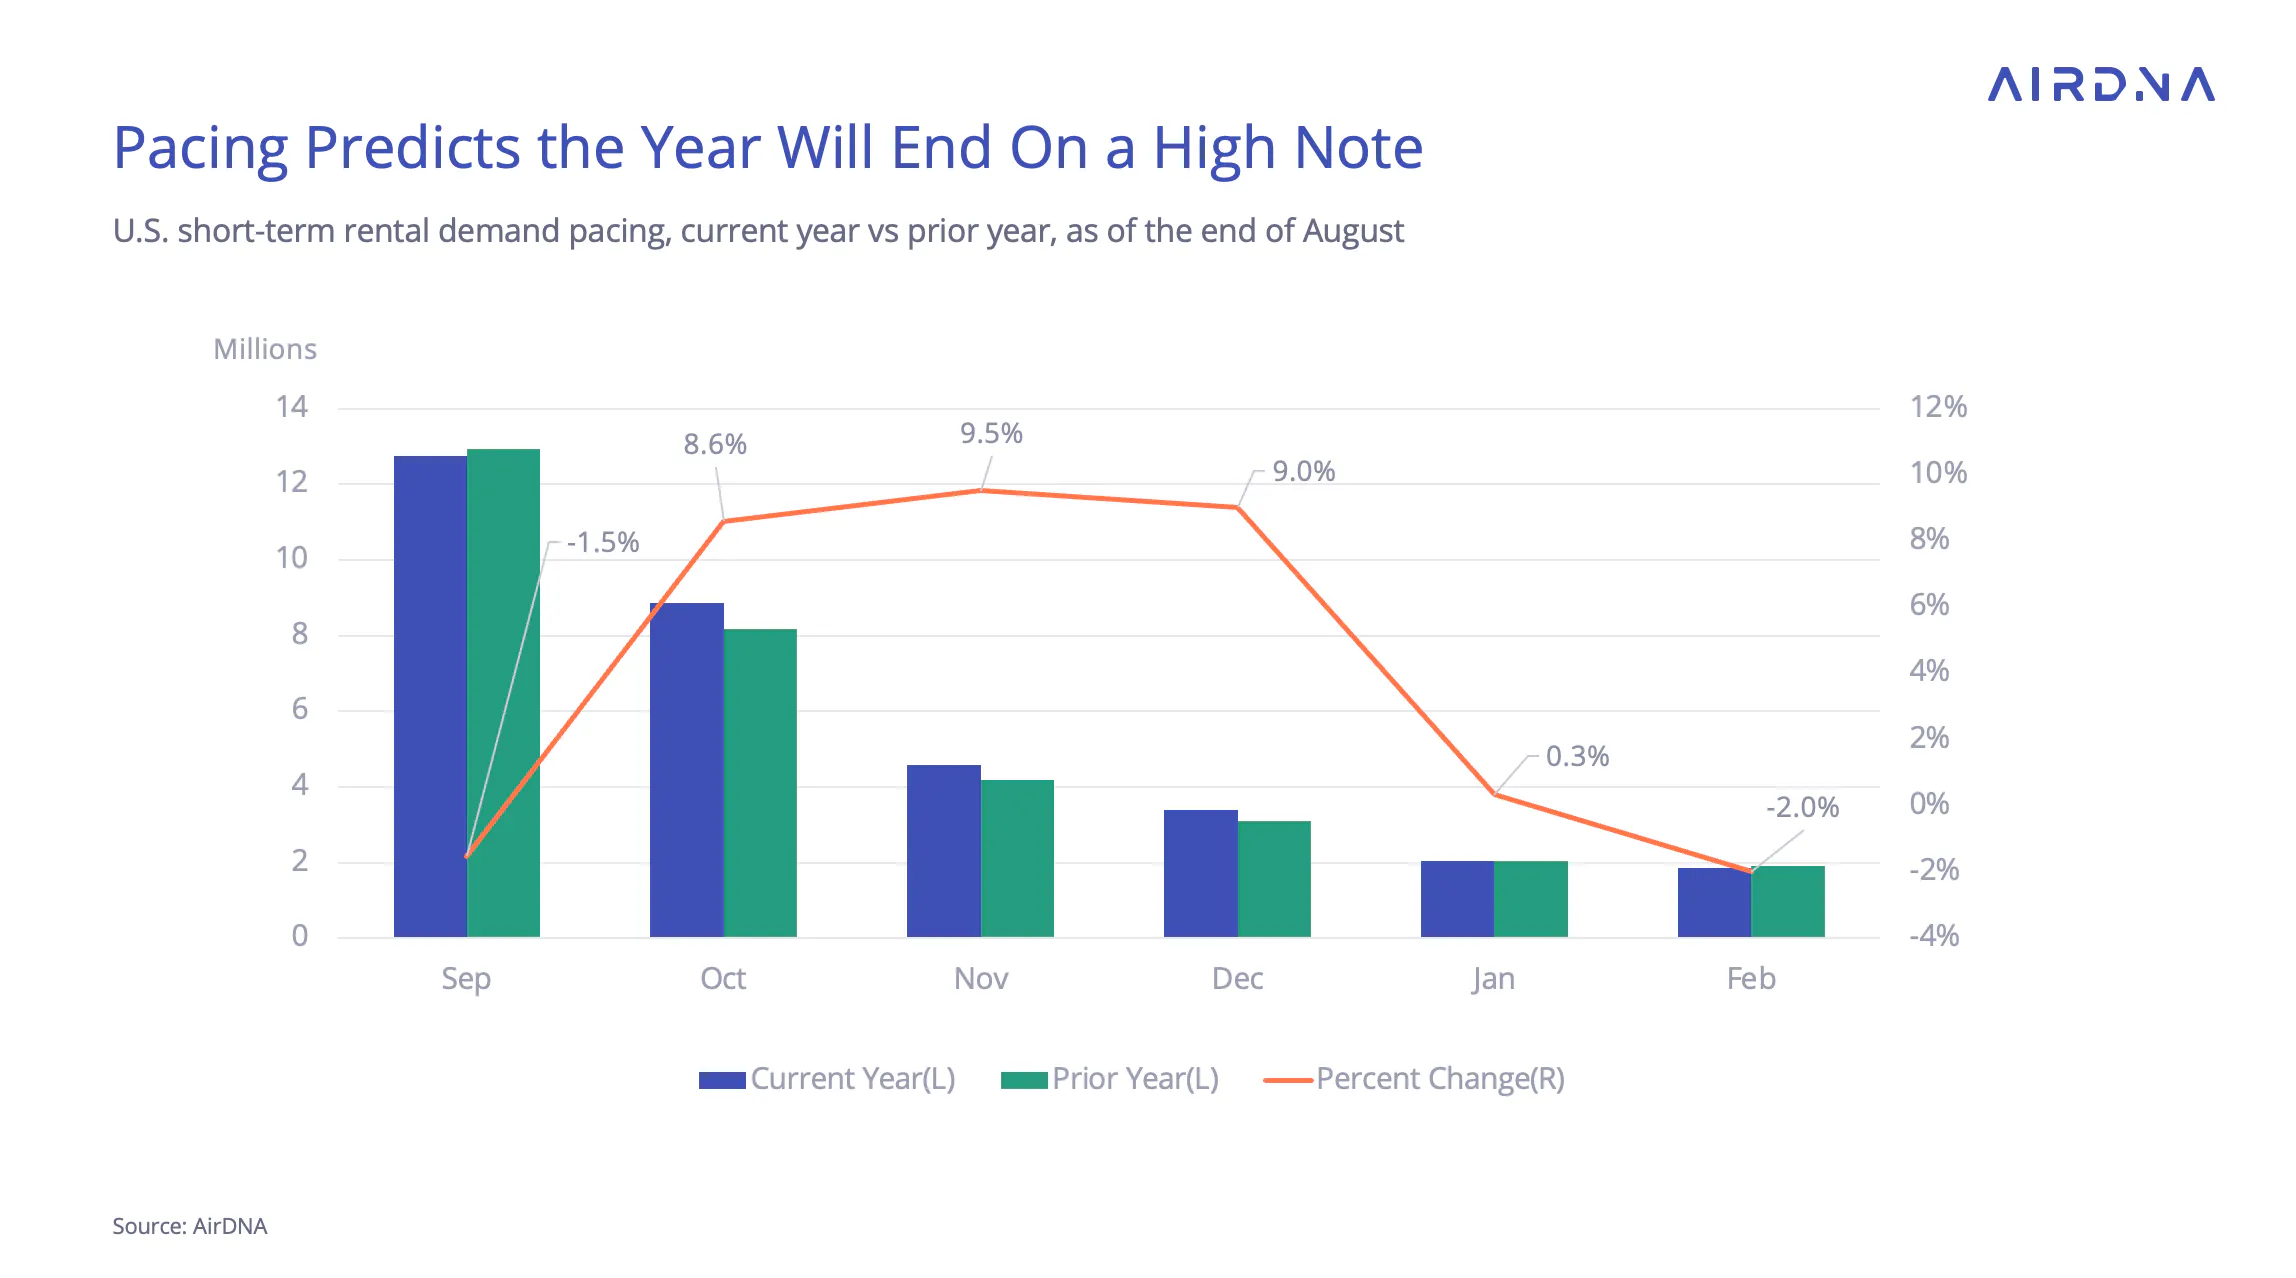
Looking ahead, on-the-books demand pacing shows September currently down 1.5%, partly due to the Labor Day calendar shift pulling some demand forward into August. Year-to-date occupancy may dip slightly below 2024 levels in September, but early indicators for October through December are strong. Off-season value seekers and travelers rescheduling vacations postponed after April’s tariff-related market correction are expected to provide a boost in late-year demand.
ARTICLE SUMMARY
In August 2025, U.S. short-term rentals reached record RevPAR levels despite a slight drop in occupancy. Supply hit an all-time high, demand accelerated for a second month, and strong nightly rates remained the key driver of revenue growth.
Bram Gallagher
AirDNA Director of Economics and Forecasting
Bram Gallagher is an Economist at AirDNA, specializing in uncovering insights that drive smarter short-term rental decisions. He put his Ph.D. in Economics from the University of Georgia to work researching and forecasting hotel data with CBRE prior to joining AirDNA, as well as teaching economics at a number of universities. In his spare time, Bram enjoys making wooden furniture with hand tools.