


U.S. Review July 2025: Record Demand and Strong Rates Offset International Decline
Published: August 19, 2025
Last updated: August 18, 2025

Bram Gallagher
Key Takeaways:
- U.S. short-term rental (STR) demand hit a new record in July, with 26.4 million nights stayed and a 3.6% year-over-year (YoY) growth rate.
- ADR climbed 6.9% YoY, lifting RevPAR by 5.7% and reflecting increased interest in larger, higher-priced properties.
- Q4 pacing looks strong, with bookings for October and November up 9–10%, and December pacing +6.9%.
- International demand dropped 16% YoY, led by a sharp decline in Canadian stays, while domestic travel dominated summer bookings.
Despite ongoing economic concerns and uncertainty in the U.S. travel sector, the short-term rental (STR) market posted its highest monthly demand on record in July, reaching 26.4 million nights.
After a slowdown in June, demand growth reaccelerated in July, though occupancy declined slightly due to modestly stronger listing growth. Year-to-date occupancy remains ahead of 2024 levels, and current pacing data points to a potentially stronger Q4.
Economic Outlook
Economic uncertainty continued to cloud the outlook in July, particularly following downward revisions to U.S. job growth figures. The economy added 73,000 jobs during the month (well below the 100,000+ expected) and the Bureau of Labor Statistics also revised May and June figures downward by over 250,000 jobs combined. As a result, what previously looked like steady growth now reflects three months of lackluster employment performance.
This weaker labor data could prompt the Federal Reserve to shift focus from inflation to the job market. Many economists, including AirDNA analysts, now expect rate cuts to arrive sooner than previously forecast. So far, the modest rate cuts in 2024 have had little impact on mortgage rates, which have hovered around 6.8% all year. The resulting slowdown in the housing market has constrained new investment and contributed to sluggish STR supply growth.
However, inflation remains a sticking point. Since April, the Consumer Price Index (CPI) has ticked up from 2.3% to 2.7% year-over-year, while Core CPI (excluding food and energy) rose to 3.1%. Though some inflation is linked to tariffs and may be temporary, elevated prices can still suppress discretionary spending (particularly for travel) by increasing pressure on household budgets.

At a Glance: Key U.S. STR Performance Metrics for July 2025
- Revenue per Available Rental (RevPAR) increased 5.7% year-over-year (YOY) to $237.06
- Available listings reached 1.77 million, a 4.5% increase year-over-year
- Demand nights rose 3.6% compared to July 2024
- Occupancy averaged 67.4%, down 1.1% year-over-year
- Average Daily Rates (ADR) climbed to $351.67, up 6.9% from last year
- The Repeat Rent Index (RRI) rose 5.7% year-over-year
- Total nights booked grew slightly, up 0.7% from June 2024.
Supply Growth Falls After Two Months of Acceleration
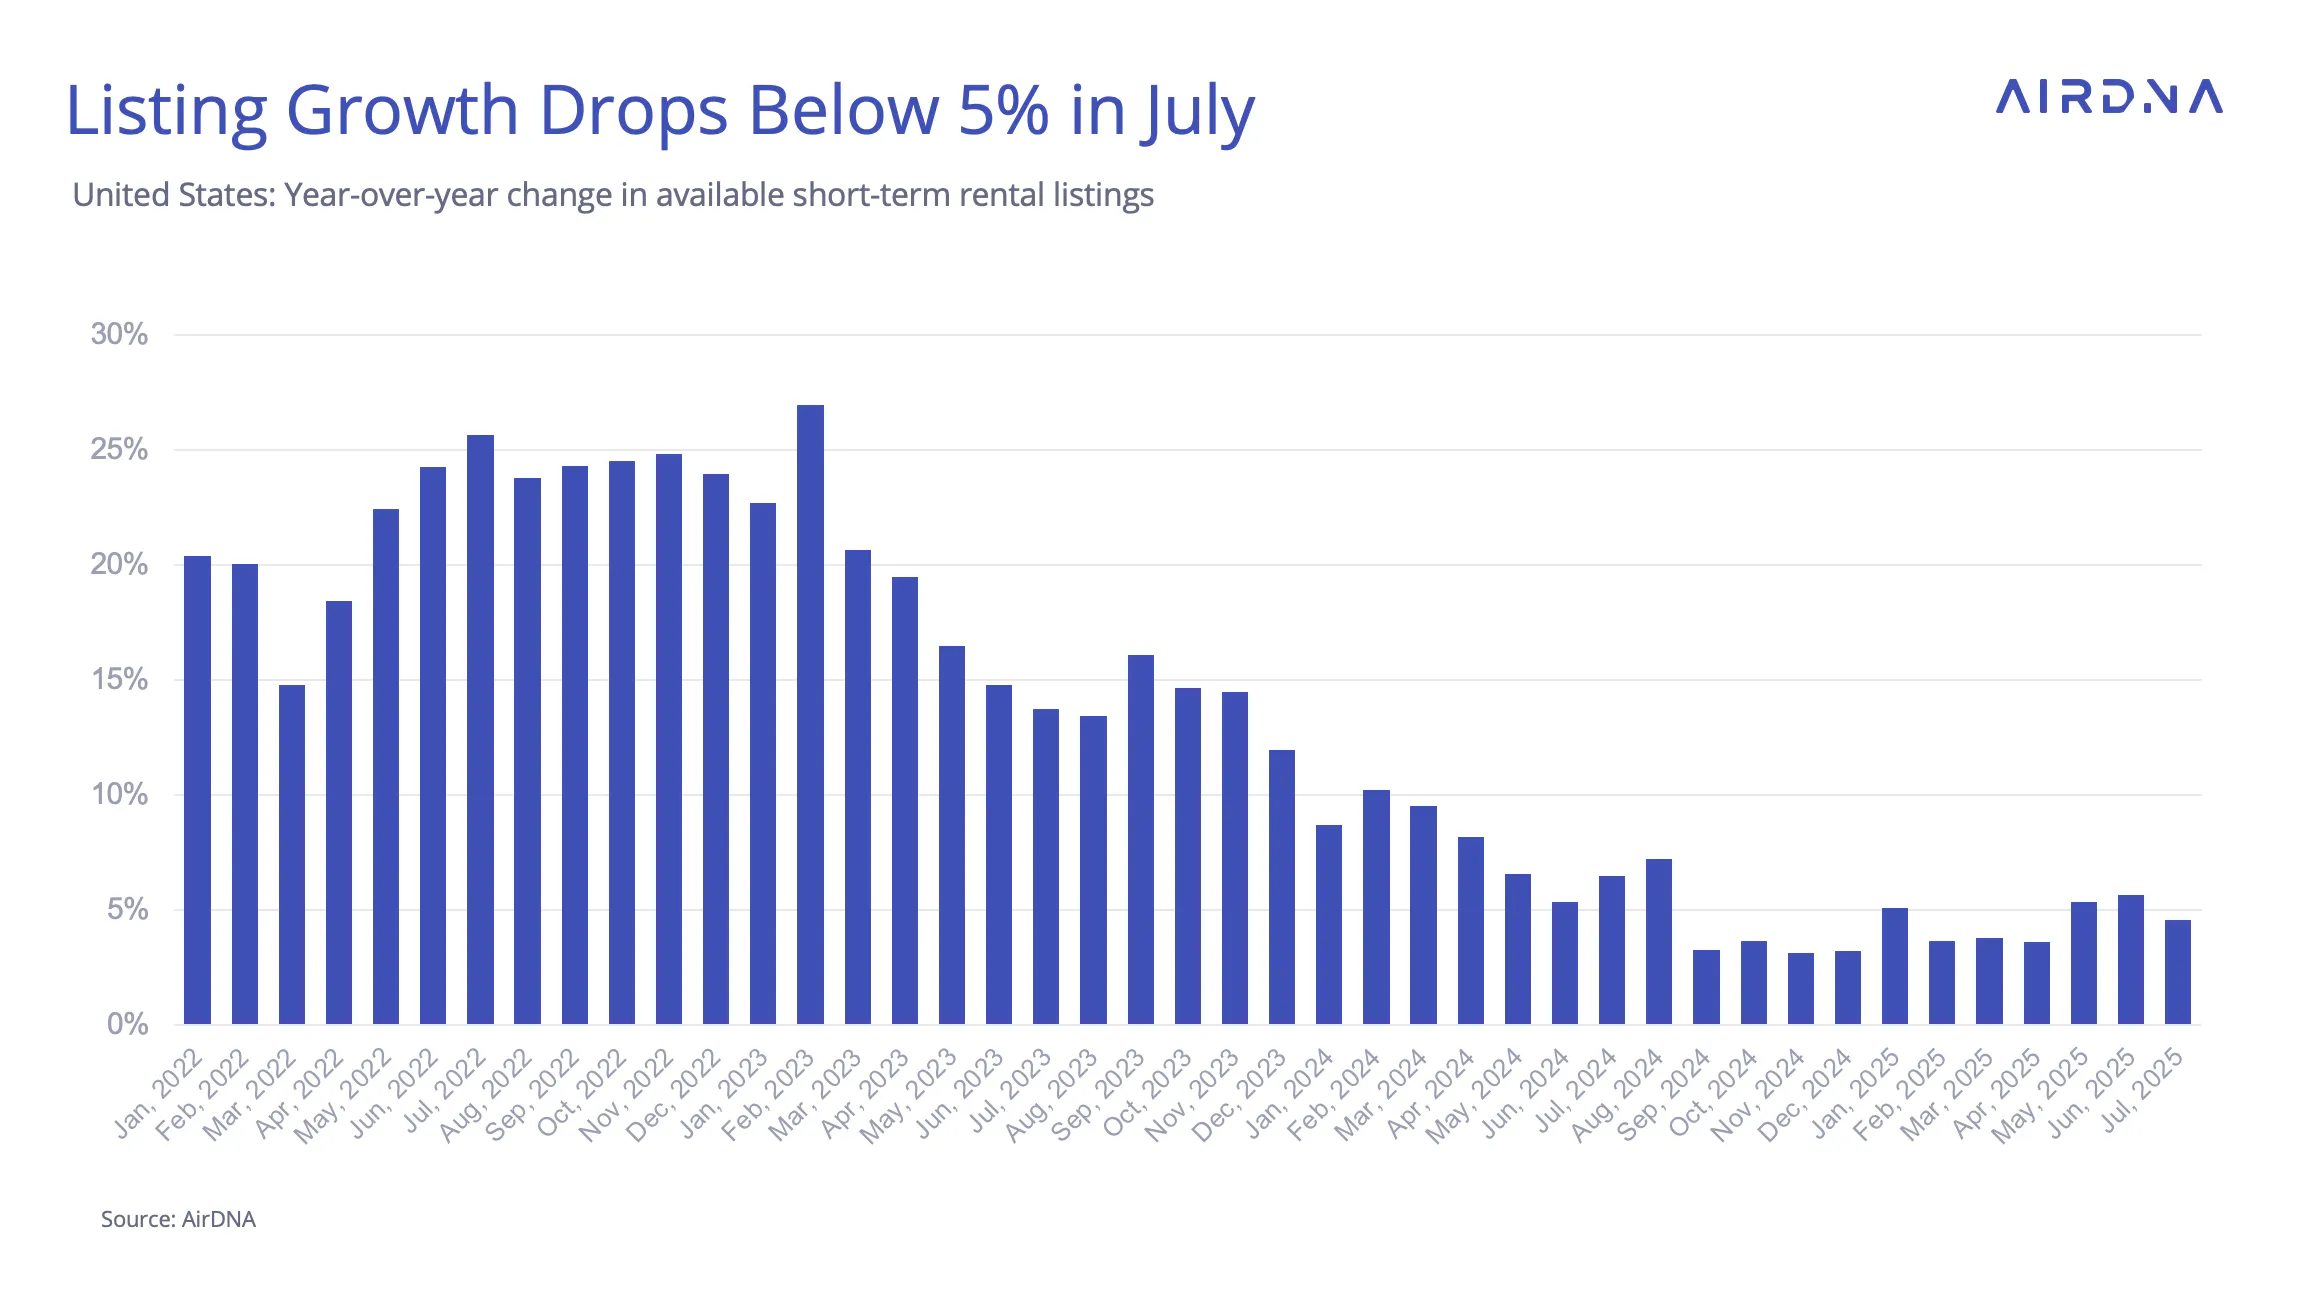
After nearly a year of sub-5% supply growth, available listings briefly accelerated in May and June, raising questions about whether the U.S. STR market had reached a turning point. But July ended that streak, with available listing growth easing to 4.6%, down from 5.7% in June, though still above the pace seen in most months since August 2024.
Weaker labor market data has fueled expectations of an earlier interest rate cut, potentially by September. In July, mortgage rates dipped slightly to 6.7% (from 6.8% in June, per Freddie Mac), and early August brought further softening. If sustained, lower rates (alongside commercial real estate tax incentives) could support renewed growth in STR supply heading into the fall.
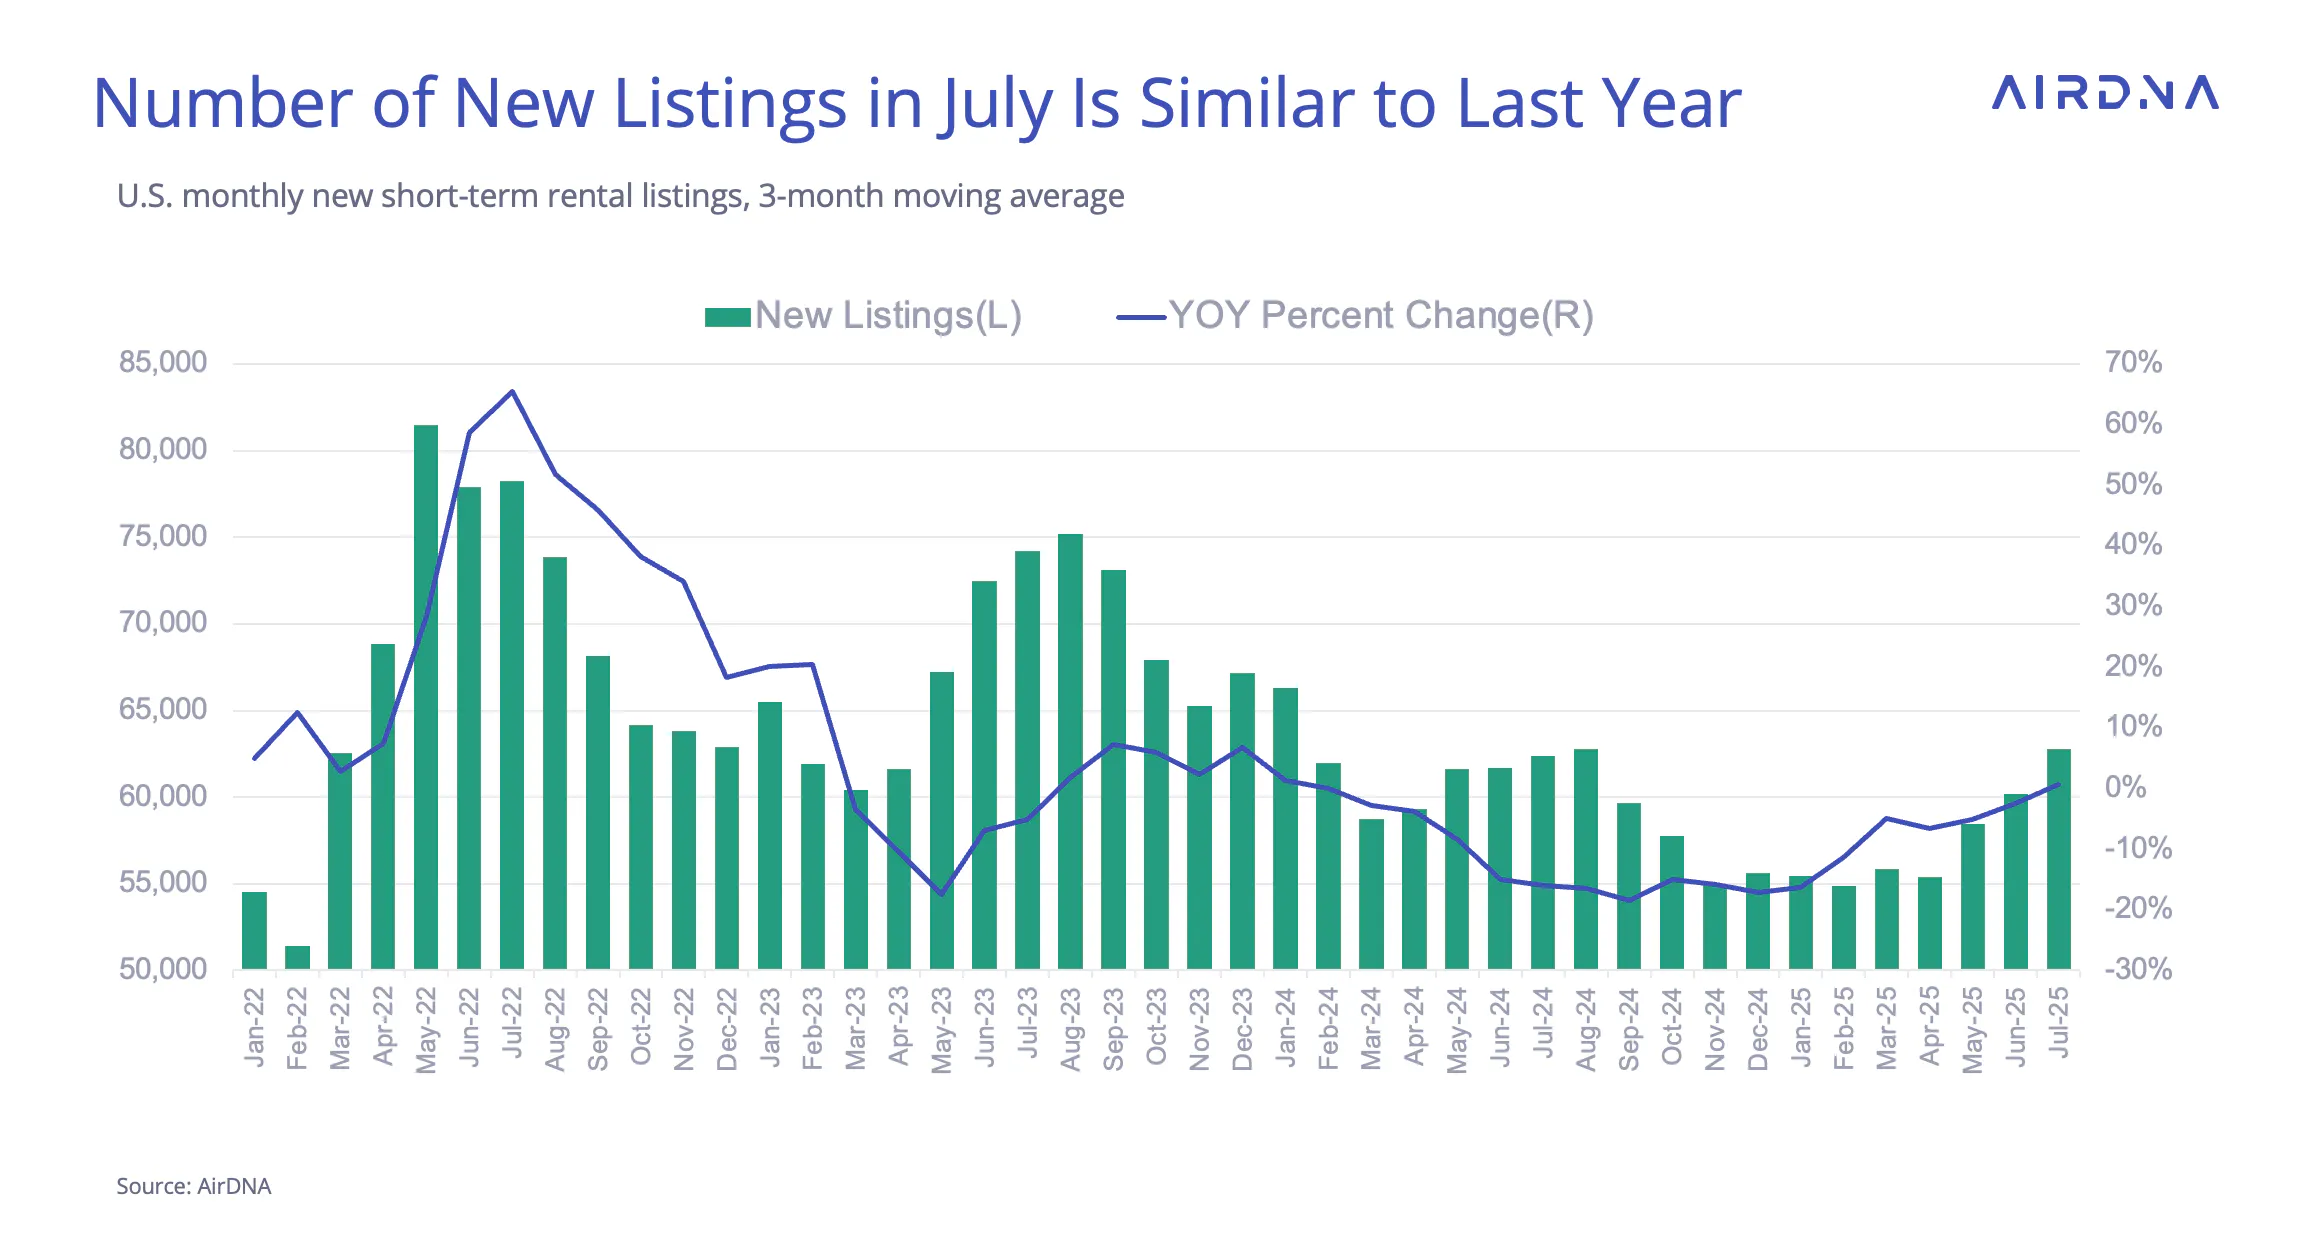
Meanwhile, new listings have been gradually recovering. After bottoming out at -17.2% year-over-year in December 2024, growth turned positive in July for the first time in over a year, posting a modest +0.7% YoY increase.
Demand Growth and Occupancy
Demand growth rebounded in July, rising to 3.6% year-over-year — up from 2.7% in June. While still below the pace seen in summer 2024, the increase was enough to set a new monthly record for the U.S. STR market, with 26.4 million demand nights. Bookings made in July were up just 0.7% YoY, reflecting a slight slowdown in forward momentum compared to June. Still, that’s an improvement over May, which saw a mild year-over-year decline.

Notably, the timing of Independence Day (falling on a Friday) drove a spike in demand for early July, with many reservations made in June. As a result, fewer July bookings were captured during the month itself, slightly skewing the month-on-month booking growth comparison.
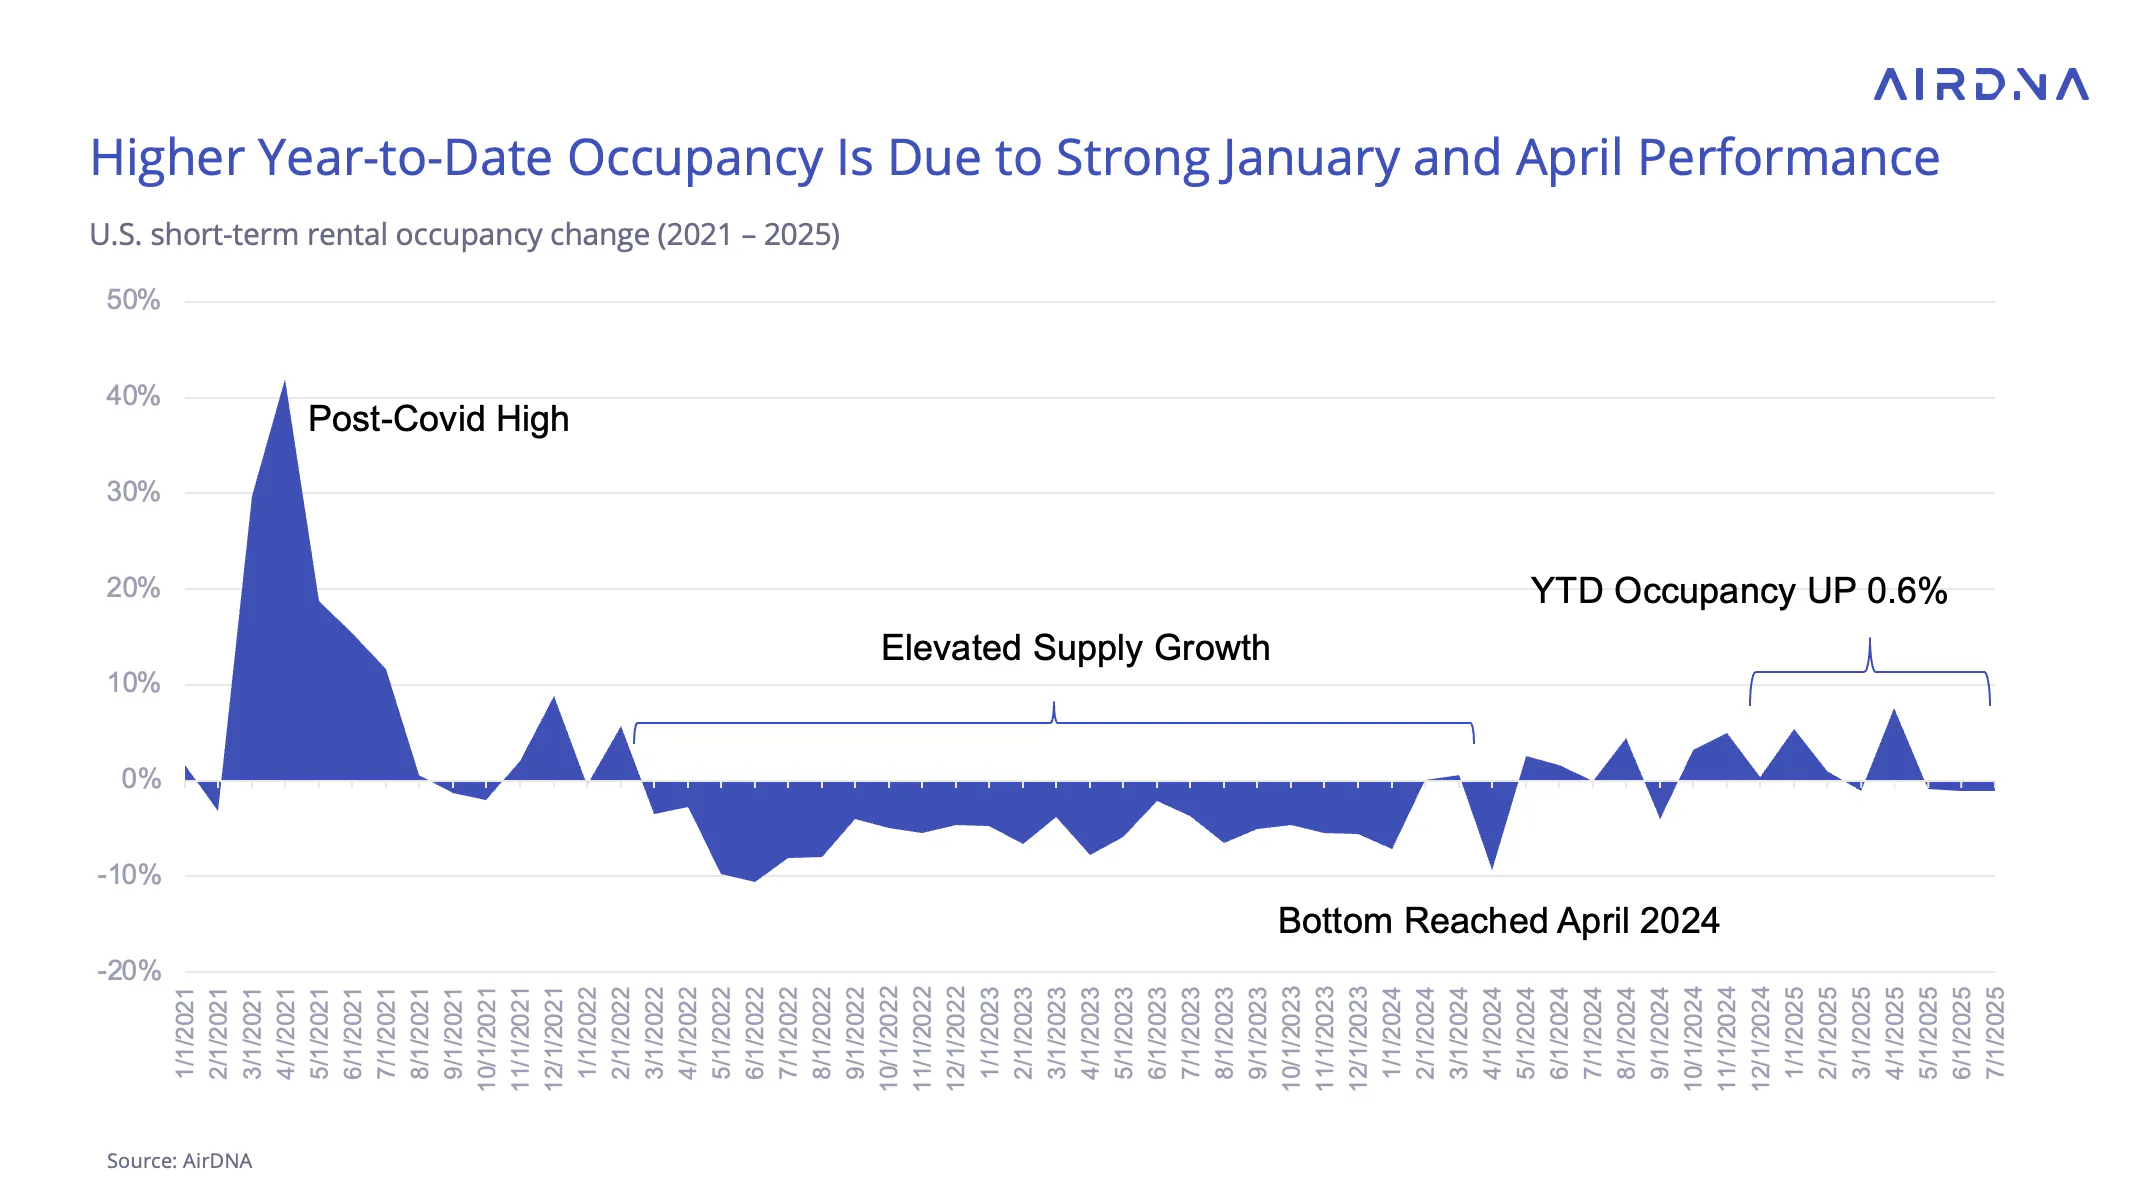
Occupancy has remained slightly lower than in 2024 throughout the summer, largely due to softer demand rather than rapid supply expansion. In July, occupancy fell 1.0% YoY—a continuation of the trend seen since May. However, strong performance earlier in the year (notably January and April) has kept 2025 occupancy ahead of 2024 on a year-to-date basis.
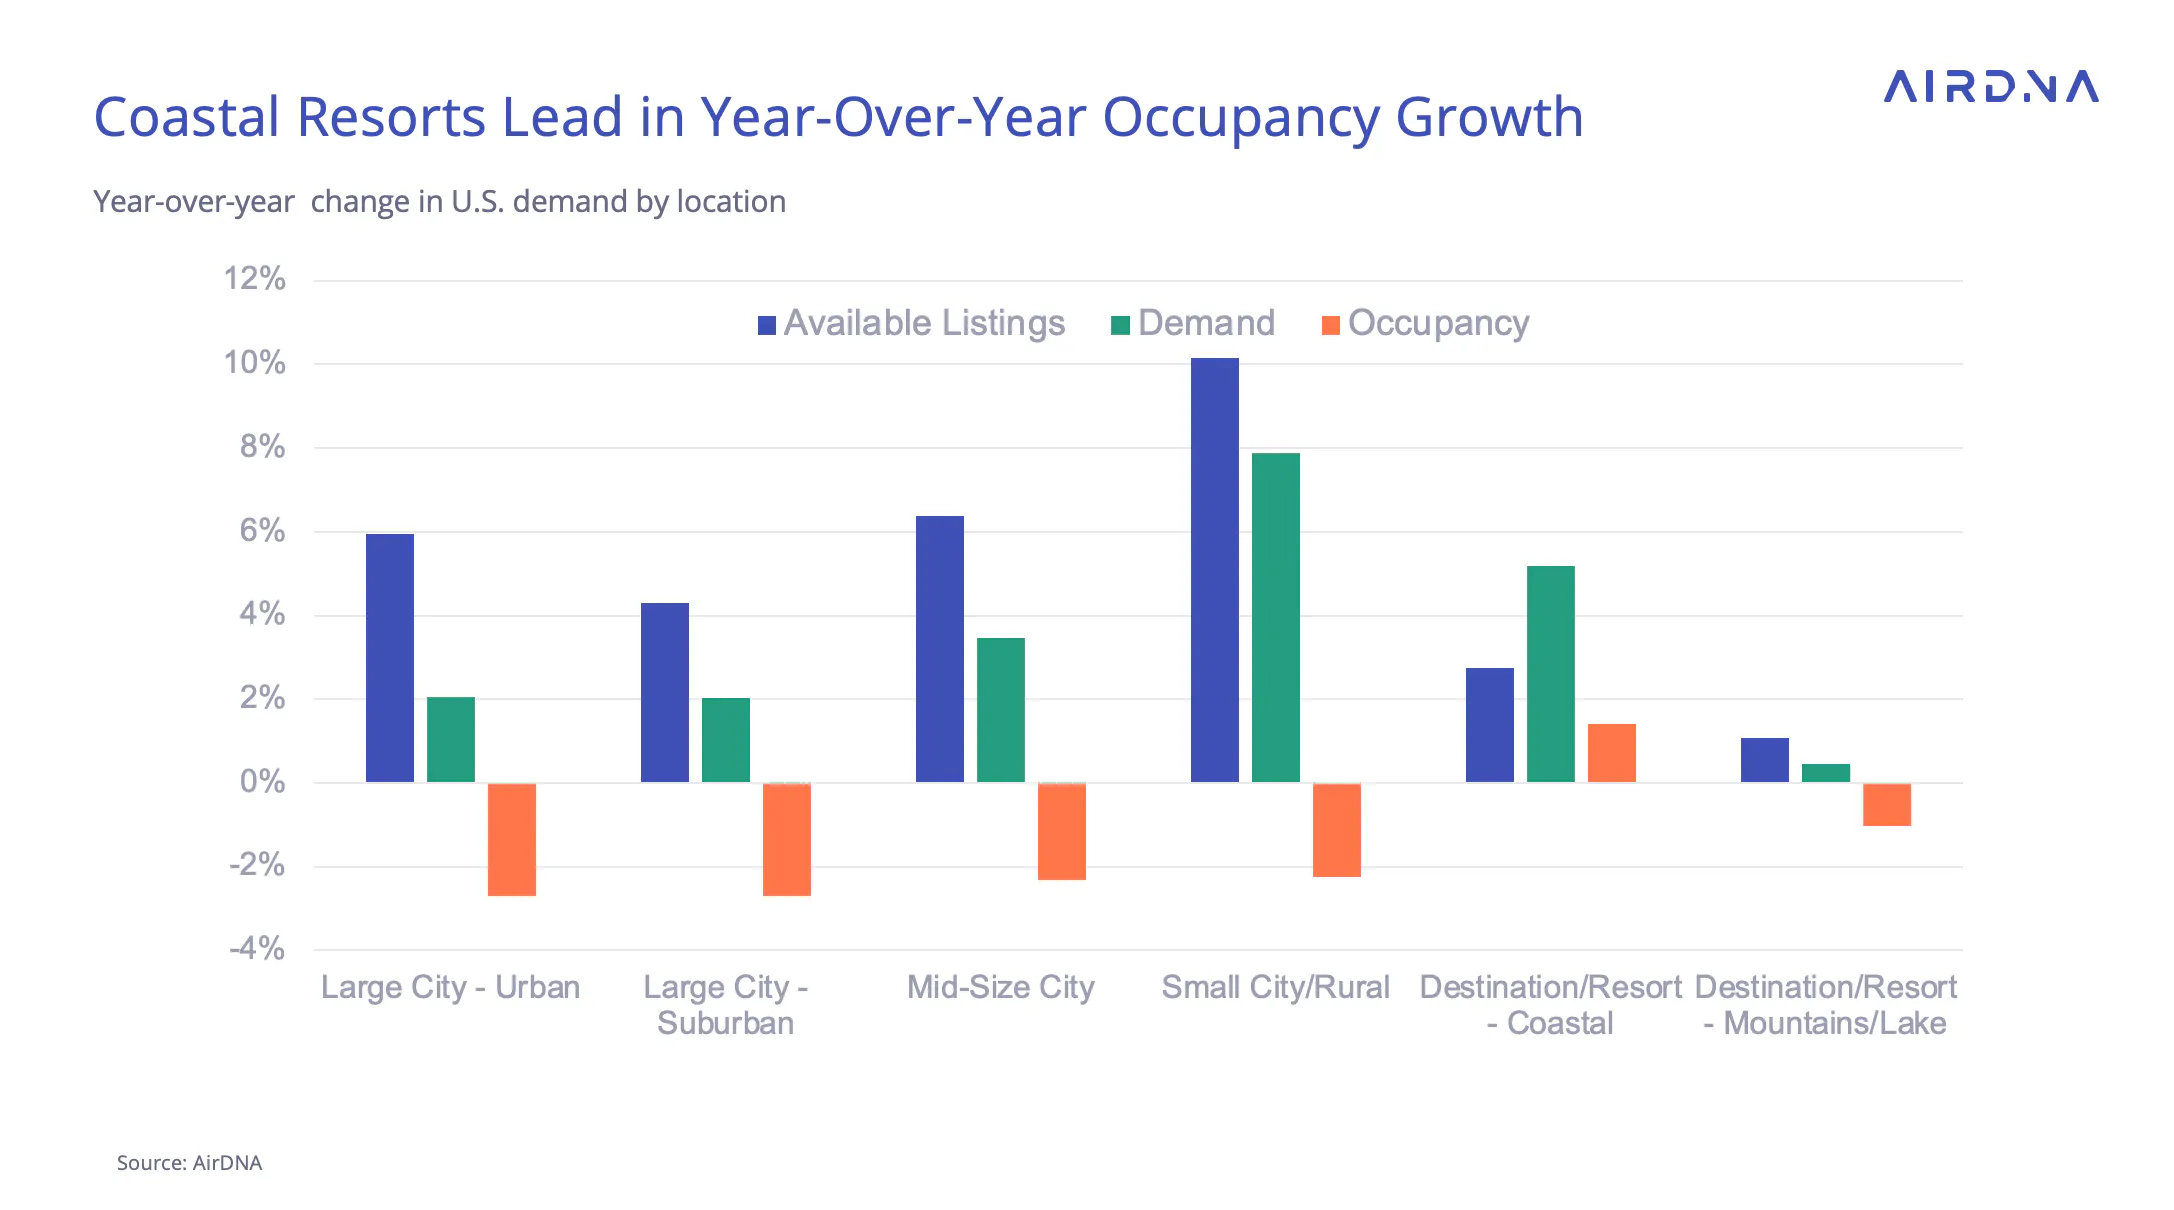
Among location types, coastal resorts led occupancy growth with a 1.4% YoY increase—driven by strong demand and relatively flat supply. Mountain resorts saw the second-highest change, but in the opposite direction: demand and supply both declined, resulting in a 1.0% drop in occupancy. Large suburban and urban markets posted the weakest results, each seeing occupancy fall by 2.7% YoY.
At the market level, urban areas dominated the top 50 for available listing growth. The outlier was Cape Coral/Ft. Myers, Florida, which saw listings surge 17.2% as it continues recovering from Hurricane Ian. Many large metros saw double-digit growth, while San Francisco (-4.7%) and Oakland, California (-2.2%) posted noticeable listing declines, likely driven by regulatory pressure.

Nightly Rate Growth Steadies at Fast Clip
Average daily rate (ADR) growth remained strong in July, holding at +6.9% year-over-year after three months of acceleration. The Repeat Rent Index (RRI) (which isolates price changes for existing listings) rose 5.7%, slightly below ADR. This gap suggests that newer or higher-end properties are increasingly being booked, lifting the overall average.
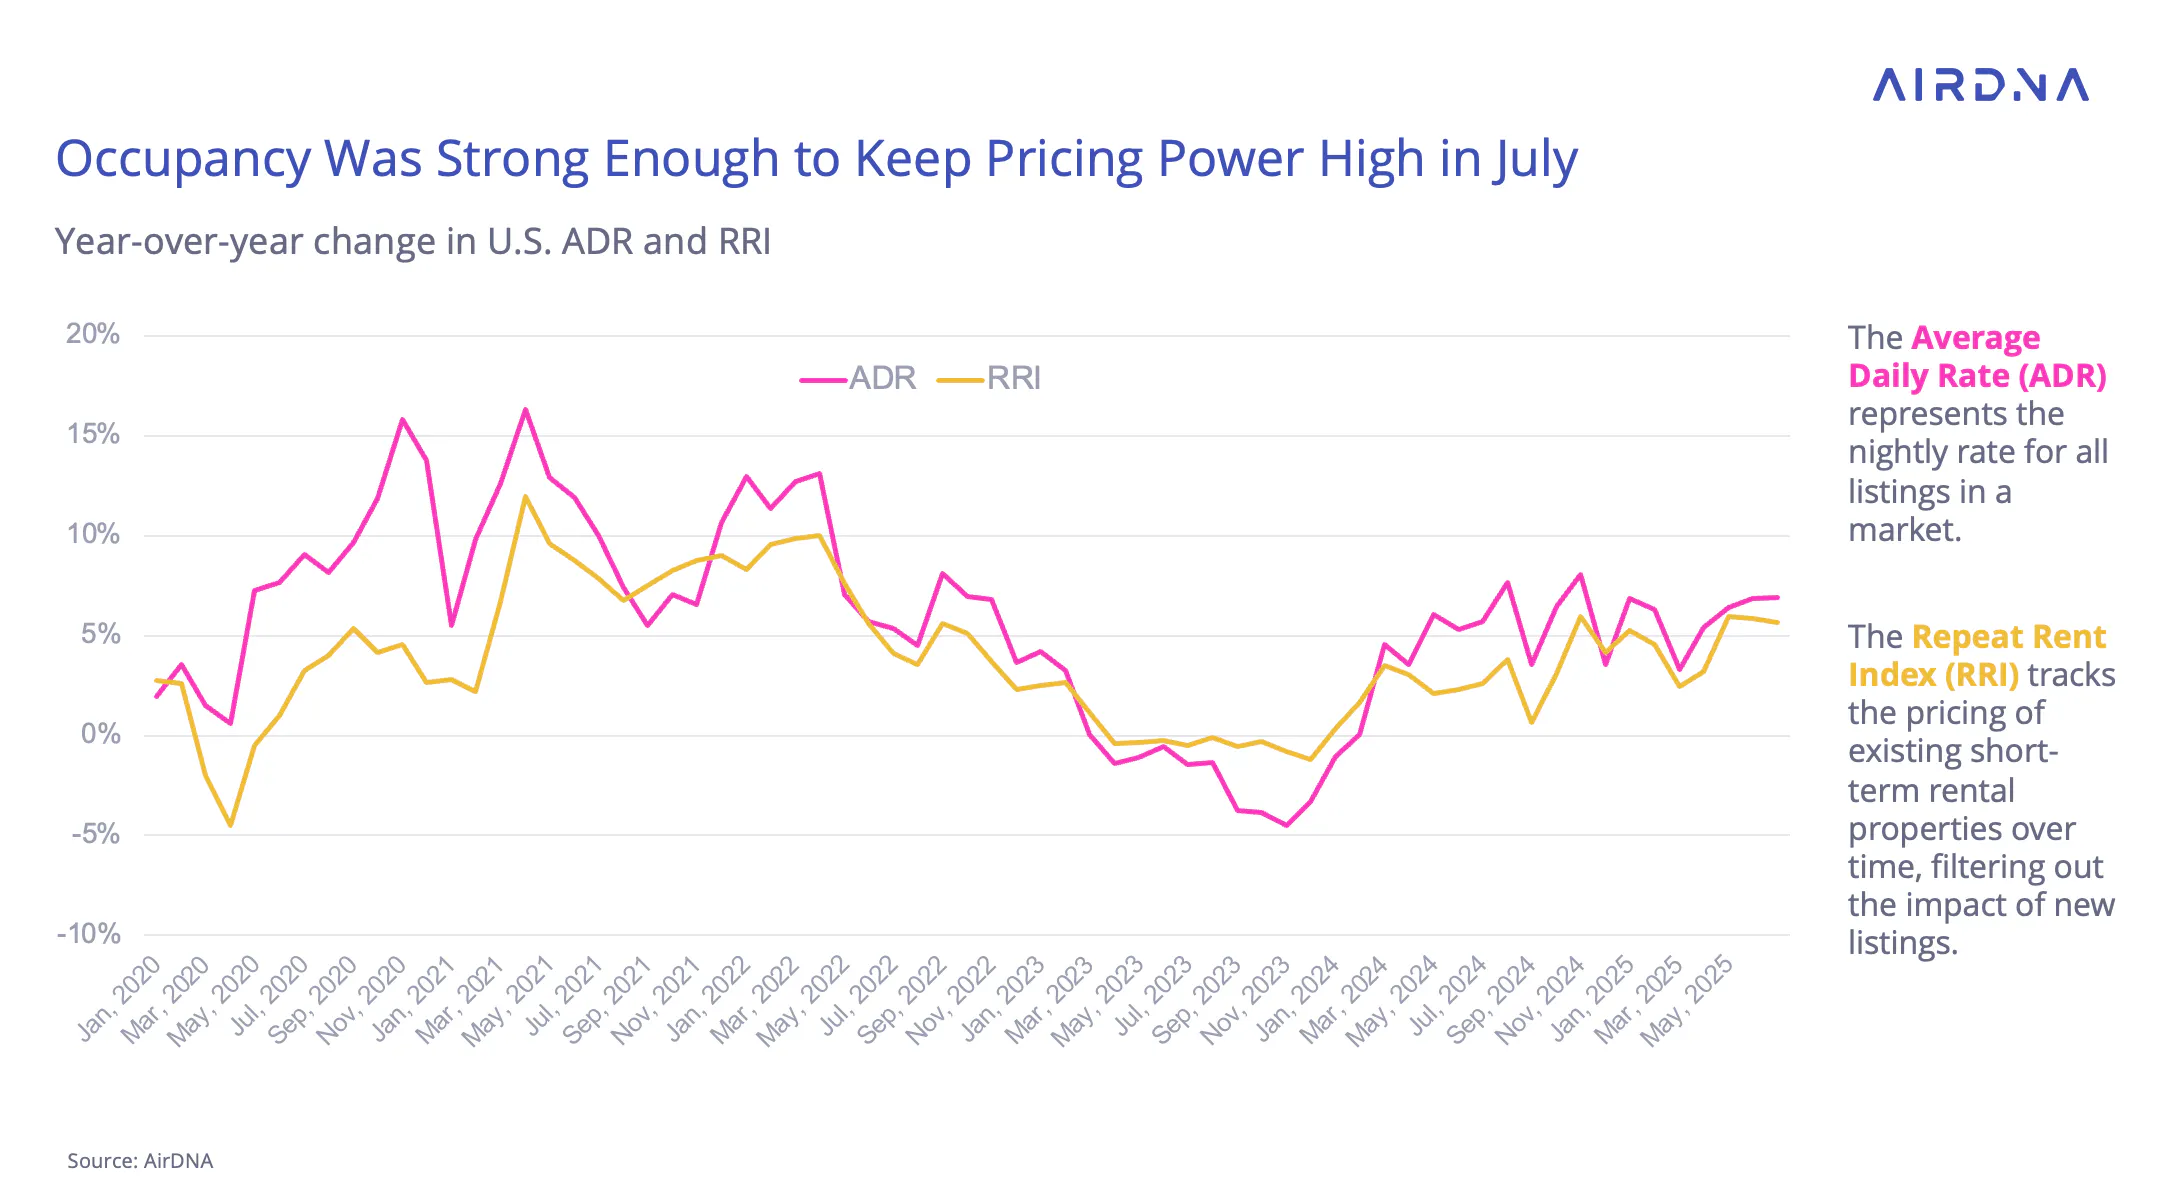
A key driver of this trend may be the growing interest in larger homes. Since February, demand for 6+ bedroom properties has grown more than 13 times faster than for single-bedroom listings, and about four times faster than for two-bedroom homes.

While summer occupancy remains slightly below 2024 levels, higher nightly rates have more than compensated, pushing RevPAR up 5.7% YoY across the U.S.
Coastal resorts led the way. Every market in this category (except Miami) posted RevPAR growth in July. In contrast, mountain/lake resorts and urban markets saw more mixed performance.
Leading RevPAR markets included Maui, Hawaii (+17.3%), which continues to recover post-wildfires, as well as Hilton Head’s Atlantic Beaches, South Carolina (+15.2%) and Charleston, South Carolina (+14.5%)—both of which saw strong rate-driven gains.

Why Pacing Data Isn’t Telling the Whole Story
Over the past year, shorter lead times have made pacing data less reliable as a predictor of future demand. Bookings have increasingly skewed toward very short notice, or, in the case of some luxury properties, unusually long lead times, making it harder to interpret pacing trends.
However, recent months suggest a modest return to stability. In May 2025, the median lead time matched the previous year at 28 days, narrowing what had been a 4–5 day gap earlier in the year. Lead times in June and July remained slightly shorter year-over-year (but by only one and two days, respectively), indicating a more consistent booking pattern than earlier in 2025.
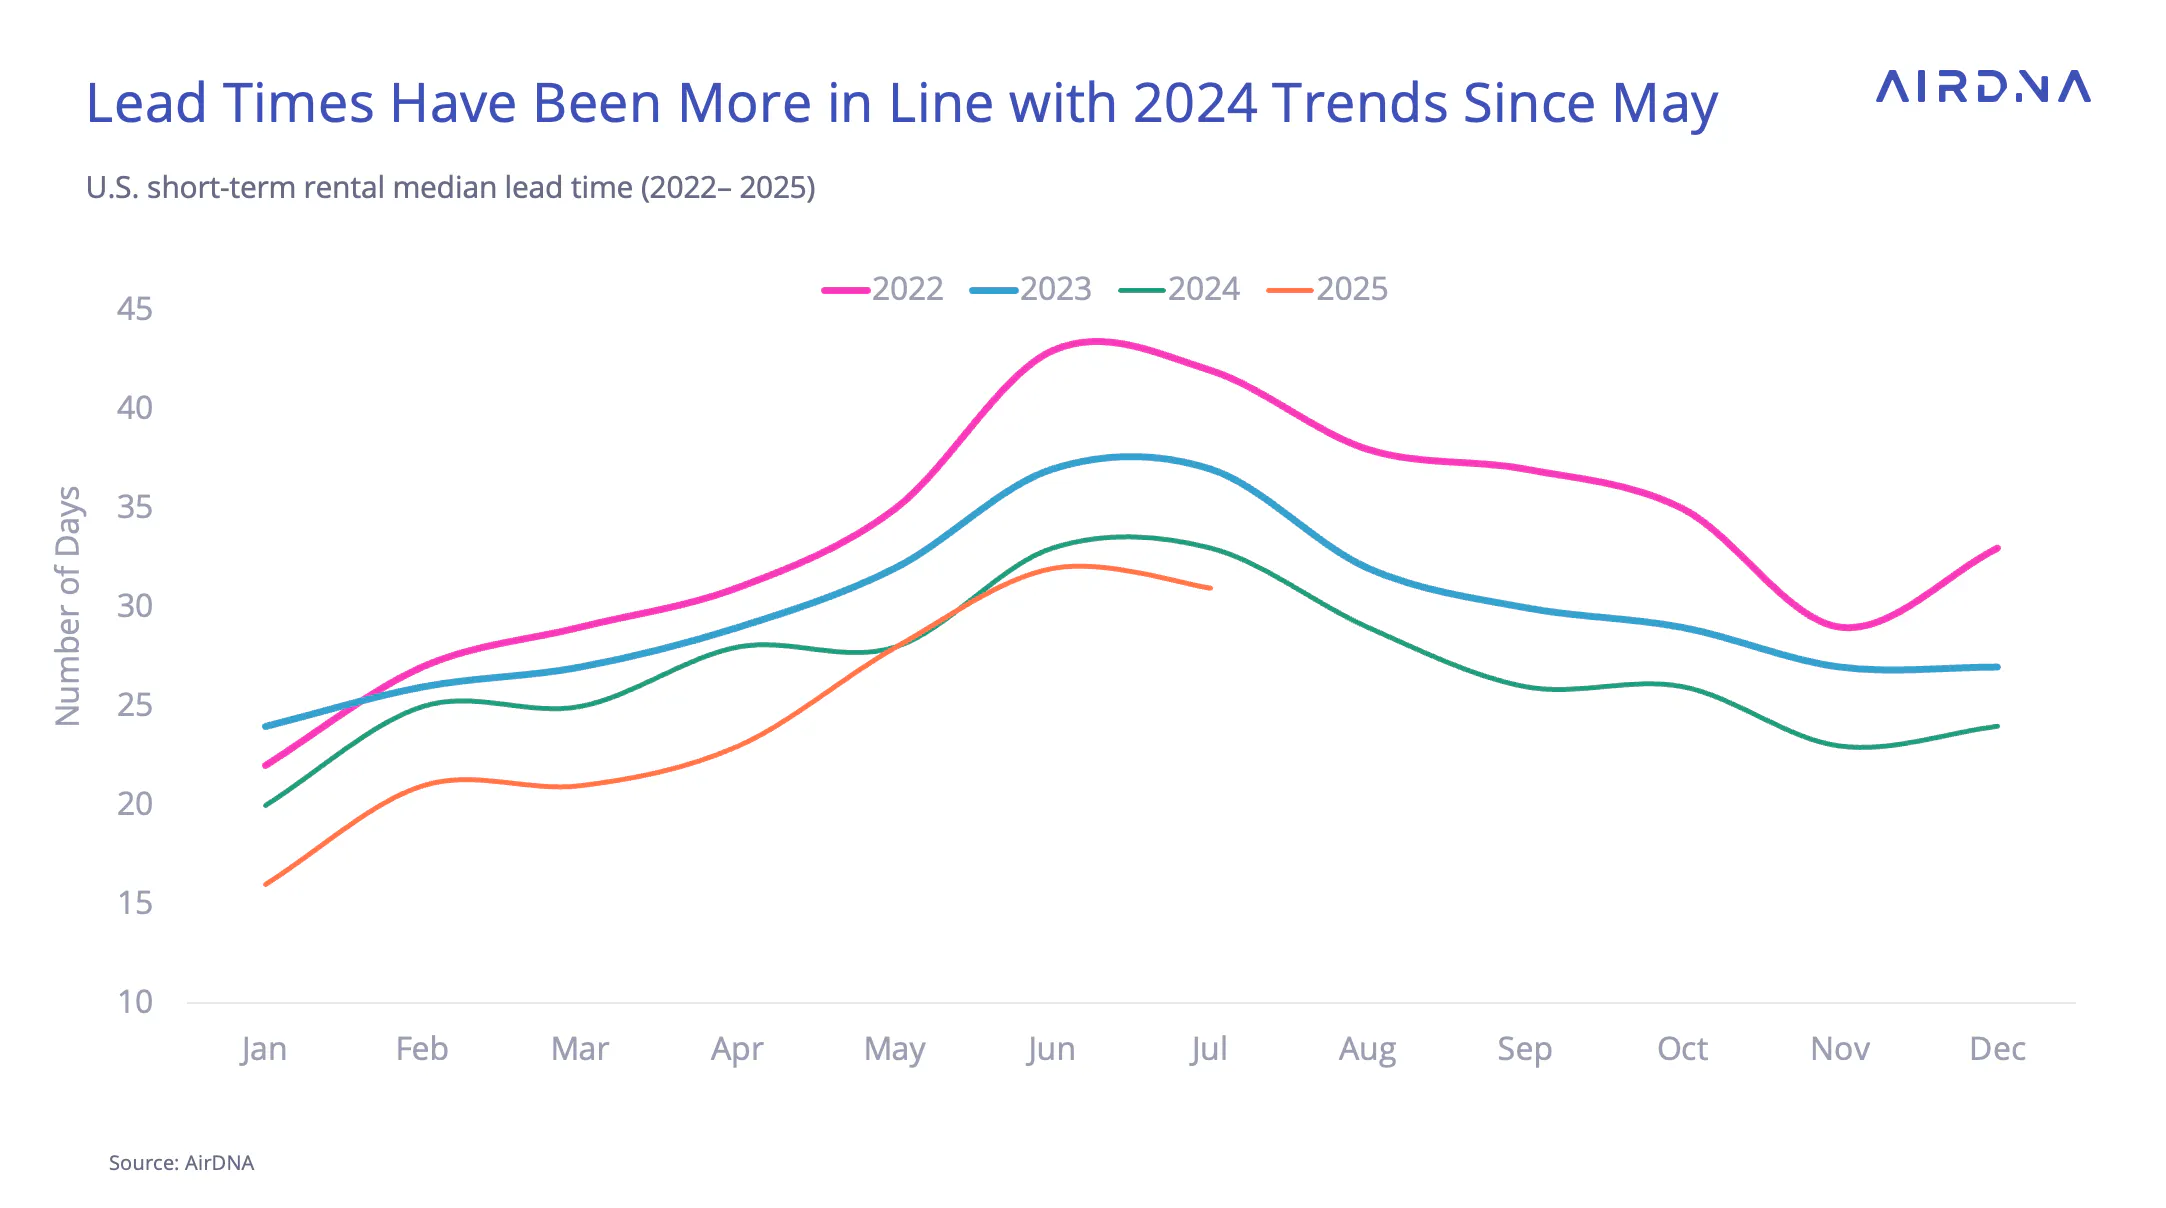
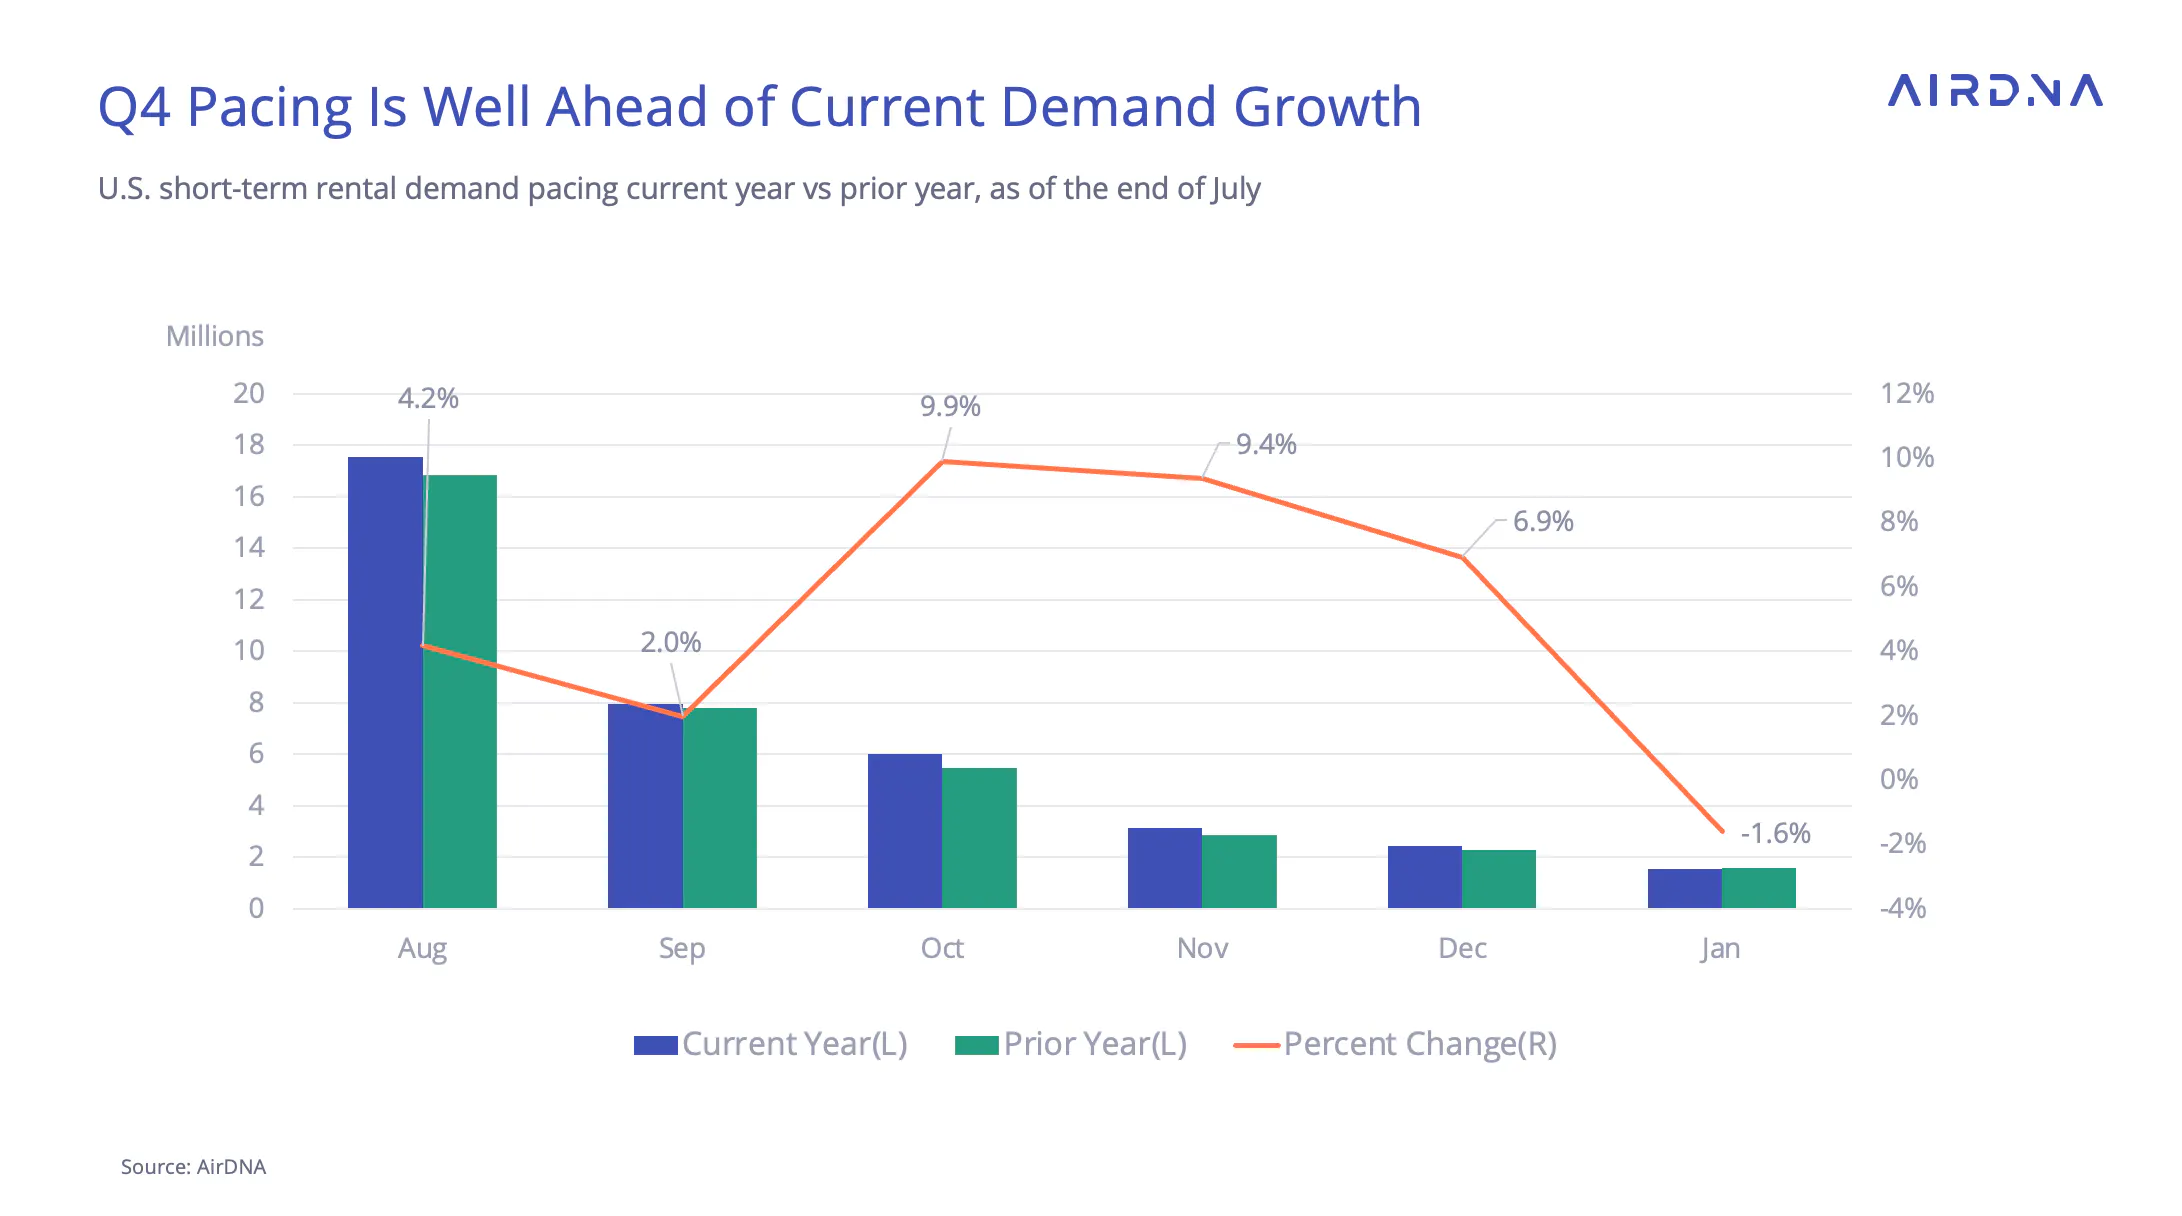
With that context in mind, August pacing stands at +4.2% YoY, a slight improvement over July. The earlier Labor Day (September 1st) shifts one peak weekend day from September into August, boosting this month’s numbers. September is pacing at +2.0%, in line with adjusted expectations.
October and November are pacing strongly, each about 9–10% ahead year-over-year, suggesting robust demand for the shoulder season. December pacing is up 6.9%, indicating that Q4 may see a return to stronger occupancy levels across the board.
International Travel Weakens as Canadian Demand Collapses
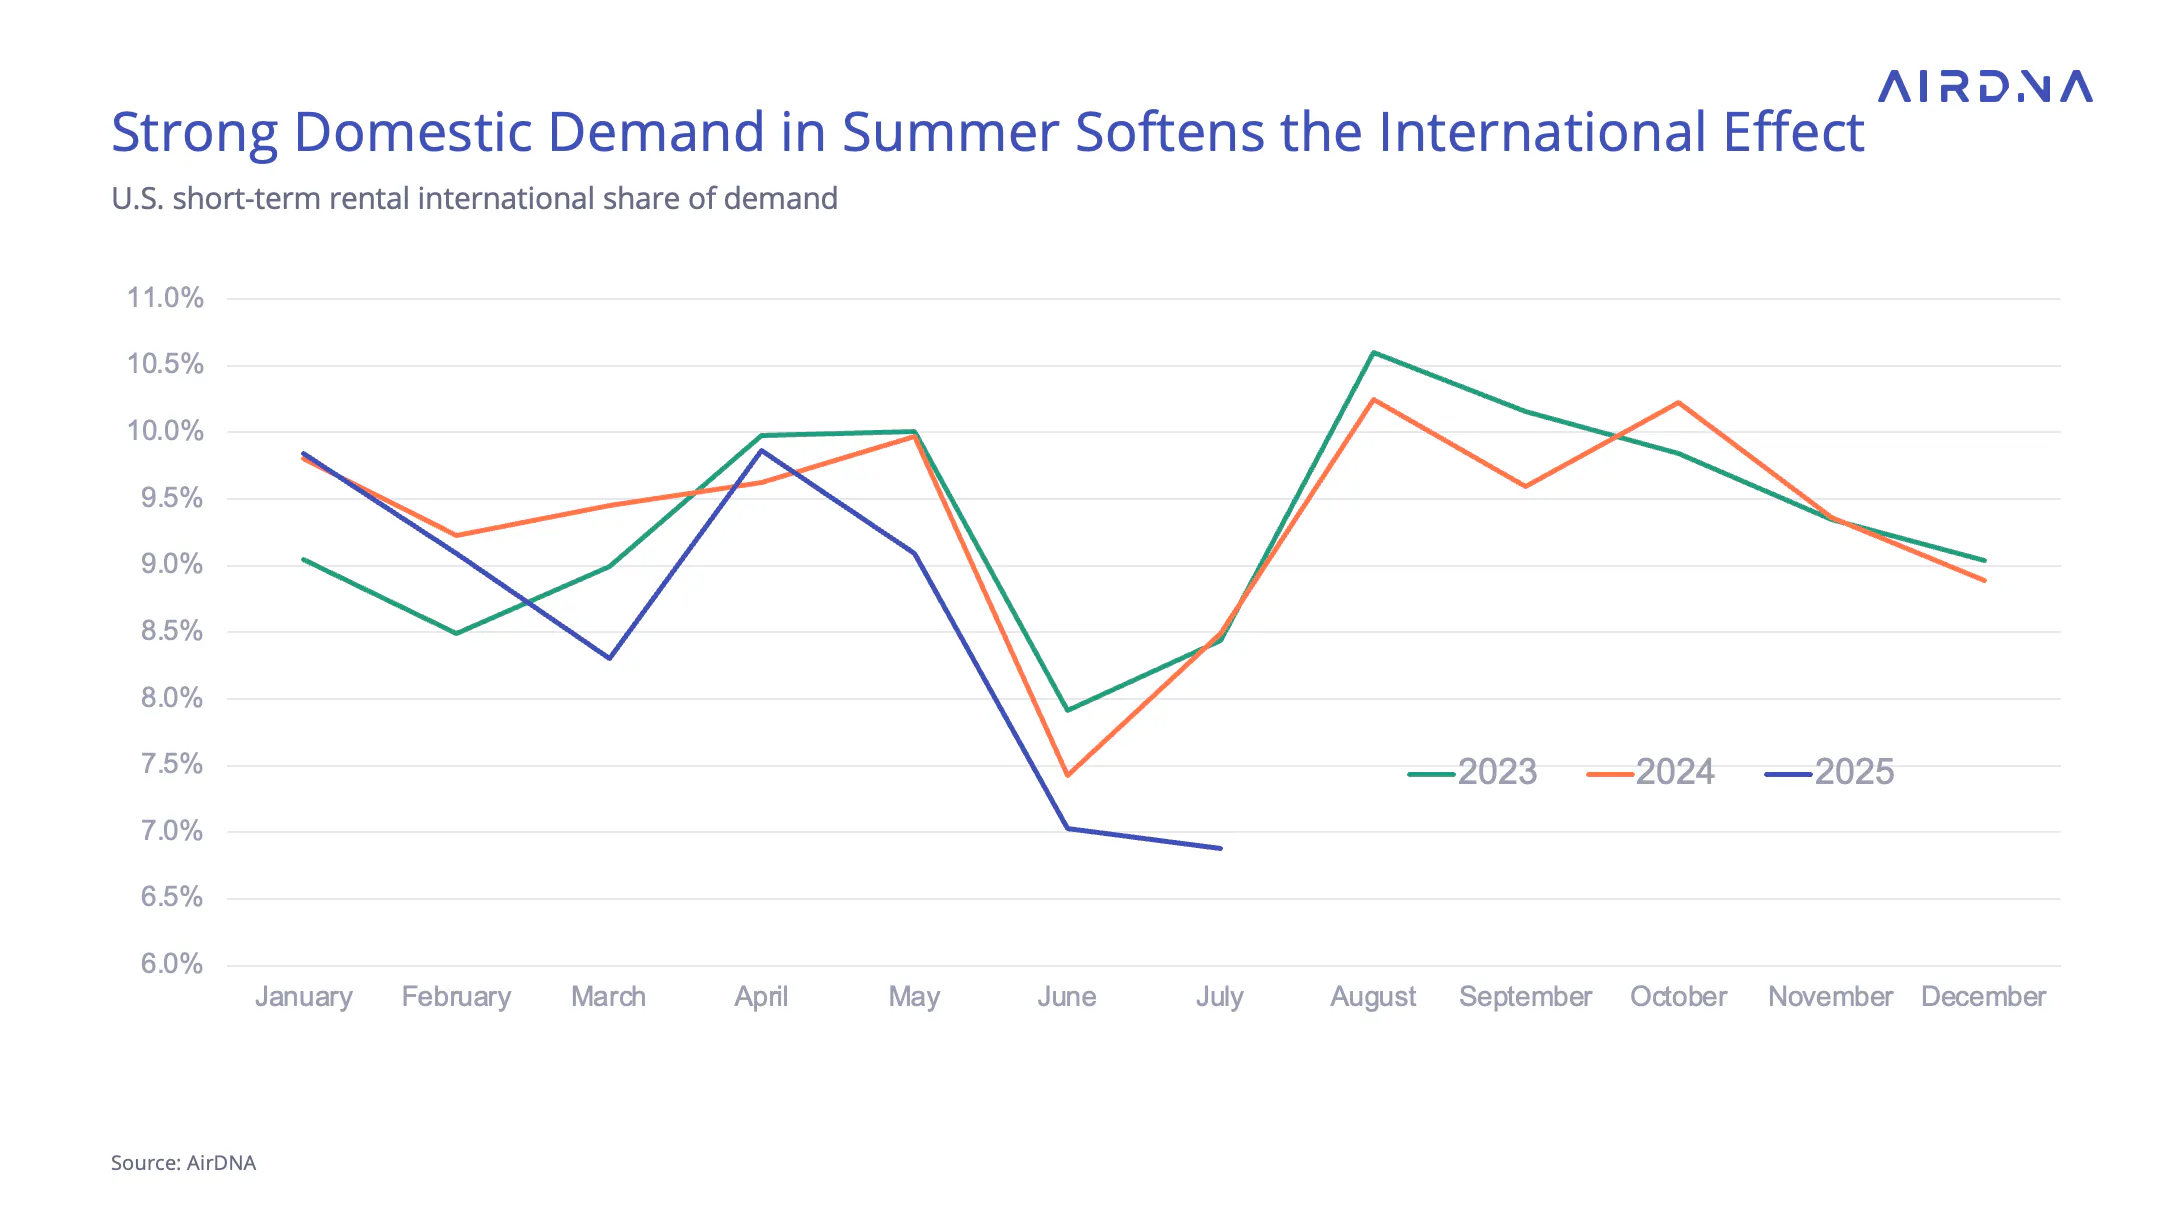
International demand was a drag on overall growth in July, with foreign guest stays declining 16.0% year-over-year, marking an even steeper drop than the -2.7% seen in June. The most significant contributor was Canada, where demand fell by nearly 50%, largely due to the ongoing travel boycott. Even when excluding Canadian travelers, international demand still declined 6.7% YoY, reversing a +5.9% gain in June.
Because AirDNA data focuses specifically on short-term rentals, it captures leisure-driven travel patterns more directly than broader datasets like the U.S. International Trade Administration’s I-94 arrivals. STR guests typically have greater discretion over their destinations compared to those traveling for business or family obligations. While our figures may show steeper swings, they closely align directionally with data from both Statistics Canada and the USITA.
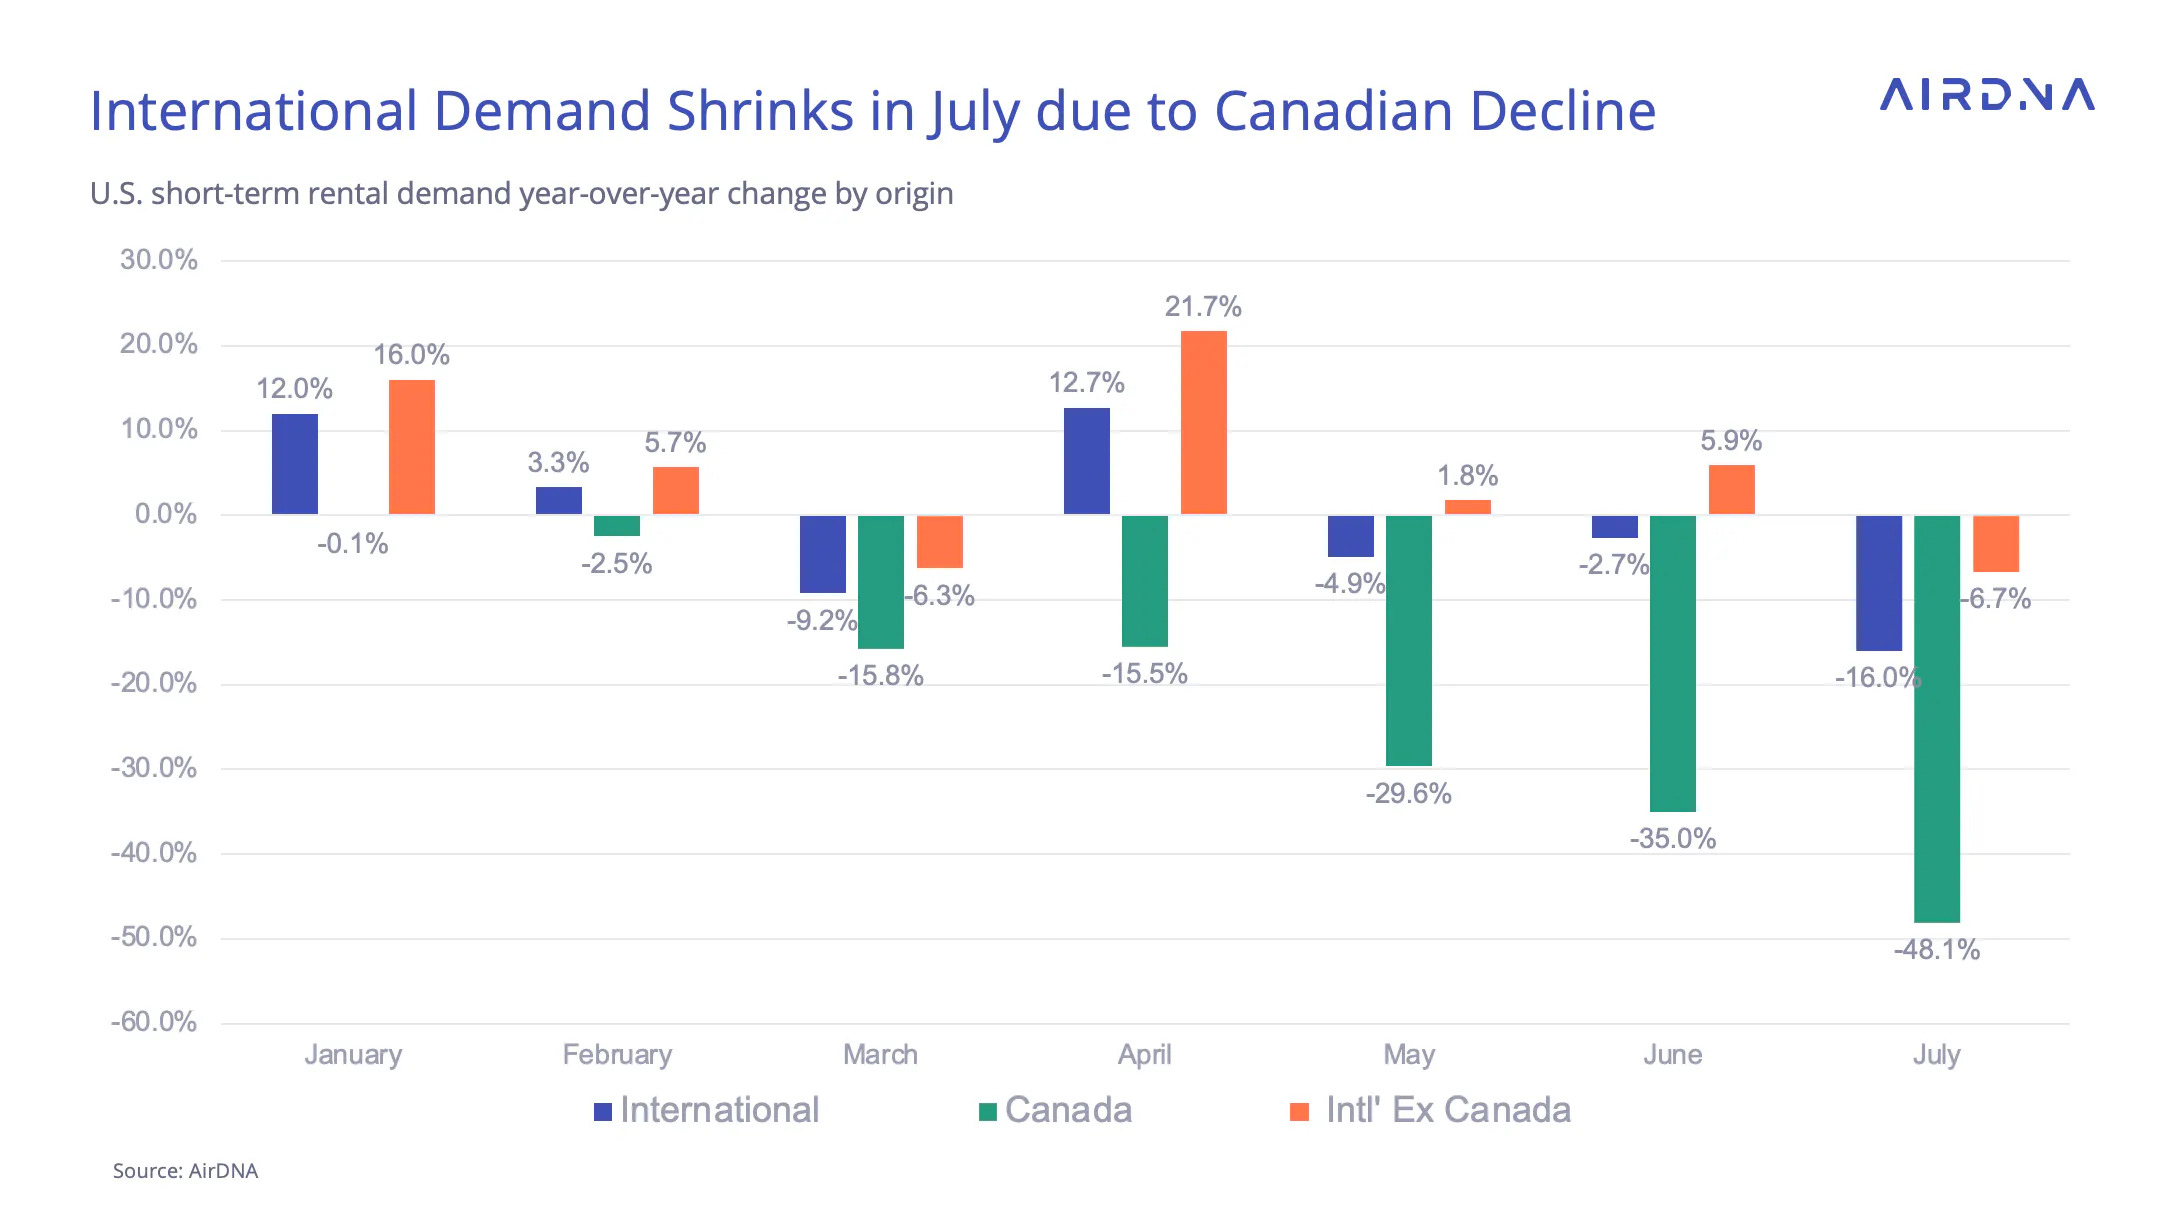
It’s also worth noting that June and July tend to skew heavily domestic. These months coincide with U.S. school breaks, when families are most likely to travel, reducing the international share of STR demand from the usual 9–10% to around 7–8%. This seasonal shift helps explain part of the summer dip in foreign guest activity.
ARTICLE SUMMARY
The U.S. STR market reached record demand in July 2025, despite continued economic uncertainty and a dip in international travel. Strong ADR growth, a rebound in booking activity, and promising Q4 pacing highlight the market’s resilience.
Bram Gallagher
AirDNA Director of Economics and Forecasting
Bram Gallagher is an Economist at AirDNA, specializing in uncovering insights that drive smarter short-term rental decisions. He put his Ph.D. in Economics from the University of Georgia to work researching and forecasting hotel data with CBRE prior to joining AirDNA, as well as teaching economics at a number of universities. In his spare time, Bram enjoys making wooden furniture with hand tools.


