

 Calculate Revenue
 Research Markets
 Find For Sale Properties
 Compare My Listing
 STR Revenue Calculator
 Custom Comp Sets
 Submarket Insights
 Custom Search Filters
 Rate Recommendations
 Performance Benchmarking
 Competitor Comparison
 Owner Contact Details
 Property-level performance data
 Tourism Insights
 Real Estate Investment Analytics
 About Us
 Sales
Sales Support
 Press
PressBest Art Towns for an Airbnb Investment
Published: January 27, 2026

Jamie Lane
Key Takeaways
- The best art towns for Airbnb investment are places where museums, galleries, and creative districts drive consistent, year-round visitation.
- Art-driven markets tend to offer steadier demand and less extreme seasonality than destinations that rely on a single attraction or peak season.
- Using AirDNA data to compare pricing, revenue potential, and yield helps identify art cities where cultural demand delivers real STR performance.
Art towns don’t draw the same kind of travel as beach or ski destinations. People come because they want to spend time in the place itself—walking gallery districts, visiting museums, going to shows, or planning a weekend around a festival or exhibition.
For short-term rental (STR) investors, art cities are compelling: there’s consistent visitation, less extreme seasonality, and demand is less tied to a single event or short peak window.
We dug into AirDNA data to identify the best art towns for an Airbnb investment based on yield, using the average revenue potential and average yield of properties that are currently for sale across the featured markets. Our findings reveal where art-driven demand meaningfully contributes to short-term rental returns.
Why Art Is a Powerful STR Investment Driver
Art and culture influence how people travel, why people travel, and how often they return. For STR investors, that makes creative cities worth a closer look.
Art creates reasons to travel year-round
Art-driven travel isn’t limited to one season. Museums, galleries, performance venues, and cultural districts draw visitors in every month of the year, which helps smooth out the sharp peaks and valleys you see in purely seasonal markets.
Art towns usually have built-in demand layers
Many of the best art cities also have universities, historic districts, food scenes, and walkable downtowns. Those overlapping demand drivers help support bookings beyond art-specific events and make these markets more resilient when one source of demand softens.
Plus, people don’t stumble into artsy towns by accident. They plan trips around exhibitions, festivals, performances, or creative neighborhoods they want to explore. That kind of intent often leads to longer stays, higher booking confidence, and less sensitivity to weather or last-minute changes.
Our Methodology for Ranking the Best Art Cities in the U.S. for Airbnbs
To identify the best art towns for Airbnb investments, we started by narrowing the field to U.S. cities and towns with a visible, established arts presence. That included places known for museums, galleries, and creative districts that consistently attract visitors.
From there, we evaluated how those markets actually perform as short-term rentals. Using AirDNA data, we compared average home prices against average revenue potential to determine each market’s average yield (in other words, how much income a property might produce relative to its purchase price).
The resulting list highlights artsy towns where STRs can realistically perform well.
Note: Average home prices, revenue potential, and yield for each market is based on currently for-sale properties, which change constantly. The figures in this report are based on data from December 2025 but will fluctuate as the real estate landscape evolves.
Best Art Towns for Airbnb Investments
Airbnbs tend to perform best in art cities that feel lived-in, walkable, and worth lingering in. Each city on this list combines an established creative scene with strong short-term rental performance, making them practical options for investors looking beyond purely seasonal demand.
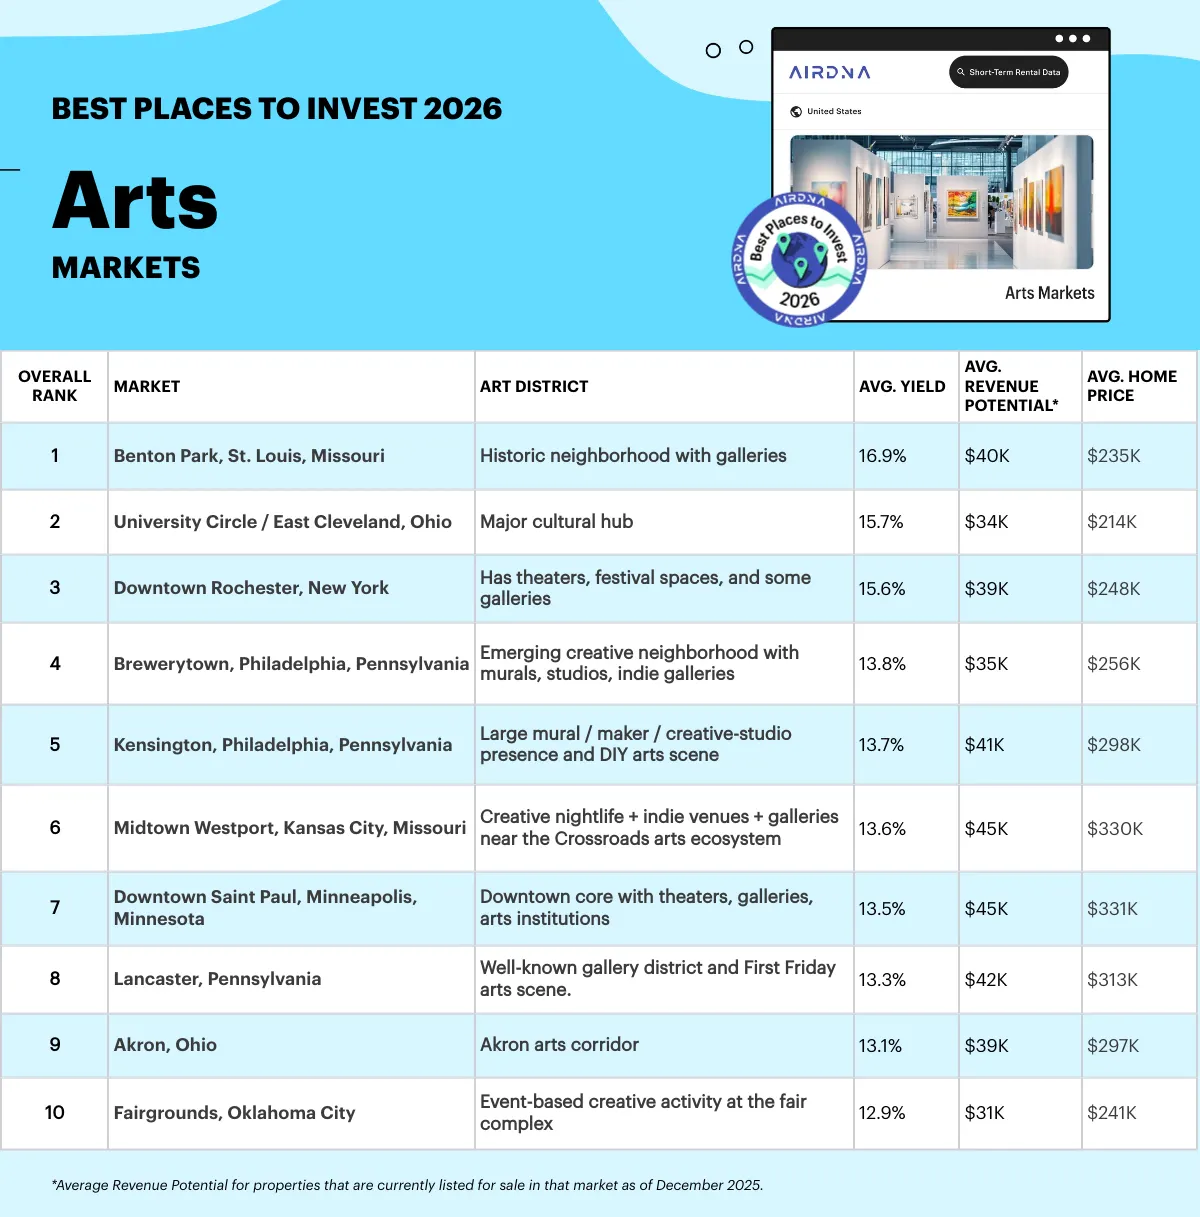
Keep in mind that variations in the types of property available mean that average home prices fluctuate at any given time. Investors should plan to look at yields for individual properties before buying.
1. Benton Park, St. Louis, Missouri
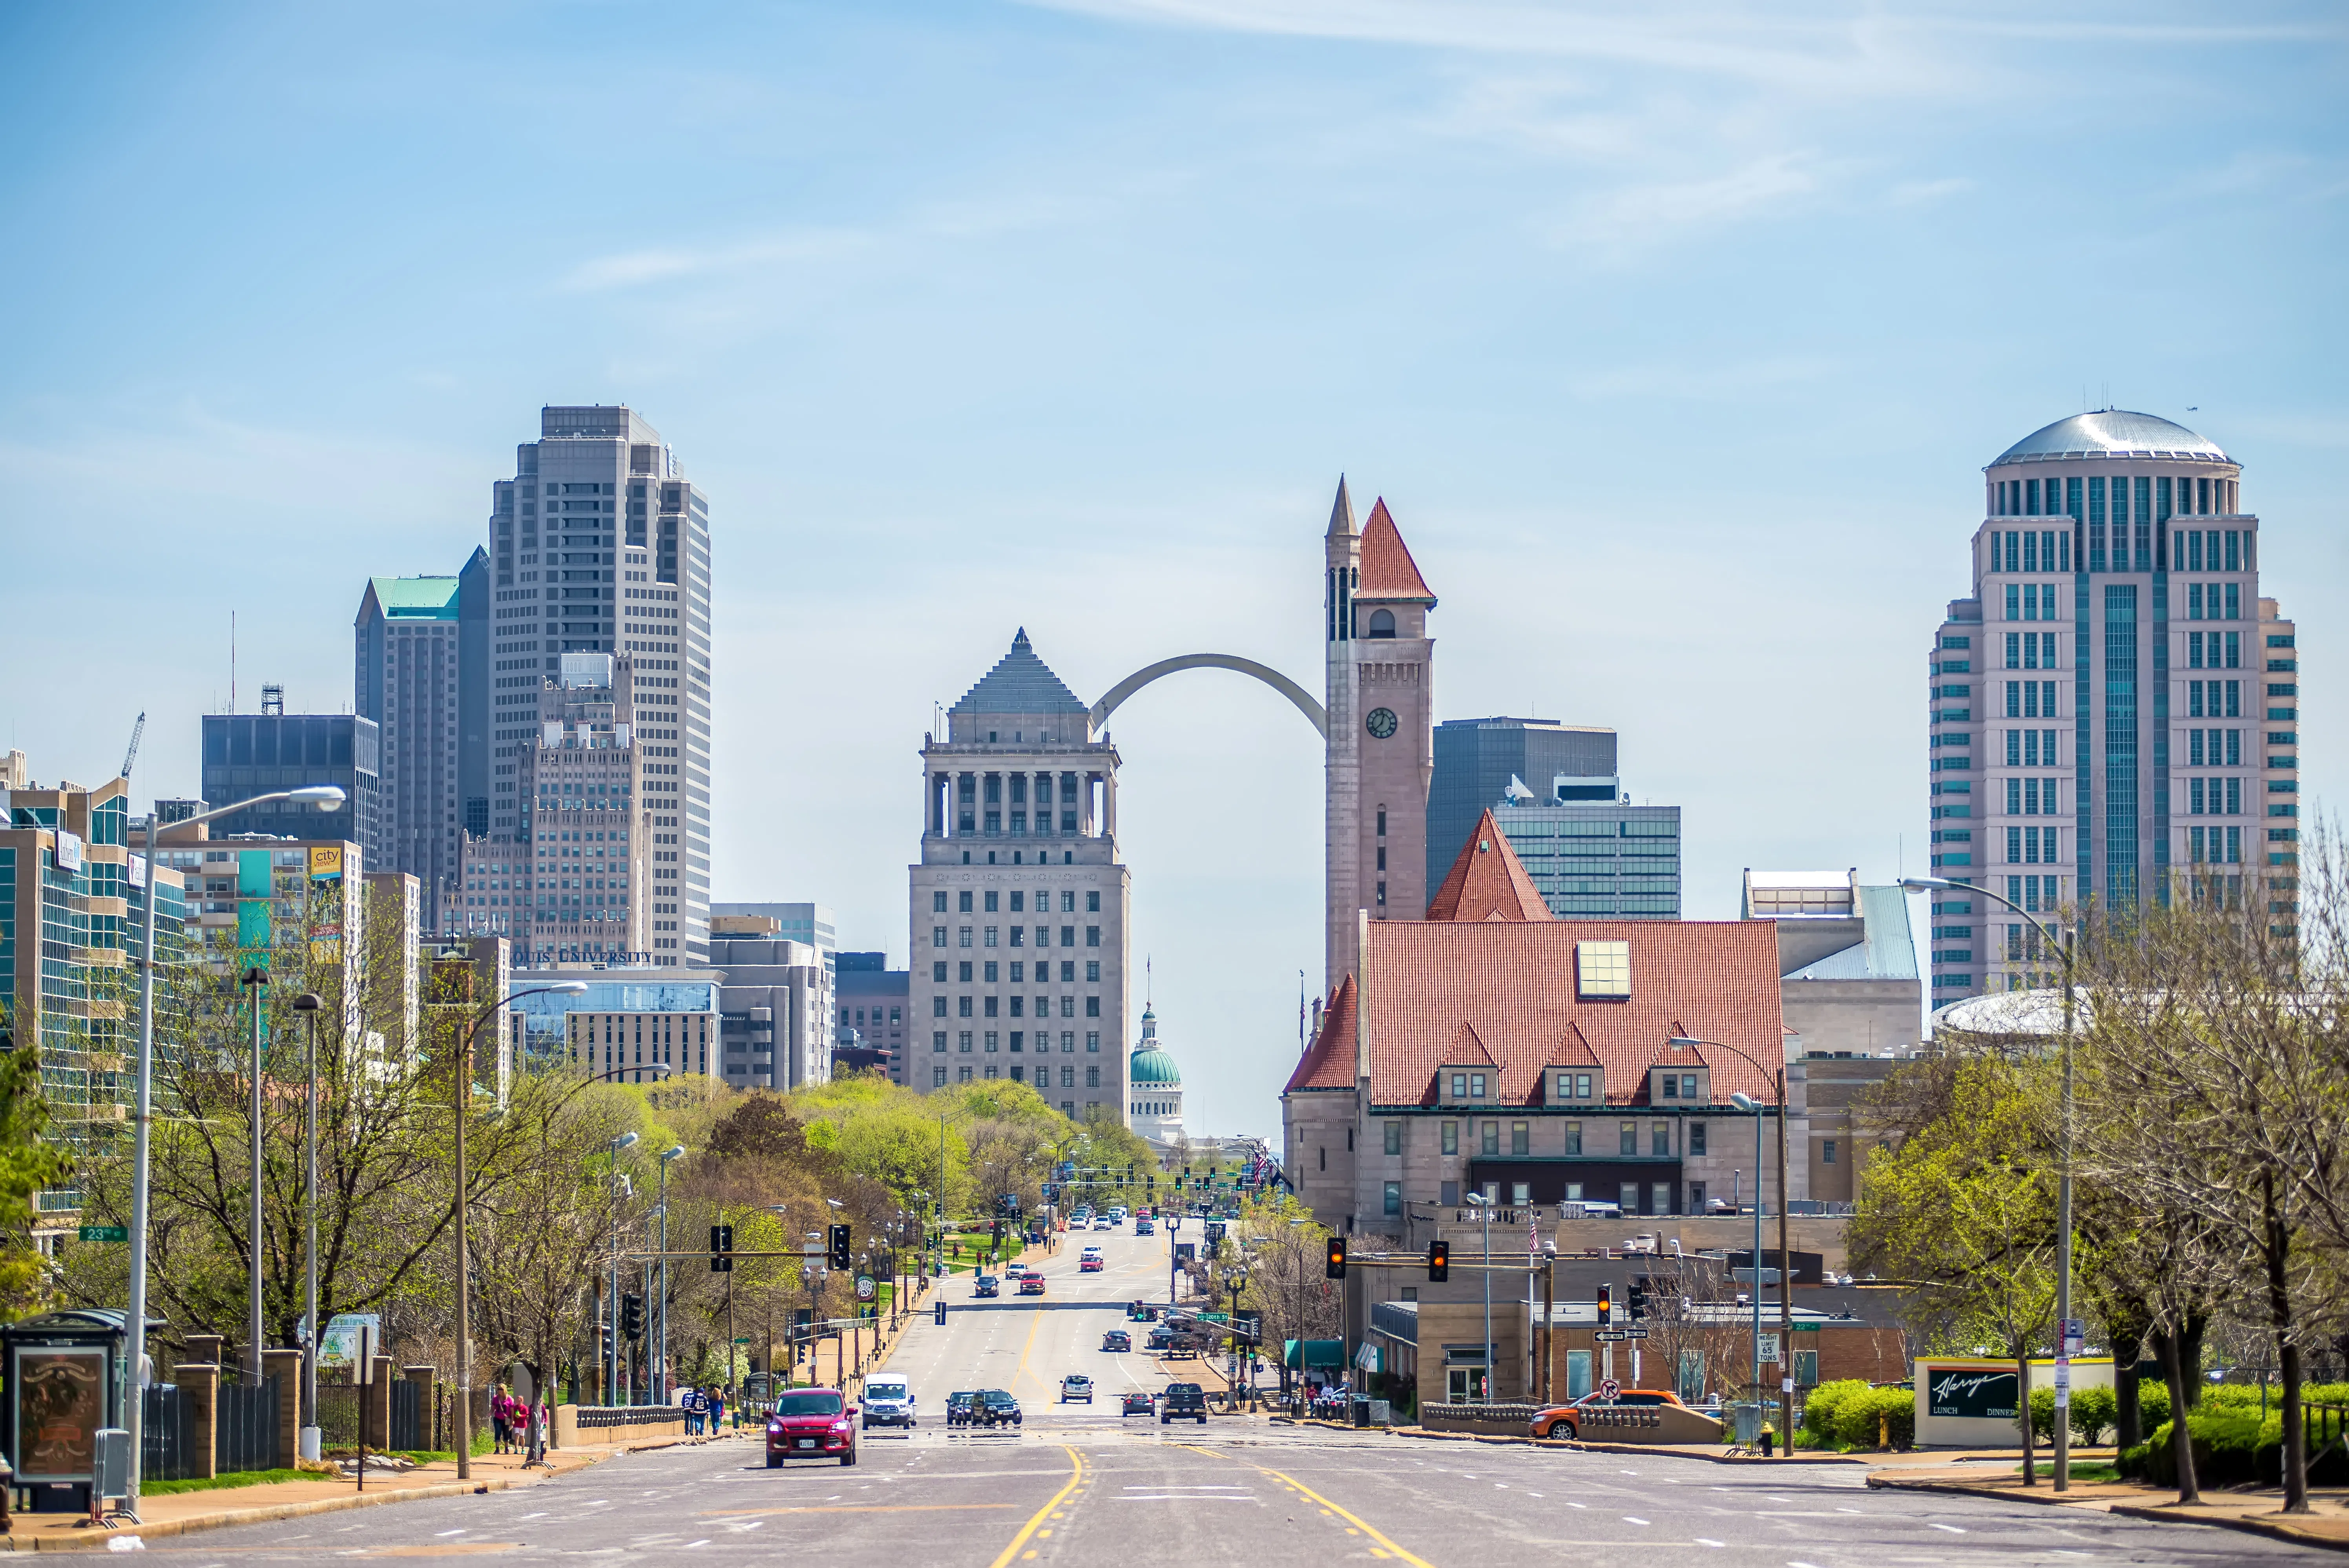

Benton Park stands out as a character-rich St. Louis submarket with unusually strong STR economics for an urban area. It’s a rare city neighborhood that hits the investor checklist: walkable streets, historic housing stock, and guests who want an authentic experience instead of a generic hotel stay.
Demand here is driven by both the neighborhood and the city around it. A growing creative presence consisting of murals, galleries, and art-forward local businesses adds to the neighborhood’s sense of place and appeal. Benton Park’s restaurants, bars, green space, and walkability make it easy for guests to settle in and explore, while nearby St. Louis attractions and brewery experiences add recognizable pull that supports consistent bookings.
From a numbers standpoint, the market is compelling. Average home prices are affordable at $235K, and with almost $40K in revenue potential, Benton Park delivers a whopping average yield of 16.9%. That combination creates a comfortable margin between monthly mortgage payments and monthly short-term rental income, giving STR hosts more flexibility around expenses and seasonal swings.
Regulations:
St. Louis’ regulatory environment is currently somewhat uncertain. The City’s Ordinance 71729 mandates that all short-term rentals obtain a permit. However, a court order filed in April 2025 prohibited the City of St. Louis from enforcing the ordinance. While the court’s order is in effect, the City is not enforcing its permit requirements. While regulations hang in the balance, investors should underwrite conservatively and monitor guidance from the city on the latest enforcement and implementation updates.
2. University Circle / East Cleveland, Ohio

- Average home price: $213,681
- Revenue potential: $33,591
- Average yield: 15.7%
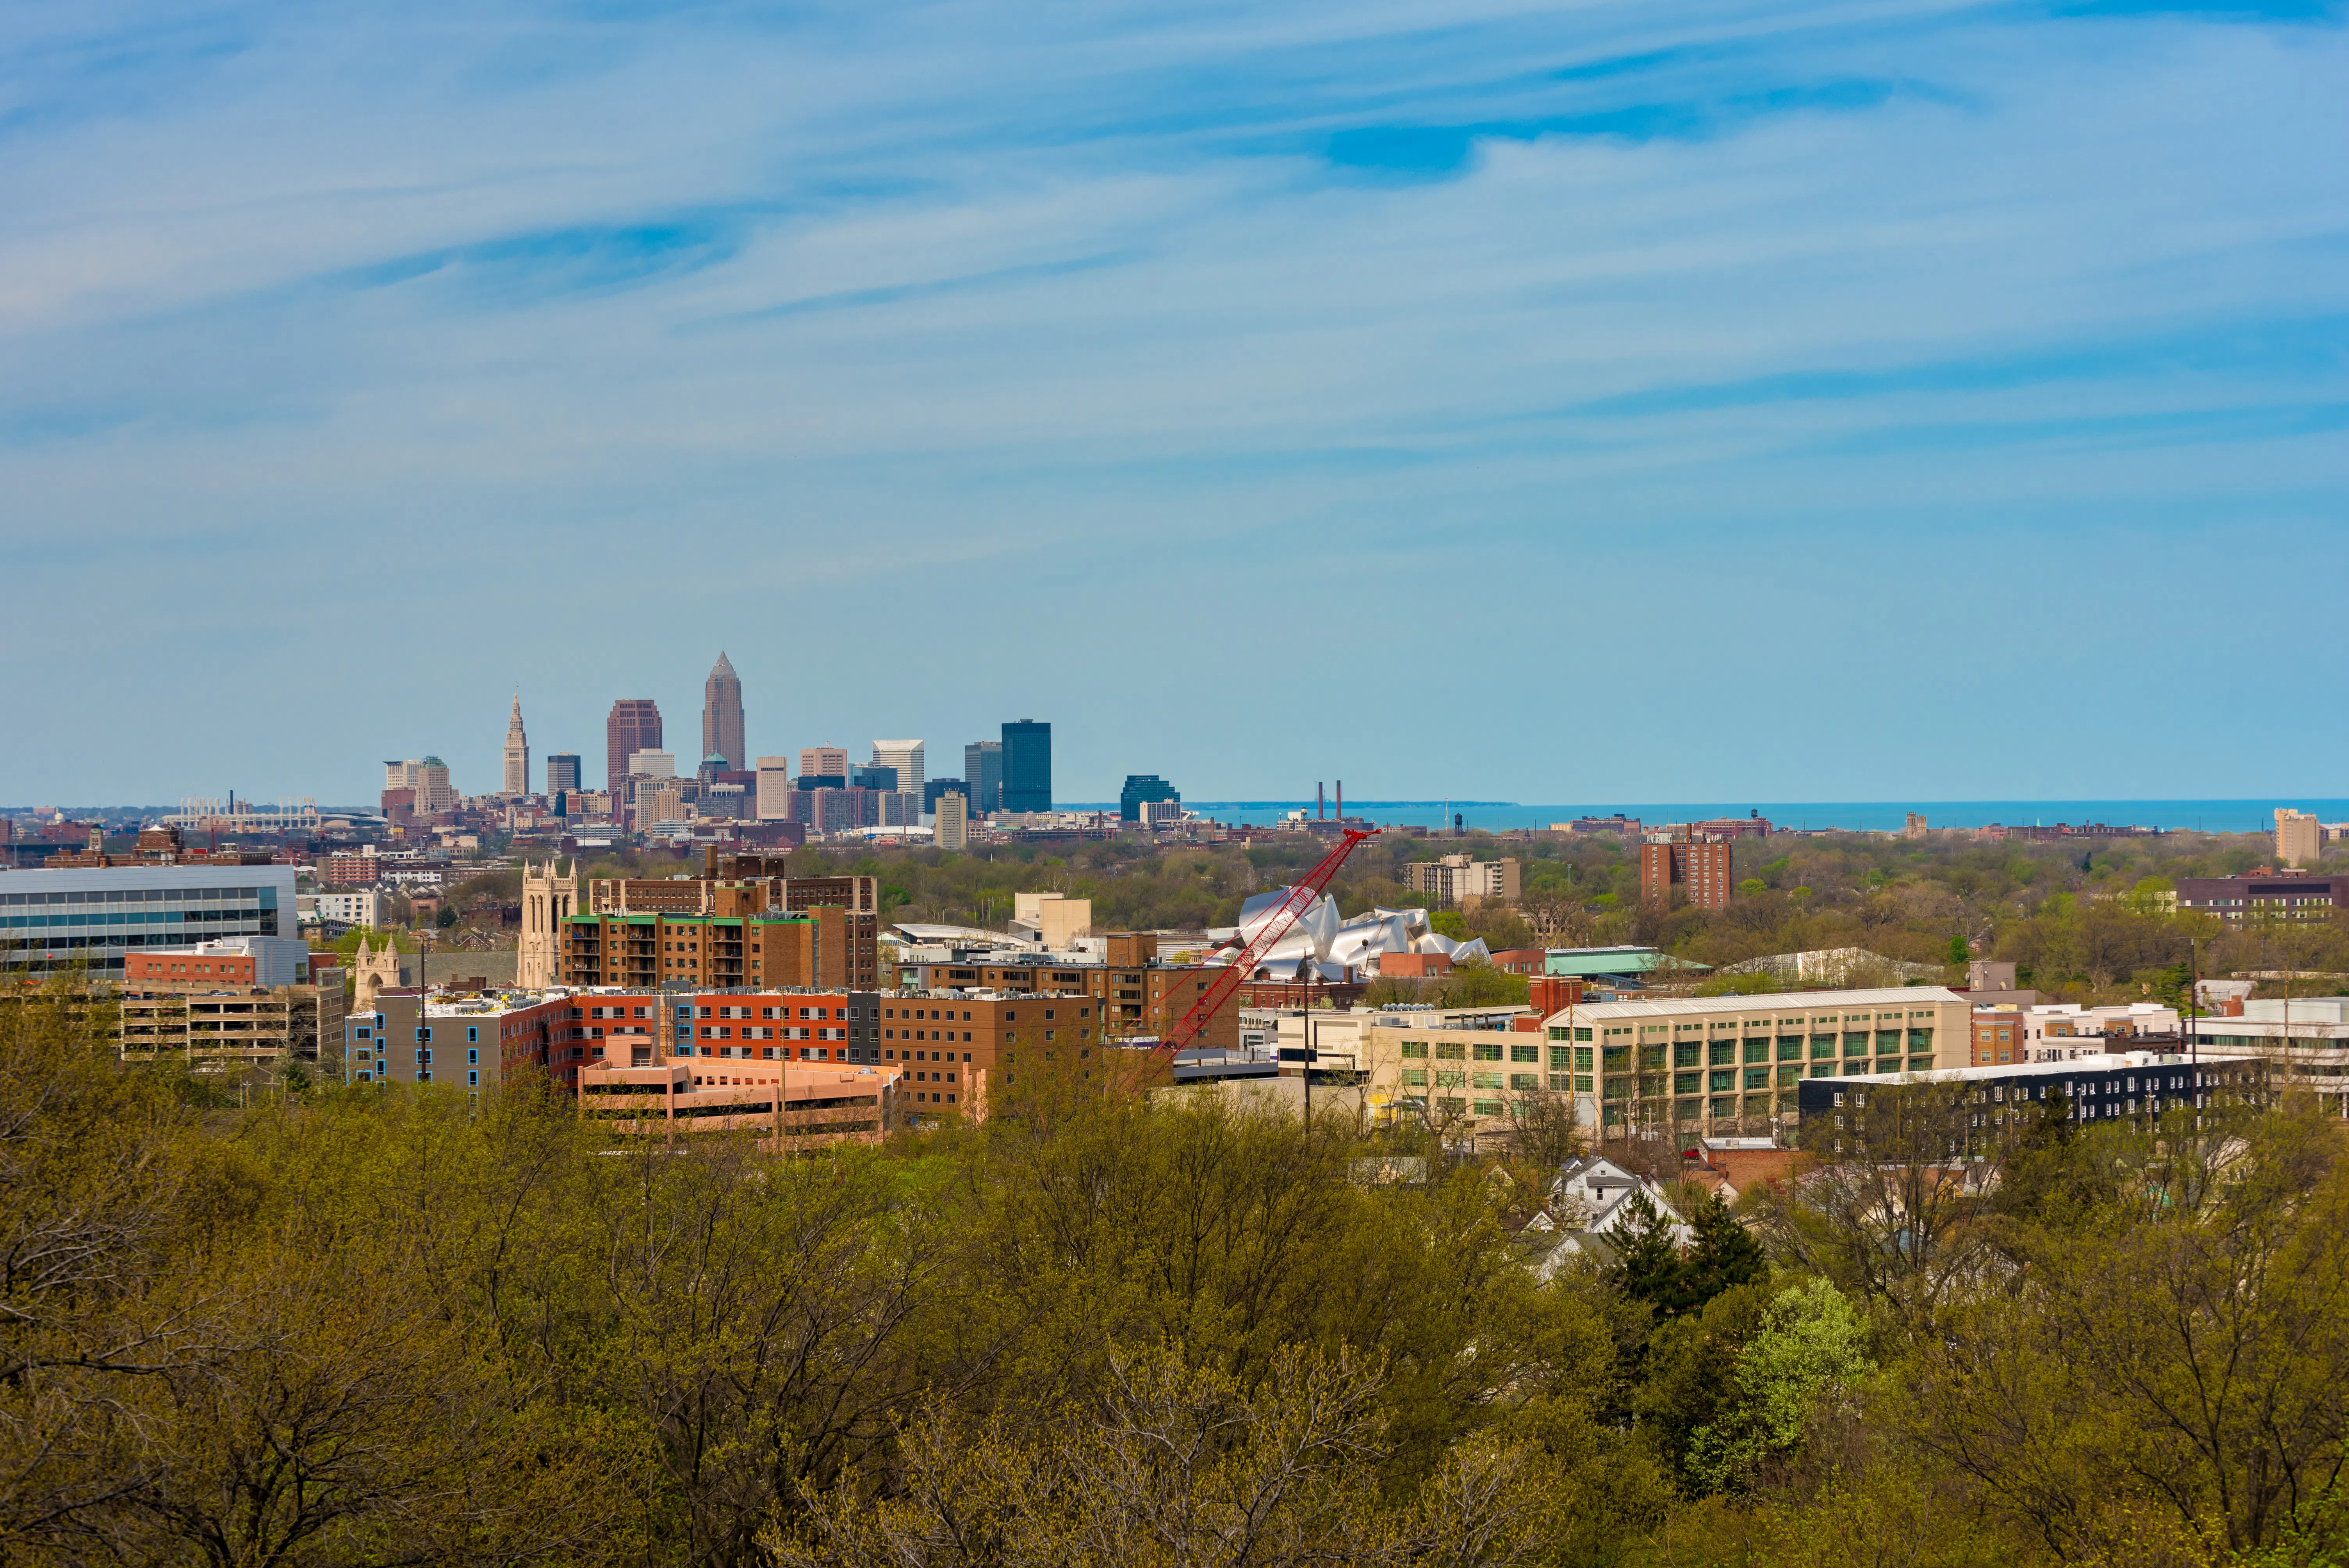
University Circle, a neighborhood in East Cleveland, delivers steady, year-round demand powered by a concentration of arts, education, and healthcare. Rather than relying on seasonal tourism, the neighborhood benefits from a consistent mix of museum visitors, university-related travel, and medical stays to support more stable occupancy throughout the year. Average occupancy hits a low of 55% in January and a high of 74% in July.
Art and culture are core to the draw. World-class museums, cultural institutions, and a packed events calendar give the area a clear reason to visit and stay nearby. That creative ecosystem drives both weekend leisure trips and midweek bookings, while nearby dining and mixed-use development help extend stays to an average of 7 days at a time.
From a performance standpoint, the numbers hold up. Average home prices in University Circle are around $213K, with $33,591 in revenue potential and an average yield of 15.7%. For an urban, art-driven neighborhood, that balance reflects strong income relative to price.
Regulations:
Cleveland appears to have zoning, licensing, and inspection requirements for short-term rentals. However, local reporting indicates Cleveland has proposed a stricter licensing framework with fees and renewals. Since STR policies seem up in the air, investors should verify city rules before buying.
3. Downtown Rochester, New York
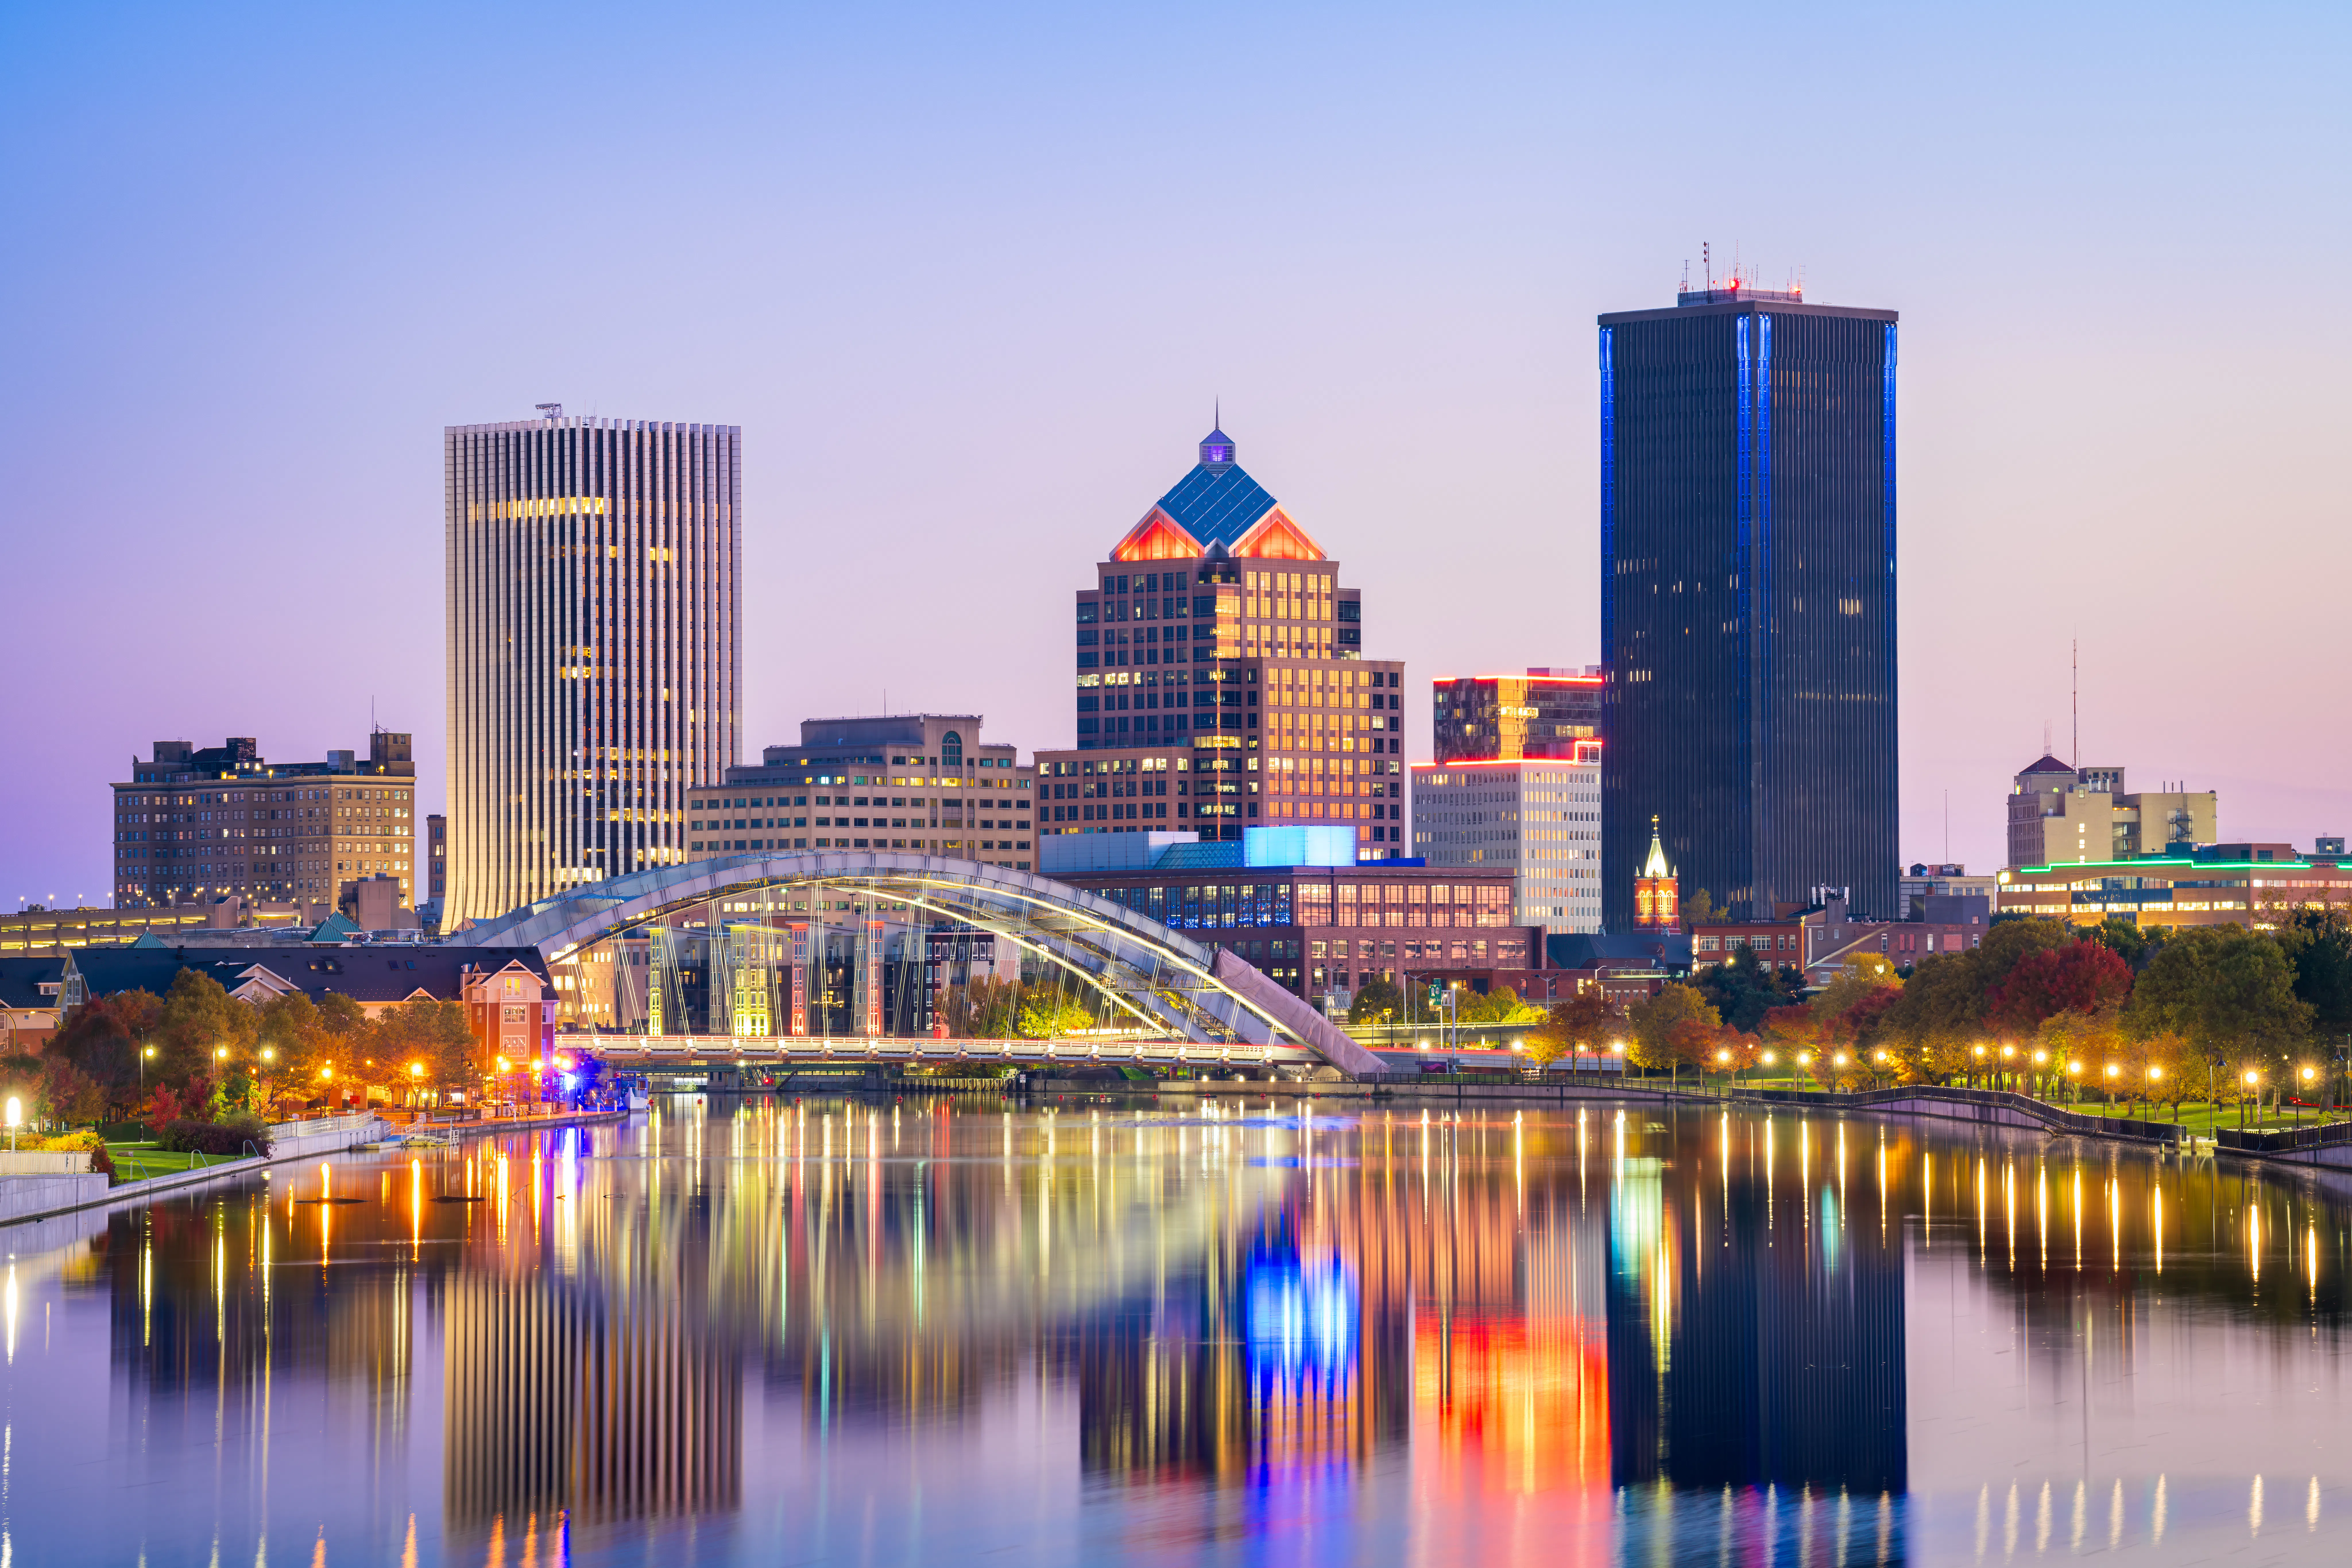

Downtown Rochester offers an accessible entry point paired with steady, year-round demand driven by arts, culture, events, and business travel. Its walkable urban core attracts a wide mix of guests, supporting consistent occupancy that stays above 50% year-round.
Art and culture anchor demand in Downtown Rochester. Major institutions like The Strong National Museum of Play and the George Eastman Museum, along with festivals, markets, and a growing food scene, give visitors clear reasons to stay downtown. Rochester also benefits from being a gateway to Finger Lakes wine country, expanding the guest mix to include weekend wine travelers who want a city stay with easy day-trip access.
The investment math in Downtown Rochester stands out. Average home prices sit under $250K and short-term rentals deliver an average yield of 15.6%. Ultimately, the city offers a balanced risk/reward profile for enterprising short-term rental investors.
Regulations:
Monroe County appears to have chosen not to implement the state-mandated short-term rental registry, meaning that no county-wide host registration system is in place. According to rochesterhousingcoalition.com, the City of Rochester is exploring zoning changes that include potential bans on STRs in low-density residential areas. Investors should do their due diligence and contact the City to assess STR feasibility for a specific property before investing.
4. Brewerytown, Philadelphia, Pennsylvania
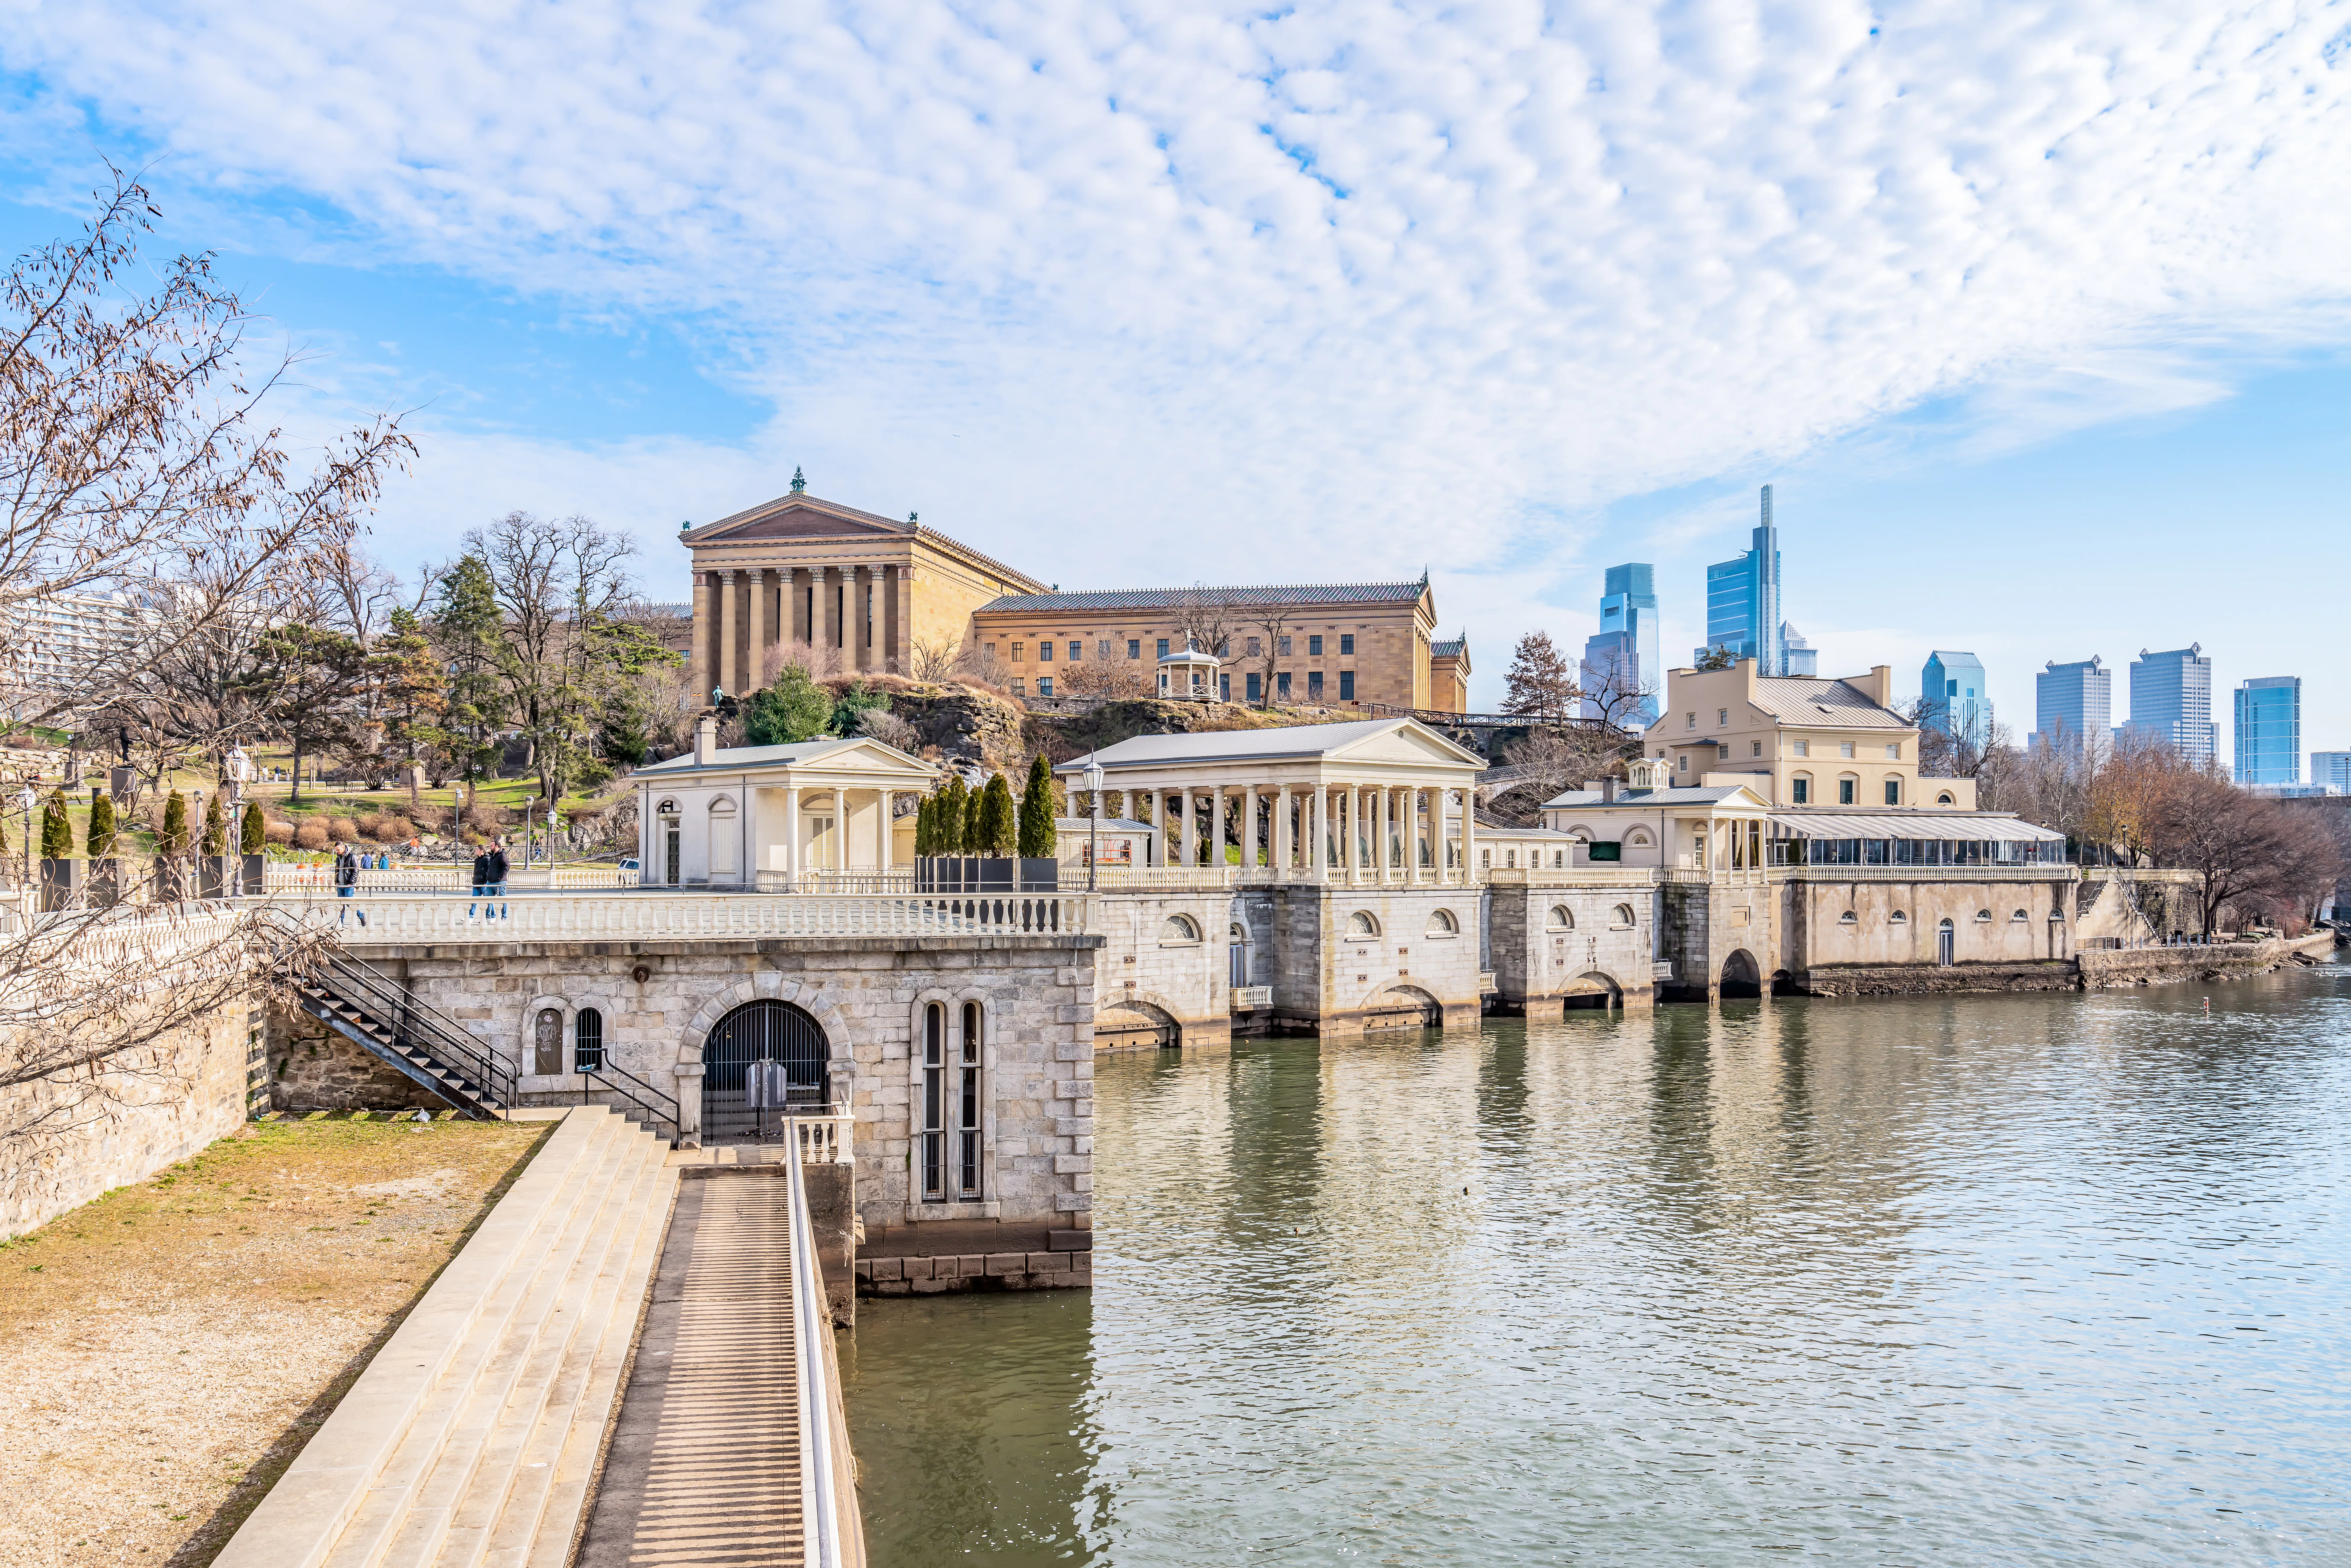

Situated along the Schuylkill River in North Philadelphia, Brewerytown is a neighborhood with easy access to Center City at a more attainable entry point. Its mix of historic character and a growing arts, food, and craft beer scene appeals to guests looking for a neighborhood-based experience rather than your run-of-the-mill hotel stay.
Demand is driven by both place and proximity. Brewerytown’s galleries, creative spaces, breweries, and local spots give guests reasons to explore on foot, while its location makes it easy to reach Philadelphia’s major museums, cultural institutions, and historic sites. That combination supports steady weekend bookings and consistent year-round visitation.
From a numbers standpoint, the market holds up. Average home prices are reasonably priced at ~$255K and STRs here deliver an average yield of 13.8%. For an urban, arts-adjacent neighborhood in a major East Coast city, that balance reflects solid income relative to price without relying on peak-season surges.
Kensington, located about a 20-minute drive east of Brewerytown, is another compelling arts neighborhood within the Philly area. The average for-sale property is a bit pricier at $298k than Brewerytown, but average revenue potential is also about $5k more per year.
Regulations:
Philadelphia requires STR hosts to get a zoning permit to rent a property short-term. You may also need a
Limited Lodging Operator License or a Rental License with a hotel designation.
Overall, the city’s regulations are structured rather than hands-off. They’re workable for professional operators who follow permitting rules, but not “set it and forget it.”
5. Midtown Westport, Kansas City, Missouri
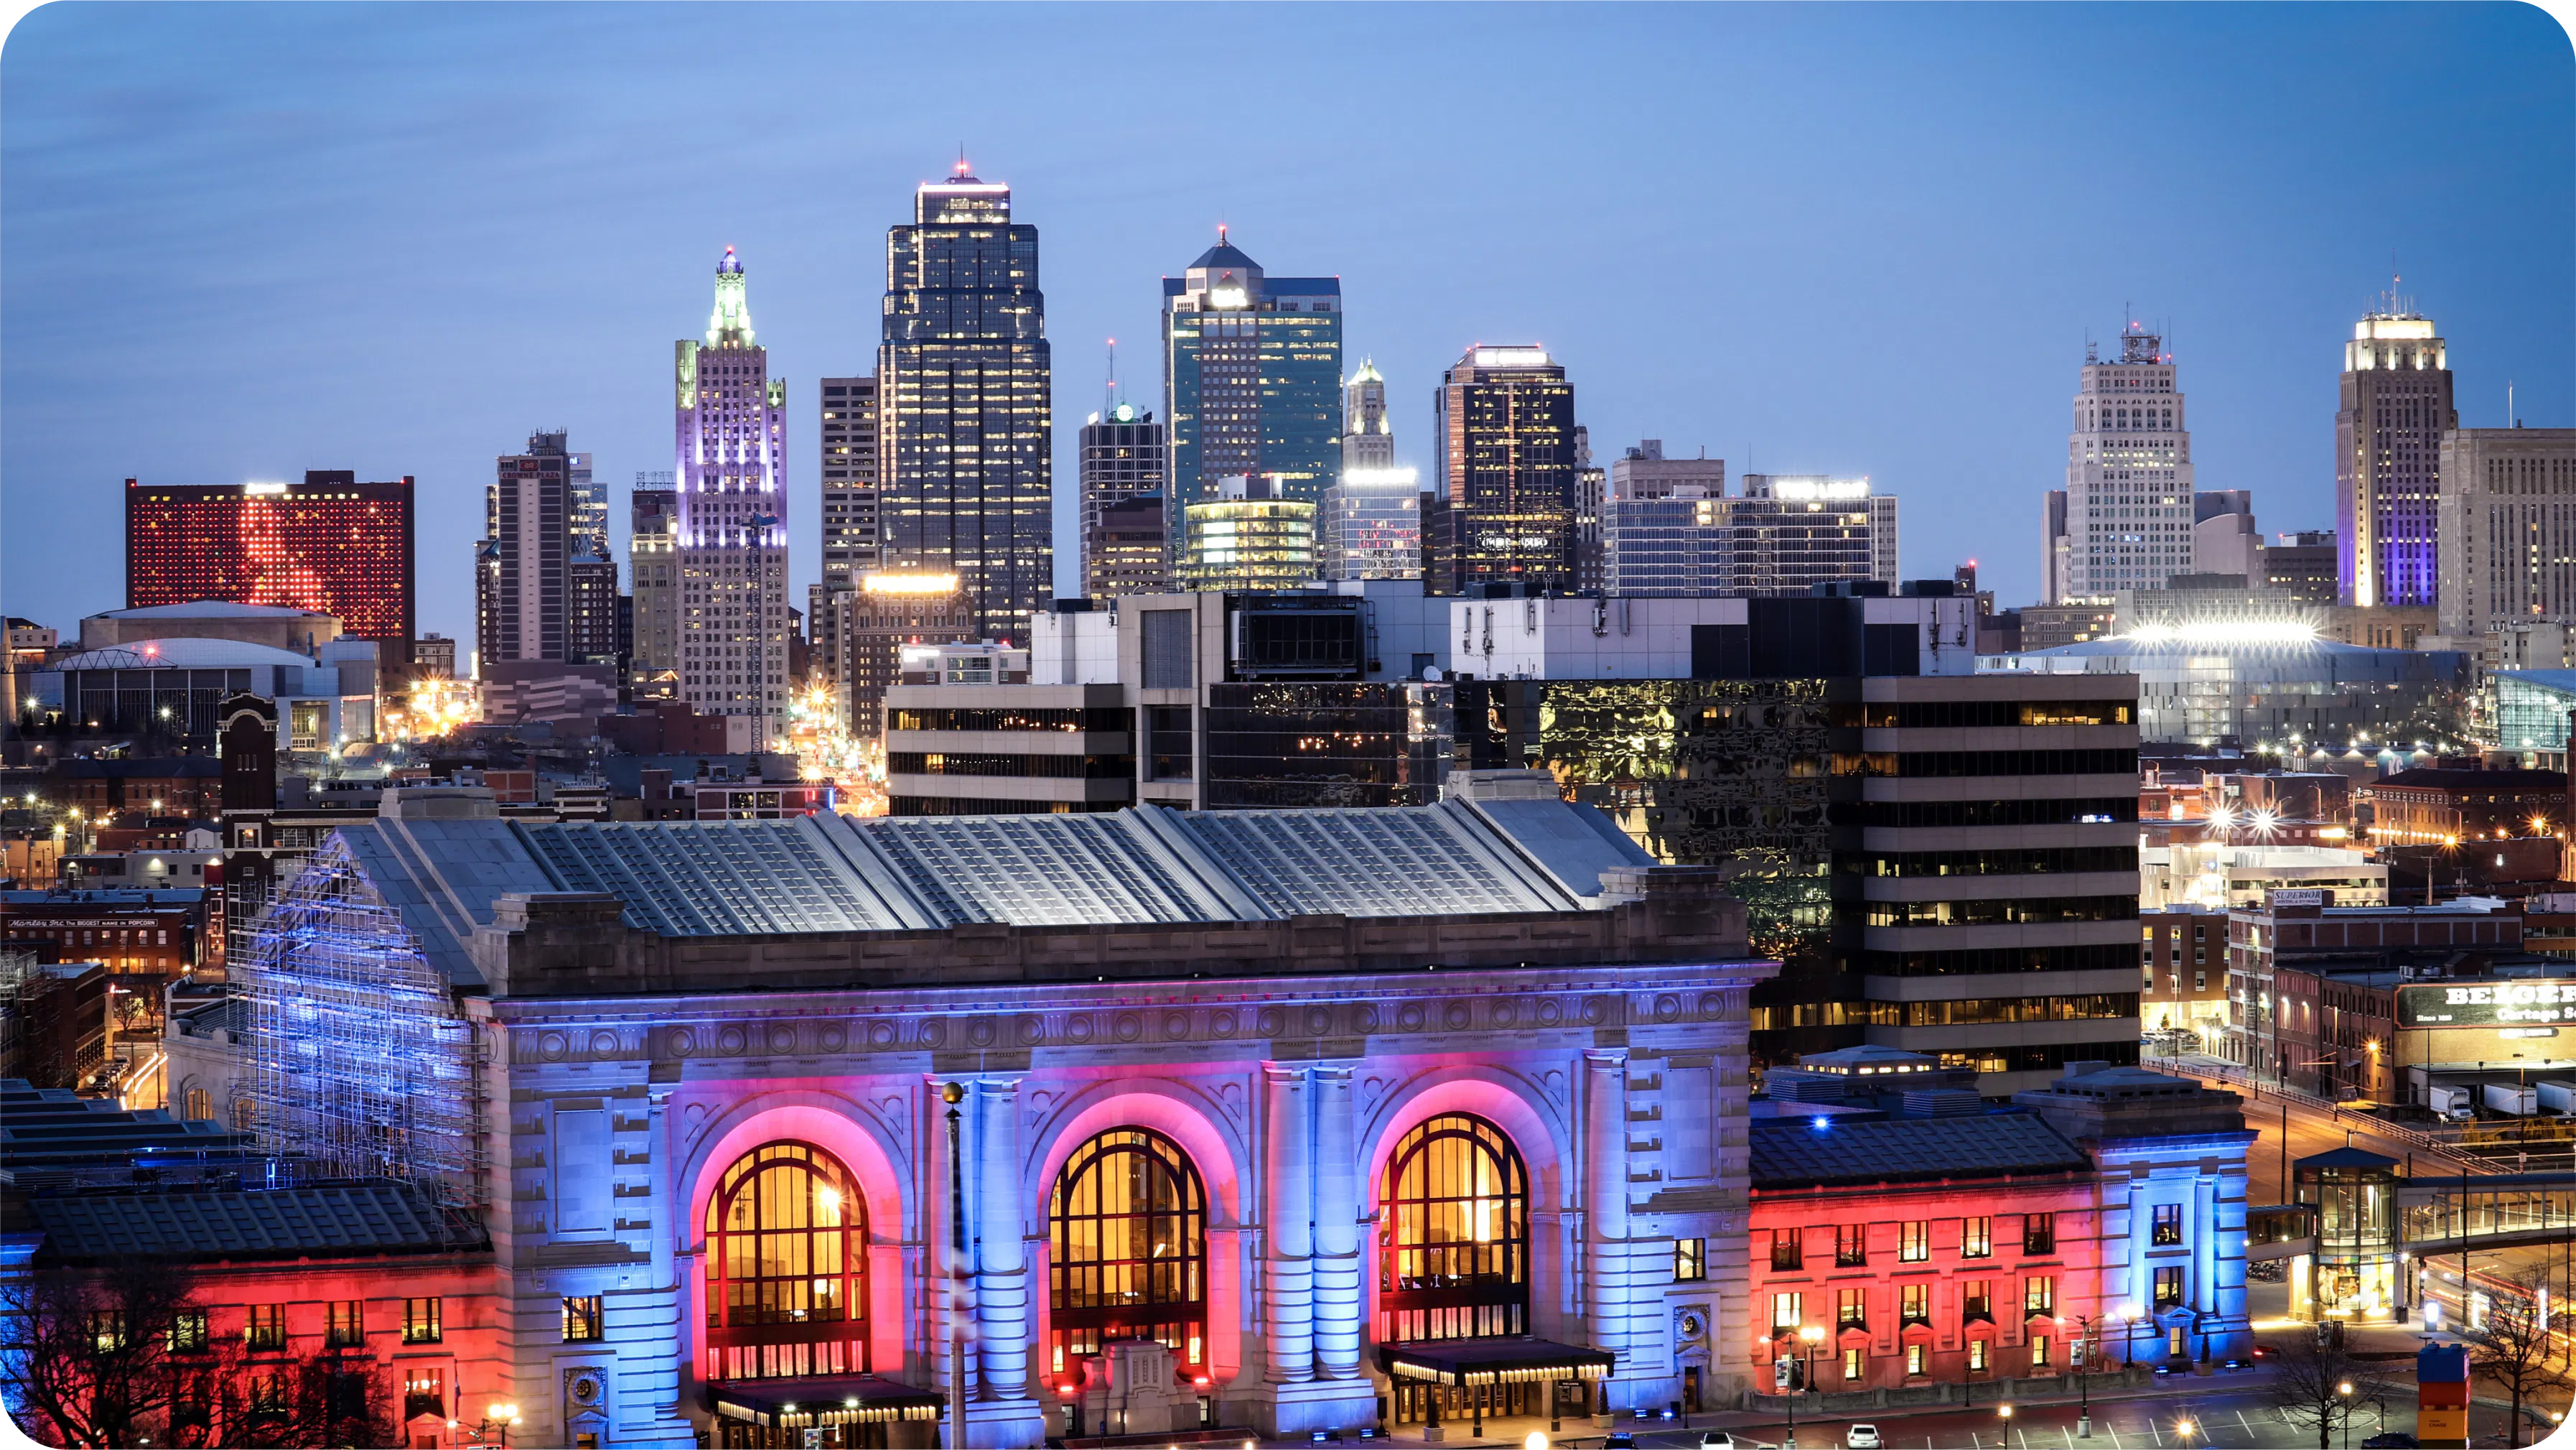

Midtown Westport is one of Kansas City’s most bookable neighborhoods, where walkability, nightlife, and a central location consistently support strong short-term rental performance. Guests choose it for its eclectic experience, not just convenience.
Midtown Westport blends historic charm with a dense mix of restaurants, patios, live music, and local shops. The neighborhood’s proximity to major museums and cultural institutions such as The Nelson-Atkins Museum of Art further strengthens its appeal as a base for exploring Kansas City’s arts scene.
The data behind the Midtown-Westport STR market is compelling. Average home price is just over $330K, keeping the buy-in relatively approachable for a major Midwestern city. Average revenue potential is about $45K, supported by a steady average occupancy of 69% and a healthy average daily rate (ADR) of about $150.
Regulations:
Kansas City requires short-term rental hosts to register with the city and follow density limits for non-owner-occupied rentals. In some commercially zoned areas, this includes a 1,000-foot spacing rule between STRs. You should factor compliance into your plans, especially if you’re considering a non-owner-occupied property.
How to Find the Best Markets to Invest In
Focusing on a specific demand driver—like art and culture—gives investors more flexibility than chasing a single destination. Instead of narrowing your search too early, you can evaluate multiple markets where demand for the arts plays a role and compare which ones best align with your budget, risk tolerance, and return expectations.
AirDNA makes it easy to take a data-first approach. Rather than relying on reputation or popularity, you can compare art-driven markets based on pricing, revenue potential, and yield to see where demand translates into real performance.
Use demand driver market filters
Markets that look similar on the surface often behave very differently once you factor in bookings and revenue. With AirDNA’s market-level data, you can compare locations by revenue potential, supply, and historical trends before narrowing in on individual properties.
This helps you:
- Identify markets where specific attractions influence demand
- Compare markets with similar characteristics but different pricing or competition
- Look beyond the most recognizable cities to find more balanced opportunities
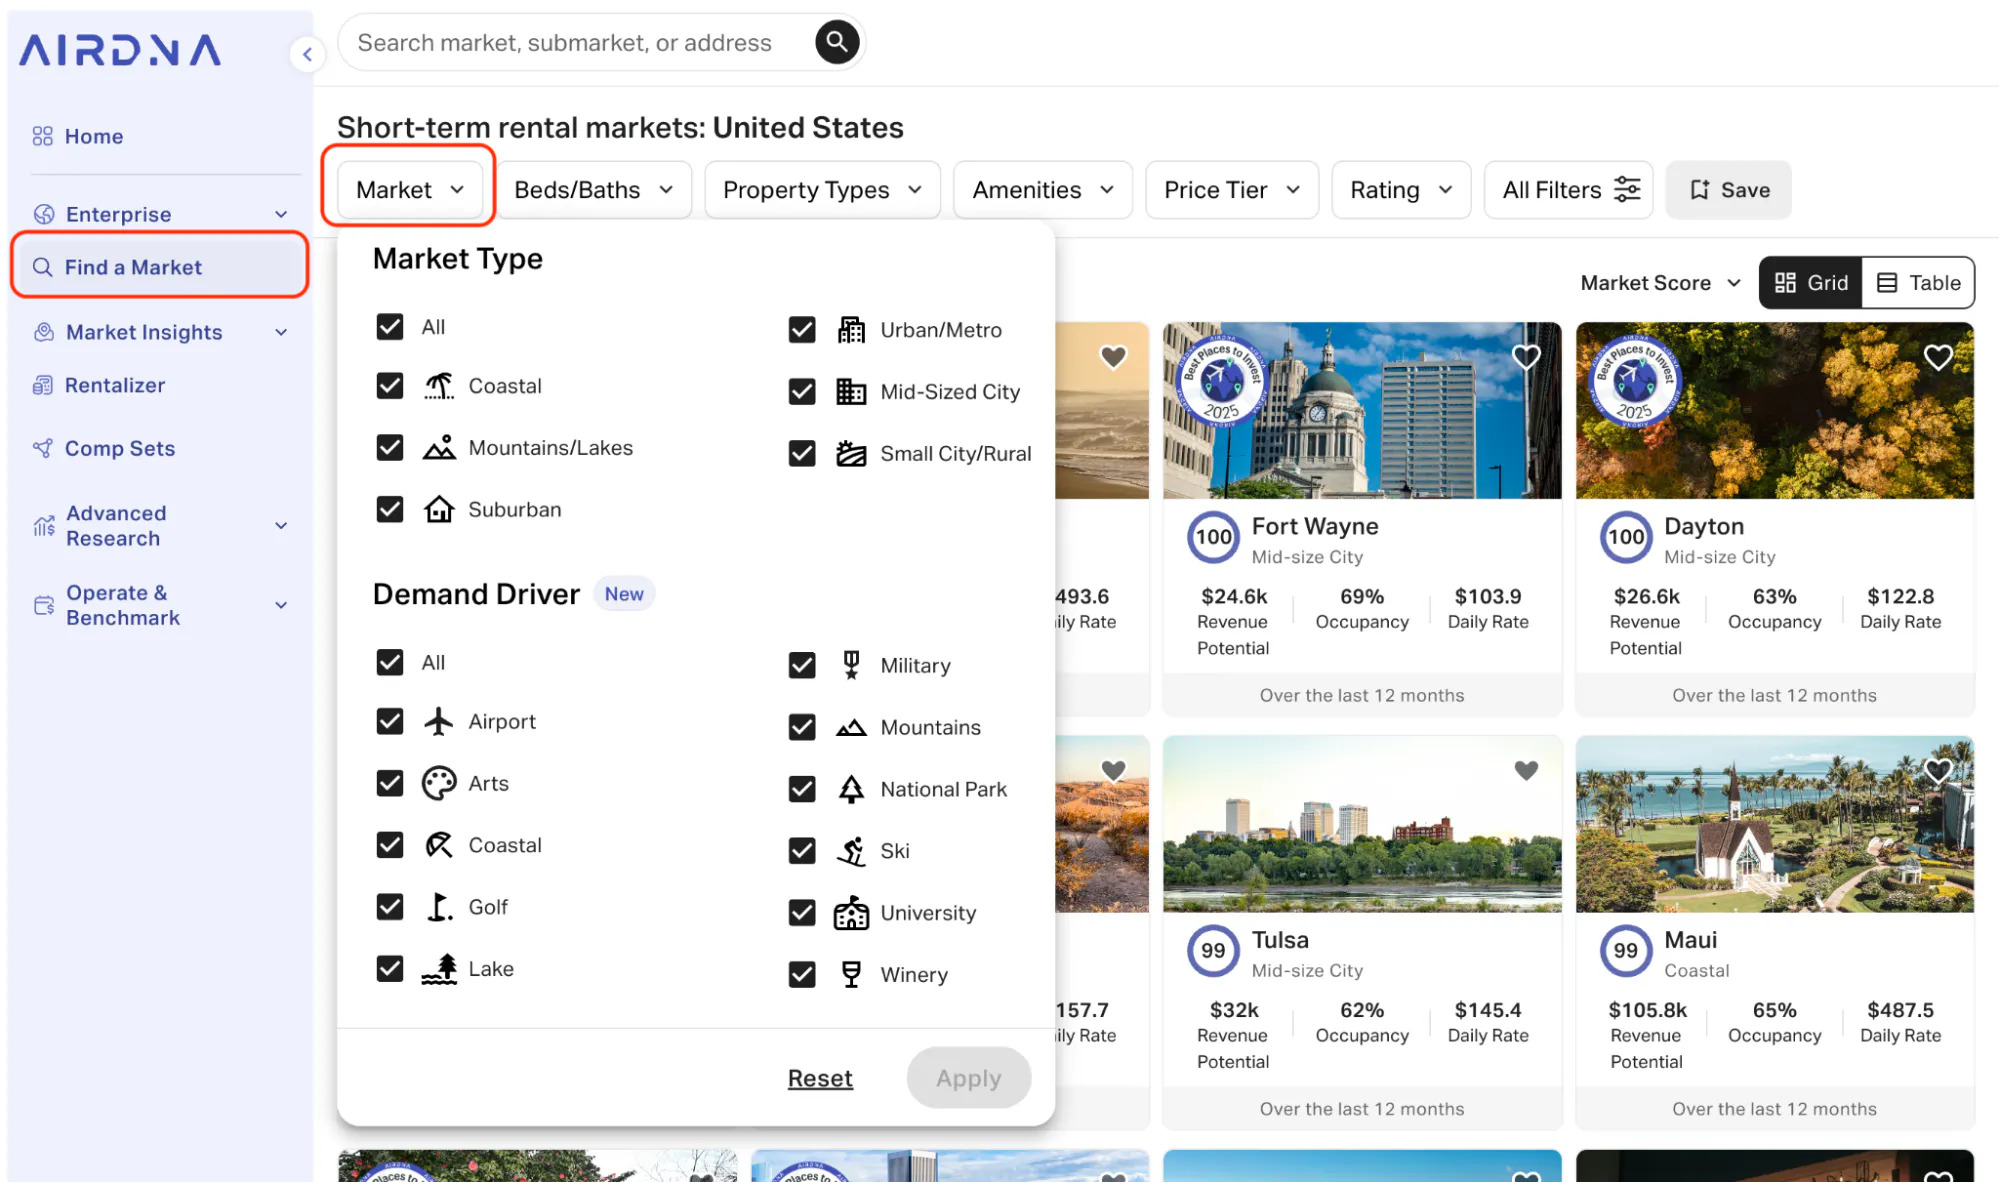
From the Find a Market tab in AirDNA, click the Market filter to choose which demand drivers you want to search for.
Filter by budget and yield
Once you’ve identified markets that fit your strategy, shift your focus to for-sale listings within those areas.
To narrow down your options, use these filters:
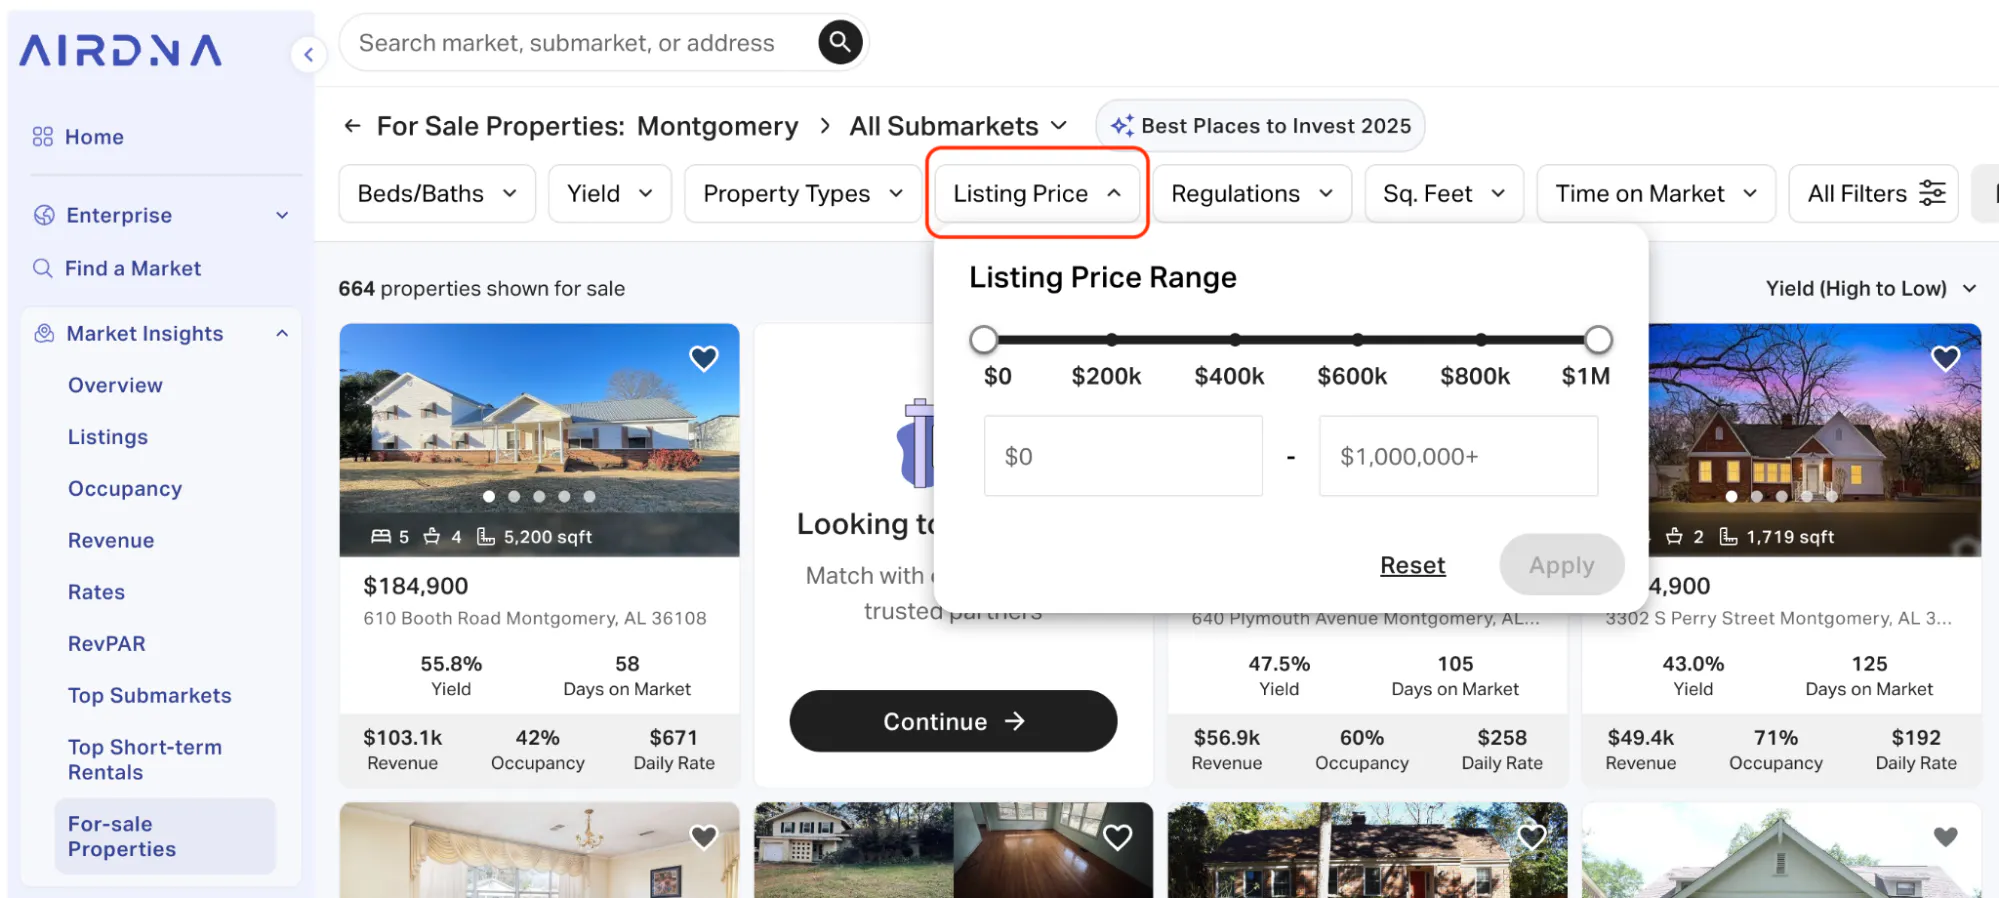
Price range filter
Use the listing price filter to only view for-sale properties within your budget. You can set upper and/or lower limits. Find this filter in the For-sale properties tab.
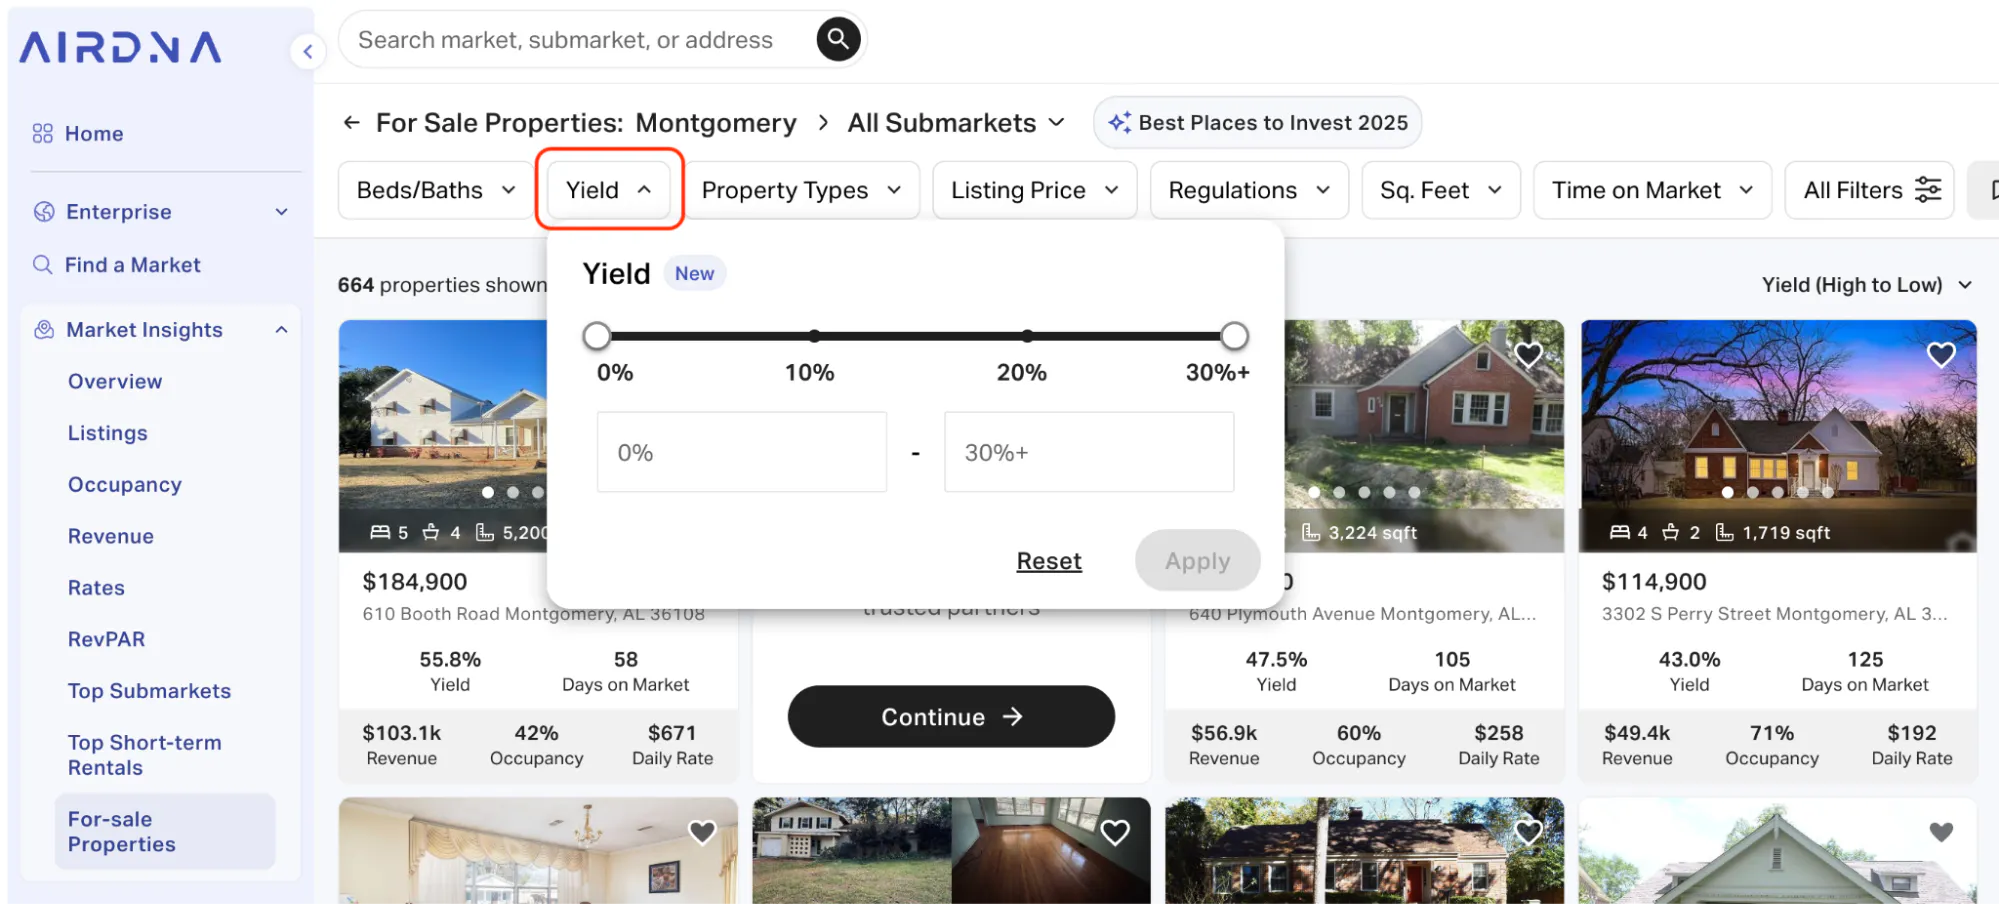
Yield filter
Use the yield filter to highlight properties that meet your desired yield. Setting a lower limit will filter out any properties that likely won’t provide the yield you’re seeking. Find this filter in the For-sale properties tab.
FAQs
What are the best art cities in the U.S.?
New York City, Los Angeles, San Francisco, and Chicago are perhaps the biggest and best-known art cities, but there are plenty of less populated cities with a small-town art scene. Cities like Savannah, Georgia; Philadelphia, Pennsylvania; and Kansas City, Missouri have established museum districts, galleries, and creative neighborhoods that consistently attract visitors.
Why do art cities work well for short-term rentals?
Art-driven travel tends to persist year-round. Guests plan trips around exhibitions, events, and cultural districts, which can support steadier demand than markets tied to a single season or attraction.
Are art cities only good for weekend stays?
Not always. Many art-driven markets also attract midweek bookings from university visitors, business travelers, and cultural tourists who stay longer than a typical weekend getaway.
How can I evaluate art towns for Airbnb investment?
Start by comparing home prices, revenue potential, and yield across art-driven markets. Tools like AirDNA allow investors to analyze how cultural demand translates into short-term rental performance before looking at individual properties.
ARTICLE SUMMARY
When investing in an Airbnb in an art town, you’ll want to focus on places where culture drives consistent travel. This list highlights U.S. art cities where museums, galleries, and creative districts support steady demand and attractive short-term rental returns.
Jamie Lane
AirDNA Chief Economist
He is responsible for data analysis, thought leadership, and leveraging advanced analytical techniques to provide new insights into short-term rental market trends. Native to Atlanta and an Airbnb host himself, Jamie enjoys cycling, mountain biking, backpacking, running, and playing in a dart league in his free time.
