

 Calculate Revenue
 Research Markets
 Find For Sale Properties
 Compare My Listing
 STR Revenue Calculator
 Custom Comp Sets
 Submarket Insights
 Custom Search Filters
 Rate Recommendations
 Performance Benchmarking
 Competitor Comparison
 Owner Contact Details
 Property-level performance data
 Tourism Insights
 Real Estate Investment Analytics
 About Us
 Sales
Sales Support
 Press
PressEuropean Review May 2025: Post-Easter Dip in Occupancy as Summer Bookings Build
Published: June 18, 2025

Jamie Zhang
Key Takeaways
- Short-term rental (STR) demand in Europe softened slightly in May, while supply continued to grow more quickly, reducing occupancy rates.
- Economic uncertainty hasn’t significantly deterred U.S. travelers to Europe, but the pace of growth has slowed.
- American tourists remain drawn to cultural and historical hubs, with Italy consistently the top destination. The Azores and Madeira have emerged as rising stars post-pandemic.
- Forward-looking bookings suggest strong travel momentum for summer, even as we see a shift toward last-minute decisions.
Following a strong April boosted by Easter travel, Europe’s short-term rental market (STR) experienced a slight dip in demand in May. Supply growth continued to outpace demand, contributing to a drop in occupancy rates. Despite this, average daily rates (ADR) held steady with modest year-over-year gains. Looking ahead, forward-booking trends point to a solid summer season, with increased travel intent across the continent—though shorter booking windows suggest a growing preference for last-minute trips.

At a Glance: April 2025 STR Performance in Europe
- Available listings totaled 3.8 million, reflecting a 6.2% increase year-over-year (YoY)
- Demand nights reached 41.5 million, increased 6.3% YoY
- Average daily rates (ADR) averaged €154, an increase of 2.6% from 2024
- Average occupancy rate was 56%, 2.4% lower than that in 2024
- Revenue per Available Rental Night (RevPAR) increased 0.2% year-over-year to €86
The State of the European Economy
Despite ongoing uncertainty, Europe’s economy continued to grow steadily in May. The European Central Bank (ECB) kept its growth forecast at 0.9%, pointing to concerns about global trade shifts that could affect exports and investment across the region.
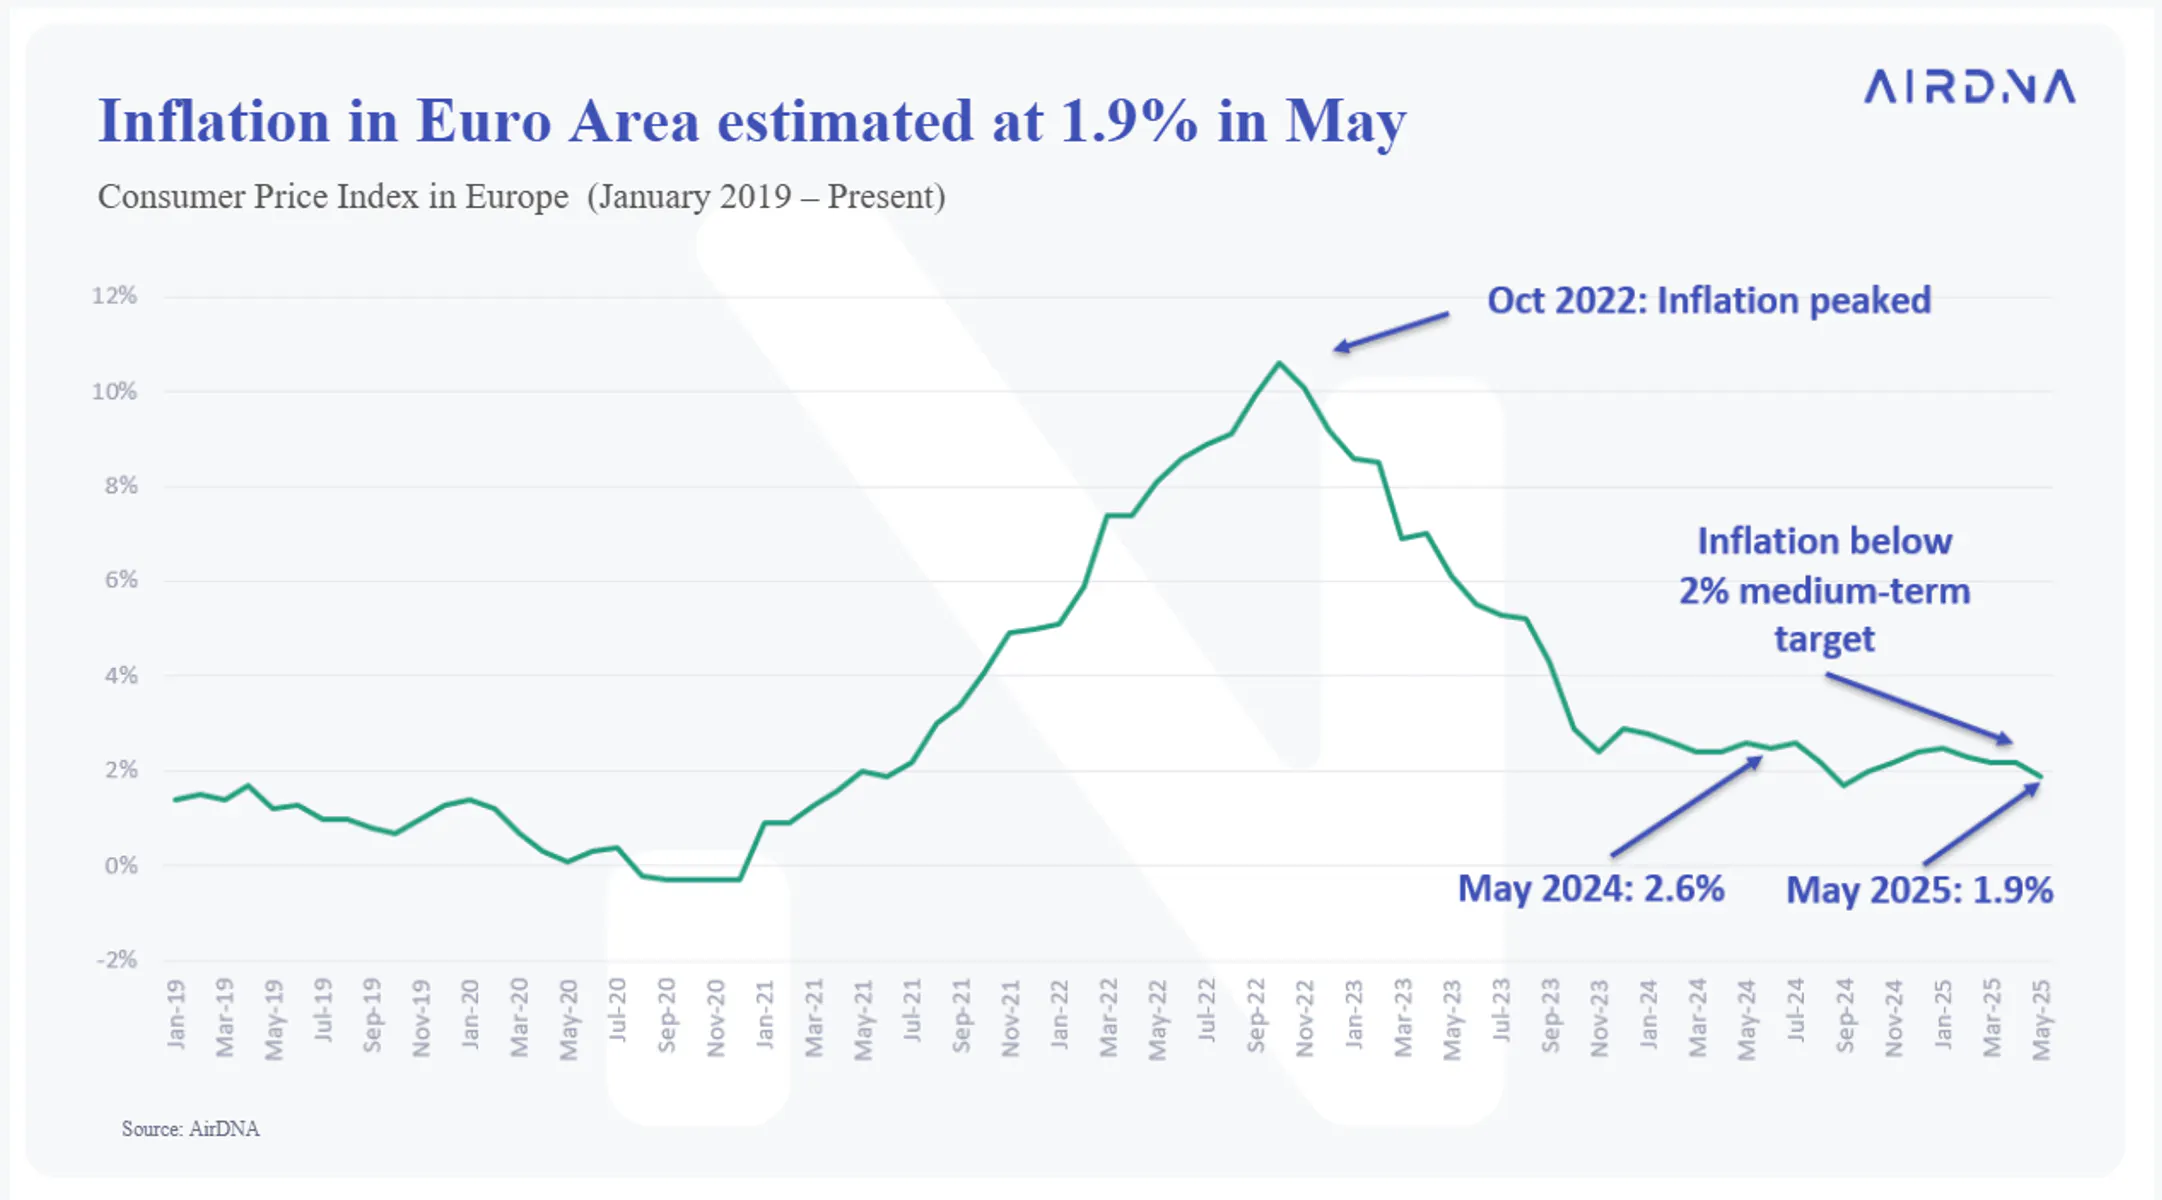
Inflation eased to 1.9% year-over-year, down from 2.6% in April 2024, returning to the ECB’s target of 2%. In response, the Bank cut interest rates by 25 basis points—its eighth cut in a year—bringing the deposit rate to 2.0%. Still, officials signaled they may pause further rate cuts for now.
Unemployment data for May wasn’t available, but the most recent figure from April showed the rate holding steady at 6.2%, a slight improvement from 6.3% in March.
These signs of stability could help boost consumer confidence and support more discretionary spending, including on travel, in the months ahead.
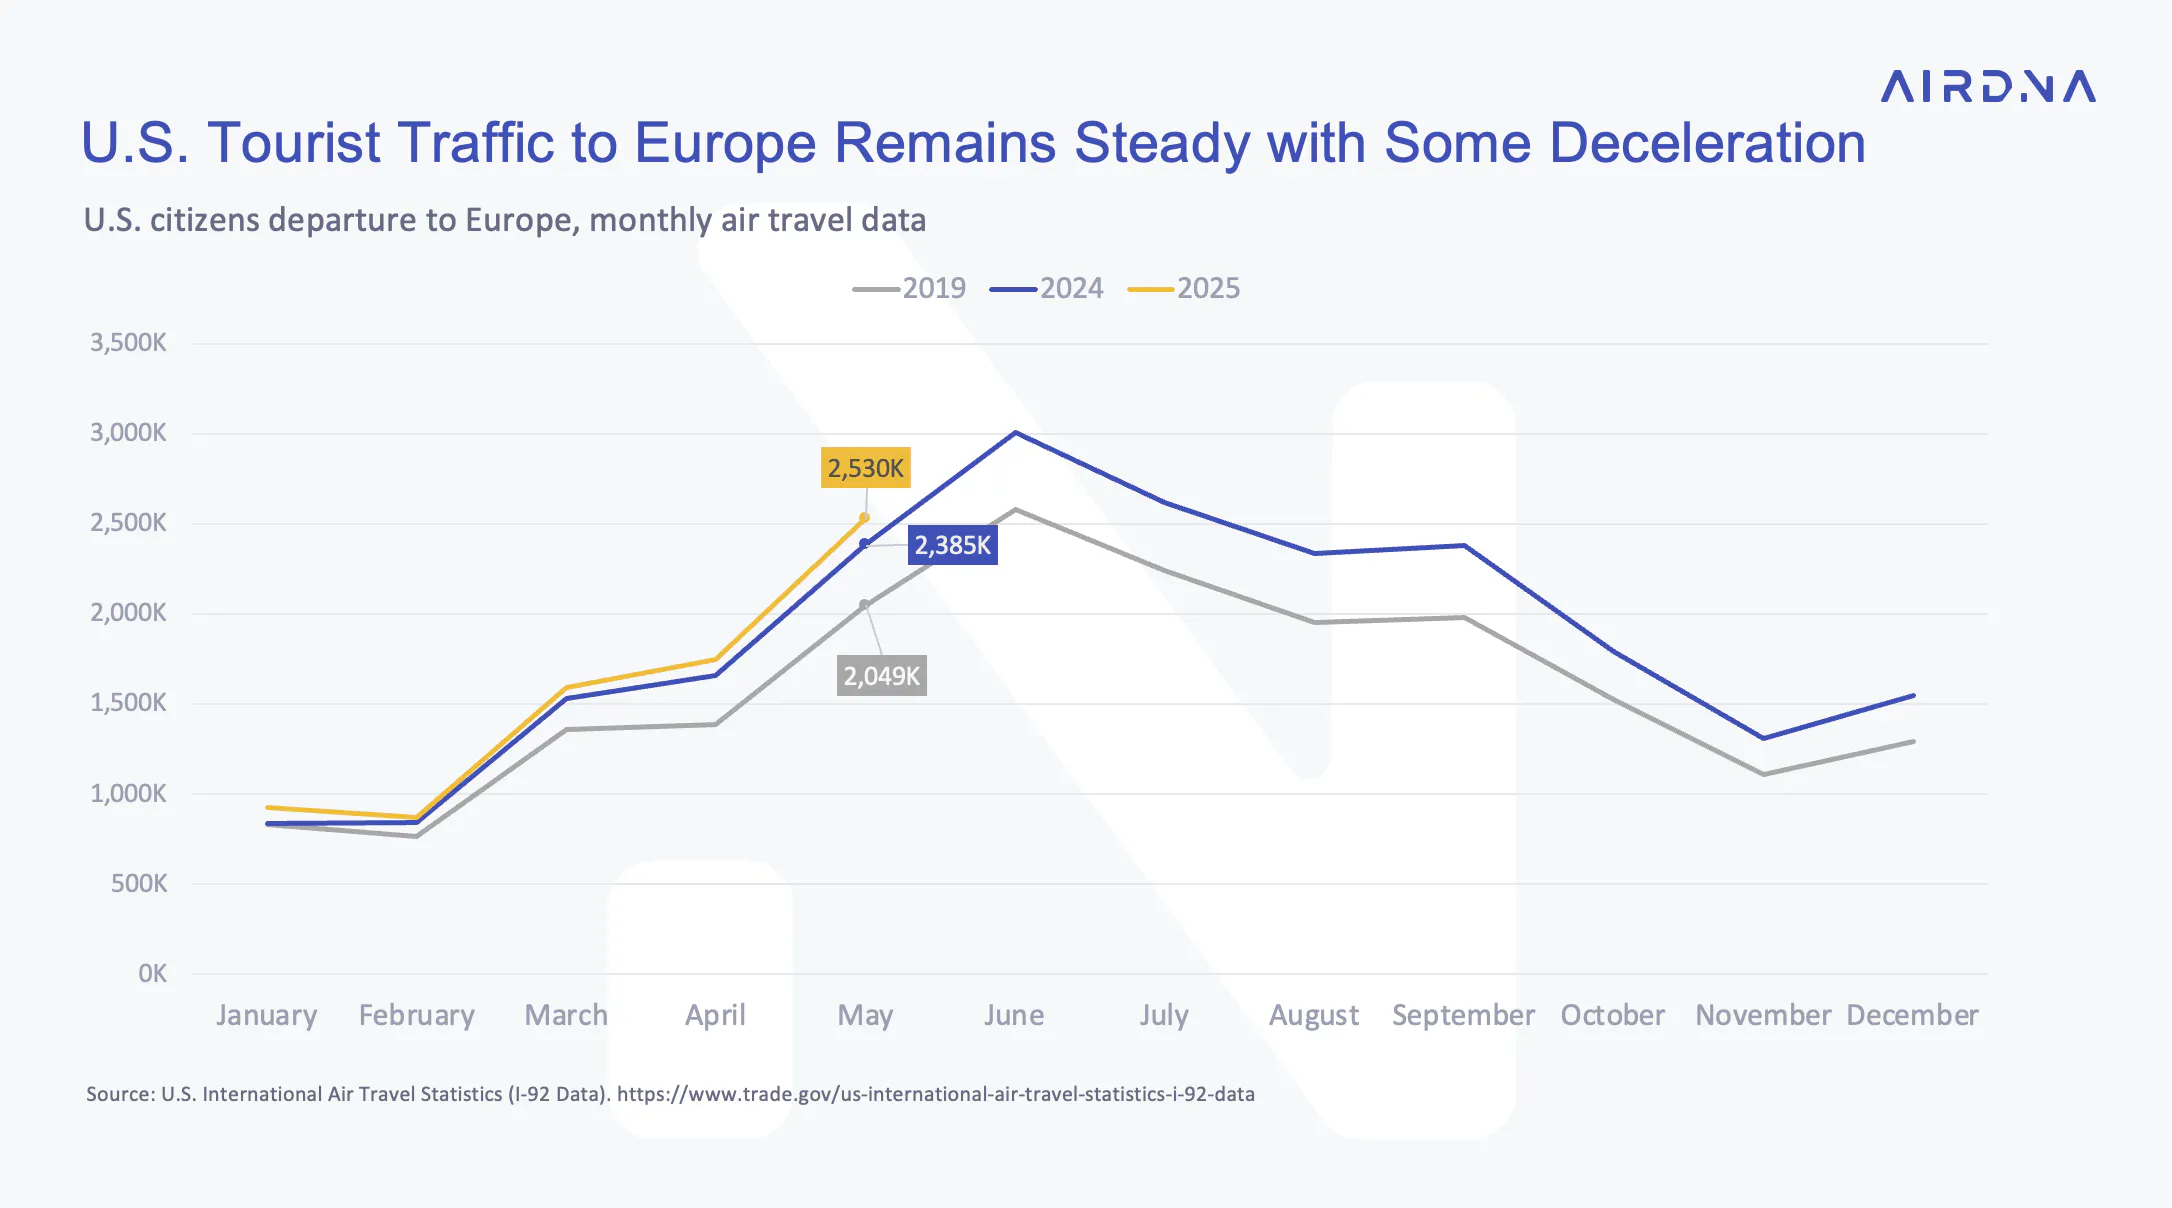
Looking beyond Europe, the euro has been gaining value against the U.S. dollar, which could influence travel from the U.S. to Europe. While demand from American travelers remains solid, U.S. border and customs data shows that the pace of growth has slowed so far this year.
The Effect of the Euro/USD Exchange Rate
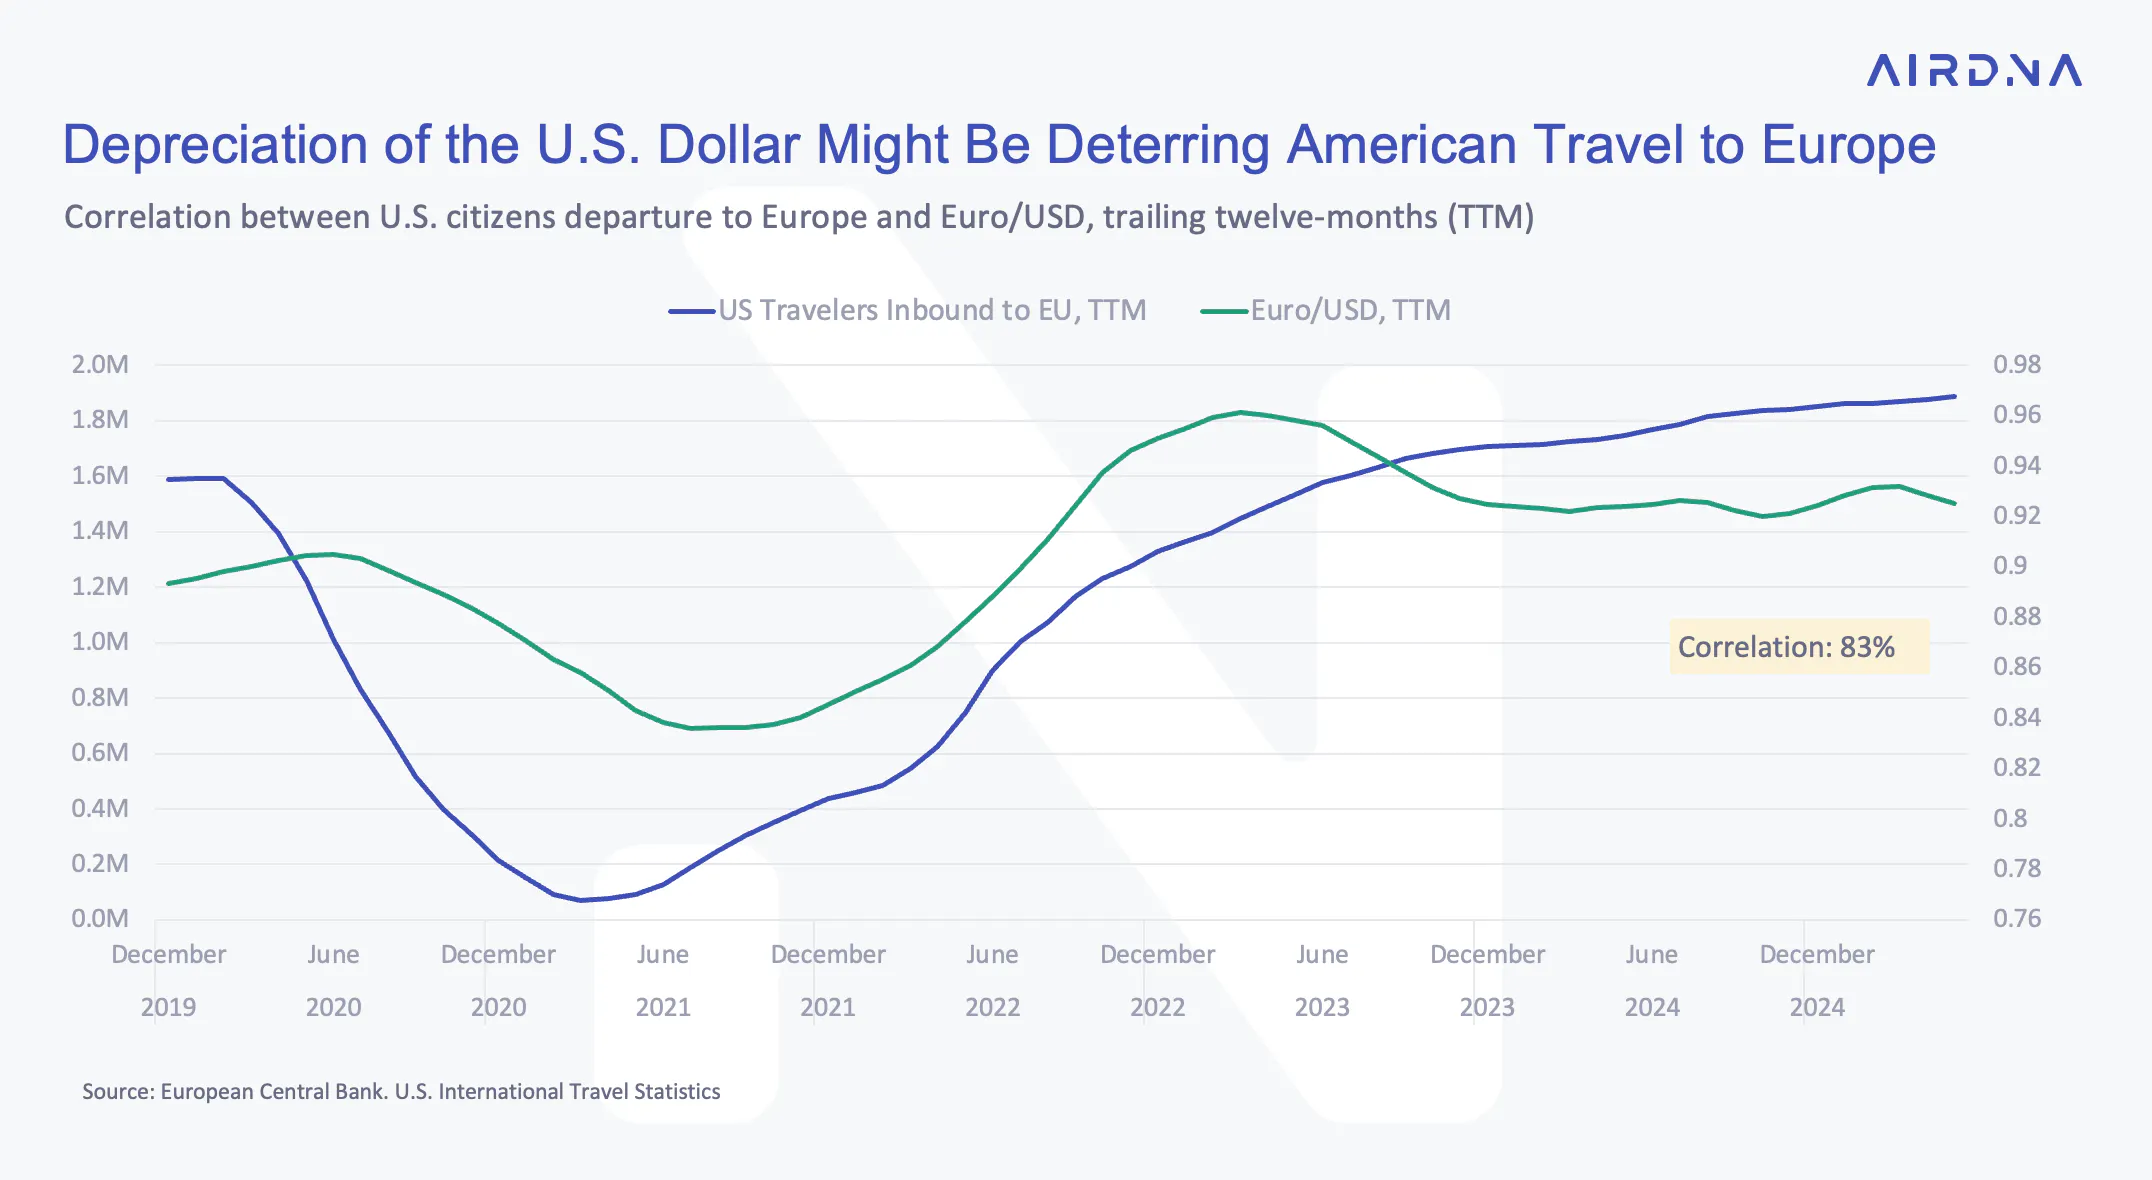
Looking at data over the past 12 months, there’s an 83% correlation between inbound U.S. travel to Europe and the Euro/USD exchange rate—suggesting that the weakening dollar may be contributing to a slowdown in American travel to the region.
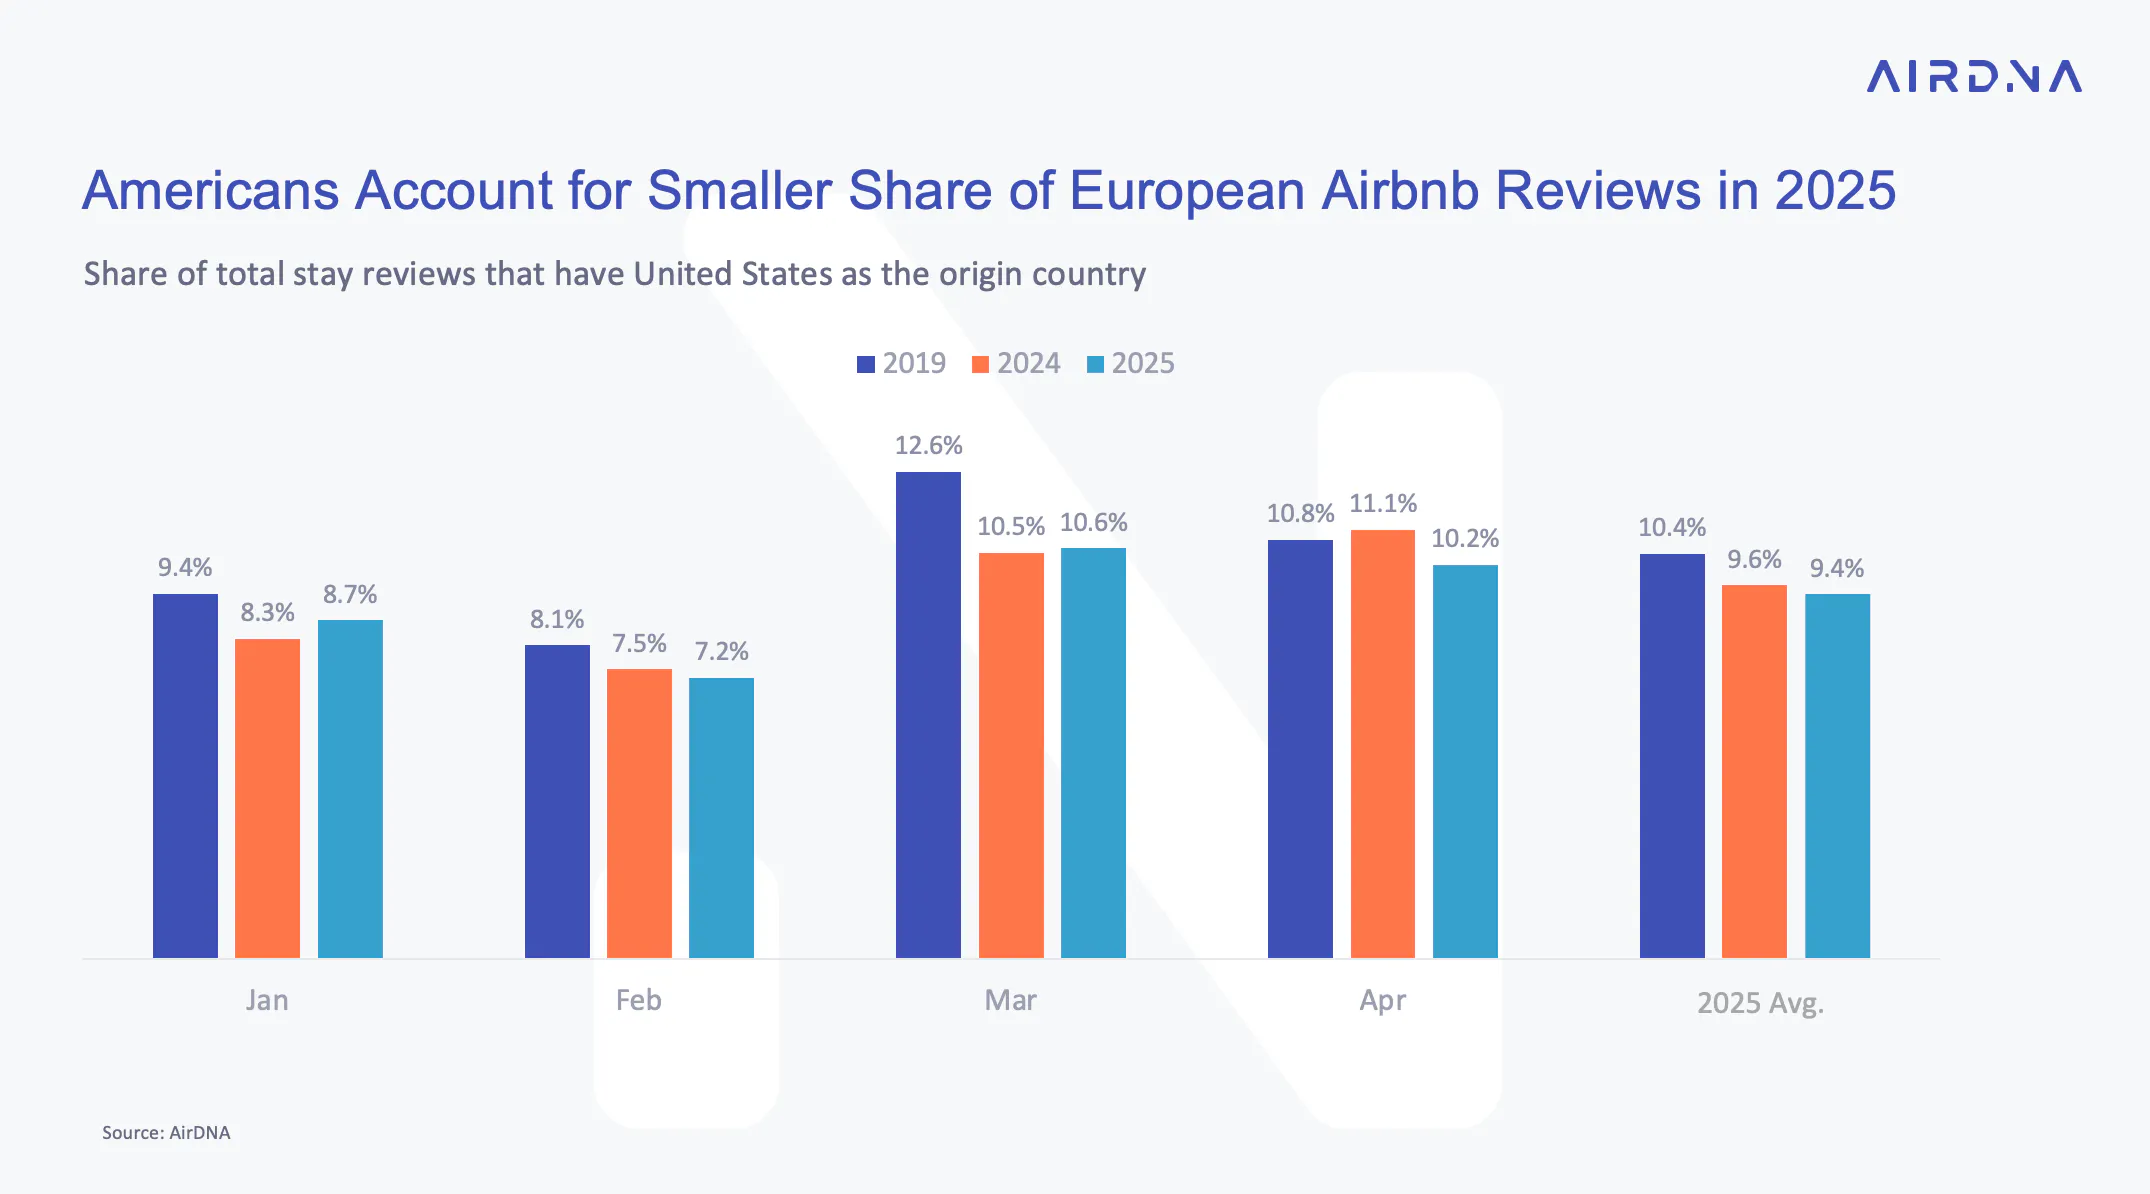
AirDNA data tracking the origin of Airbnb stay reviews shows a slight dip in the share of U.S. travelers, down from 9.6% in the first four months of 2024 to 9.4% during the same period in 2025.
Calculate potential earnings
Understand the investment potential of any address in the world.
Top European Destinations Among American Travelers
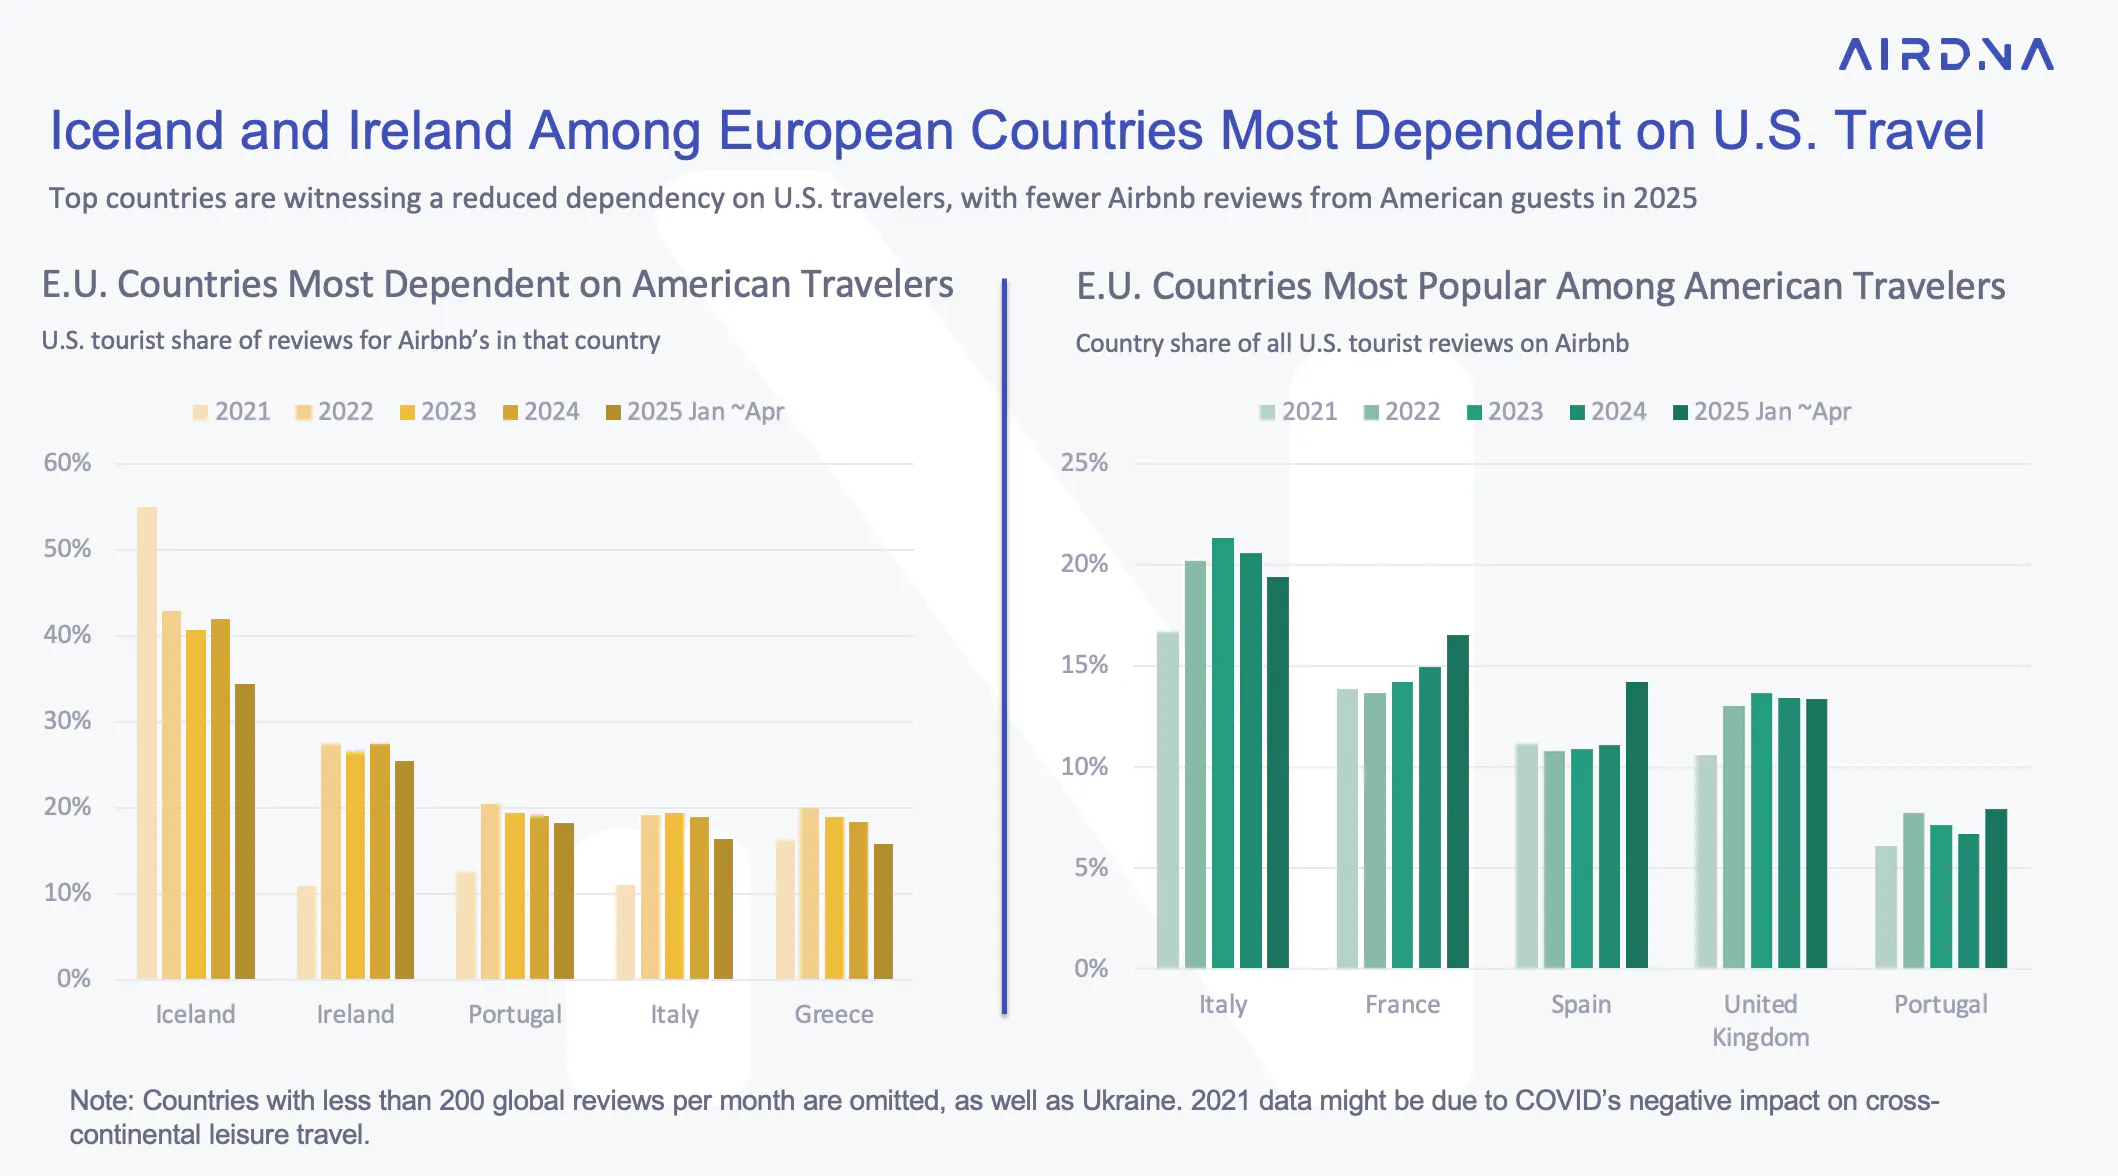
American travelers remain one of the most significant international visitor groups in Europe, making up roughly 11% of Airbnb reviews. Only domestic French (around 30%) and British travelers (about 18%) account for a larger share.
Certain countries are particularly reliant on U.S. visitors. In places like Iceland and Ireland, U.S.-based guests contribute to around 20% of all Airbnb reviews—among the highest in Europe.
When it comes to destination preferences, Americans consistently gravitate toward countries rich in cultural and historical attractions, with Italy and France topping the list.
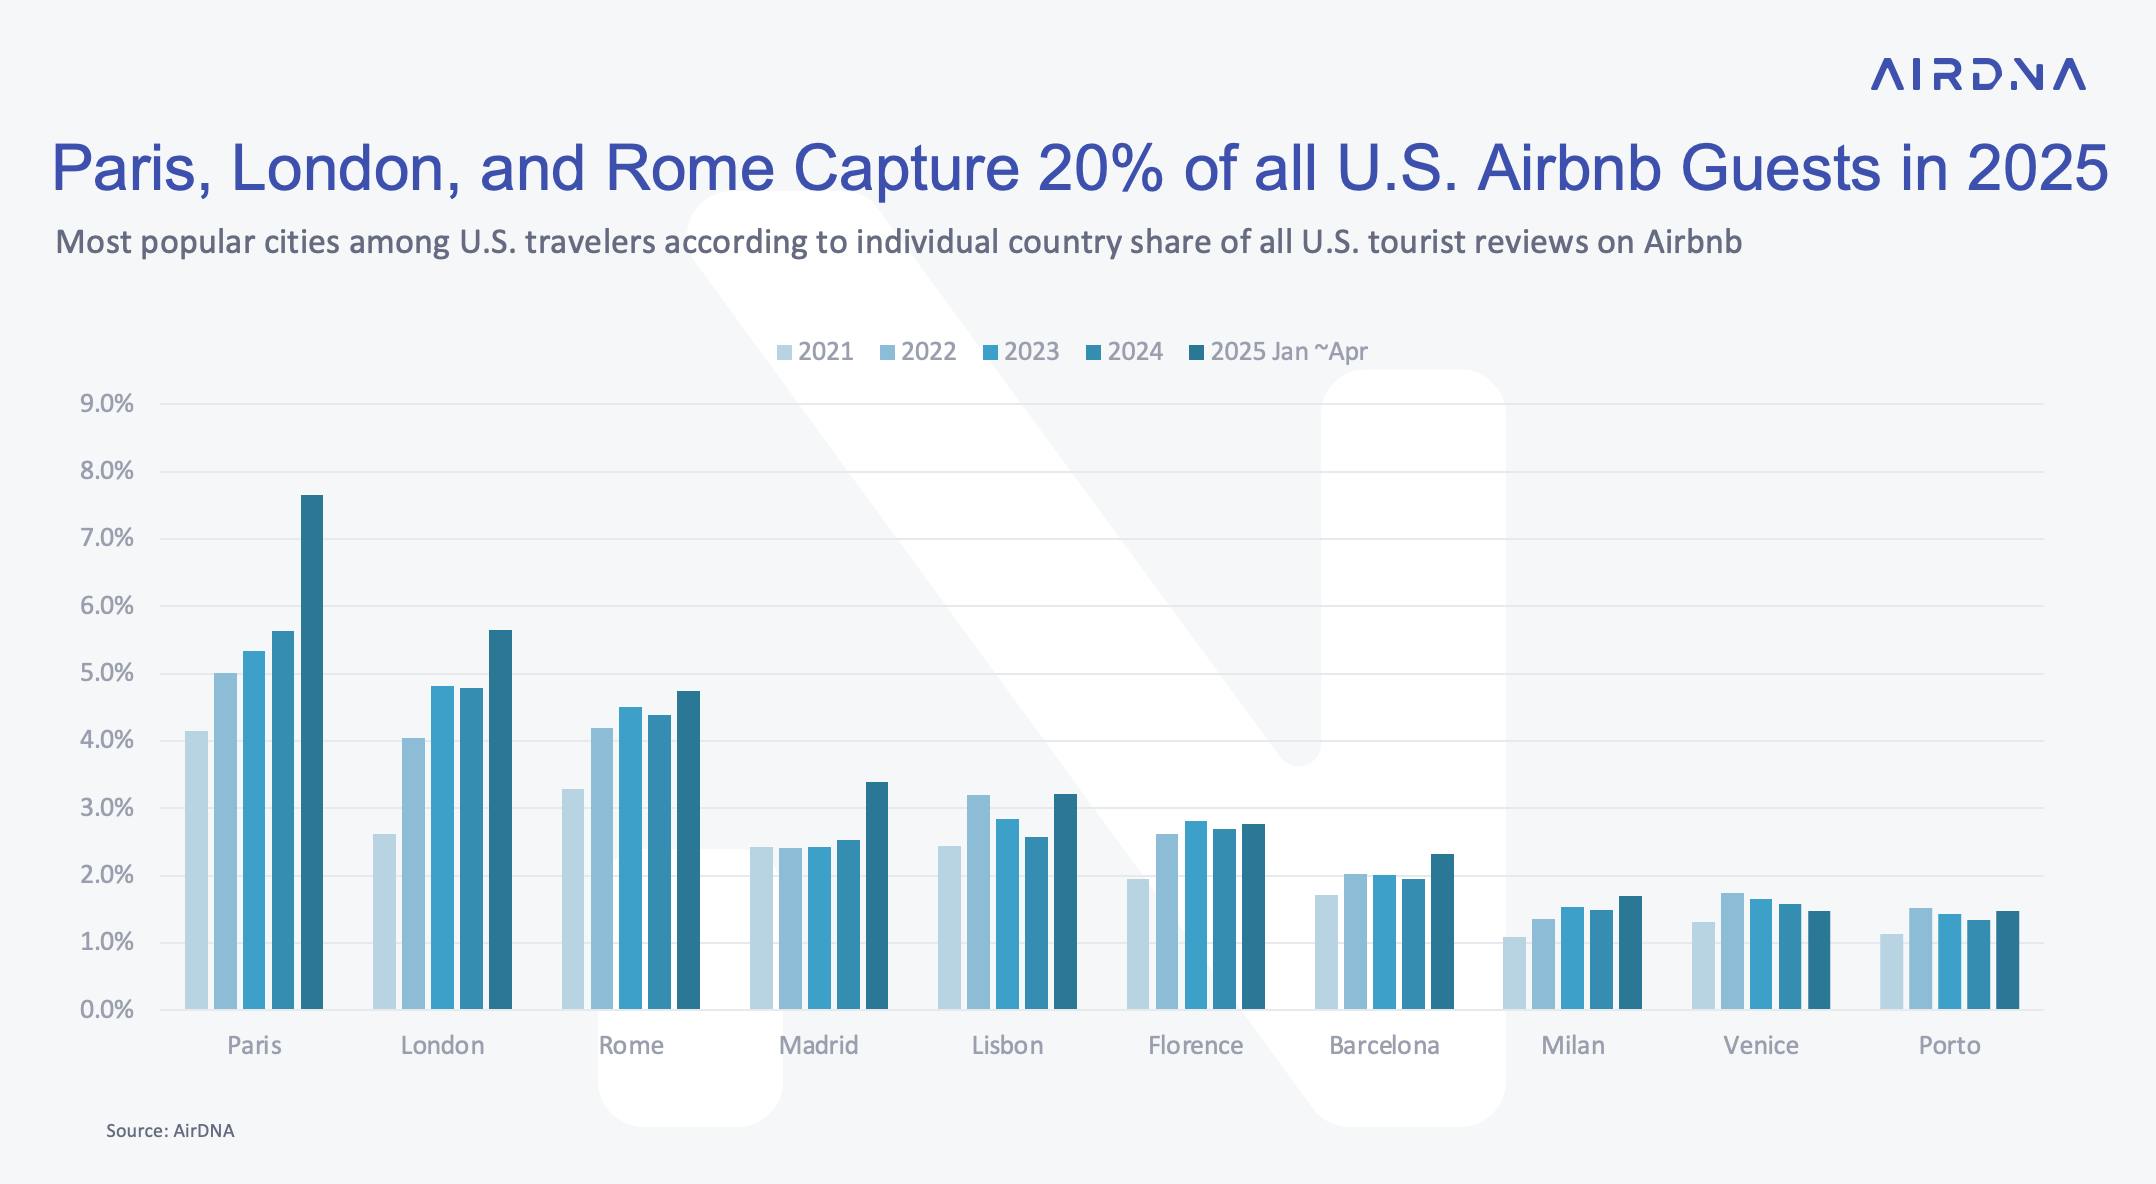
At the city level, Paris, London, and Rome were the top three destinations, together drawing 20% of all U.S. Airbnb guests in the first four months of 2025.
Rising Hot Spots
Since the post-COVID recovery, Norway and Albania have become increasingly popular with American travelers. In the first four months of 2025, 14 out of every 1,000 U.S. visitors chose Norway—more than double the 6 per 1,000 recorded during the same period in 2022. Albania, Finland, Denmark, and Latvia also saw strong growth in American arrivals.
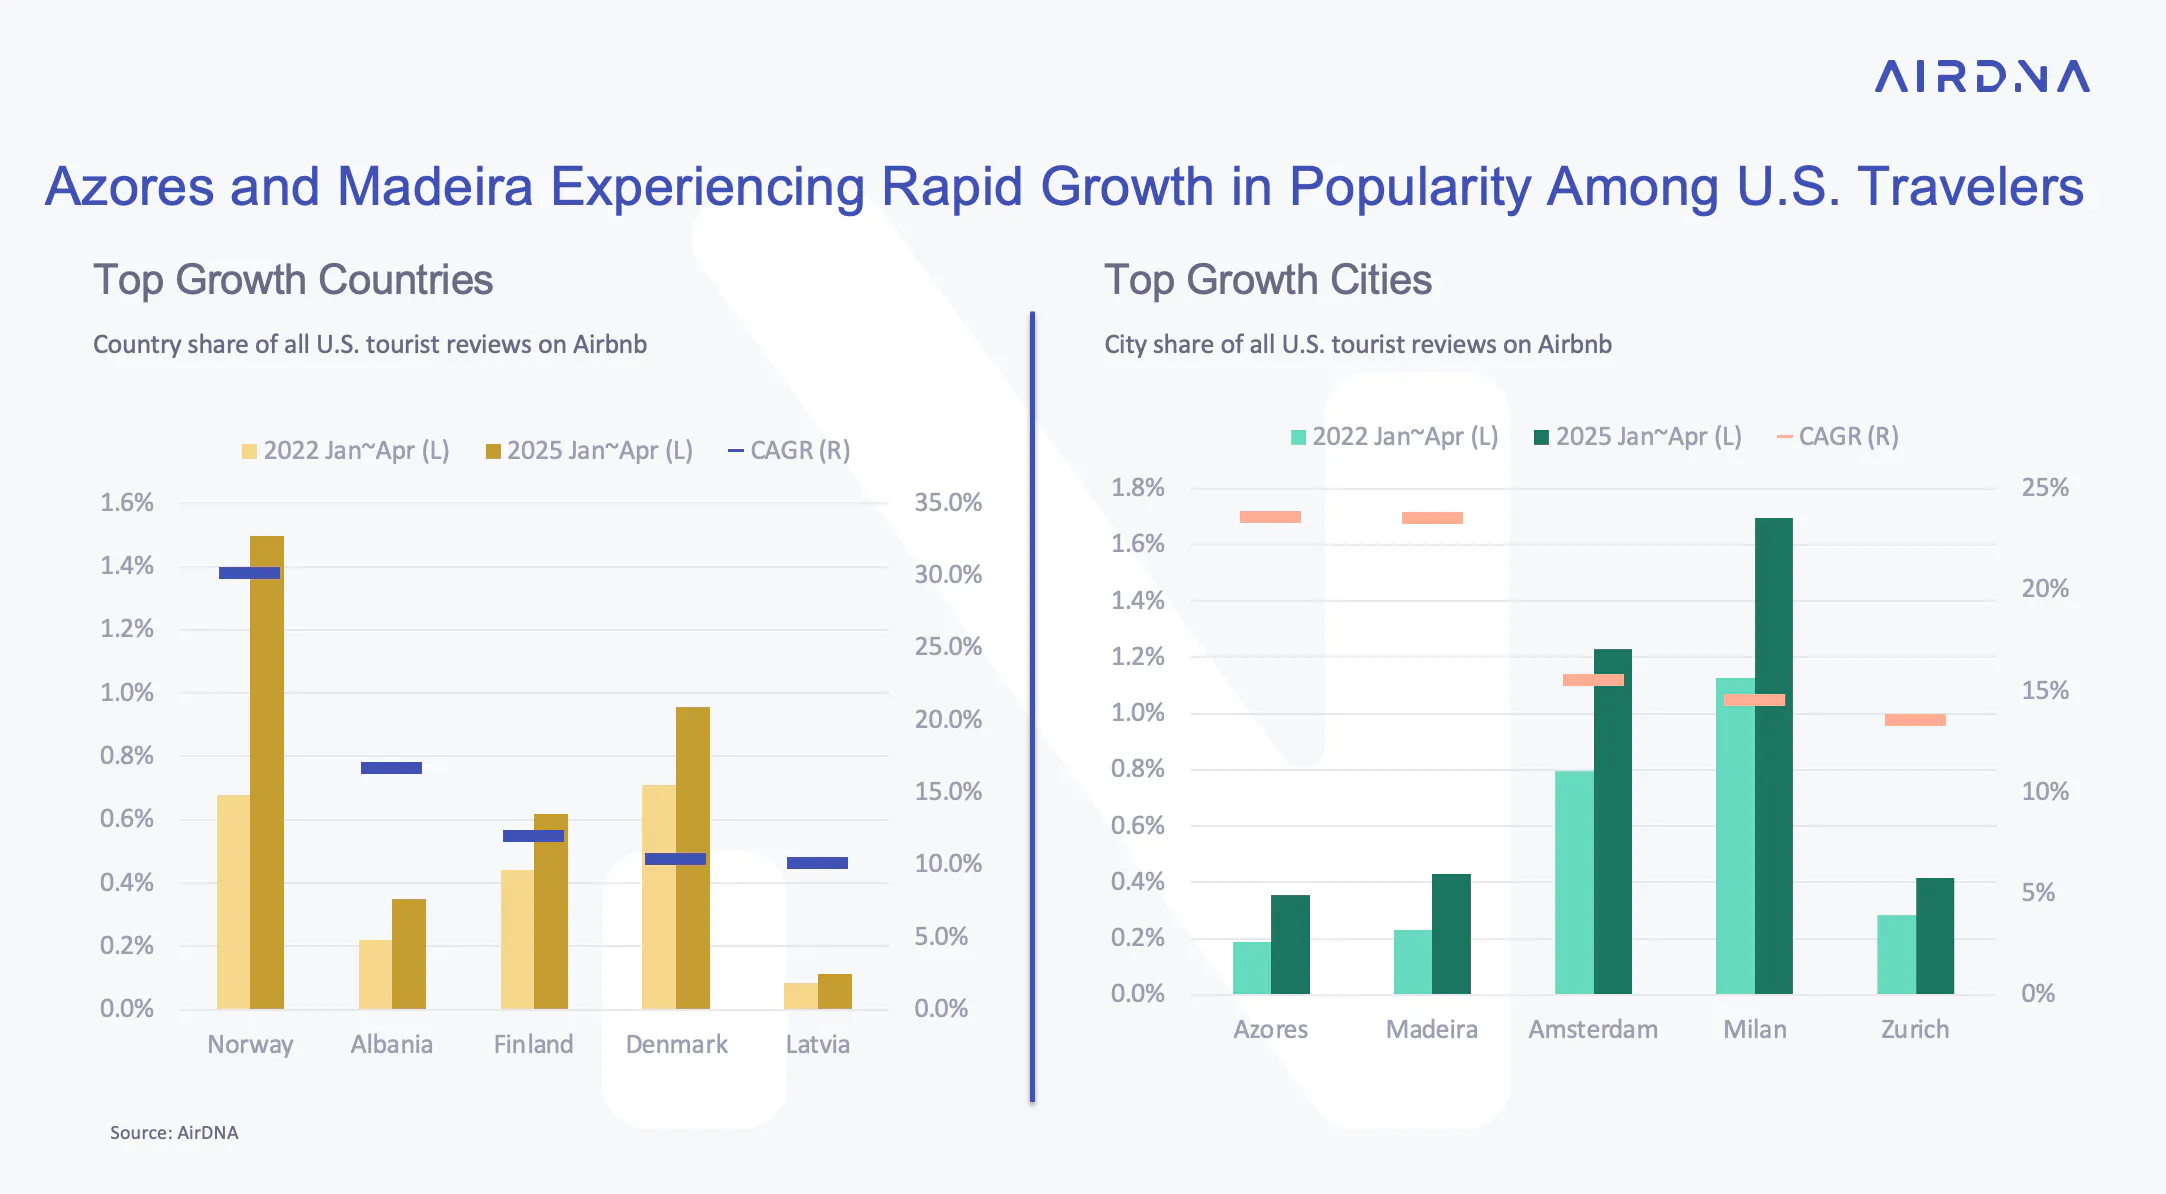
At the city level, the Azores and Madeira have experienced the fastest rise in popularity among U.S. travelers compared to 2022. Amsterdam, Milan, and Zurich also showed notable gains.

Booked Nights Continue Steady Growth
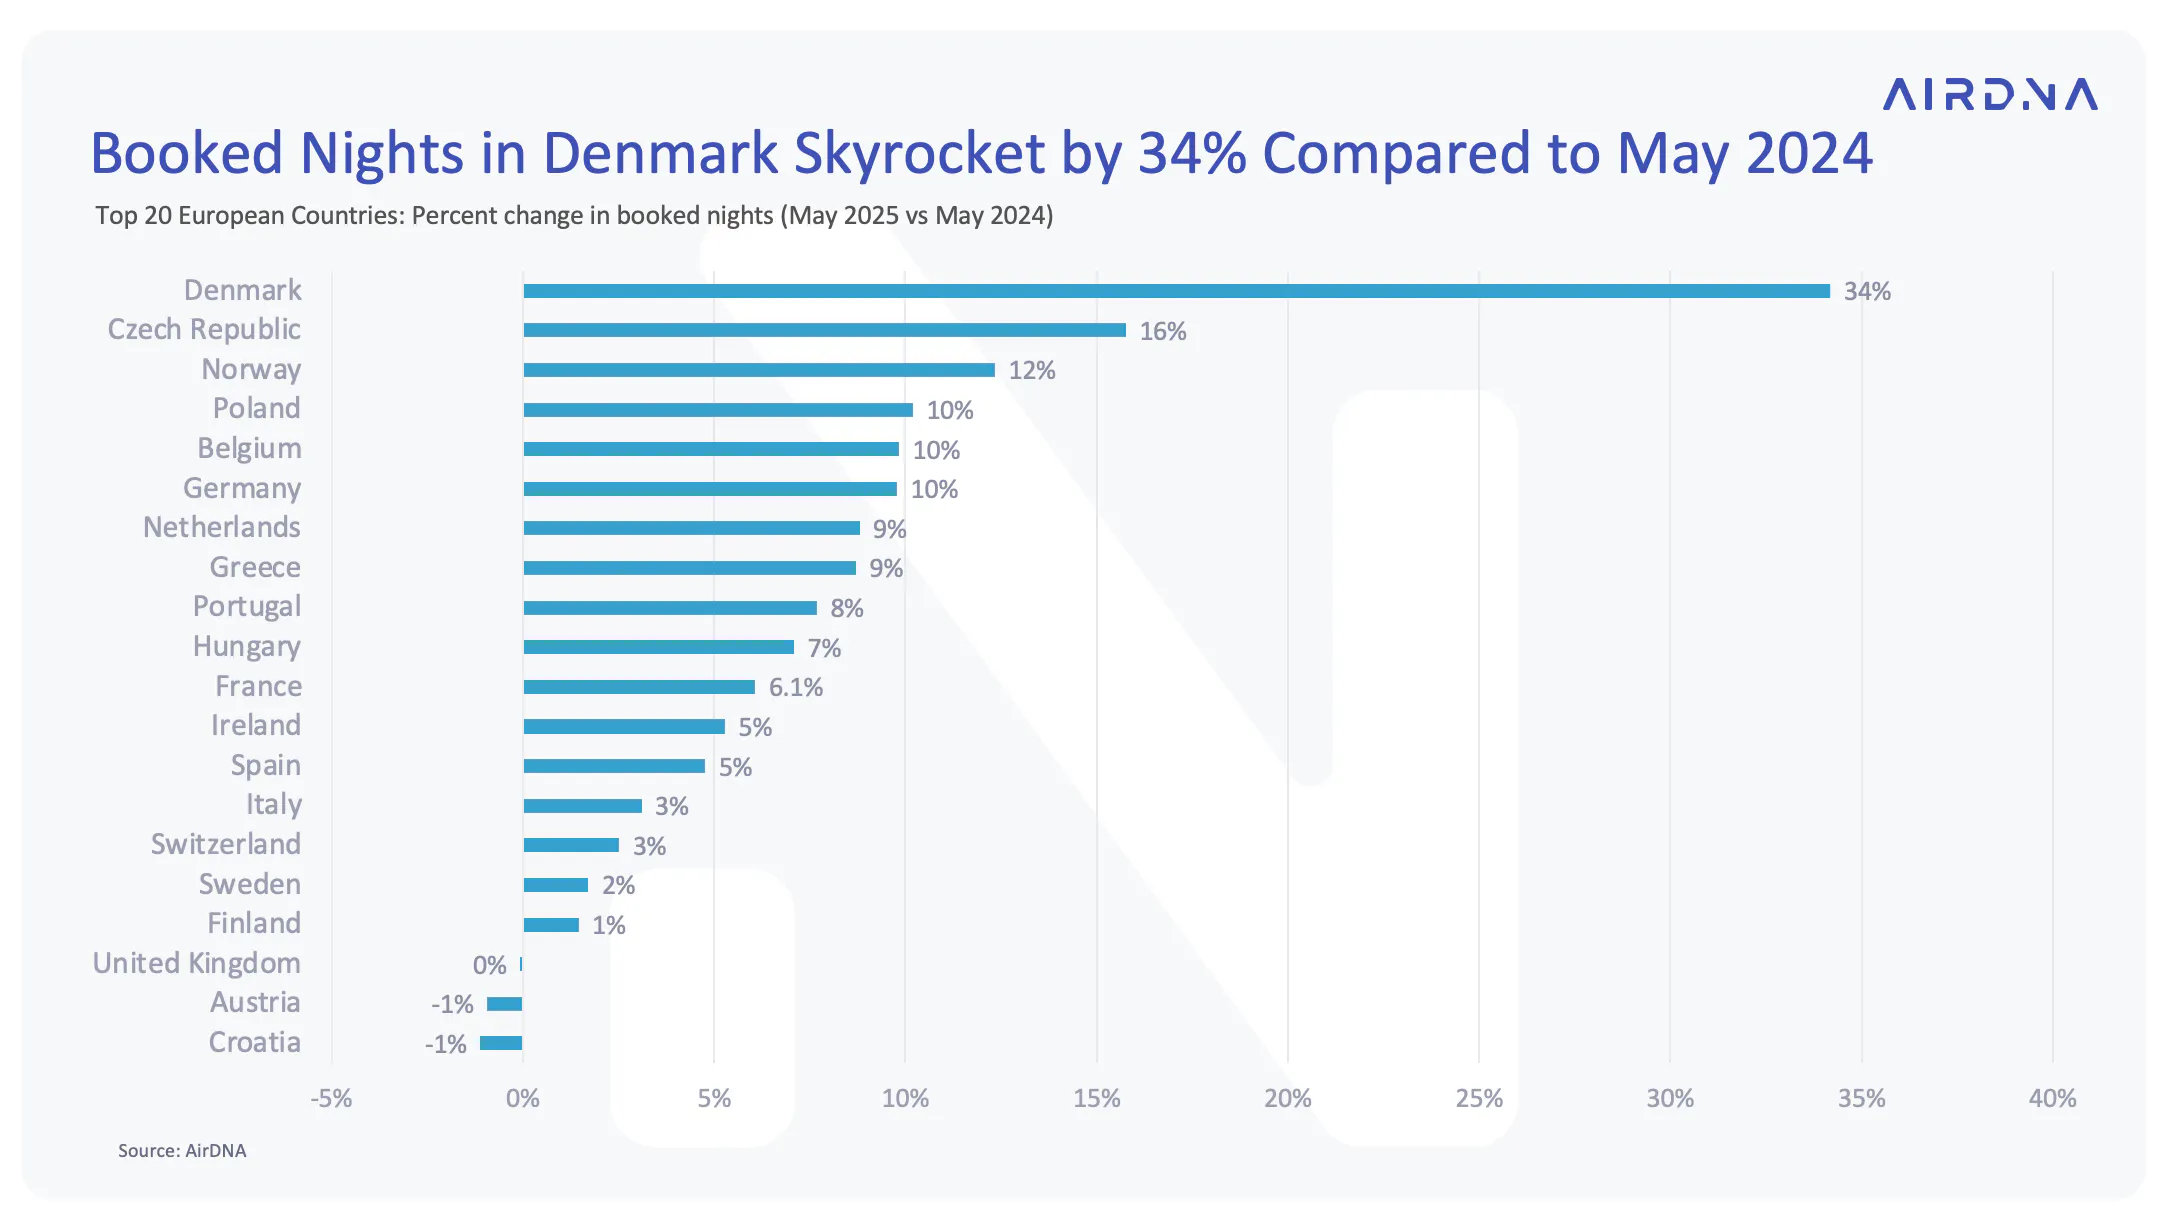
Booked nights—reservations made in May for stays in May or beyond—remained a reliable signal of continued travel interest across Europe. In total, 41.3 million nights were booked, representing a 5.3% year-over-year increase.
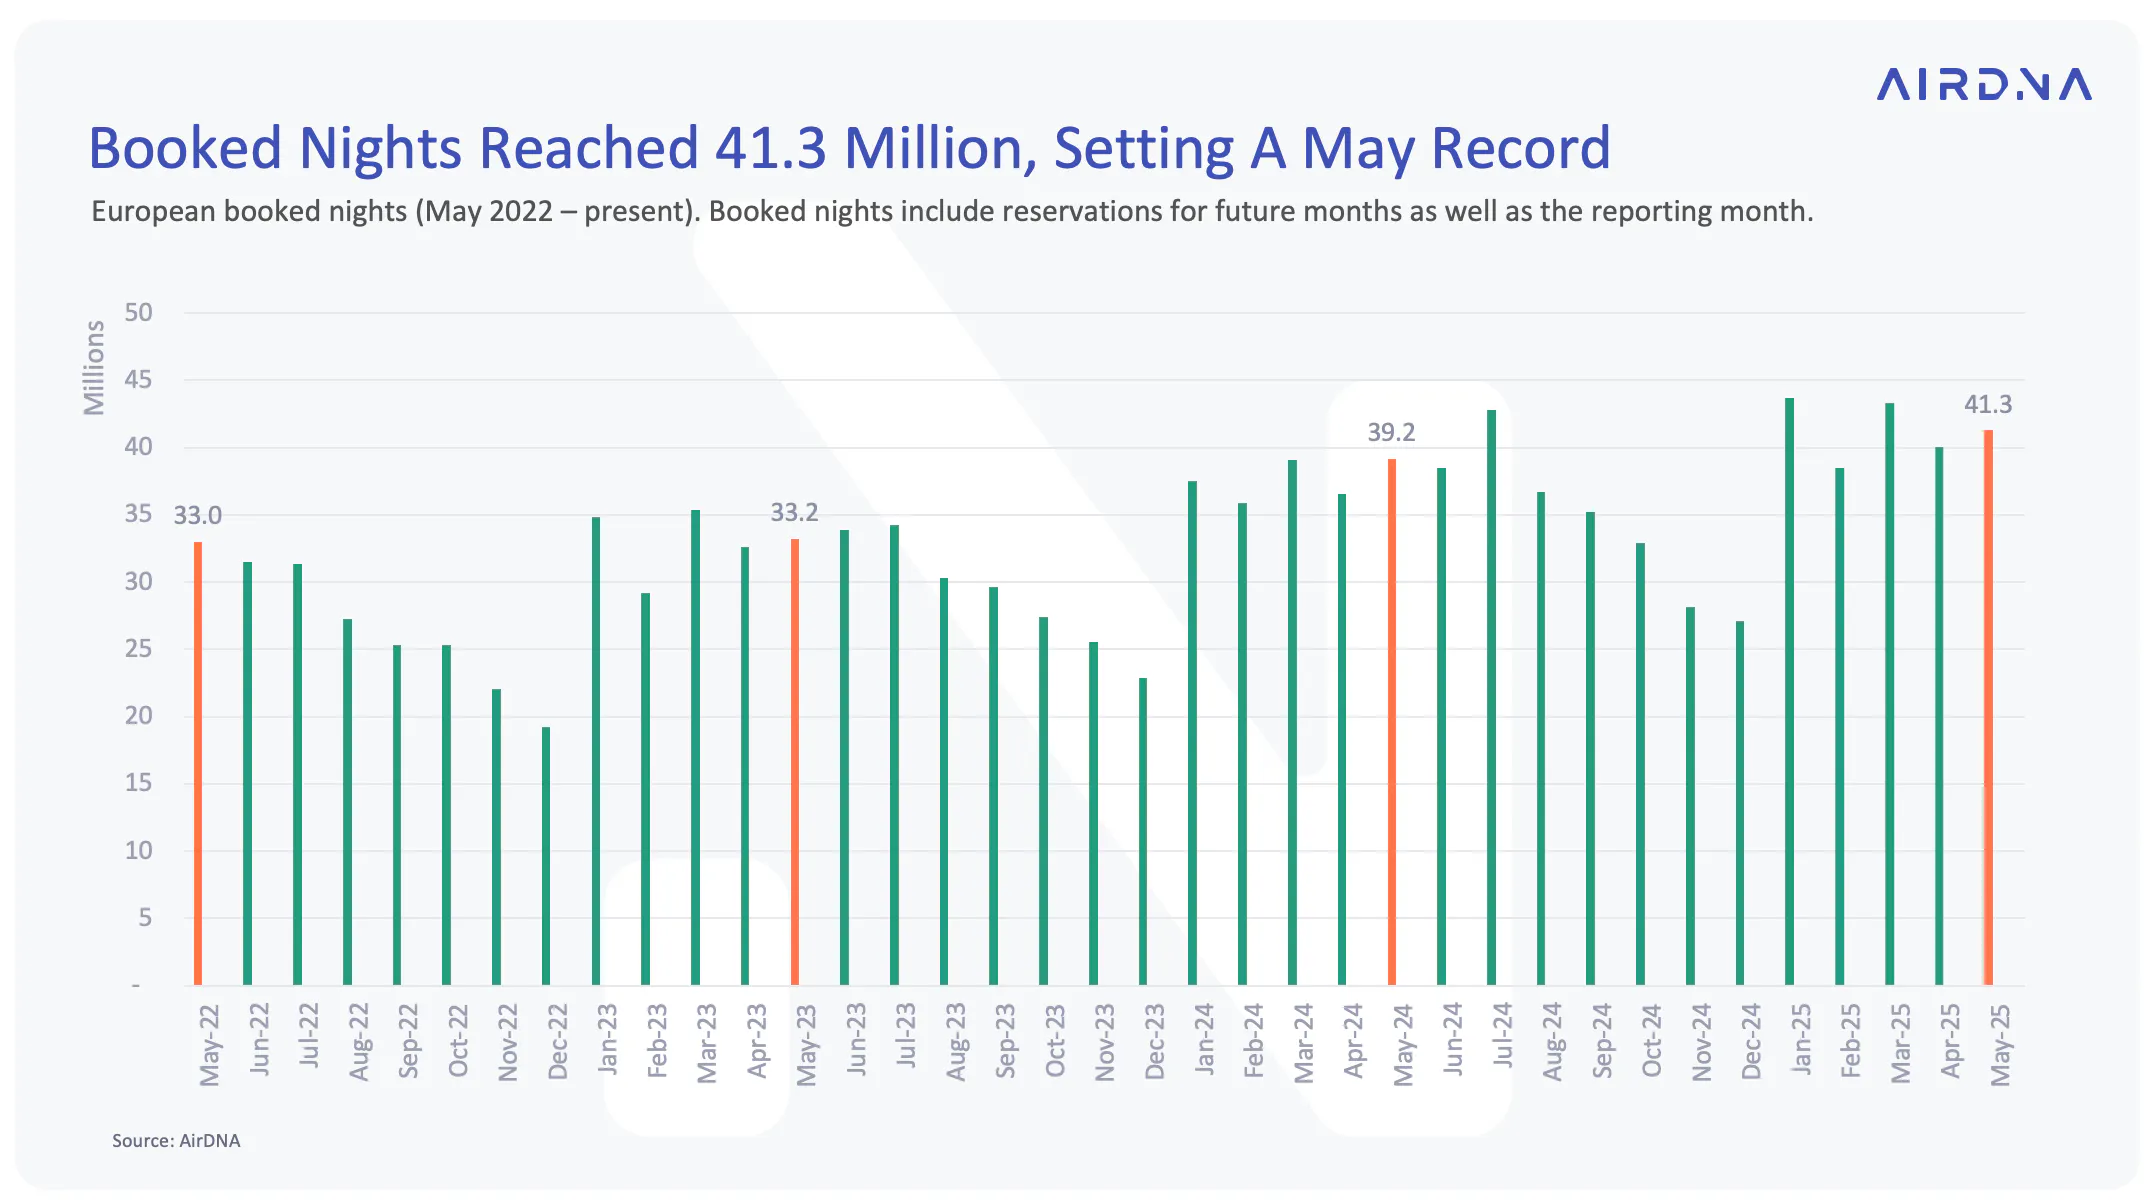
Among the top 20 markets, the following countries stood out with particularly strong growth in booked nights:
- Denmark (+34% YoY)
- Czech Republic (+16% YoY)
- Norway (+12% YoY)
- Poland (+10% YoY)
- Belgium (+10% YoY))
- Germany (+10% YoY)
Meanwhile, some countries did not see a positive gain of bookings last month:
- Croatia (-1% YoY)
- Austria (-1% YoY)
- United Kingdom (flat)
More Guests, But Even More Listings
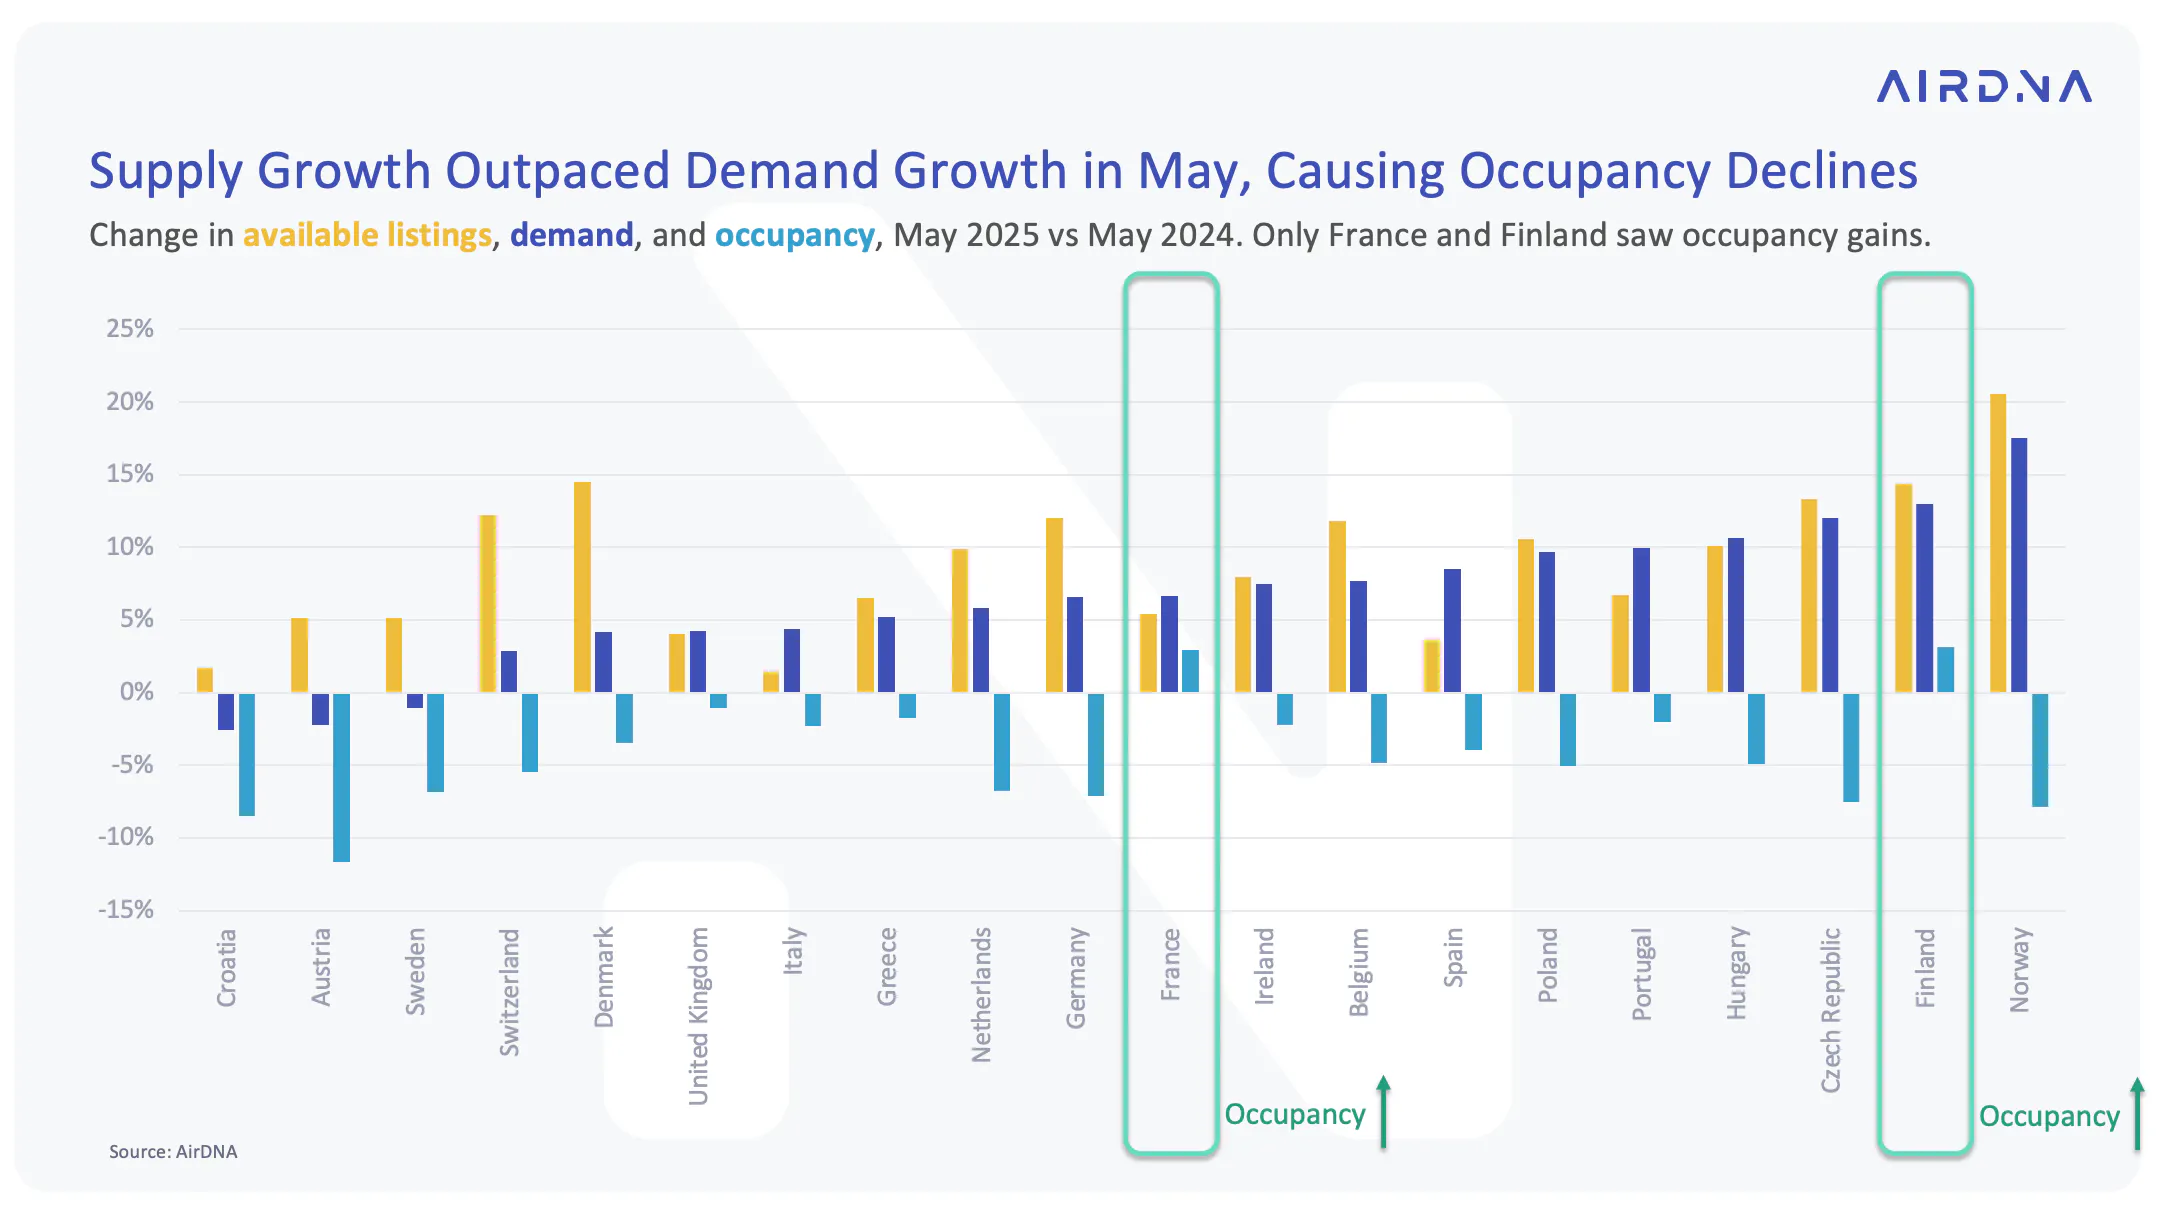
While May saw solid demand across much of Europe, supply growth continued to outpace it—leading to a year-over-year decline in overall occupancy.
Seventeen of the top 20 countries recorded demand growth compared to last May, with 13 of them seeing increases above 5%. However, occupancy rates fell in most countries, with the exception of France and Finland, which both saw modest gains of around 3%.
Standout performers by year-over-year demand growth included:
- Norway (+17.5% YoY)
- Finland (+13.0% YoY)
- Czech Republic (+12.1% YoY)
- Hungary (+10.6% YoY)
- Portugal (+10.0% YoY)
3 countries saw negative demand change:
- Croatia (-2.5% YoY)
- Austria (-2.2% YoY)
- Sweden (-1.1% YoY)
Summer Pacing & Affordability
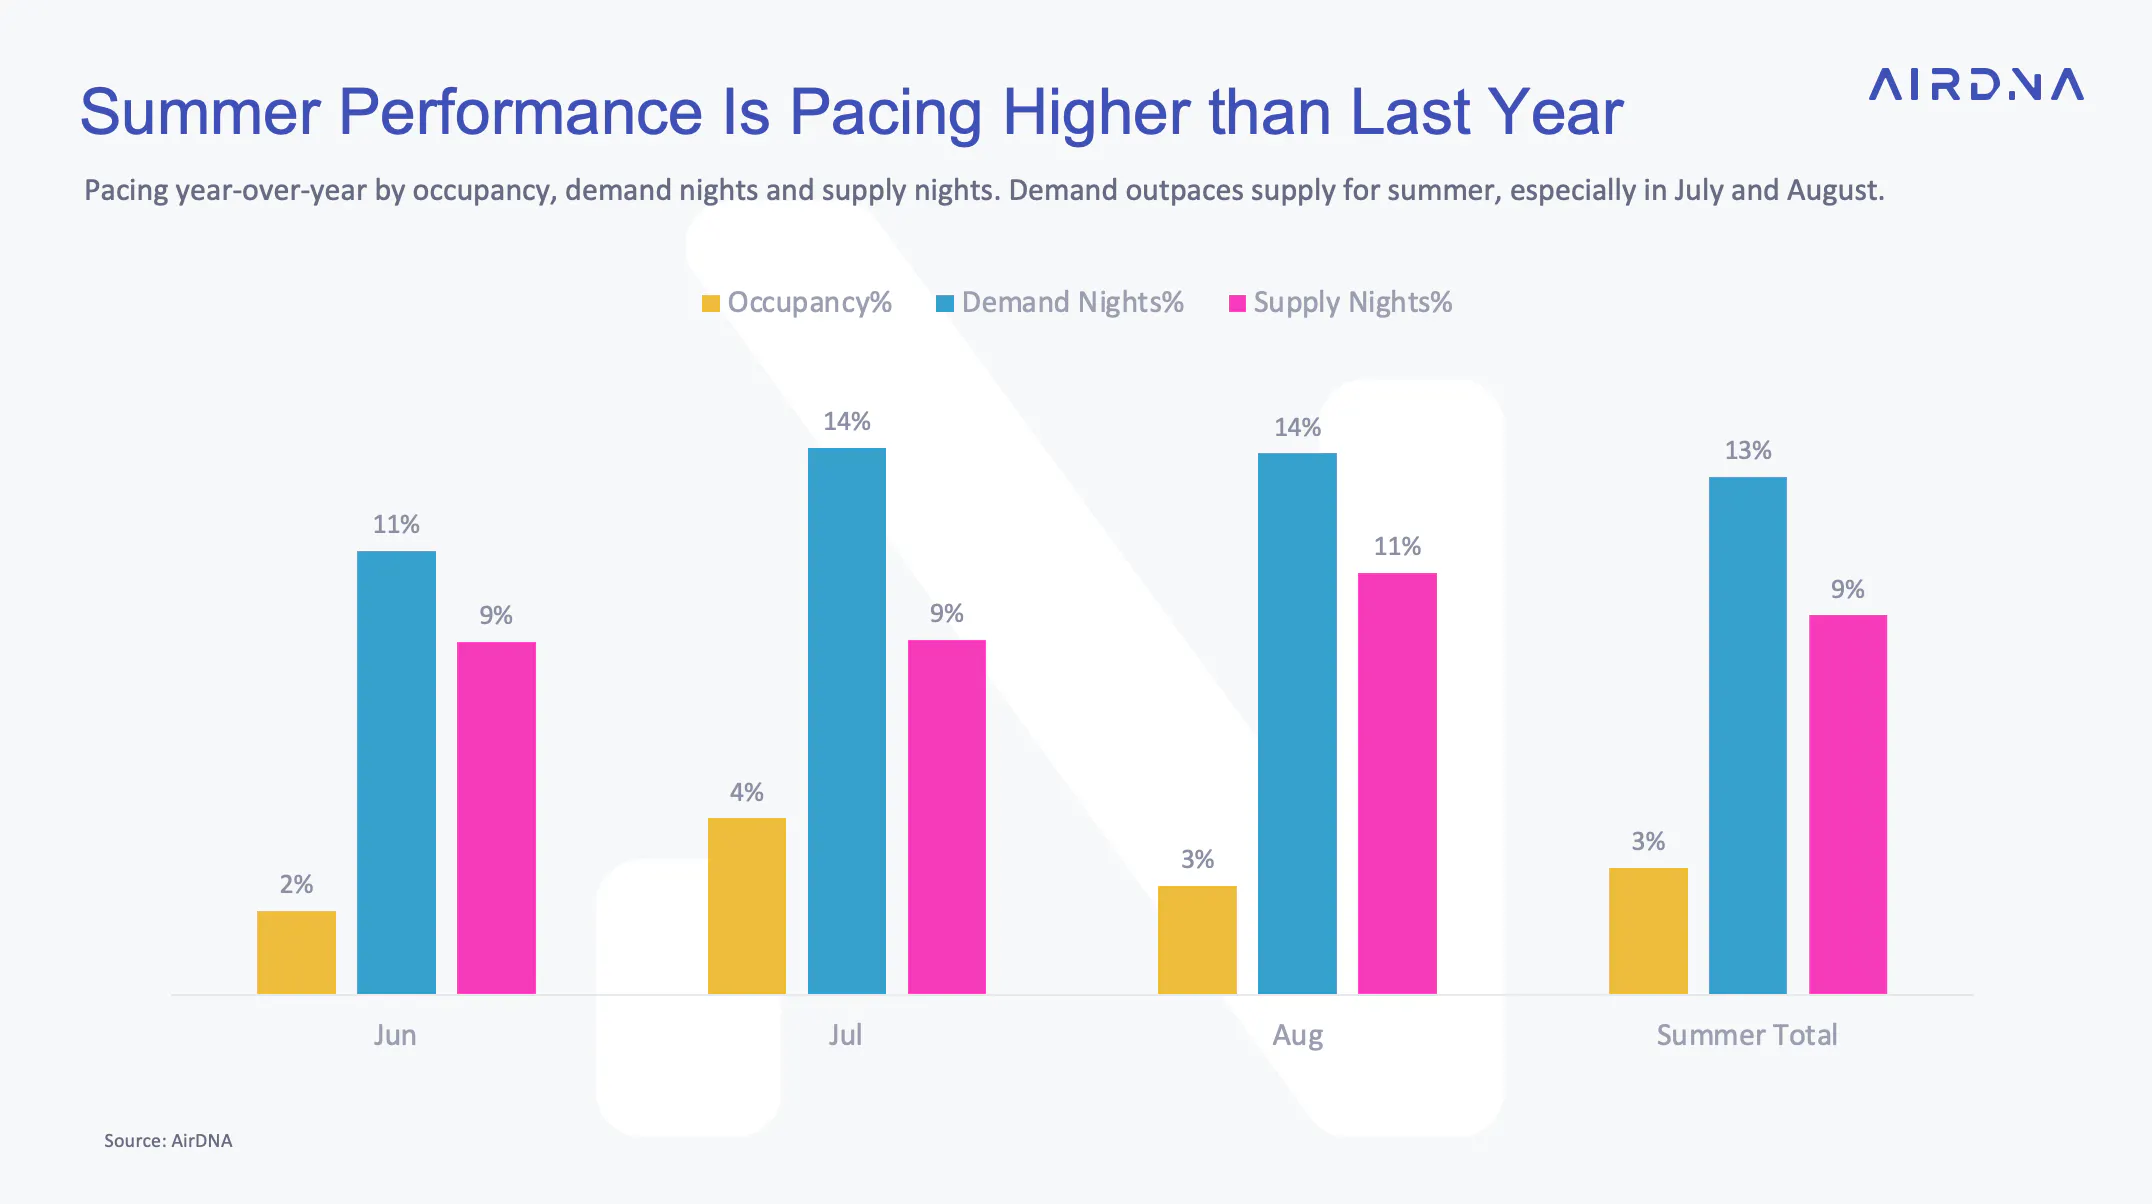
As of June 12, summer travel demand across Europe is trending upward. Occupancy pacing is up 3% year-over-year, with demand growing 13% and supply rising 9%—a promising sign for the peak months of July and August.
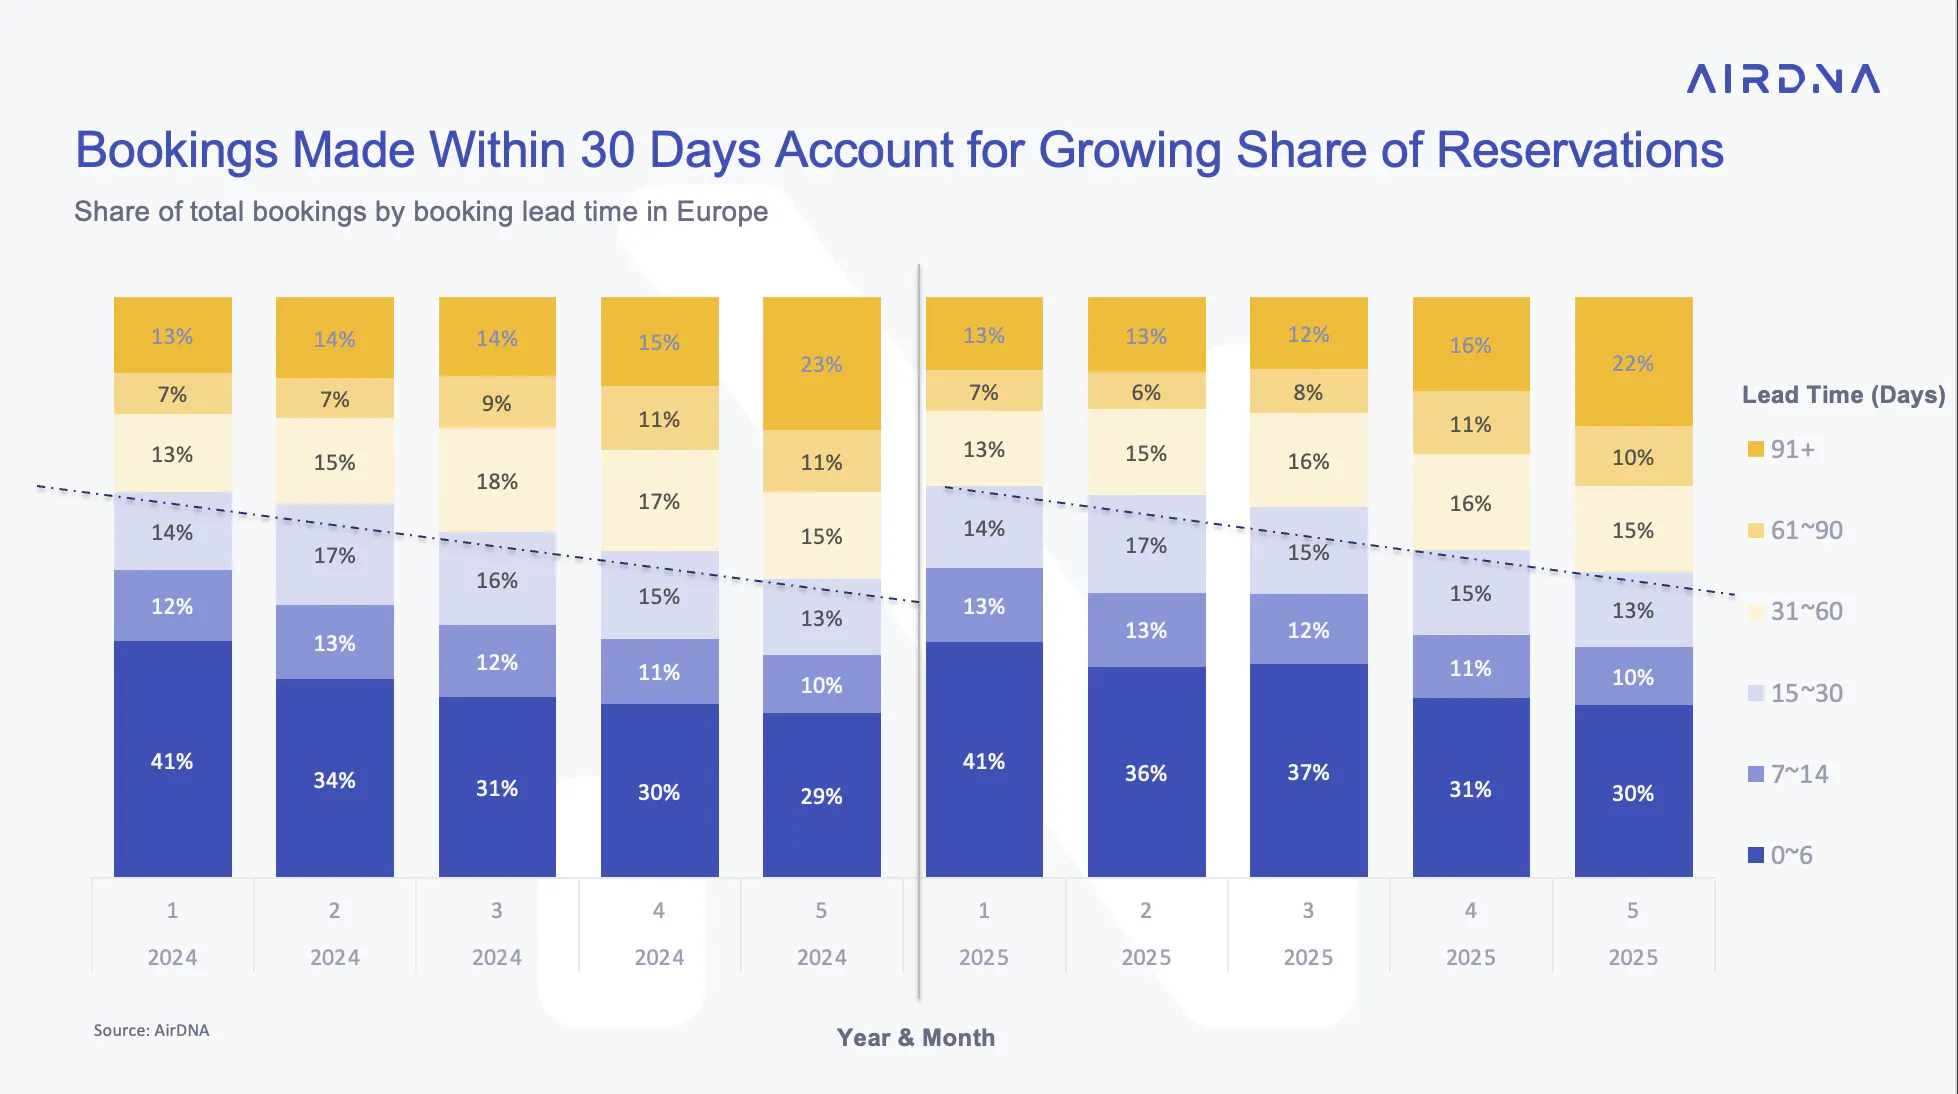
One notable shift this year is the shortening of booking windows. Compared to 2023, average lead time has dropped by about two days over the past five months (excluding April, which was impacted by an Easter shift). In May, the average lead time fell by one day to 57 days, reflecting strong interest in summer travel and a growing trend toward last-minute planning.
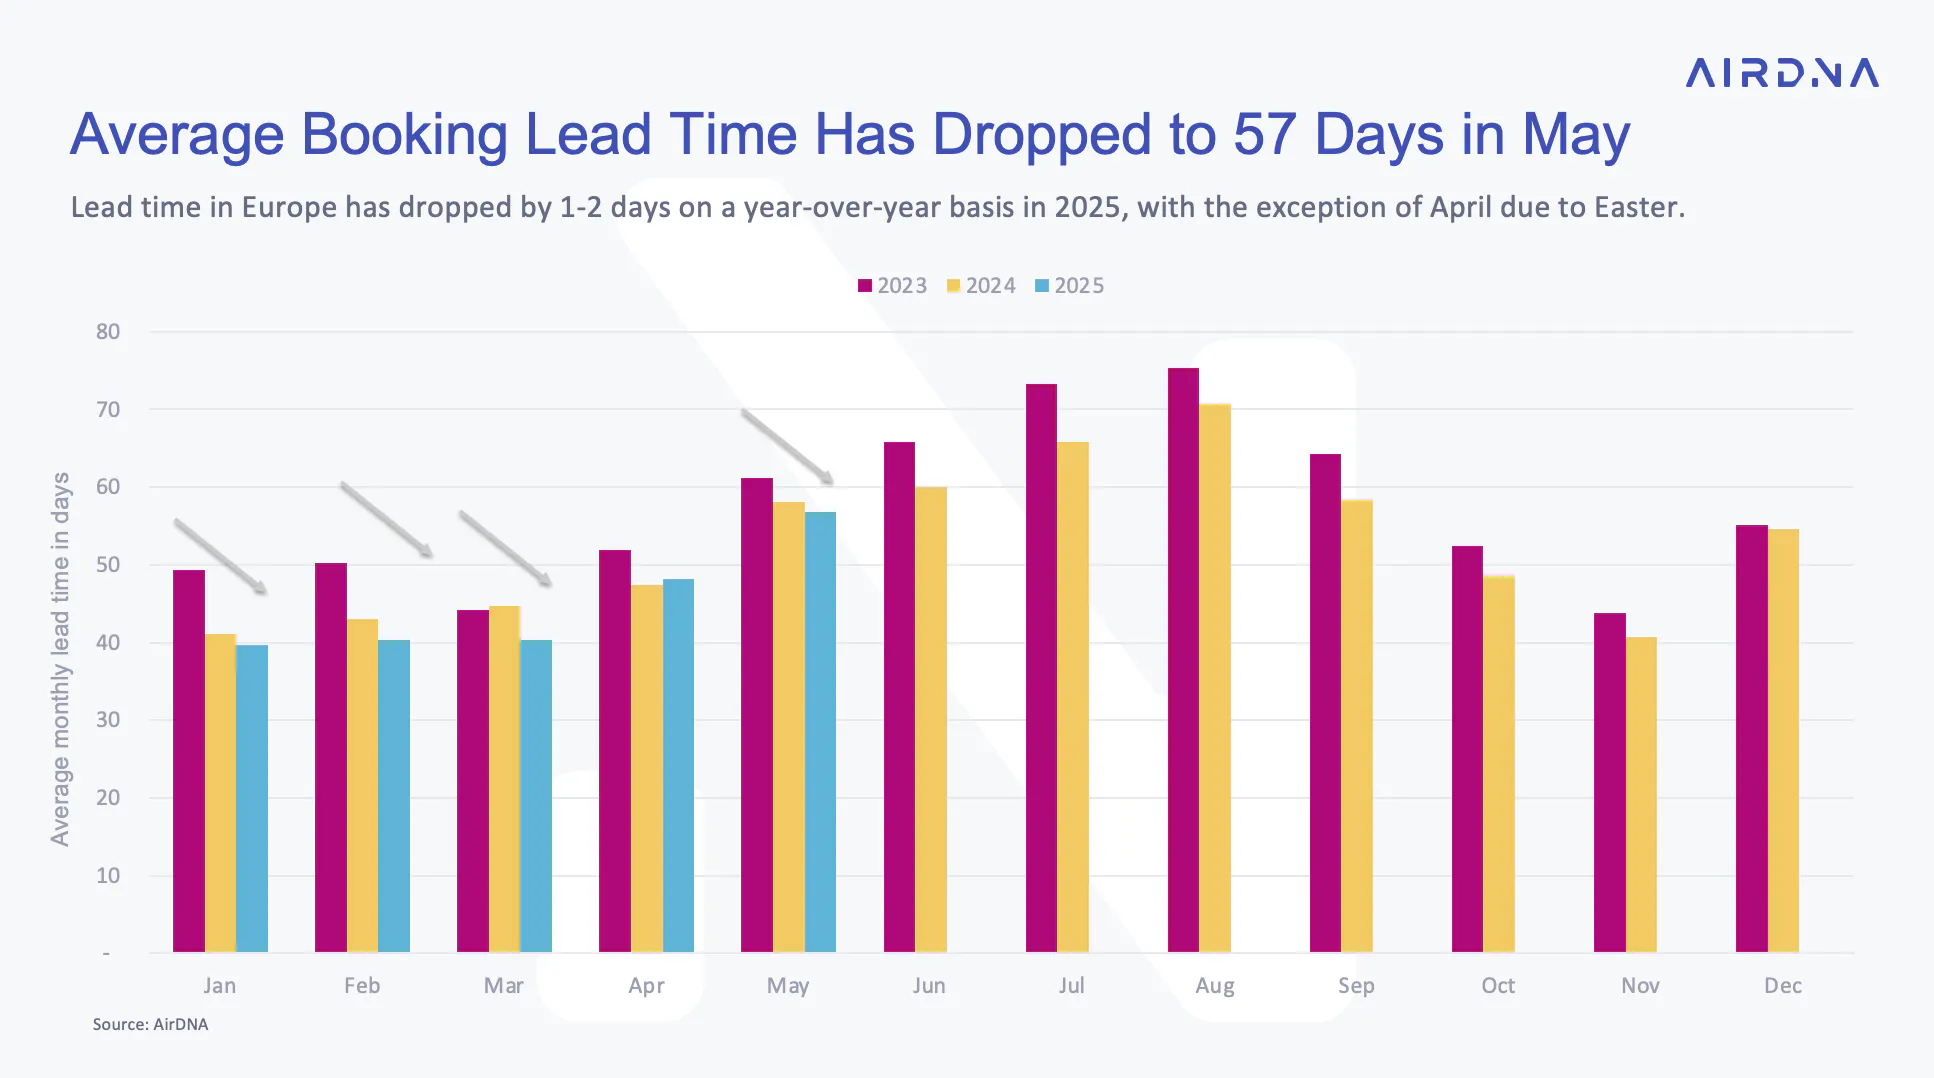
A closer look at booking windows below highlights the shift toward shorter planning horizons. The share of bookings made within 30 days has increased in 2025 compared to 2024, while the share of reservations made more than 91 days in advance has declined—from 23% to 22% in May. This trend reinforces the growing preference for more flexible, last-minute travel decisions.
Affordability Among European Destinations This Summer
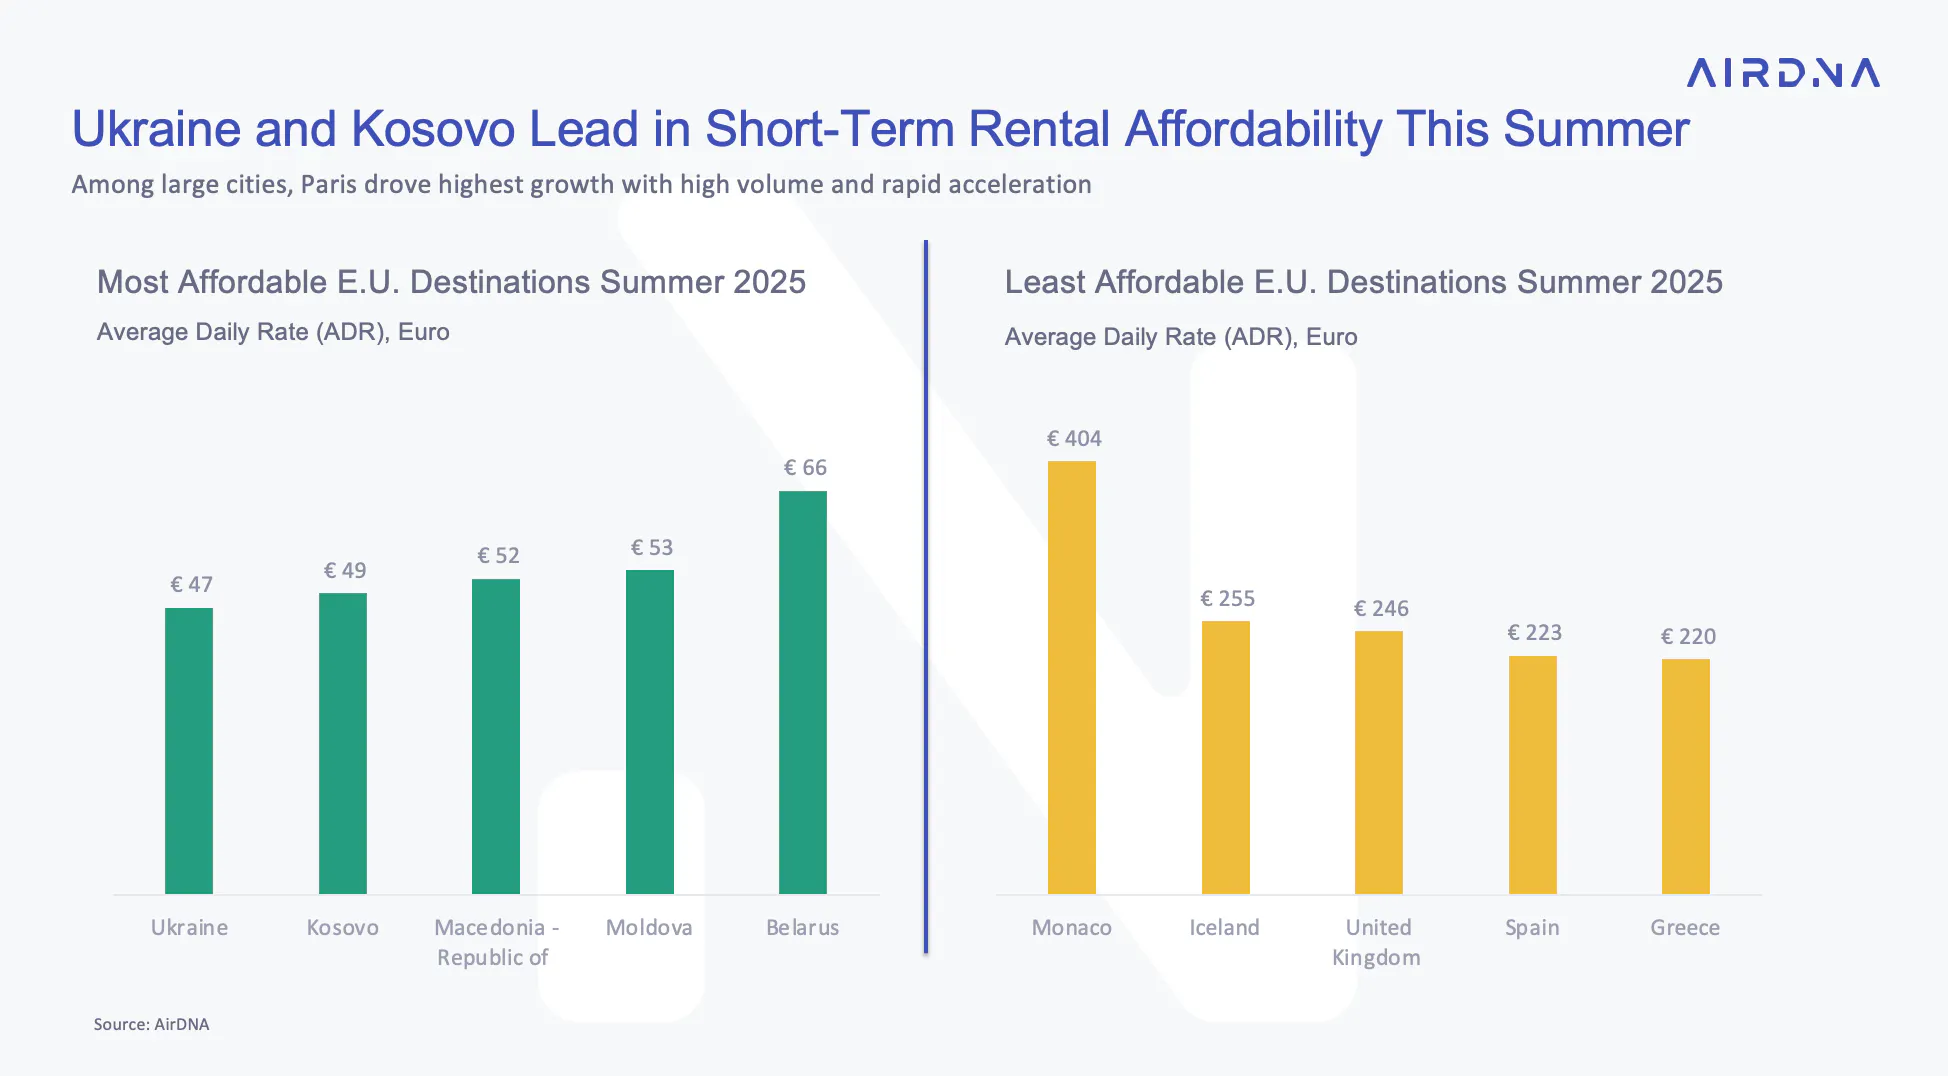
When it comes to affordability, Ukraine and Kosovo currently have the lowest average daily rates (ADR) for on-the-books summer reservations across Europe. Other budget-friendly options include Macedonia, Moldova, and Belarus, which are also expected to offer lower pricing this season.
At the other end of the spectrum, Monaco stands out as the most expensive market, with daily rates already exceeding €400. Iceland, the UK, Spain, and Greece follow as some of the priciest destinations for travelers this summer.
Get reliable data for smarter investment decisions
AirDNA allows you to handpick the active short-term rentals that align with your investment criteria and shows you exactly how a similar property performs in the real world.
ARTICLE SUMMARY
Occupancy dipped slightly across Europe in May 2025, likely reflecting a post-Easter slowdown. However, pacing data points to strong demand heading into summer. Plus, a look at American traveler trends to Europe and the shifting landscape of booking lead time.
Jamie Zhang
AirDNA Data Analyst
Jamie Zhang is a Data Analyst at AirDNA, leveraging her background in data science and analytics to uncover key trends in the short-term rental industry. Before joining AirDNA, she worked as a data analyst at Shanghai Disney, where she specialized in revenue forecasting and financial planning . She holds a Master’s degree in International Economics and International Relations from Johns Hopkins. Jamie enjoys cycling to explore different corners of the city.
