

 Calculate Revenue
 Research Markets
 Find For Sale Properties
 Compare My Listing
 STR Revenue Calculator
 Custom Comp Sets
 Submarket Insights
 Custom Search Filters
 Rate Recommendations
 Performance Benchmarking
 Competitor Comparison
 Owner Contact Details
 Property-level performance data
 Tourism Insights
 Real Estate Investment Analytics
 About Us
 Sales
Sales Support
 Press
PressAirDNA vs. Eurostat: How Closely the 2025 Data Matches Across Europe
Published: May 8, 2026

Camilo Schmid Rivas
Key Takeaways
- AirDNA and Eurostat track nearly identical reservation trends across Europe, with a 0.97 correlation across 31 countries.
- AirDNA captures more demand nights because it includes longer stays and direct bookings outside Eurostat’s reporting scope.
- The biggest difference between the two data sets isn’t accuracy, it’s depth, speed, and market-level detail.
In March 2026, Eurostat published its 2025 summary of experimental statistics on short-term rental activity across the EU27, using data shared directly from Airbnb, Booking.com, and Expedia. With new EU short-term rental regulations set to roll out in May to improve data collection and transparency across Europe, we wanted to see how Eurostat’s figures compare with AirDNA’s view of the market.
At the EU27 level, the alignment is remarkably close. When we compare AirDNA reservations against Eurostat’s Stays metric, the two sources trend almost 1:1 across every month. The seasonal patterns match, growth moves in lockstep, and both data sets tell the same story: Europe’s short-term rental market continues to mature and expand.
But the comparison also reveals where the two sources diverge. AirDNA consistently captures more demand nights than Eurostat reports, driven by broader listing coverage that includes longer stays and direct bookings beyond the platforms included in Eurostat’s reporting agreement. Rather than a discrepancy, this gap is stable, predictable, and largely explained by differences in average length of stay.
In this post, we break down the comparison metric by metric, explain where the differences come from, and explore what AirDNA’s faster, deeper, and more granular data makes possible beyond official statistics alone.
Breaking Down the Numbers
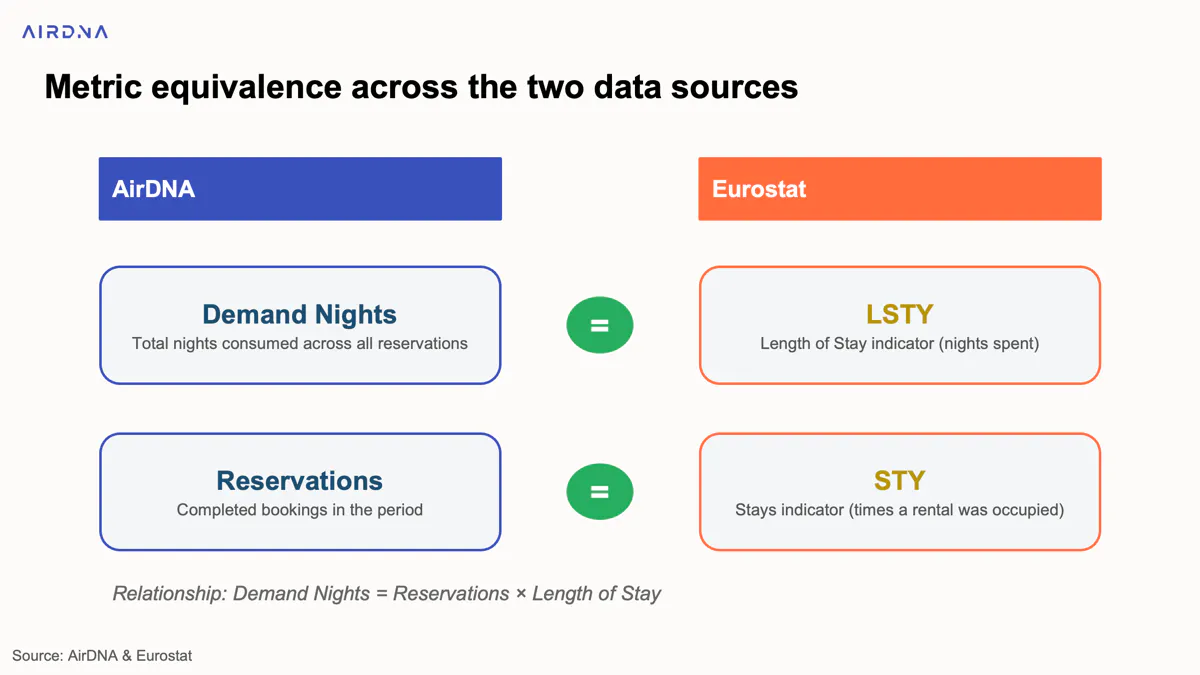
Before diving into the comparison, it’s worth clarifying exactly what each source is measuring. The metrics line up closely, but they’re not perfectly identical.
Eurostat publishes three core indicators as part of its experimental statistics program:
- Stays (STY): the number of times a short-term rental was occupied
- Nights Spent (NGT_SP): the total number of nights occupied multiplied by the number of guests
- Length of Stay (LSTY): despite the name, this is not an average. It’s actually a cumulative total that aligns with demand nights
That last metric can be confusing at first glance, but our diagnostic analysis confirmed that Eurostat’s LSTY ultimately reflects the total number of nights spent in an accommodation, regardless of party size.
On the AirDNA side, there are two natural equivalents. Reservations, the number of completed bookings in a given period, maps directly to Eurostat’s Stays. Both metrics are counting the same fundamental unit: one guest check-in equals one stay equals one reservation.
Demand Nights, the total number of nights booked across all reservations, maps to Eurostat’s LSTY. The relationship between the two is straightforward: demand nights equal reservations multiplied by length of stay.
For example, a three-night booking for five guests would equal:
- 1 Reservation / STY
- 3 Demand Nights / LSTY
- 15 Nights Spent
There’s one important scope difference between the two sources. Eurostat’s data comes directly from Airbnb, Booking.com, and Expedia under the 2020 data-sharing agreement and only includes bookings made through those platforms.
AirDNA tracks a broader universe of listings, including longer stays and direct bookings outside the major online travel agents (OTAs). That means AirDNA will generally capture more activity than Eurostat, particularly in markets where direct bookings or alternative platforms play a larger role.
As we’ll see, that difference is barely noticeable at the reservation level, but becomes much more visible in demand nights, and the reason largely comes down to length of stay.
The Key Difference Comes Down to Length of Stay
Before comparing demand nights directly, it’s worth looking at one of the key structural differences between the two data sets: average length of stay.
Because demand nights are simply reservations multiplied by length of stay (LOS), even small differences in LOS flow directly through to the demand-night totals. Understanding where and why those differences exist helps explain the comparisons that follow.
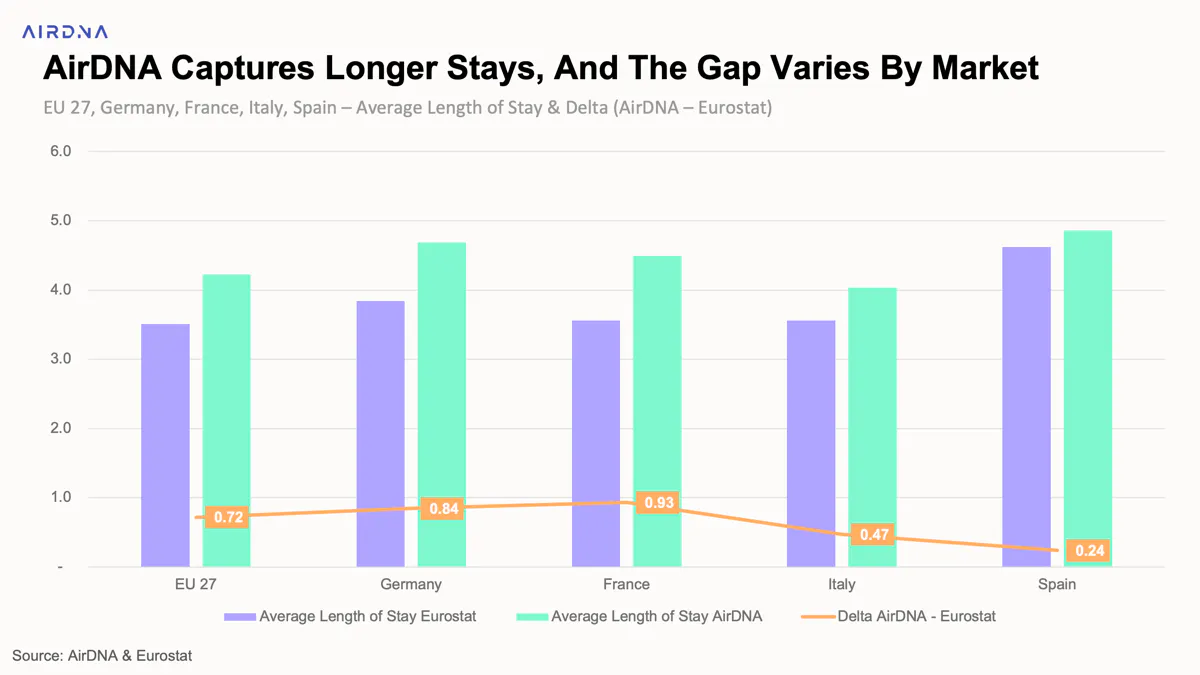
At Airdna, we calculate average length of stay as total demand nights divided by total reservations. Eurostat’s equivalent is Nights Spent divided by Stays. At the EU27 level, Eurostat reports an average LOS of 3.5 nights, while AirDNA reports 4.2 nights, a difference of 0.72 days. More importantly, that gap remains remarkably stable over time, which tells us this is a structural difference rather than statistical noise.
So, where do the extra 0.72 days come from?
AirDNA’s broader listing coverage captures inventory that sits outside Eurostat’s three-platform scope, particularly longer-stay properties and direct bookings that don’t flow through Airbnb, Booking.com, or Expedia.
Those additional bookings do contribute to AirDNA’s reservation count, but because they make up a relatively small share of total booking volume, the impact at the reservation level remains modest. At the demand-night level, however, the effect becomes much more noticeable. Every longer stay adds multiple additional nights, which is why the gap between the two sources widens considerably when comparing demand nights instead of reservations.
The country-level data reinforces this pattern. In Germany, the LOS difference rises to 0.84 days, while France shows the widest gap at 0.93 days. Both countries have strong traditions of longer-stay holiday rentals. Ferienwohnungen in Germany, along with gîtes and rural holiday lets in France, are often booked directly with property owners or through local platforms rather than the major OTAs. These longer bookings appear in AirDNA’s data but sit outside Eurostat’s reporting framework.
The pattern flips in more OTA-dominated markets. In Spain, where the STR ecosystem runs heavily through Airbnb and Booking.com, the LOS difference falls to just 0.24 days. Italy sits in the middle at 0.47 days. In these markets, the three Eurostat platforms capture a much larger share of total booking activity, so both data sets end up reflecting a very similar LOS profile.
The key takeaway is that the LOS gap between AirDNA and Eurostat is primarily a coverage difference. It’s widest in markets where direct bookings and off-platform stays are more common, and smallest where the major OTAs dominate the booking landscape. With that in mind, we’d expect the reservation comparison in the next section to align very closely, while the demand-night comparison should show a larger but highly explainable spread.
Reservations Tell the Same Story
With the metric definitions and length-of-stay differences established, we can now move into the core comparison, starting with reservations, where the two data sets align most closely.
After indexing both data sets to their 2025 averages and comparing monthly patterns across all 31 countries, we found an average correlation of 0.97 between Eurostat Stays and AirDNA Reservations. In other words, both sources are capturing the same seasonal dynamics with an exceptionally high level of consistency.
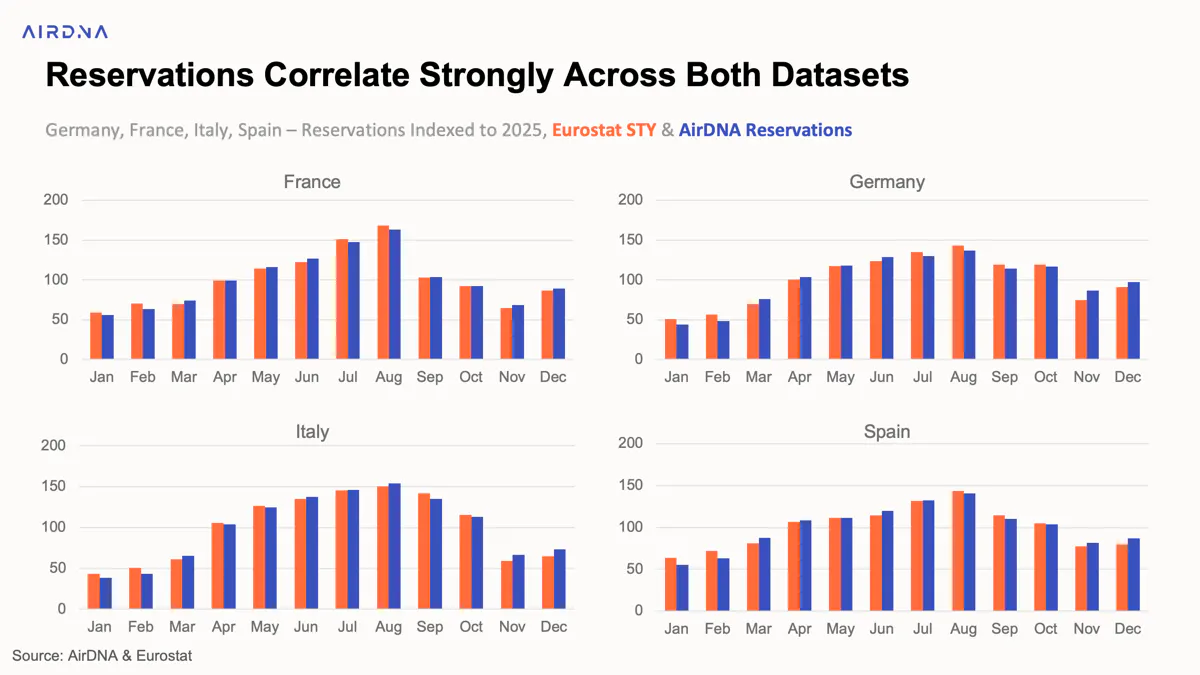
The chart above highlights this across four of Europe’s largest STR markets. In France, Germany, Italy, and Spain, the indexed monthly bars move almost perfectly in sync. Both data sets show the same winter slowdowns, the same summer peaks, and the same shoulder-season ramp-ups. No matter which source you look at, the shape of Europe’s short-term rental market looks fundamentally the same.
And this alignment holds across nearly every country in the analysis.
Of the 31 countries included, 26 show a correlation above 0.95. Several of Europe’s largest markets, including France (0.99), Greece (0.99), Italy (0.99), Portugal (0.99), and Ireland (0.99), are nearly indistinguishable in their seasonal booking patterns.
Even the lower-correlation markets still show strong agreement. Slovakia comes in at 0.87 and Finland at 0.85, both well above what you’d expect from unrelated data sets.
Finland is worth a quick note here. AirDNA captures proportionally more reservation activity during the November and December high season, likely reflecting holiday cabins and Lapland inventory booked through channels outside Eurostat’s three-platform scope. The seasonal pattern still aligns closely, AirDNA simply captures a more pronounced winter spike.
The average absolute difference between the two indexed series is just 7 points across all countries. In practical terms, that means the two sources usually sit within 7 percentage points of each other on a base-100 index in any given month.
Several markets track even more tightly than that. Malta averages just 2 points of difference, Luxembourg 2.9, France 3.0, and Portugal 3.1. At the wider end of the spectrum, Denmark (16.2) and Croatia (12.1) show larger spreads, consistent with markets where AirDNA’s broader coverage captures more seasonal variation from off-platform inventory.
The takeaway is straightforward: at the reservation level, AirDNA and Eurostat are clearly tracking the same market. The trends match, the seasonality aligns, and the consistency holds across countries large and small. Where differences do appear, they’re systematic and closely tied to the same coverage dynamics outlined in the length-of-stay section, not discrepancies in the underlying market signal.
Demand Nights Are Where the Gap Widens
As the length-of-stay section established, even relatively small differences in average LOS get multiplied across every booking. This is where that effect starts to show up more clearly in practice.
The seasonal patterns still match closely
At the EU27 level, AirDNA captures approximately 38% more demand nights than Eurostat’s LSTY figure across 2025. In absolute terms, that translates to roughly 445 million demand nights in AirDNA versus 321 million in Eurostat across EU27 countries.
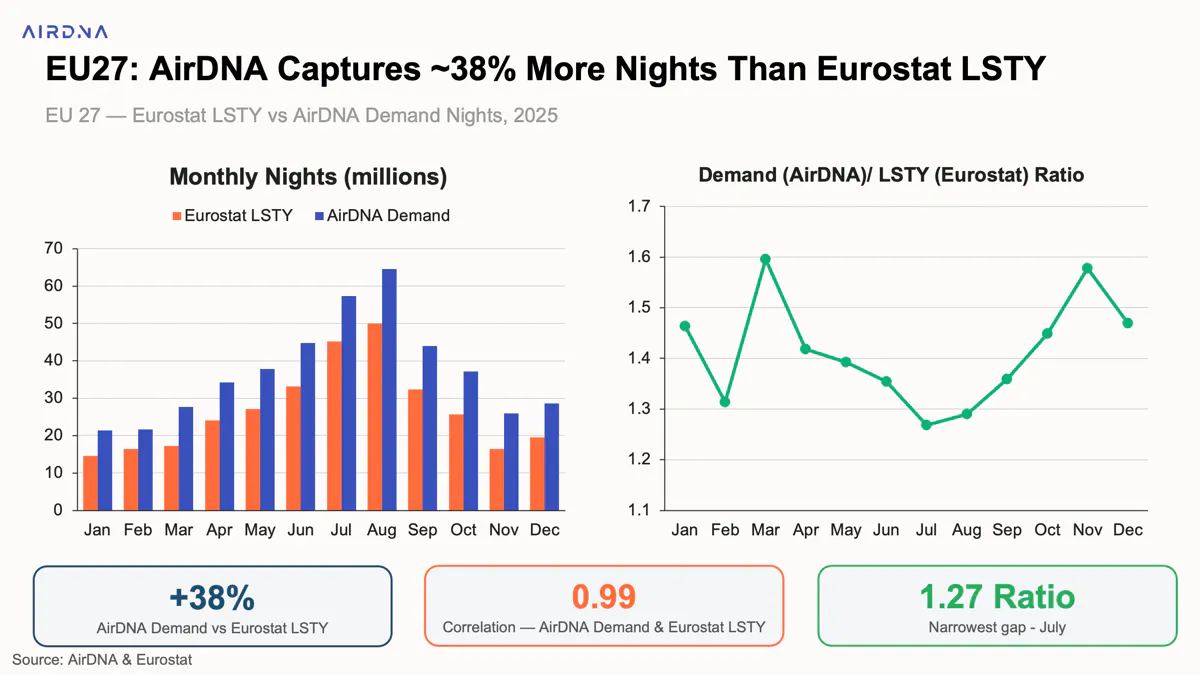
Despite the volume difference, the correlation between the two series remains exceptionally strong at 0.99. The seasonal shape is almost identical. What changes is the scale.
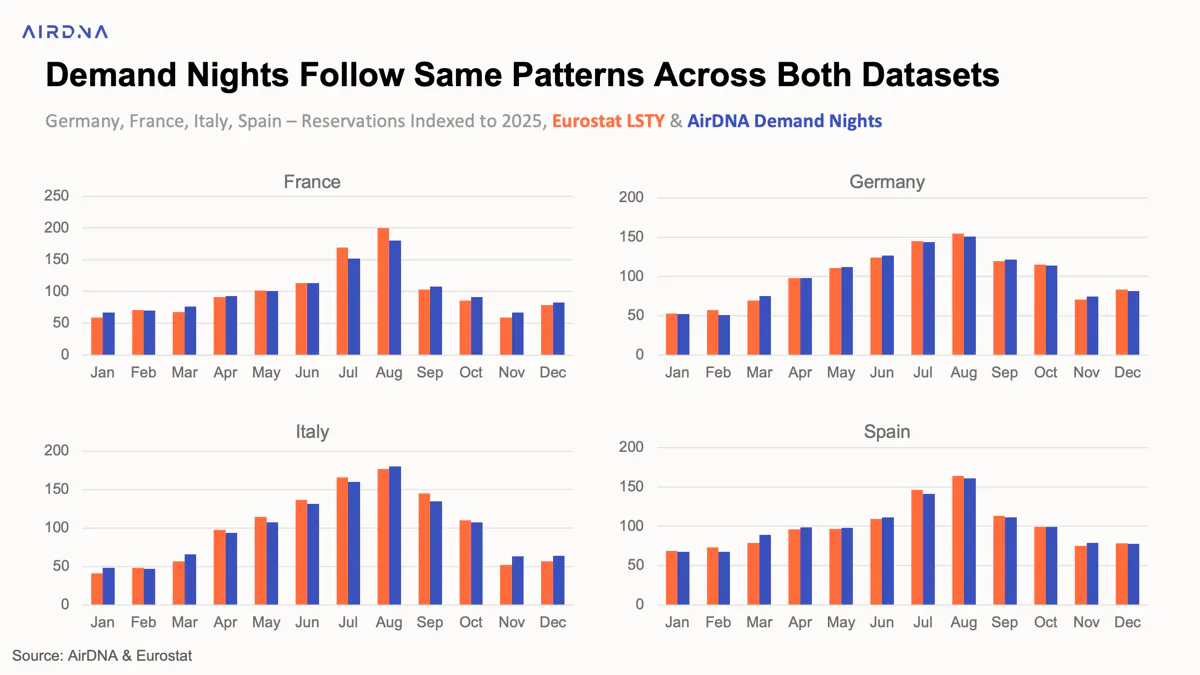
The indexed country-level comparison for France, Germany, Italy, and Spain reinforces this. Both data sets peak and trough in the same months, ramp into summer at the same pace, and cool at nearly identical rates into autumn. Across all four markets, the indexed bars track closely together, showing that both sources are measuring the same demand cycle, AirDNA simply captures more of the total volume.
That’s the key distinction between the reservation and demand-night comparisons. At the reservation level, AirDNA and Eurostat are nearly interchangeable. At the demand-night level, AirDNA extends the picture by capturing longer stays and direct bookings that sit outside the official statistics.
Why the gap gets bigger in the off-season
The ratio between AirDNA demand nights and Eurostat LSTY becomes especially interesting when broken down month by month.
The gap is narrowest during peak summer travel, reaching its lowest point in July at a 1.27 ratio. During the off-season, however, the spread widens considerably, climbing above 1.55 in both November and March.
That pattern lines up closely with what we’d expect. The additional demand AirDNA captures tends to skew toward longer-stay bookings and direct reservations, both of which represent a larger share of total activity during quieter months, when short-stay OTA bookings are less dominant.
We attribute the volume difference to two primary factors. First, AirDNA’s broader coverage captures longer-stay inventory that doesn’t flow through Airbnb, Booking.com, or Expedia, the same dynamic driving the LOS gap discussed earlier. Second, AirDNA captures direct bookings that bypass the three Eurostat platforms entirely, adding incremental demand nights to the total market picture.
Both factors become more influential during the off-season, when longer holiday lets and direct-booked properties make up a larger proportion of total demand.
The gap has been narrowing over time
In 2018 and 2019, AirDNA recorded roughly 55% more demand nights than Eurostat, reflecting a much larger share of off-platform and direct-booking activity. During the pandemic, that gap widened sharply as direct bookings accelerated across Europe.
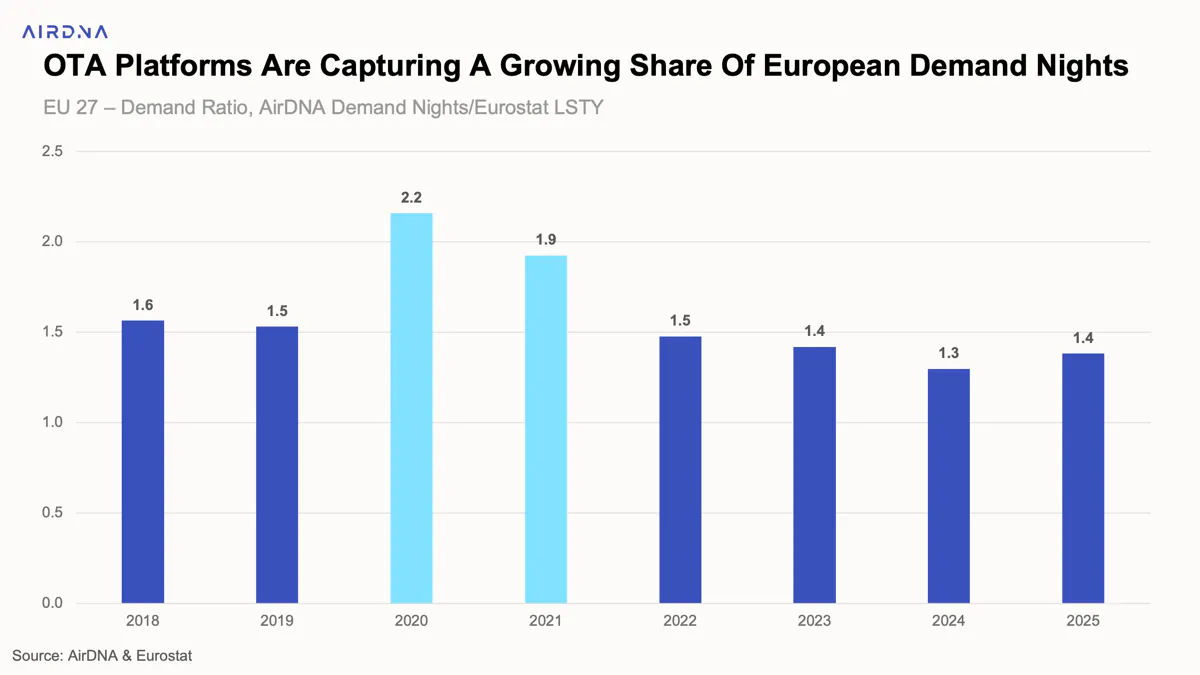
Since 2022, however, the ratio has steadily narrowed, falling from 1.47 to around 1.38 in 2025. That suggests a growing share of Europe’s STR recovery has flowed through the major OTAs, with Airbnb and Booking.com continuing to consolidate market share across the region.
The slight uptick in 2025 may partly reflect TripAdvisor’s removal from the Eurostat data set at the end of 2024, though its overall contribution was relatively small and much of its inventory was already cross-listed on larger platforms.
The broader trend remains clear: the gap between OTA-reported demand and total market demand is gradually shrinking as platform adoption continues to grow across Europe.
What AirDNA Adds Beyond the Official Data
The comparisons in the previous sections confirm that AirDNA and Eurostat are tracking the same underlying market dynamics. But the two data sets were built for very different purposes.
Eurostat’s data was designed as a policy benchmark. AirDNA’s data is designed to help operators, investors, and analysts make decisions in real time. That means the real difference between the two isn’t accuracy, it’s utility.
No lag, no waiting
Eurostat’s data-sharing agreement with the platforms comes with a built-in reporting delay. Country-level data is published several months after the fact, with regional data following even later.
For policy research and academic analysis, that timing works perfectly well. But for operators adjusting pricing ahead of next month’s peak season, or investors evaluating market opportunities in real time, it’s simply too slow.
AirDNA delivers monthly performance data without the same reporting lag, allowing users to track demand shifts, pricing trends, and competitive dynamics as they happen, not months later.
From country-level data to neighborhood insights
Eurostat publishes data primarily at the country level, with delayed regional breakdowns available at the NUTS 2 and NUTS 3 levels.
AirDNA goes significantly deeper.
Users can drill from country to city, submarket, neighborhood, and even individual listing level, filtering by property type, bedroom count, price tier, amenities, and more.
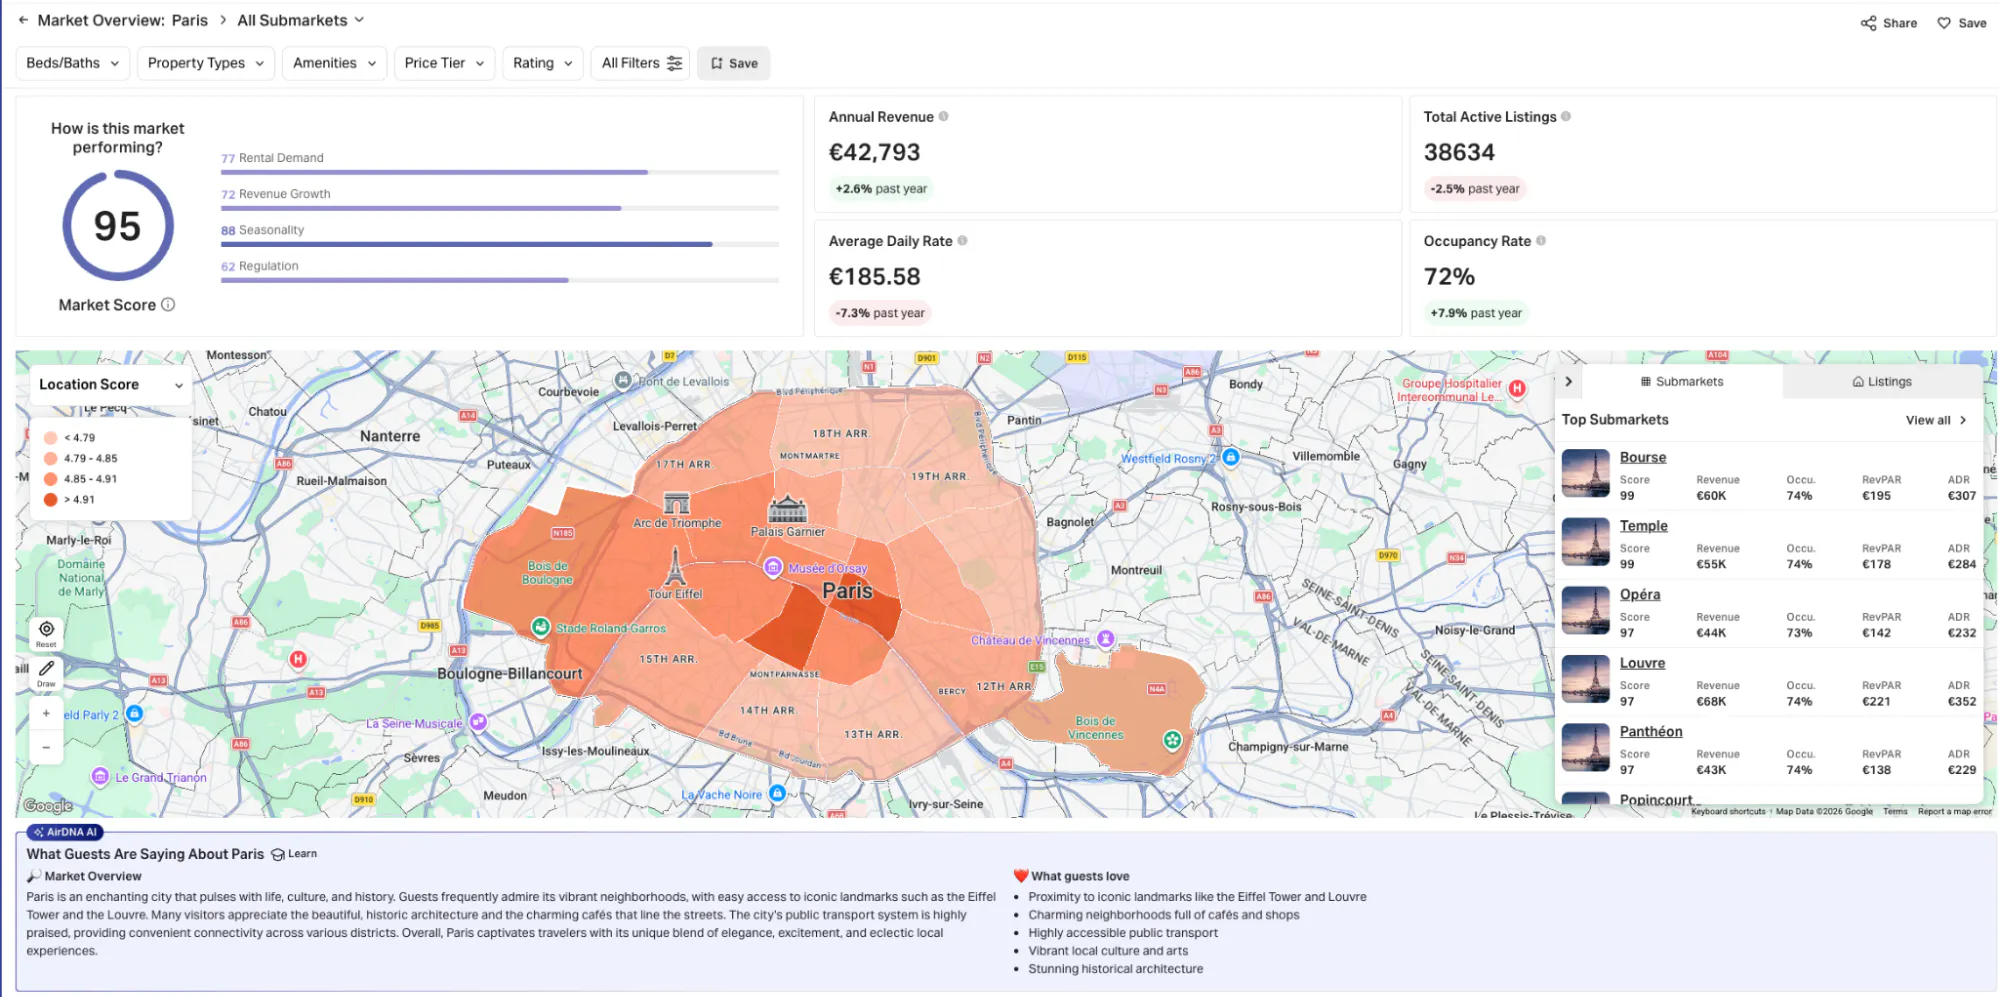
A Market Overview page for a city like Paris, for example, surfaces ADR, occupancy, annual revenue benchmarks, listing counts, and year-over-year trends at a glance. Location score maps highlight neighborhoods with stronger investment potential, while AirDNA AI adds narrative context around what’s driving guest demand in a particular market.
The result is less time spent interpreting spreadsheets and more time making decisions.
Trends you can act on
Beyond point-in-time snapshots, AirDNA surfaces the patterns that directly impact revenue performance.
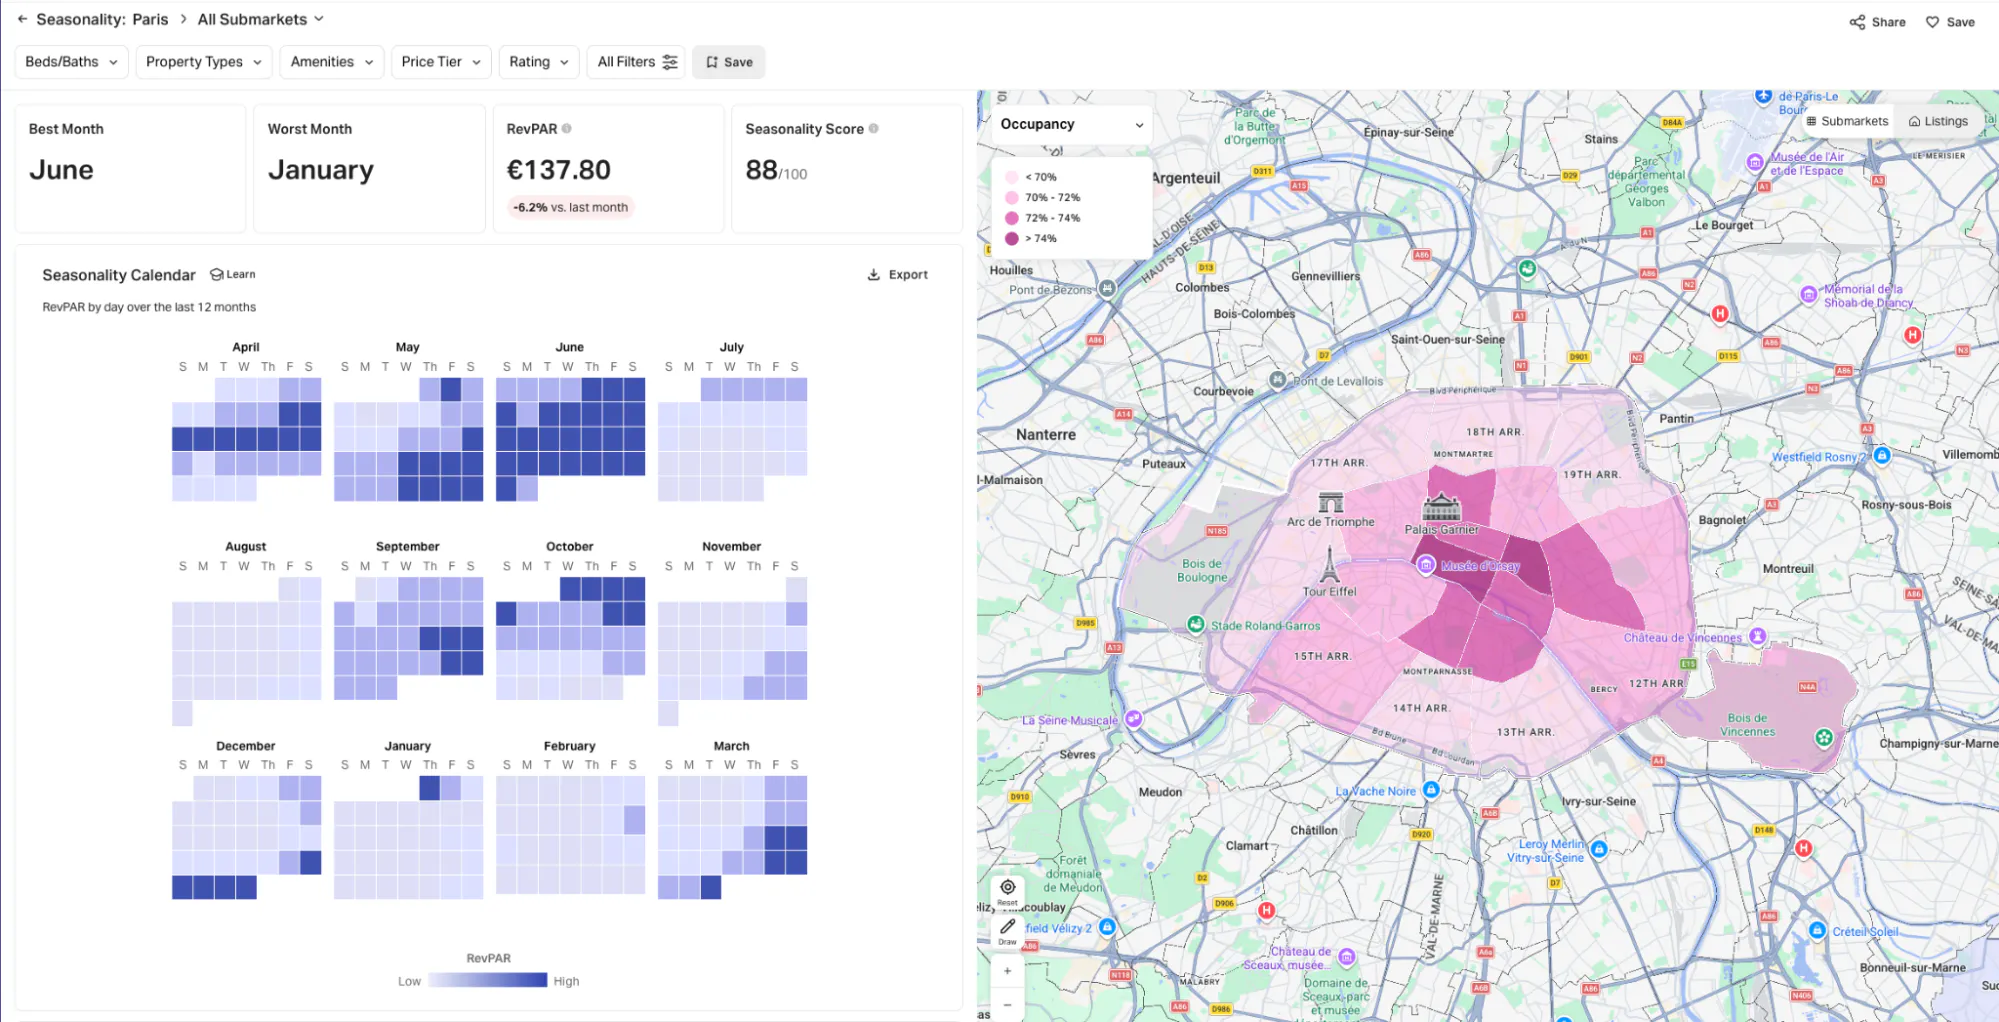
Seasonality calendars show when RevPAR typically peaks in a market, helping hosts and operators plan pricing strategies months in advance. Occupancy trend data reveals whether demand is tightening or softening, and how performance shifts across property types, tiers, and submarkets over time.
These are dimensions Eurostat doesn’t publish, but they’re often the ones that matter most operationally.
Revenue projections for prospective investors
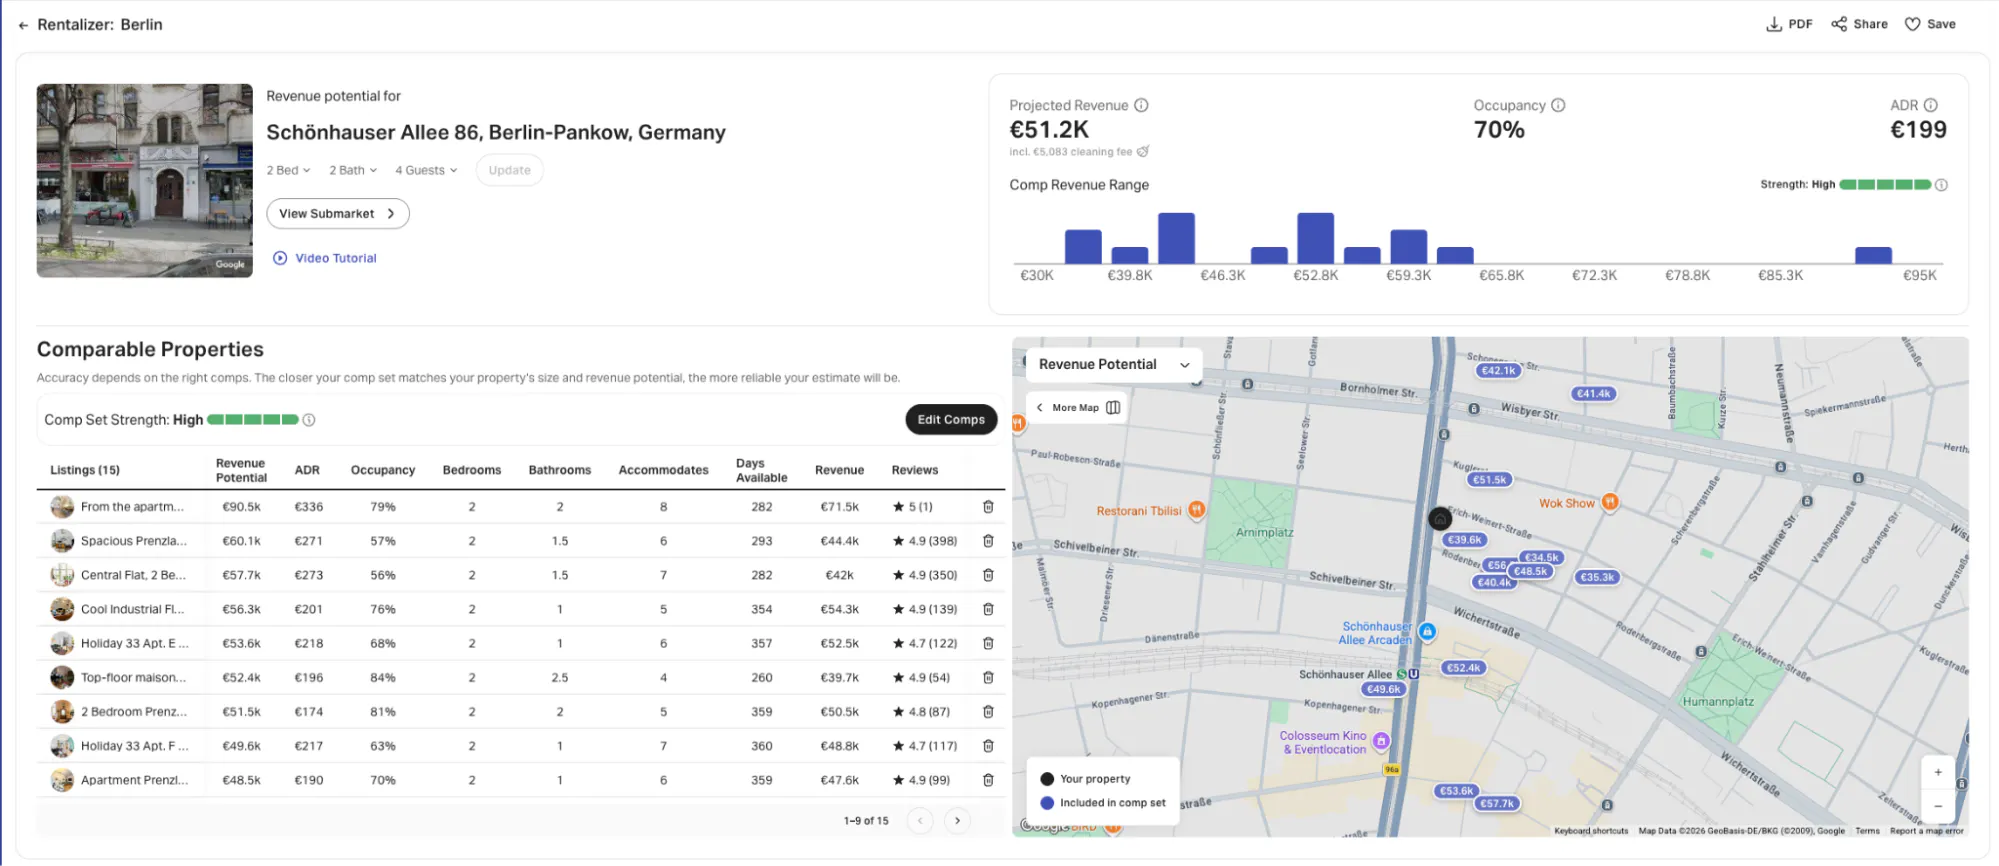
For investors evaluating potential STR acquisitions, AirDNA’s Rentalizer tool helps bridge the gap between market research and investment decisions.
Rather than relying on broad market averages, Rentalizer generates revenue projections for specific properties using real booking performance from comparable short-term rentals nearby. The model factors in property type, size, location, and seasonal demand patterns to estimate potential earnings.
And importantly, it’s built on the same underlying data foundation that this comparison has already shown aligns closely with official statistics.
The Bigger Picture Beyond the Data
Eurostat’s experimental statistics represent an important milestone for Europe’s short-term rental industry: an official, government-backed benchmark for booking volumes and guest nights across the EU27, built directly from platform-reported data.
And the broader takeaway from this analysis is clear: AirDNA and Eurostat are telling the same market story.
At the reservation level, the alignment is remarkably close, with a 0.97 correlation across 31 countries and an average monthly deviation of just 7 index points. At the demand-night level, AirDNA captures roughly 38% more volume, but that gap is stable, explainable, and closely tied to broader coverage of longer stays and direct bookings outside Eurostat’s three-platform reporting scope.
As new EU short-term rental regulations roll out and data-sharing standards continue to improve, the alignment between public and private data sources will likely become even stronger over time.
For now, Eurostat provides the official benchmark. AirDNA builds on top of it, adding the speed, granularity, and real-time market visibility that operators, investors, and analysts need to move from understanding the market to actually acting on it.
FAQs
Why does AirDNA report more demand nights than Eurostat?
AirDNA captures a broader set of bookings, including longer stays and direct reservations that sit outside Eurostat’s three-platform reporting scope of Airbnb, Booking.com, and Expedia.
How closely do AirDNA and Eurostat data align?
Very closely. At the reservation level, the two data sets show a 0.97 correlation across 31 European countries, with nearly identical seasonal booking patterns.
Why is the demand-night gap larger during the off-season?
Longer stays and direct bookings make up a larger share of travel activity during quieter months, which increases the amount of additional demand AirDNA captures compared to Eurostat.
ARTICLE SUMMARY
This analysis compares AirDNA and Eurostat short-term rental data across Europe, revealing near-identical reservation trends, key differences in demand nights, and what broader market coverage means for operators and investors.
Camilo Schmid Rivas
Senior Research Analyst
Camilo Schmid Rivas is a Senior Research Analyst at AirDNA who brings a uniquely well-rounded perspective to short-term rental analytics. With a background that spans investment, real estate, and business analysis—including roles at Stayery and Sollers Consulting—Camilo has worn many analyst hats, each sharpening his ability to turn complex data into clear, actionable insights. A graduate of École hôtelière de Lausanne, he now channels his multidisciplinary expertise into uncovering trends that drive smarter STR decisions. In his free time, he enjoys playing tennis or scuba diving in or around Barcelona.
