

 Calculate Revenue
 Research Markets
 Find For Sale Properties
 Compare My Listing
 STR Revenue Calculator
 Custom Comp Sets
 Submarket Insights
 Custom Search Filters
 Rate Recommendations
 Performance Benchmarking
 Competitor Comparison
 Owner Contact Details
 Property-level performance data
 Tourism Insights
 Real Estate Investment Analytics
 About Us
 Sales
Sales Support
 Press
PressHow to Analyze a Short-Term Rental Before You Buy
Published: August 25, 2026
Last updated: August 31, 2026

Camilo Schmid Rivas
At a Glance
- A full evaluation answers six questions, not one. Each has a shortcut, and each shortcut is where investors go wrong.
- The real constraint is data, not time. Realized revenue and occupancy figures are not public.
- An annual revenue figure hides everything. This property swings from $10,000 in peak summer to under $1,000 in winter.
- The nearest listings are not the comparable ones. Rebuilding the comp set moved the projection from $65,800 to $56,400.
- A 48-day lead time sets when you price. A 3.5-night average stay sets your minimums.
- Verify regulation yourself. It changes fastest and carries the largest downside.
Before You Buy
Every short-term rental investment begins with a single question: will the property generate an acceptable return? That question is not singular. Does projected revenue justify the acquisition price? Is short-term rental permitted at the location? What do guests in the market value and pay for? How competitive is local supply? How do travelers in the area book?
Each of these has an intuitive shortcut. Average a few nearby listings, skim a handful of reviews, assume a popular market will perform. Each shortcut is where most evaluations go wrong, and a superficial pass introduces risk that is not visible until after the purchase.
The difficulty is not primarily one of effort. A credible evaluation requires two inputs most investors lack. The first is analytical expertise: the judgment to identify which metrics are material and to interpret them correctly. The second is data: realized, property-level performance figures that are not publicly available. An asking price is easy to obtain. The actual revenue and occupancy of a comparable rental are not.
The sections below take the questions in turn, using a single property as a worked example: 152 Raper Mountain Road, a five-bedroom home in Clarkesville, Georgia, in the North Georgia Mountains. Each contrasts the quick approach with the rigorous one, identifies where expertise and data become the binding constraint, and presents the corresponding output from AirDNA's Rentalizer Agent for the same property.
Property Features Only Matter Once You Read Them Against the Local Market
Every evaluation begins by establishing what the property is. This step appears trivial, since bedroom count, square footage, year built, and amenities are largely available from public listings. But an inventory of attributes is not an analysis. The analytical work lies in separating the characteristics that are material to short-term rental performance from those that are merely descriptive, then reading each feature for its likely effect on demand, rate, and guest profile.
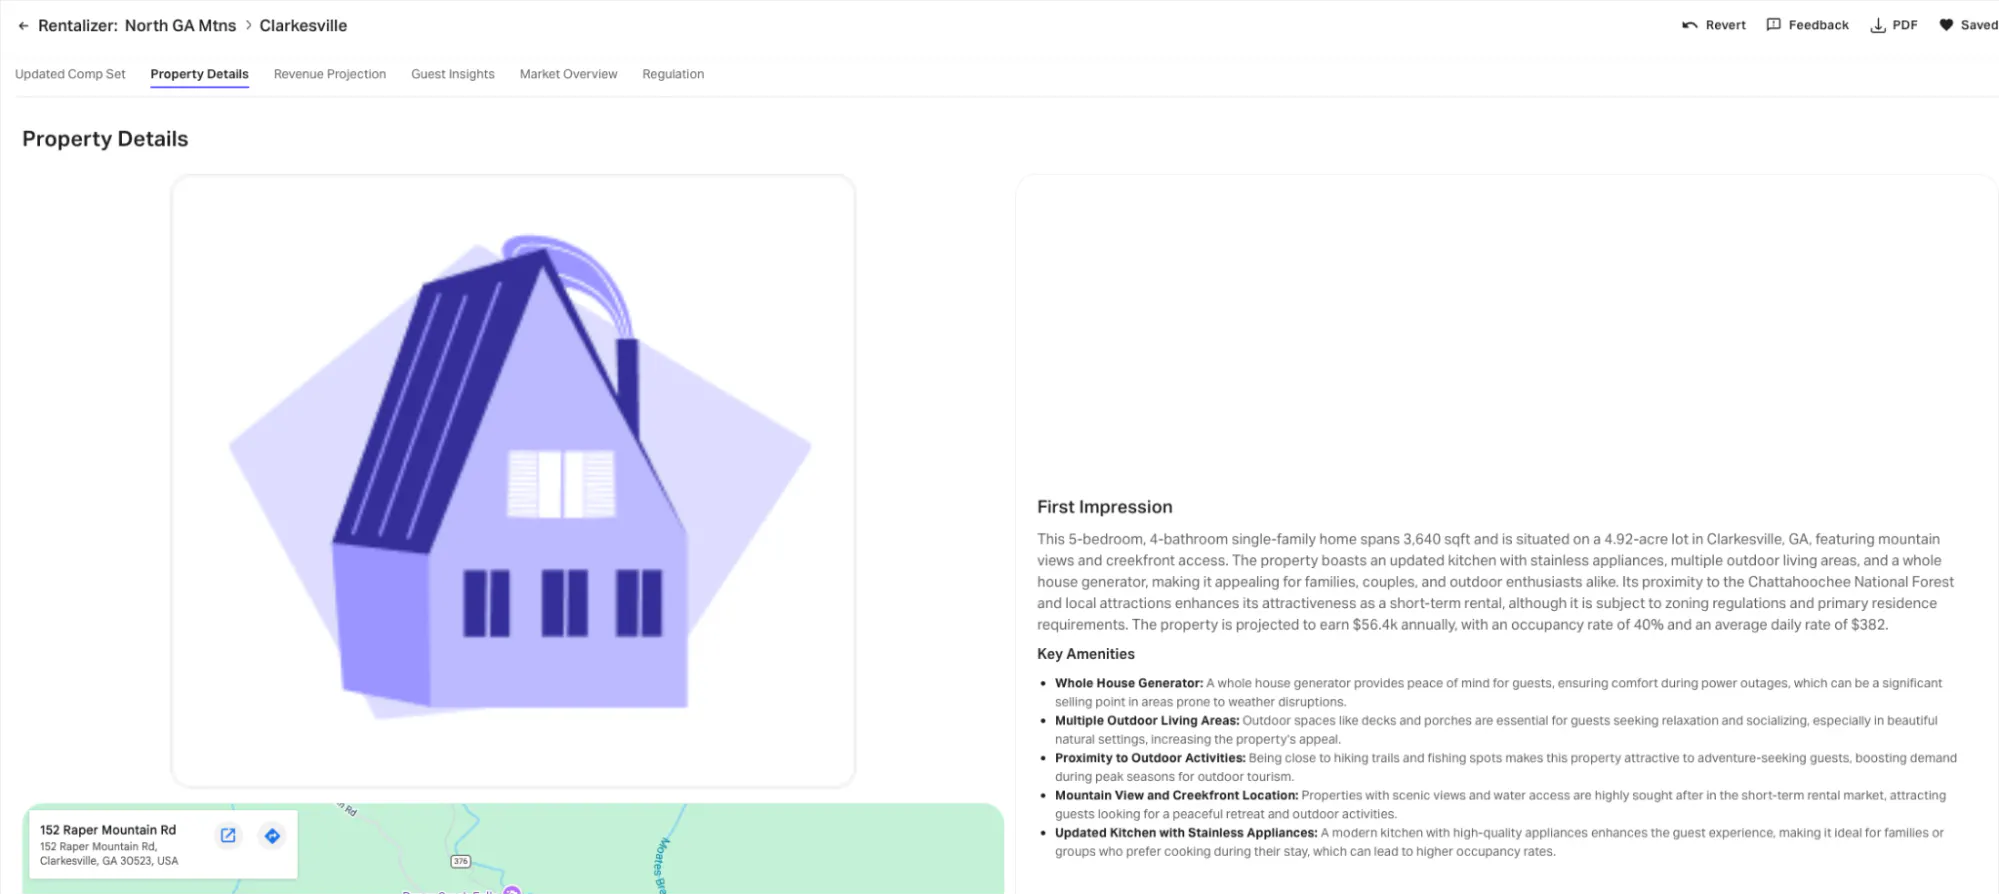
152 Raper Mountain Road is a five-bedroom, four-bath single-family home spanning 3,640 square feet on a 4.92-acre lot, with panoramic mountain views and direct creekfront access. Its current estimated value is around $725,000. On their own, these are neutral facts. Their relevance emerges only when read against what drives performance in this specific market. Scenic mountain views and water access tend to command a premium among guests seeking a natural retreat. Multiple outdoor living areas support the relaxed, social stays the setting attracts. A whole-house generator adds resilience that carries real weight in an area exposed to weather disruption. Proximity to the Chattahoochee National Forest, with its trails and fishing, raises occupancy potential during peak outdoor-recreation seasons.
The same features would carry different weight in a different market. Reading them correctly requires knowing which attributes local demand rewards.
Most of this property information is semi-public, making this the least gated part of the evaluation. That changes from revenue projection onward.
The Rentalizer Agent assembles a property profile from public and commercial data sources, then produces an interpreted summary rather than a raw attribute list. For the sample property, it identifies the mountain views and creekfront location, the multiple outdoor living areas, the whole-house generator, the updated kitchen, and proximity to outdoor recreation as the material features, and reads each for its effect on guest appeal and rate potential. That interpretive layer is what distinguishes analysis from description.
A Single Annual Revenue Figure Hides the Cash Flow That Matters
Revenue is the figure most investors want first, and the one most easily estimated incorrectly. The intuitive approach, taking a few nearby rentals and extrapolating an annual figure from their nightly rates, fails on two counts. It assumes the nearest listings are the comparable ones, which they often are not. And it treats revenue as a single annual number, when the distribution across the year is what determines whether a property produces usable cash flow. The first problem is the subject of the next section. The second is a matter of modeling.
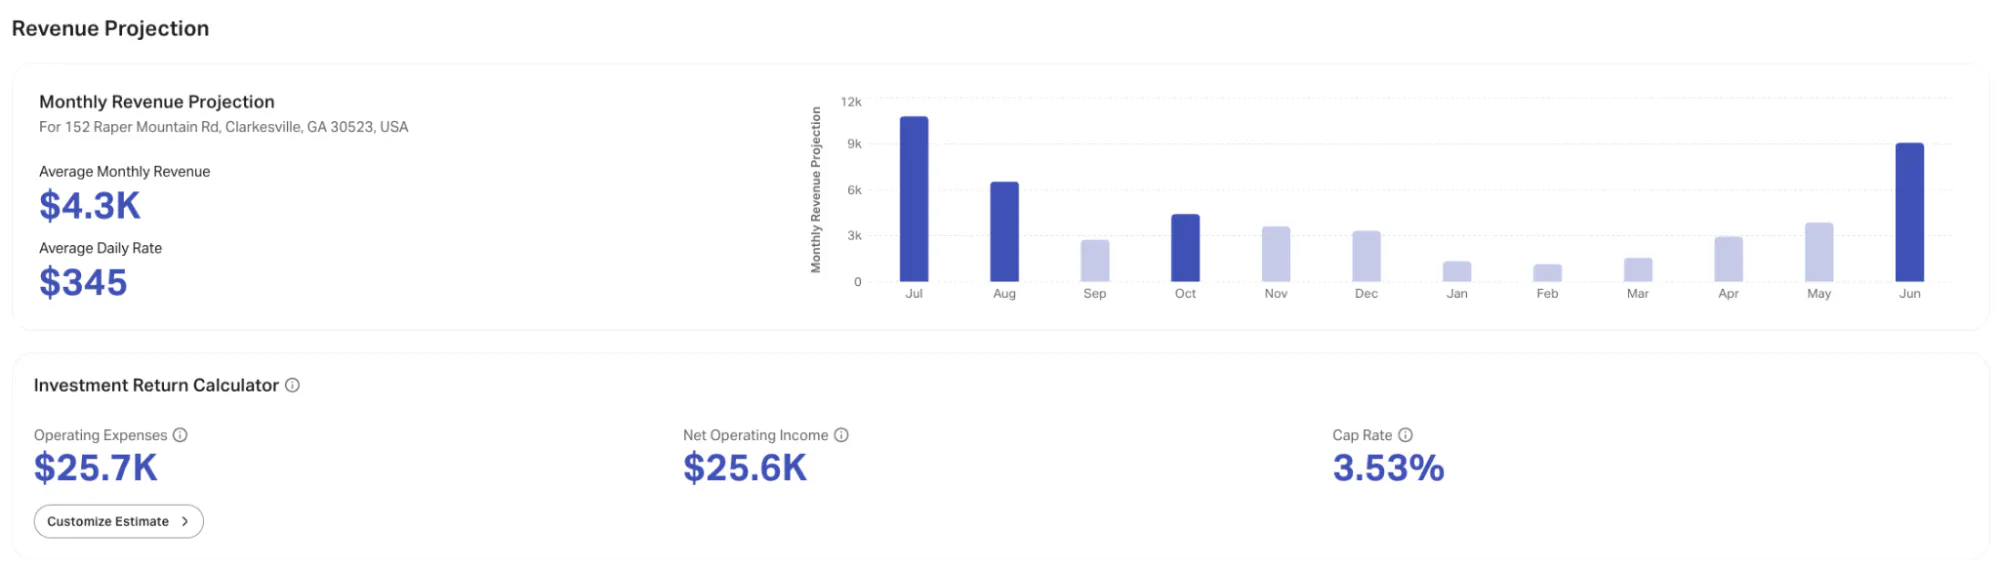
Seasonality is where a single figure most misleads. In a market this cyclical, projected monthly revenue for the sample property ranges from around $10,000 at the summer peak to under $1,000 in the slowest winter months, with a broad shoulder of $4,000 to $5,000 in the early autumn. A property that earns most of its revenue in a few peak months carries a very different risk profile than one with even demand, so an investor who models a flat monthly figure will misjudge both cash flow and financing requirements. A credible estimate has to be built month by month.
Modeling revenue at either level depends on realized revenue and occupancy figures for the comparable set, and that information is not publicly available. Without it, even a well-reasoned estimate rests on assumption rather than evidence.
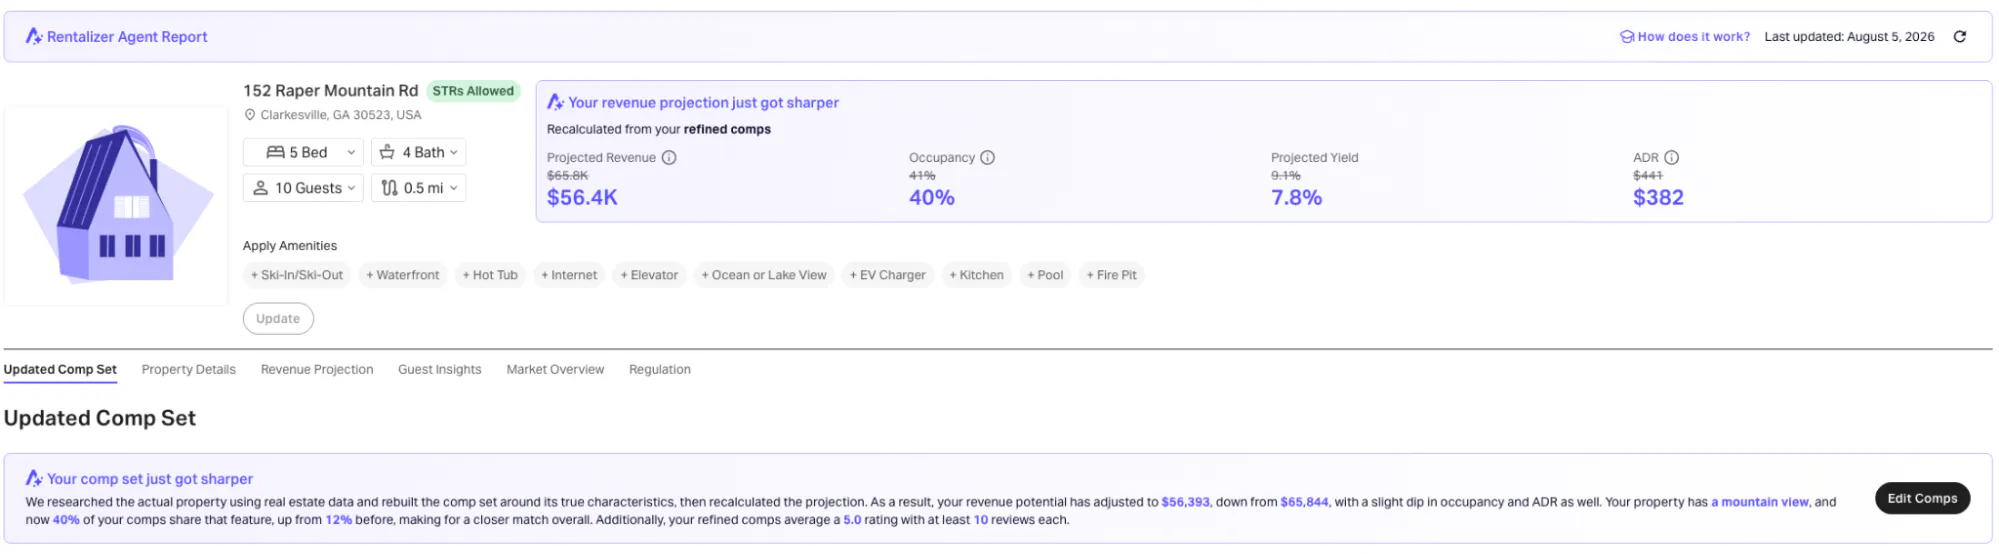
For the sample property, the Rentalizer Agent projects annual revenue of around $56,400, at 40% occupancy and an average daily rate (ADR) of $382, derived from its adjusted comparable set and modeled across the full seasonal cycle.
Run the Numbers Before You Buy
Don't guess what a property could earn. Rentalizer projects revenue for any address in the world, free.
The Nearest Listings Are Rarely the Comparable Ones
The comparable set is the foundation of every revenue estimate, and constructing it well is an analytical task rather than a search. The intuitive method, selecting the properties nearest to the subject, conflates proximity with relevance. Two listings can sit a short distance apart and still represent entirely different products, with different guest capacities, amenity sets, and quality tiers, each driving materially different performance. A defensible comparable set is assembled on structural and feature-level similarity and on actual performance, not on distance.
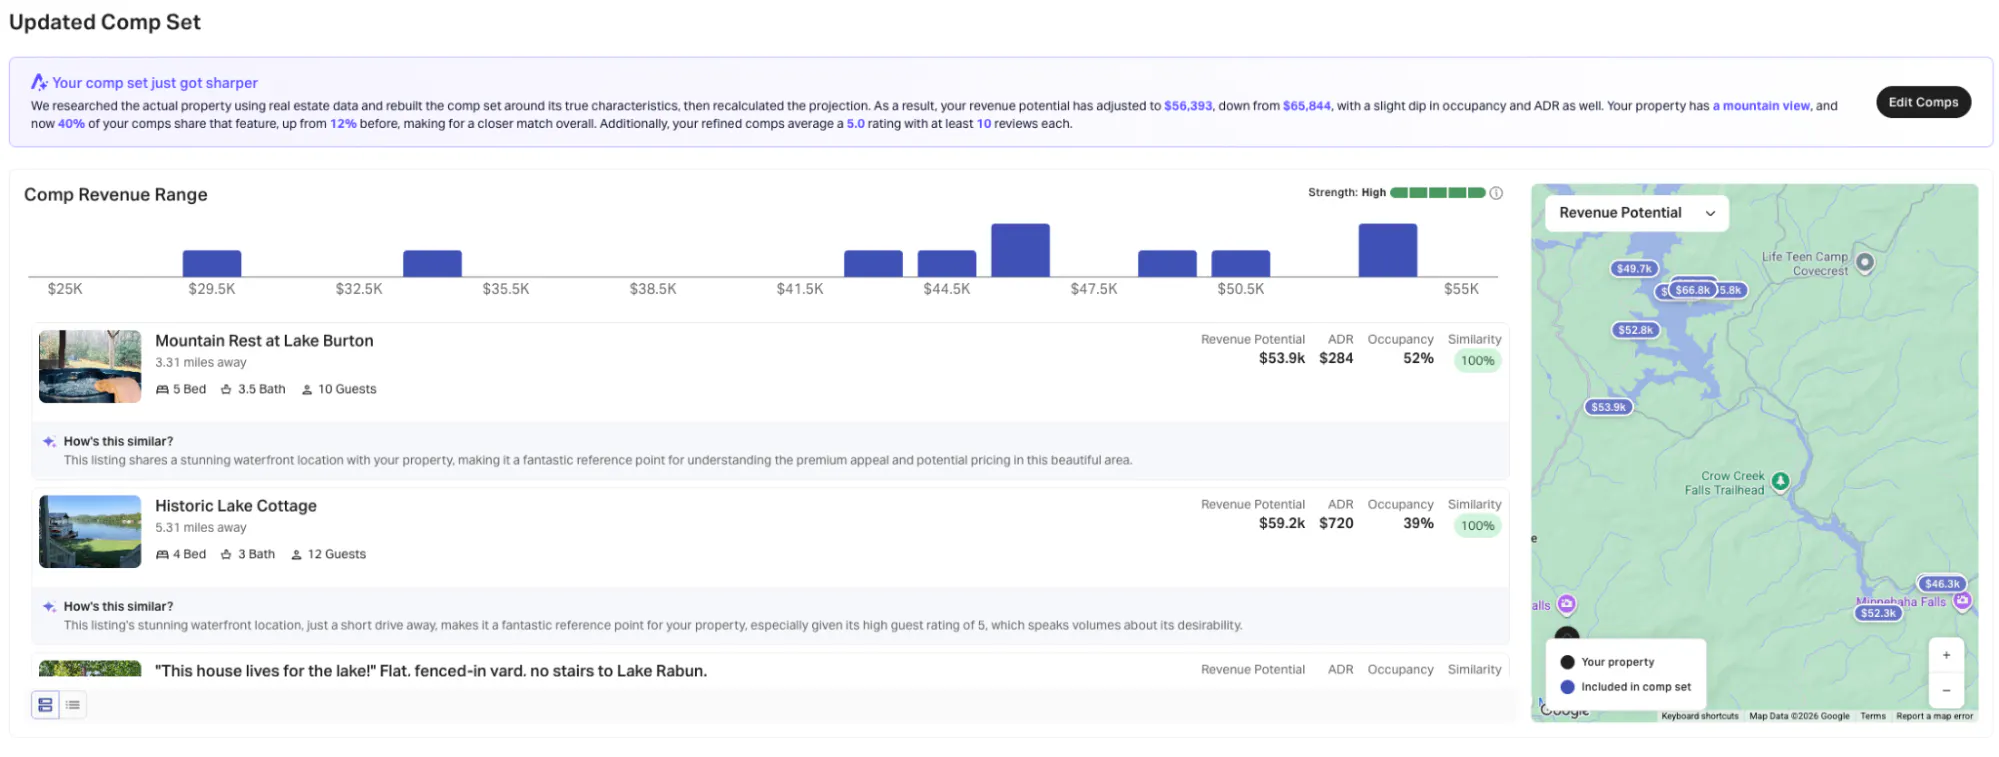
For the sample property, revenue potential across the comparables spans roughly $29,500 to $55,000, even among properties of broadly similar size. Interpreting that range means deciding which properties genuinely resemble the subject, how much weight to assign each, and how to treat the outliers. Those judgments cannot be made from a map, and they depend on realized, listing-level performance figures that are not publicly accessible.
This property has an advantage that sharpens the analysis: it already operates as a short-term rental. The agent can therefore rebuild the comparable set around the property's observed characteristics rather than assumptions, and recalculate the projection accordingly. Doing so moved the revenue potential to around $56,400, down from an earlier estimate of $65,800, after identifying that the property has a mountain view, a feature shared by 40% of its revised comparables against 12% in the original set. The refined comps also average a 5.0 guest rating with at least ten reviews each, a higher-quality reference group than the starting point.
Two features of the output make this transparent. The first is a similarity score, quantifying how closely each comparable matches the subject across its full feature profile rather than on bedroom and bathroom counts alone. In the sample property's set, the closest matches score 100%: a five-bedroom, 3.5-bath home 3.3 miles away, and a four-bedroom home five miles away with a different bathroom count. That shows the score weighing shared characteristics such as a waterfront or mountain setting and guest quality, rather than treating room counts as decisive.
The second is a written explanation accompanying each comparable, stating why it was included. For the top comp, the agent points to the shared waterfront location as the reference point for premium pricing in the area. Together the two features convert comp selection from an opaque judgment into an inspectable one, and the agent rates the resulting set as high in strength.
Guest Reviews Reveal Patterns No Casual Read Will Catch
Guest reviews are among the richest signals available for evaluating a property's prospects, and among the hardest to use well. Reading a handful of reviews for comparable listings and forming a general impression captures little of their value and is easily skewed by whichever reviews happen to be read. Extracting a reliable signal requires coding the text across the full set of relevant comparables: identifying recurring themes, separating consistent praise from isolated complaints, inferring the guest segments a property attracts, and translating all of it into positioning and amenity decisions. That is qualitative analysis at a scale, and with a consistency, that manual reading rarely achieves.
Synthesizing reviews across the ten comparable properties, the agent identifies what guests in the area consistently value: cozy, welcoming spaces, spacious layouts suited to families and groups, well-equipped kitchens, attractive outdoor areas, and responsive hosts. It also surfaces recurring complaints a small sample would miss: difficulty finding properties at night because of unclear directions, and disappointment when a listing's advertised views do not match reality. Each points to a concrete fix, namely clearer arrival guidance and more accurate descriptions of views and surroundings.

The agent then derives amenity guidance from what comparable listings offer and what their guests reward. For the sample property, it notes that a hot tub appears in 40% of nearby listings, a dedicated workspace in 20%, outdoor furniture in 80%, and a fire pit in 70%, framing each as an opportunity to align the property more closely with local demand. The analytical work lies not in reading any single review but in converting many of them into a coherent picture of who books, what they value, and where the property can improve.
Knowing Who Books Determines How You Should List
Identifying who a property attracts is the step that connects analysis to strategy. Performance data and review themes are only useful once they resolve into a clear picture of the target guest and a positioning that speaks to them. That requires reading across the property's features, the amenities of comparable listings, and what guests in those listings reward, then inferring the segments most likely to book. It is a judgment that draws on every preceding section rather than any single data point.
For the sample property, the agent identifies four primary guest segments. Families and family gatherings are drawn by spacious layouts and well-equipped kitchens. Friends and group getaways are supported by cozy, inviting spaces suited to group bonding. Relaxation and comfort seekers are served by the property's outdoor areas. Outdoor and adventure travelers are drawn by the tranquil setting near lakes and mountains. Each segment is tied to specific attributes rather than assigned generically, which is what makes the profile actionable.

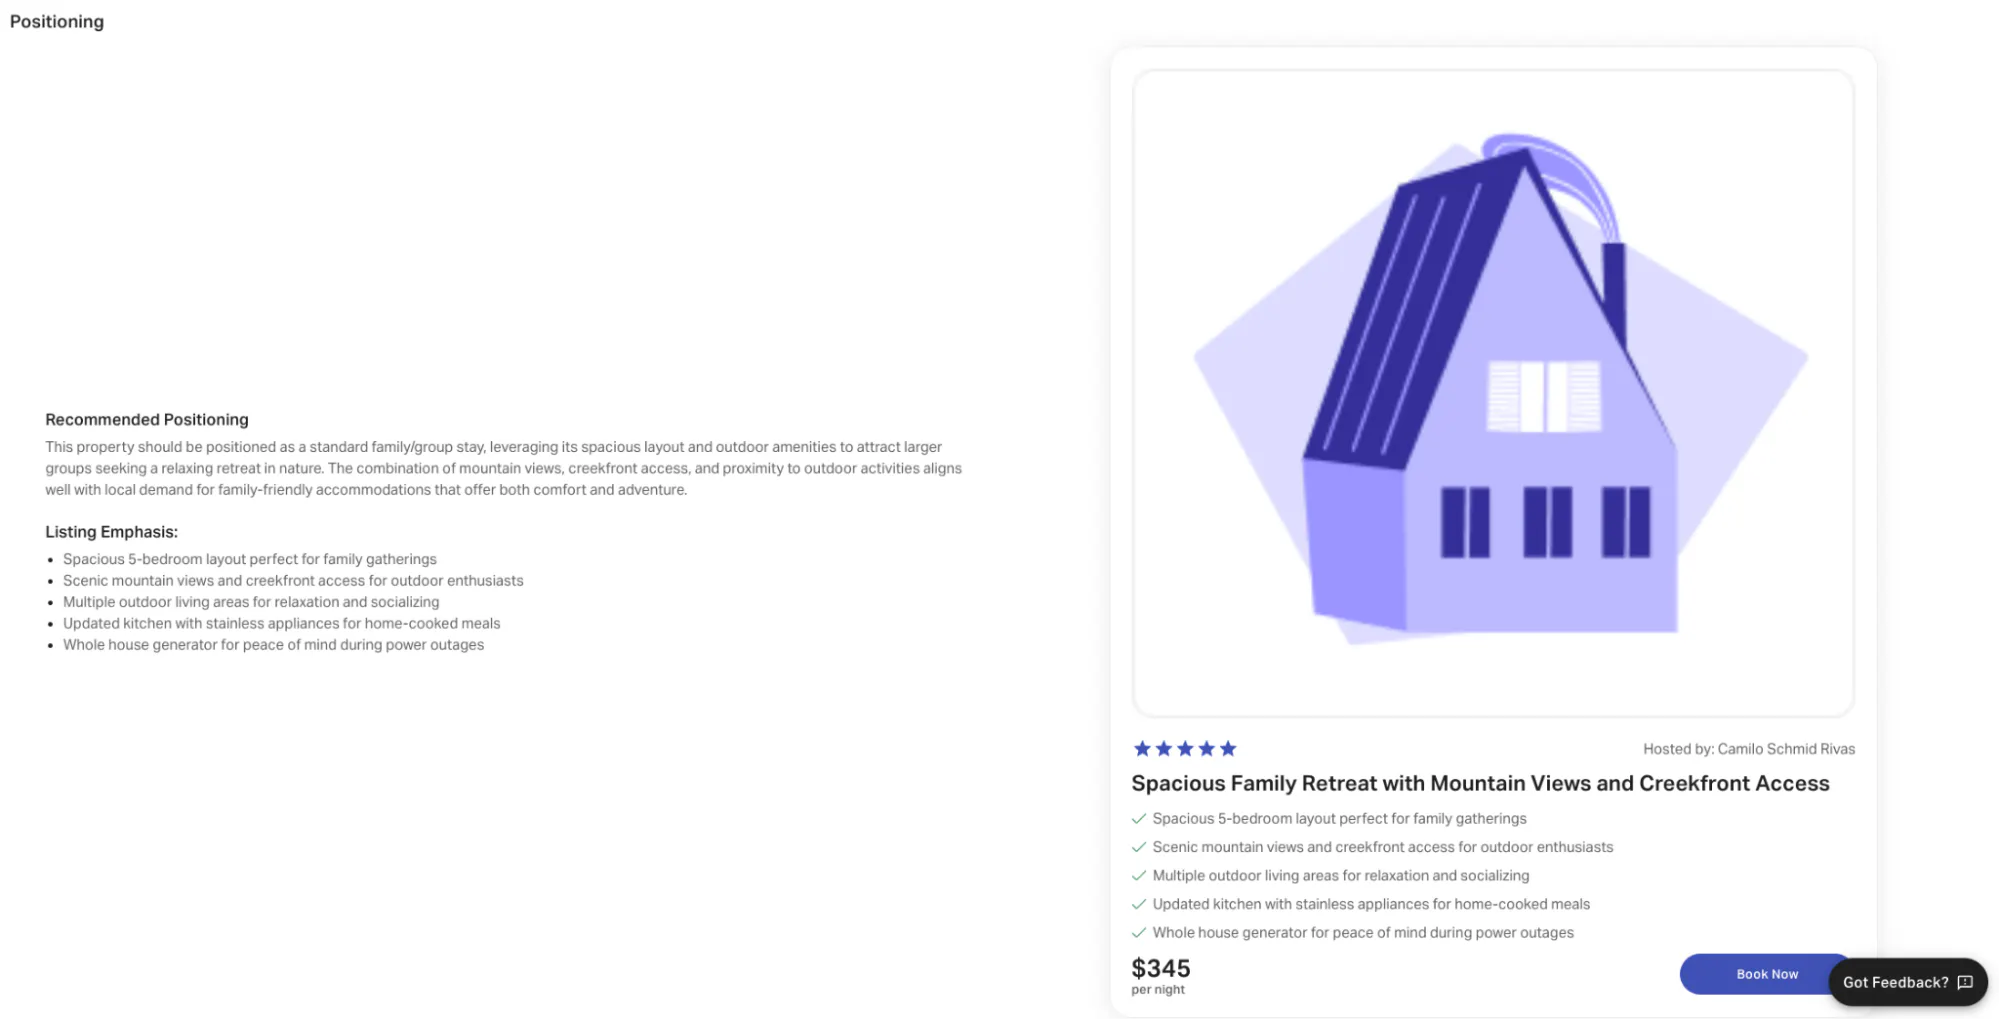
From that profile the agent derives a recommended positioning: a family and group retreat that uses its spacious layout and outdoor amenities to attract larger groups seeking a relaxing stay in nature, a stance supported by the performance of comparable listings emphasizing similar features. It then translates that into concrete listing emphasis, foregrounding the five-bedroom layout, the mountain views and creekfront access, the multiple outdoor living areas, the updated kitchen, and the whole-house generator. The contribution here is not describing the property but determining how to present it to the market most likely to book it.
Do All Your Research With One Click
A $500K decision deserves more than a revenue estimate. Get property, comp, guest, and regulation research in one report.
A Popular Destination Is Not the Same as a Viable Market
Assessing a market is where surface familiarity most often substitutes for analysis. Knowing that a location is a popular destination says little about whether it will support a specific short-term rental. The analytical work lies in identifying which demand drivers move rental performance, understanding how events shape demand, quantifying how concentrated that demand is across the year, and reading the competitive structure of local supply. The report organizes this into four views.
Demand Drivers Determine Which Seasons a Property Can Serve
For the sample property, the agent isolates the specific drivers, among them Lake Burton, the Chattahoochee National Forest, and Tallulah Gorge State Park, and characterizes the demand each produces and when. The distinction matters. A lake that draws families and boaters from May through September behaves very differently from a gorge or national forest that fills the market during fall foliage, and a property's fit depends on which seasons its market's drivers serve.

Events Turn "Things Happen Here" Into Dated Demand Spikes
Specific events create demand spikes whose value depends on timing and magnitude. The agent compiles the market's notable events with their dates and an impact rating, distinguishing those likely to move rental demand from those that will not. That converts a vague sense that things happen locally into a dated, weighted view of when incremental demand should arrive.

Seasonality Is Decisive in a Market This Cyclical
The agent reports that 55% of the property's projected annual revenue is earned in its peak months, and assigns a seasonality score of 77 out of 100. A market earning most of its revenue in a handful of months carries very different financing and operating implications than one with even demand, so an investor who ignores that concentration will misjudge both the risk profile and the cash-flow pattern.

Competitiveness and Booking Behavior Are the Least Public Signals of All
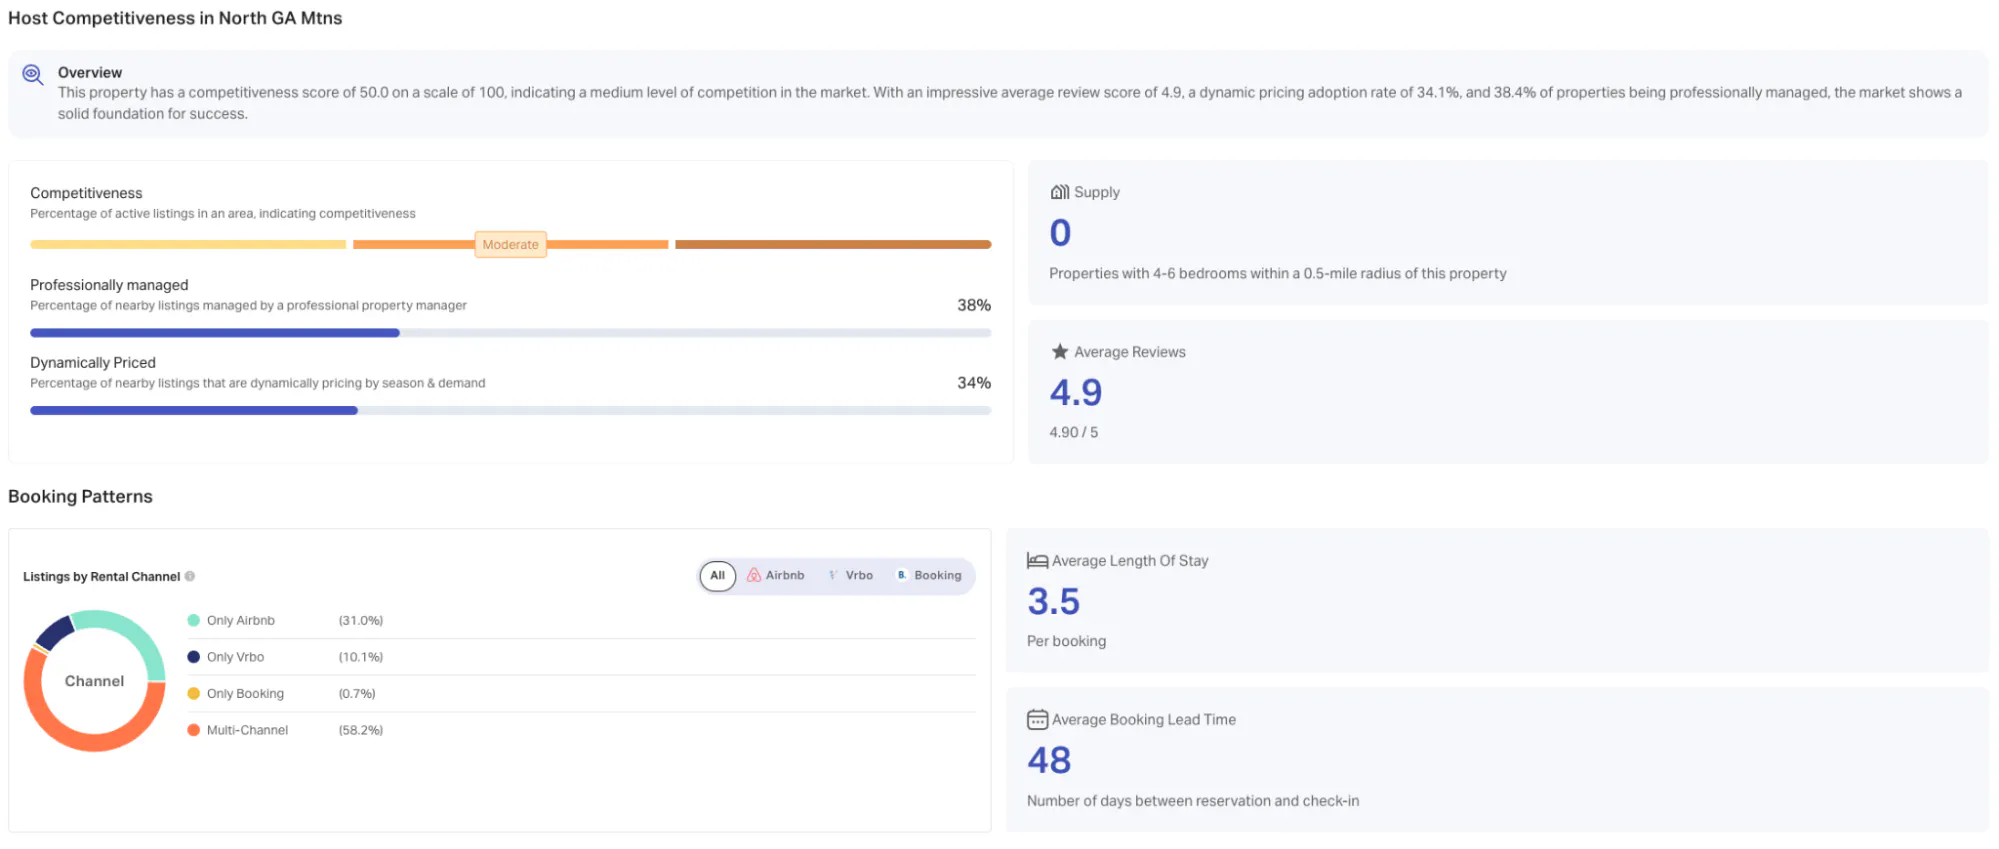
This is where the data barrier is most acute. The agent reports a competitiveness score of 50 out of 100, an average review score of 4.9 across local listings, professional-management penetration of around 38%, and a dynamic-pricing adoption rate of around 34%, alongside zero comparable four-to-six-bedroom properties within a half-mile radius.
Each carries interpretive weight that is not evident on its face. A moderate professional-management share points to a mixed field of amateur and sophisticated competition. A low dynamic-pricing adoption rate can indicate room to gain an edge through more responsive pricing. And the absence of nearby four-to-six-bedroom properties suggests a niche the prospective listing could target.
Booking patterns complete the picture: an average length of stay of 3.5 nights, an average lead time of 48 days, and a platform mix of roughly 31% one platform only, 10% Vrbo only, under 1% Booking.com only, and 58% listed across more than one channel. Each has an operational consequence. The lead time governs when pricing decisions must be made, the length of stay informs minimum-night rules, and the platform mix shows that multi-channel distribution is the local norm. None of them are available without access to realized booking data.
Taken together, the market view demonstrates the pattern running through the entire evaluation. The raw facts of a market are widely available. The figures that determine an investment decision are not.
Regulation Is the One Input You Should Always Verify Yourself
Regulation is one of the most consequential inputs in a property evaluation, and one of the most difficult to pin down. A revenue projection that is slightly off costs money. A property that turns out to be ineligible for short-term rental can undermine the entire investment. Assessing it means researching the governing jurisdiction, determining whether short-term rental is permitted and under what conditions, identifying permit requirements and any caps, and confirming whether homeowners' association or condominium rules impose further restrictions. Much of this is public in principle, but it is fragmented across municipal codes, planning-department pages, and association documents, and it requires interpretation to apply correctly to a specific property.
For the sample property, the agent summarizes the key regulatory facts. Short-term rentals are allowed with conditions. A permit is required. Primary residence status is required. The parcel sits in a low-intensity zoning district. The jurisdiction defines a short-term rental as a stay of 30 nights or fewer. Penalties for non-compliance are specified at $500. No permit cap or moratorium is on file, and no homeowners' association fee is on file. The agent also names the administering office, Habersham County Planning and Zoning, and flags where its own findings remain unverified, giving an investor a structured starting point rather than a blank search.
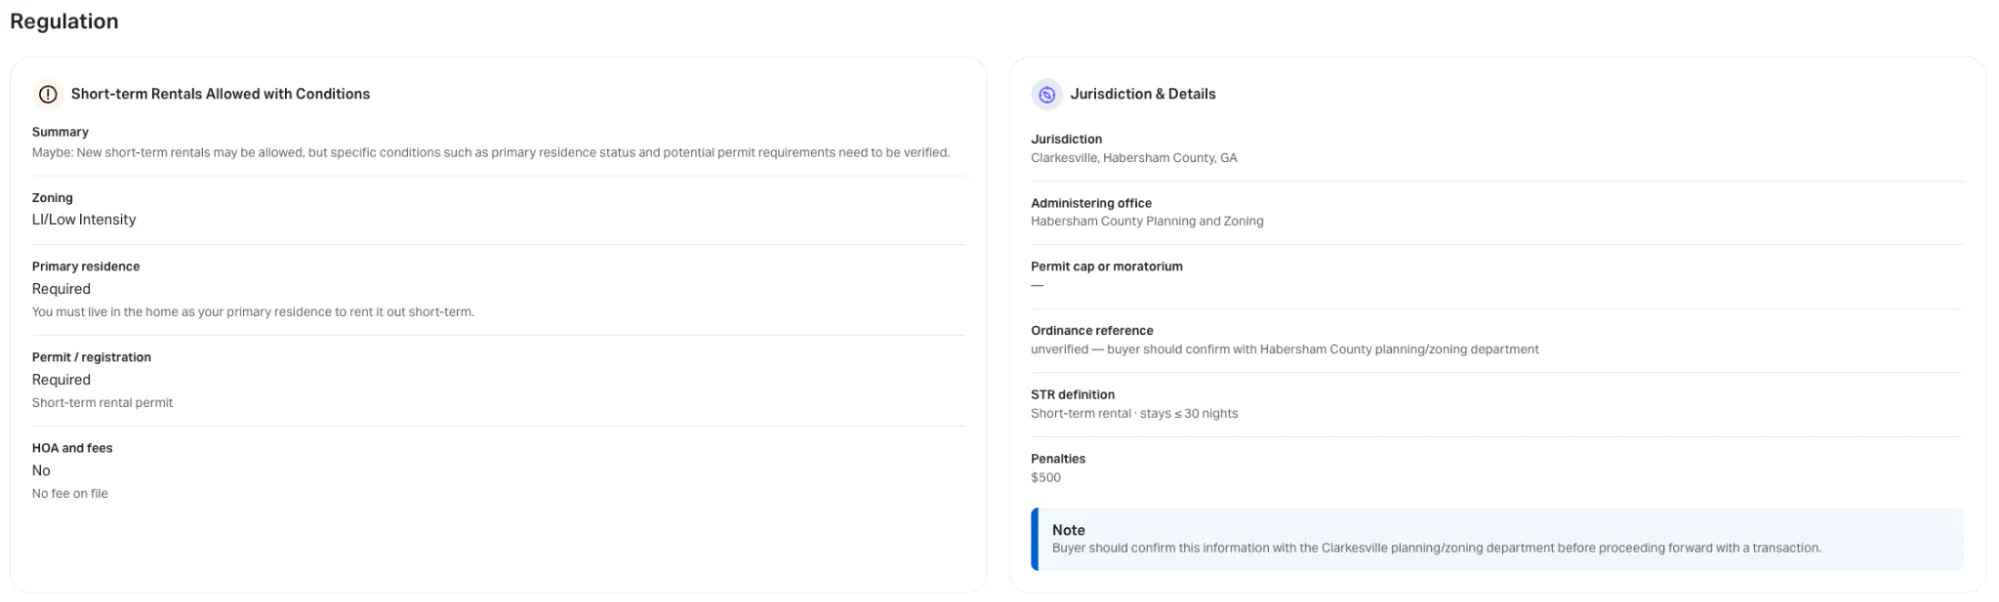
This is also where the limits of automated research, and the appropriate division of labor, are clearest. The report flags that its ordinance reference is unverified and advises confirming the details directly with the local planning department. It carries an explicit disclaimer that the regulatory information is generated using third-party data and artificial intelligence, may not be complete or current, and should not be relied upon as legal advice. That candor is the right posture, because regulation is the input most likely to change between when a report is generated and when a purchase closes. Treat the summary as a starting point that surfaces the right questions quickly, then verify the answers with the relevant authority before committing. Of everything in an evaluation, this is the piece an investor should always own.
Know What You're Buying, Not What It Might Earn
Rentalizer Agent goes past the revenue estimate: property condition, guest sentiment from hundreds of reviews, regulations, and a comp set that matches.
Takeaways: Expertise and Data Are the Real Barriers
Working through a single property this way makes the point clear. Evaluating a short-term rental well is not a matter of effort but of two things most investors lack. The first is analytical expertise: the judgment to construct a defensible comparable set, to model seasonal revenue rather than an annual average, to read a competitiveness score for what it signals, and to translate guest reviews into a positioning strategy. The second is data: the realized, property-level figures on revenue, occupancy, competitiveness, and booking behavior that no public source provides. An investor can supply time and diligence, but neither closes these gaps.
This is the gap the Rentalizer Agent is built to close. It applies a consistent method across comparable selection, revenue projection, guest analysis, positioning, market assessment, and regulation, drawing on performance data individual investors cannot readily assemble. What would take an analyst hours of fragmented research, it delivers as a single structured report.
One qualification remains, and it is a matter of sound practice rather than a limitation of the analysis. The inputs that change fastest, regulation above all, should be confirmed with the relevant local authority before any commitment. Let the agent do the modeling, the comparison, and the synthesis, and reserve your own effort for verifying the time-sensitive facts no data source can guarantee are current.
Evaluating a property properly has always demanded expertise and access most investors do not have. The value of the Rentalizer Agent is in making that standard of analysis attainable in minutes rather than days. To see what it produces for a specific property, enter an address in Rentalizer and generate a report.
How Much Could Your Property Earn?
Enter any address and the Rentalizer Agent analyzes the comps, revenue potential, guest reviews, and regulations for you.
Frequently Asked Questions
How do you analyze a short-term rental property?
A complete short-term rental analysis answers six separate questions: whether projected revenue justifies the price, whether short-term rental is permitted at the location, what guests in the market value, how the property compares with genuinely similar listings, how competitive local supply is, and how travelers in the area book. Each requires realized performance data rather than public listing information, and each requires interpretation against the specific local market rather than general rules.
Why is averaging nearby listings a bad way to estimate revenue?
It makes two errors at once. Proximity does not imply comparability, since two listings a short distance apart can differ in guest capacity, amenities, and quality tier, each driving materially different performance. And a single annual figure hides the seasonal distribution that determines cash flow. For the sample property, projected monthly revenue ranges from around $10,000 at the summer peak to under $1,000 in the slowest winter months.
What makes a comparable set defensible?
Structural and feature-level similarity plus actual performance, not distance. The Rentalizer Agent assigns each comparable a similarity score across the subject's full feature profile and a written explanation of why it was included. Rebuilding the sample property's comp set around its observed features, including its mountain view, moved the revenue projection from $65,800 to around $56,400.
How much does seasonality matter to a short-term rental investment?
Enough to change the financing profile. The sample property's market earns 55% of projected annual revenue in its peak months and scores 77 out of 100 on seasonality. A property with concentrated earnings carries different risk and cash-flow requirements than one with even demand, so a flat monthly model will misjudge both.
What booking data should an investor look at before buying?
Average length of stay, average lead time, and platform mix, because each has an operational consequence. In the sample property's market, the average length of stay is 3.5 nights, which informs minimum-night rules, and the average lead time is 48 days, which governs when pricing decisions must be made. Roughly 58% of local listings appear on more than one channel, indicating that multi-channel distribution is the norm there.
Can an automated report tell you whether short-term rental is legal at an address?
It can organize the question but should not settle it. The Rentalizer Agent summarizes the governing jurisdiction, permit requirements, zoning, the local definition of a short-term rental, penalties, and any caps, and it flags its own unverified findings. Regulation is the input most likely to change between when a report is generated and when a purchase closes, so confirm the details with the local planning department before committing.
ARTICLE SUMMARY
A short-term rental analysis is not a matter of effort. It requires two things most investors lack: the analytical judgment to know which metrics are material, and realized, property-level performance data that is not publicly available. This walkthrough takes a single property in Clarkesville, Georgia section by section, contrasting the shortcut most investors take with the rigorous analysis an accurate answer requires.
Camilo Schmid Rivas
Senior Research Analyst
Camilo Schmid Rivas is a Senior Research Analyst at AirDNA who brings a uniquely well-rounded perspective to short-term rental analytics. With a background that spans investment, real estate, and business analysis—including roles at Stayery and Sollers Consulting—Camilo has worn many analyst hats, each sharpening his ability to turn complex data into clear, actionable insights. A graduate of École hôtelière de Lausanne, he now channels his multidisciplinary expertise into uncovering trends that drive smarter STR decisions. In his free time, he enjoys playing tennis or scuba diving in or around Barcelona.
