

 Calculate Revenue
 Research Markets
 Find For Sale Properties
 Compare My Listing
 STR Revenue Calculator
 Custom Comp Sets
 Submarket Insights
 Custom Search Filters
 Rate Recommendations
 Performance Benchmarking
 Competitor Comparison
 Owner Contact Details
 Property-level performance data
 Tourism Insights
 Real Estate Investment Analytics
 About Us
 Sales
Sales Support
 Press
PressHow to Measure Airbnb Demand in My Area
Published: January 21, 2025
Last updated: June 16, 2025

Dillon DuBois
Key Takeaways
- Determining demand requires looking beyond surface-level metrics to analyze both historical patterns and future booking trends.
- Annual occupancy averages alone don’t determine a market's true potential.
- Airbnb profitability is also dependent on metrics like ADR, RevPAR, and seasonal rate variations.
You’ve spotted it—a property that seems like a dream short-term rental (STR) investment. The price is right, the location looks promising, and you can already envision the 5-star reviews rolling in. There's one nagging question, though, that’s keeping you up at night: “Will anyone actually book it?”
That charming cottage or sleek city apartment might look like a guaranteed winner, but Airbnb demand isn't always as straightforward as it seems. Some of the most picturesque properties struggle with bookings, while seemingly ordinary listings in the right location become booking magnets.
How do you steer clear of an investment flop? Data.
Think of Airbnb demand data as your investment crystal ball. Instead of relying on gut feelings, use hard data to forecast a property's potential success. This guide shows you exactly how to measure and interpret Airbnb rental occupancy in your target market.
The Basics of Airbnb Demand
In the short-term rental industry, demand refers to how many travelers are actively searching for and booking accommodations in a specific area. Occupancy rates capture demand as the percentage of time a property is booked relative to the time it is available for bookings.
Here's the catch, though: location popularity doesn't always translate to STR demand. That Instagram-worthy house on the most popular beach in the state might be drowning in bookings during summer, commanding premium rates and back-to-back guests. What about those quiet winter months? A less flashy property in a steady market with 70% year-round occupancy could actually put more money in your pocket than a seasonal hotspot that has 90% occupancy for only three months.
You also can’t overlook how supply impacts demand. You might assume a lakefront property in a tourist hotspot would make a killing on Airbnb. What if there are 10 other rentals within a 1-mile radius?
Without checking how many other short-term rentals are nearby and their occupancy levels, you’ll never get an accurate read on demand for that property.
Common STR demand challenges for beginners
Here are the most common challenges new hosts face—and why they don't have to stop you from making smart investment decisions:
1. Data overload without context
You might find yourself staring at occupancy rates, Average Daily Rates (ADR), and Revenue per Available Rental (RevPAR) numbers, wondering what actually matters. Is 65% occupancy good or bad? Should you care more about weekend rates or weekday bookings? Without context, these numbers are just that—numbers. The key is understanding how these metrics work together to paint a picture of real demand.
2. The seasonality trap
Many new investors fall into this one: they visit a destination during peak season, see "No Vacancy" signs everywhere, and assume the market is hot year-round. The truth is that vacation rental occupancy rates can swing dramatically with the seasons. That ski resort town that's booked solid in February might be a ghost town in July. You need to understand these patterns—and plan for them—to enjoy sustainable success.
3. Confusing popularity with profitability
Just because an area is popular with tourists doesn't automatically make it a profitable short-term rental market. Some of the most visited destinations are actually oversaturated with rentals, driving down both occupancy and nightly rates. This is why looking at Airbnb supply and demand together is so crucial.
4. Relying on outdated information
The short-term rental market evolves quickly. Last year's hot neighborhood might be cooling off, while emerging areas could offer unexplored opportunities. Markets that were once underserved can become saturated in a matter of months, and vice versa.
How to overcome common challenges
Here's the good news: tools like AirDNA have transformed these challenges into opportunities. Instead of guessing about demand or relying on random advice, you can access real-time data about:
- Actual booking patterns in your target market
- Future demand trends
- Seasonal fluctuations
- Competitive analysis
- Revenue potential based on real market data
Think of AirDNA as your local market expert on speed dial—someone who knows exactly how the market performs year-round and can help you avoid common pitfalls before they become expensive lessons.
Research Airbnb Markets
Gain insights into the demand and occupancy trends in your market.
What Drives Airbnb Demand in My Area?
Ever wonder why some Airbnb high-demand areas seem to print money while others struggle to get bookings? The secret lies in understanding the unique cocktail of factors that drive demand in each market. Just like real estate's famous mantra of "location, location, location," short-term rental success depends on "timing, tourism, and trends.”
Local factors influence demand
The backbone of Airbnb demand is being in the right place at the right time. Two key factors contribute to creating areas with high demand for Airbnb:
- Tourism magnets: Natural attractions like beaches, national parks, and mountain ranges create consistent demand throughout their peak seasons. Popular cities with year-round attractions tend to see more stable booking patterns.
- Business districts: Corporate hubs can be gold mines for short-term rentals, especially if you're near convention centers or major company headquarters. These areas tend to maintain steady demand during weekdays and see less seasonal fluctuation.
Seasonal trends and events
Understanding seasonal patterns helps you predict and maximize your property's performance. While some hosts rely on gut feelings or general market knowledge, AirDNA's Market Overview dashboard gives you a precise, data-driven view of both historical patterns and future demand trends.
Let's look at two contrasting markets that illustrate how events and seasons shape demand:
Park City, Utah
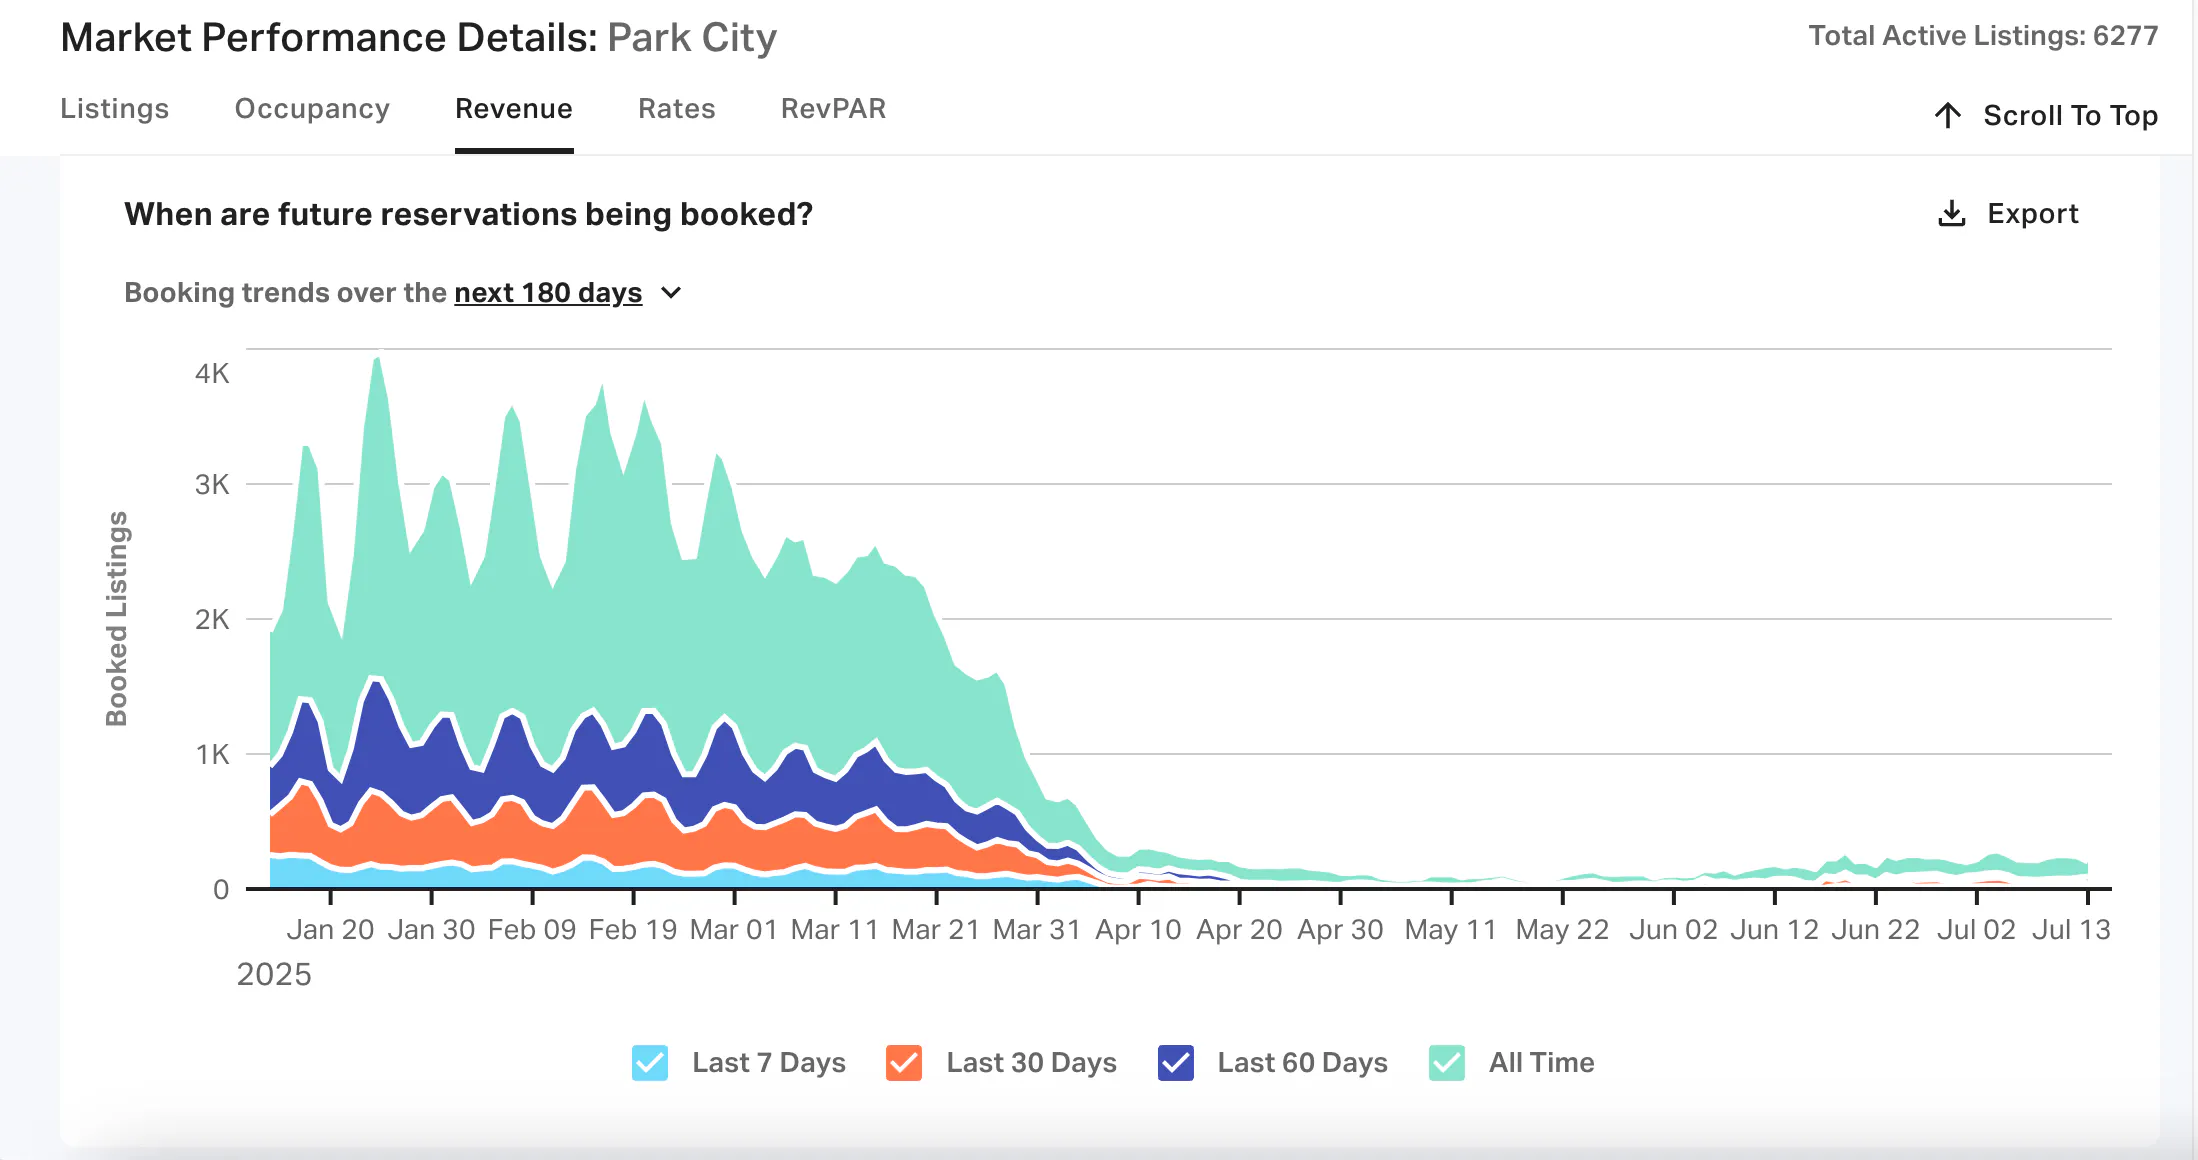
Park City, Utah is a prime example of a seasonal market. Using AirDNA, we can view when future reservations are being booked in Park City. Looking 180 days ahead from the time of publication (January 2025), we see a surge of reservations from January through March—prime ski season—with a dramatic drop-off after March.
A note on future booking trends: The majority of occupancy data provided in the Market Overview page for a given location looks at historical trends. The graph titled ‘When are future reservations being booked’ offers unique insight into future booking trends, but it needs to be understood in context.
The colors on the graph differentiate reservations based on how recently they were made. Reservations made in the last 7 days are in light blue, for instance. This graph is constantly in flux, as the last 7, 30, or 60-day period is based on the date that you’re looking at the data.
While the graph below shows very few reservations for dates in April at this time, that doesn’t mean that reservations for those dates won’t increase as spring approaches. The lack of reservations for spring and summer simply shows that reservations for this time period have a shorter booking lead time—that is, guests are securing Airbnbs closer to the date of their stay.
In contrast, many visitors booked their ski vacations far in advance. The light turquoise captures all-time reservations—any bookings that were made outside of the last 60 days. For February 19th, for instance, reservations made over the last 60 days account for approximately 1,200 of bookings for that night. However, the all-time reservations are closer to 3,500, meaning that the majority of bookings were made more than 60 days in advance.
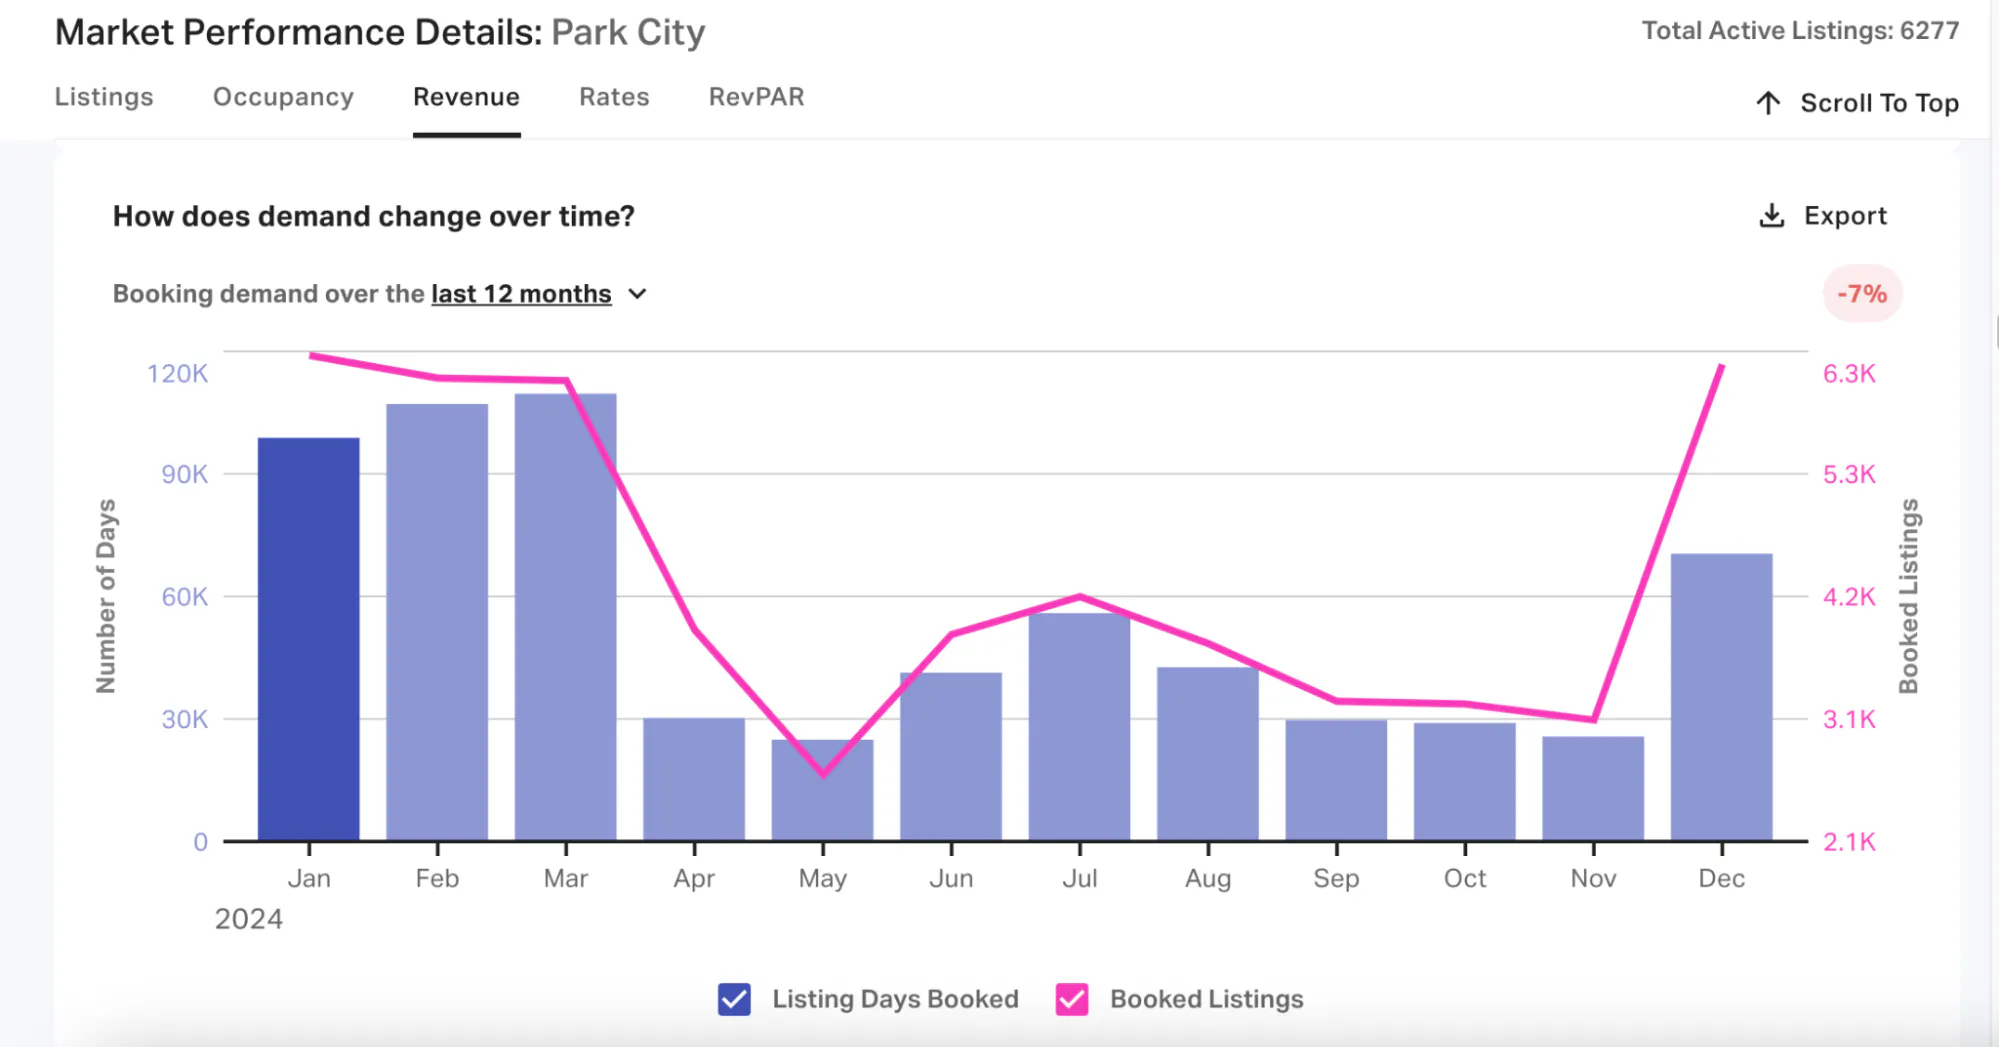
The 12-month ‘demand changes over time’ chart in the AirDNA dashboard confirms that STR demand in Park City doubles—or even triples—between January and March compared to other months.
Indio, California
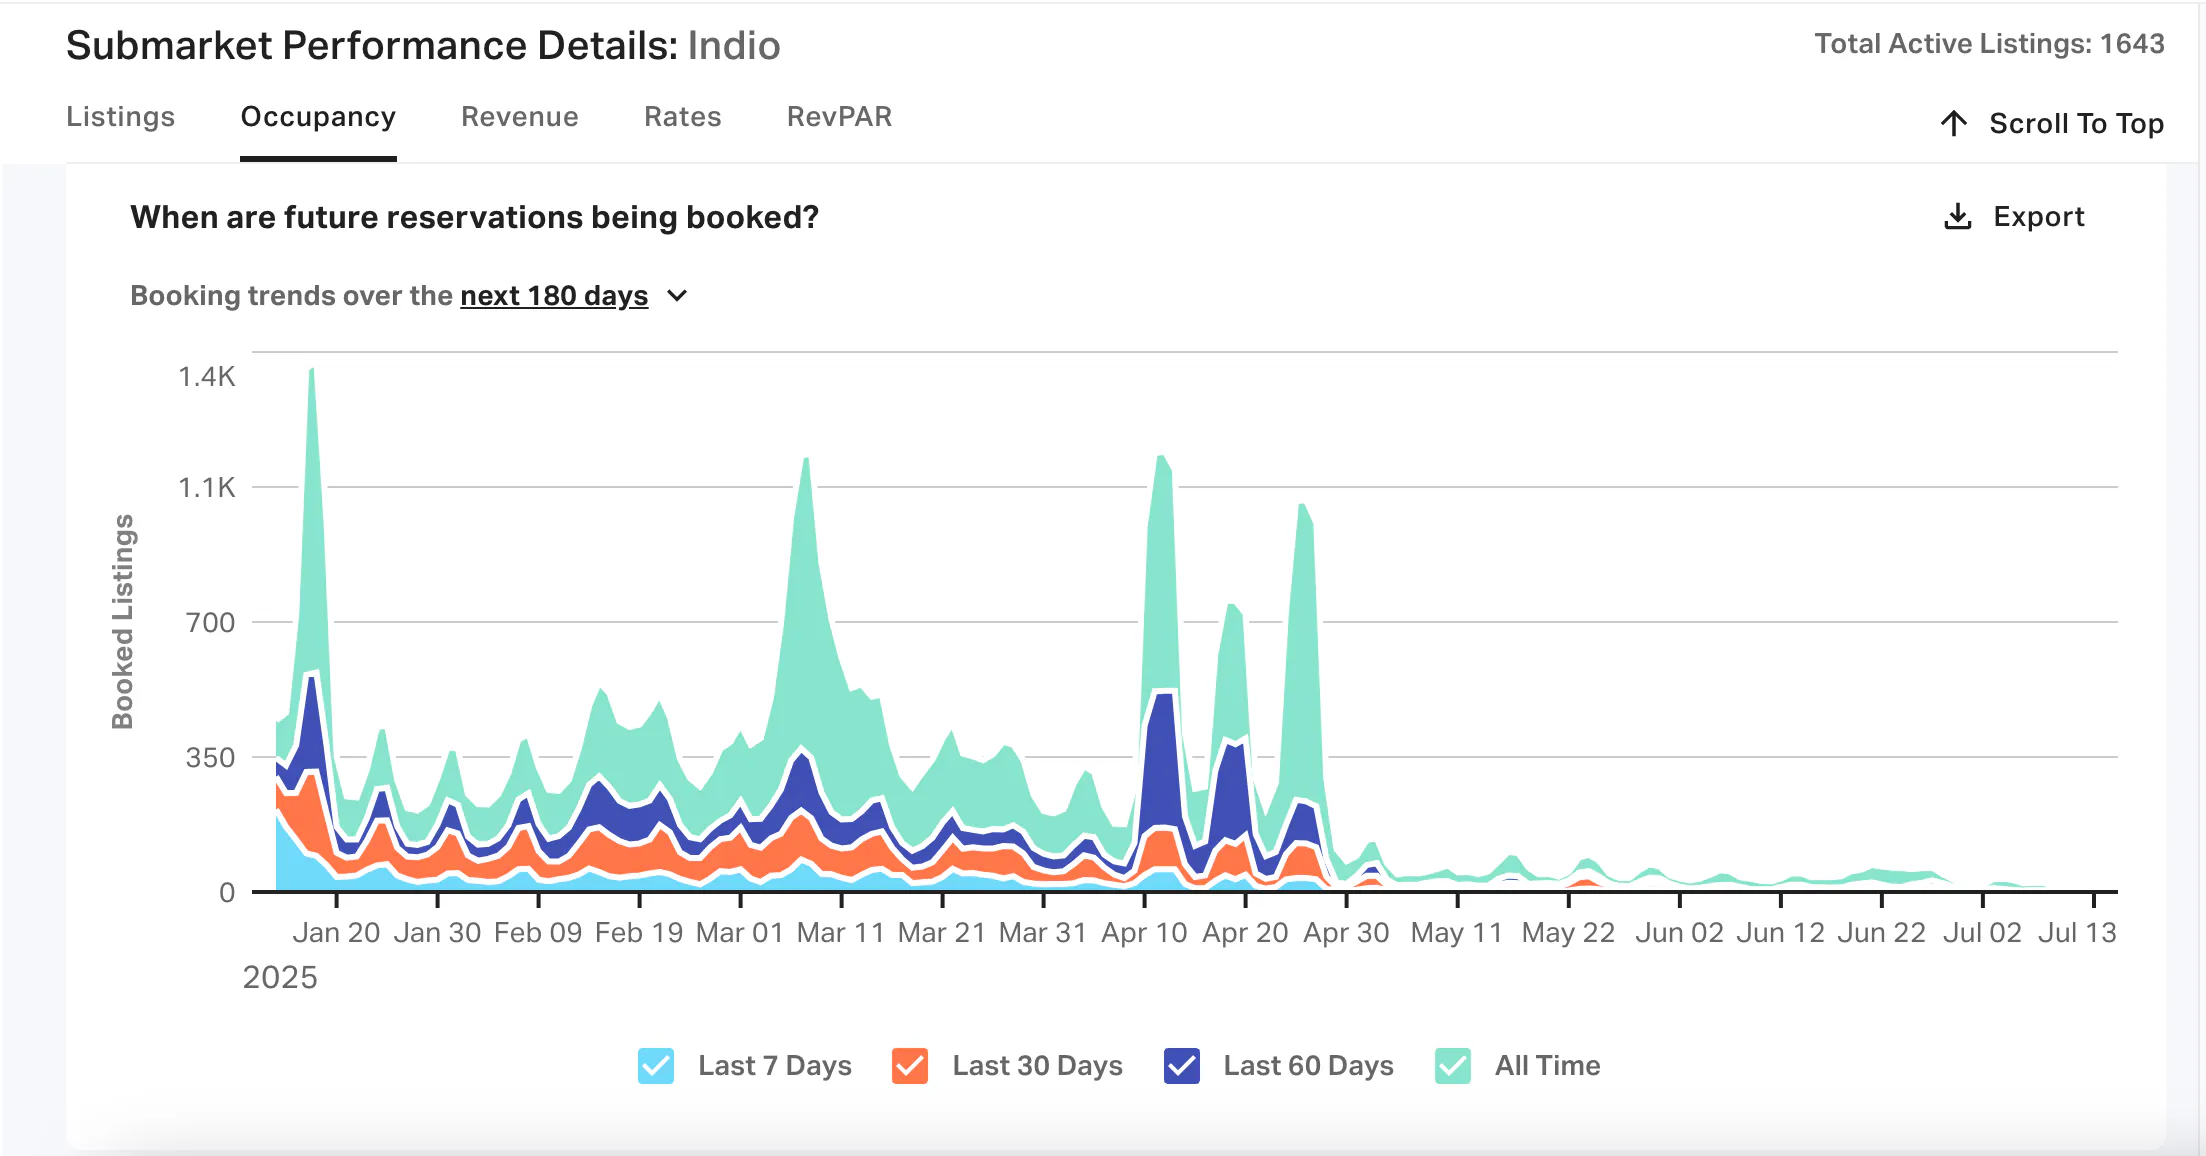
Indio, California perfectly illustrates the impact of events on Airbnb demand. From AirDNA’s Market Overview for Indio, we see much lower seasonality and more consistent bookings throughout the year compared to Park City.
Instead of a three-month seasonal surge, we see sharp, concentrated spikes in April—coinciding with the Coachella and Stagecoach music festivals. The future reservations graph shows these dramatic peaks clearly, with booking volume increasing drastically during festival weekends before quickly returning to baseline.
The light turquoise, which indicates all-time bookings that were made more than 60 days in advance, is also much more prominent for event dates. This signals that people secure accommodations for events farther in advance than usual.
You get a holistic picture of true demand in a specific market or submarket by assessing past and future booking patterns. AirDNA's 12-month historical view helps you understand the big picture, while the forward-looking booking trends (showing the next 30-180 days) reveal upcoming high-demand periods with remarkable precision. This combination helps you spot everything from major seasonal shifts to single-day demand surges, giving you the insight to:
- Price dynamically based on actual future demand.
- Plan maintenance and upgrades during genuine low periods.
- Make informed decisions about minimum stay requirements.
- Adjust your marketing strategy based on booking windows.
Market-Informed Pricing Decisions
AirDNA’s vacation rental pricing tool uses data-driven recommendations to propose the best daily rates.
Neighborhood-specific insights
Even within the same city, the airbnb demand map can vary dramatically between neighborhoods. In fact, a property's success often hinges more on its specific location within a city than the city itself. AirDNA's submarket analysis breaks down these hyperlocal patterns, revealing how factors like proximity to universities, transportation hubs, and downtown areas influence demand in different parts of the same market.
Let's examine two Boston submarkets that tell very different stories:
Newton
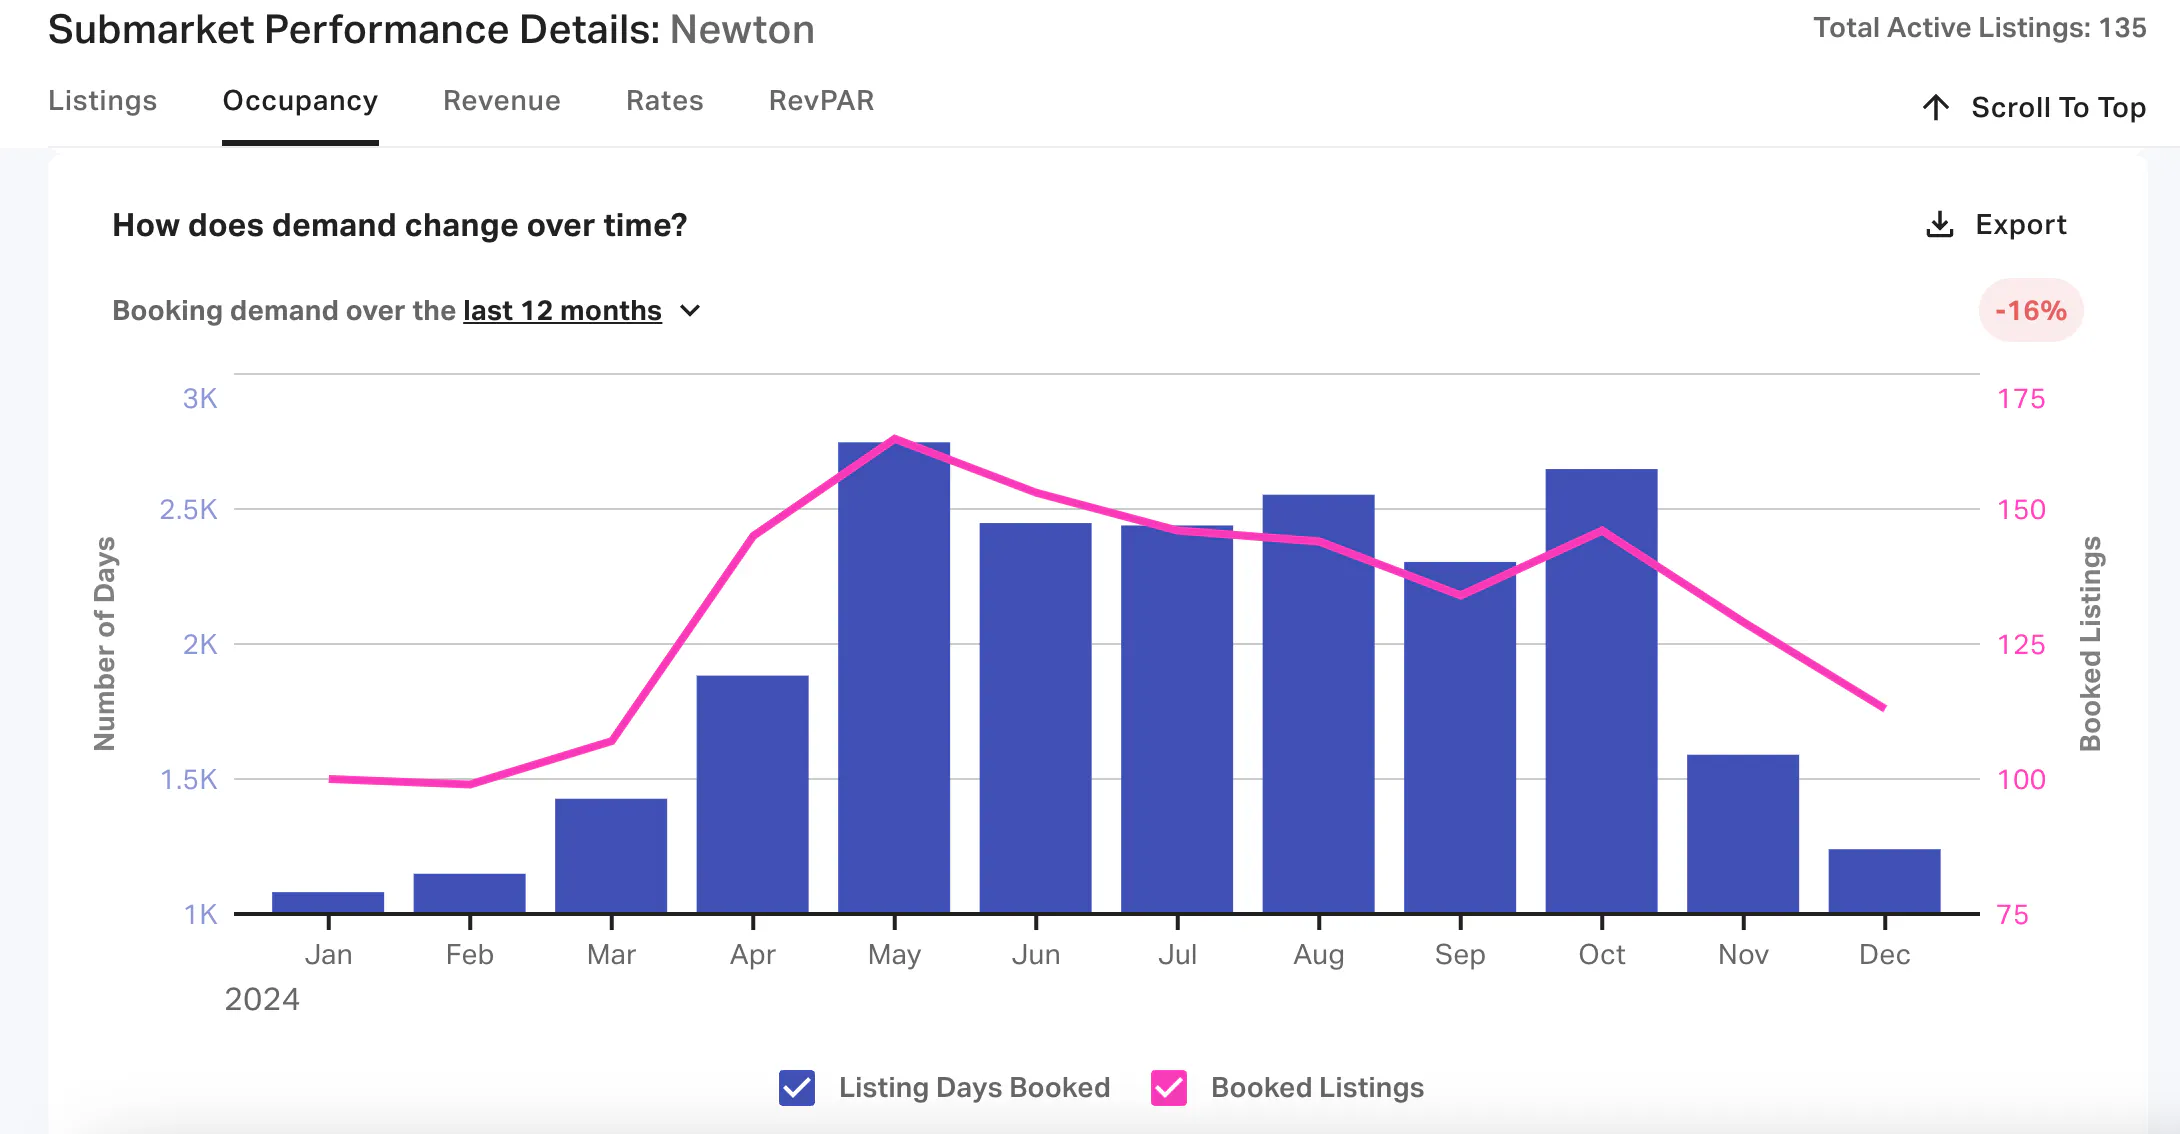
From the AirDNA Market Overview dashboard, we can see that demand for STRs in Newton peaks in May, coinciding with graduation season. This makes sense given its proximity to multiple major schools, like Boston College and Wellesley College.
Salem
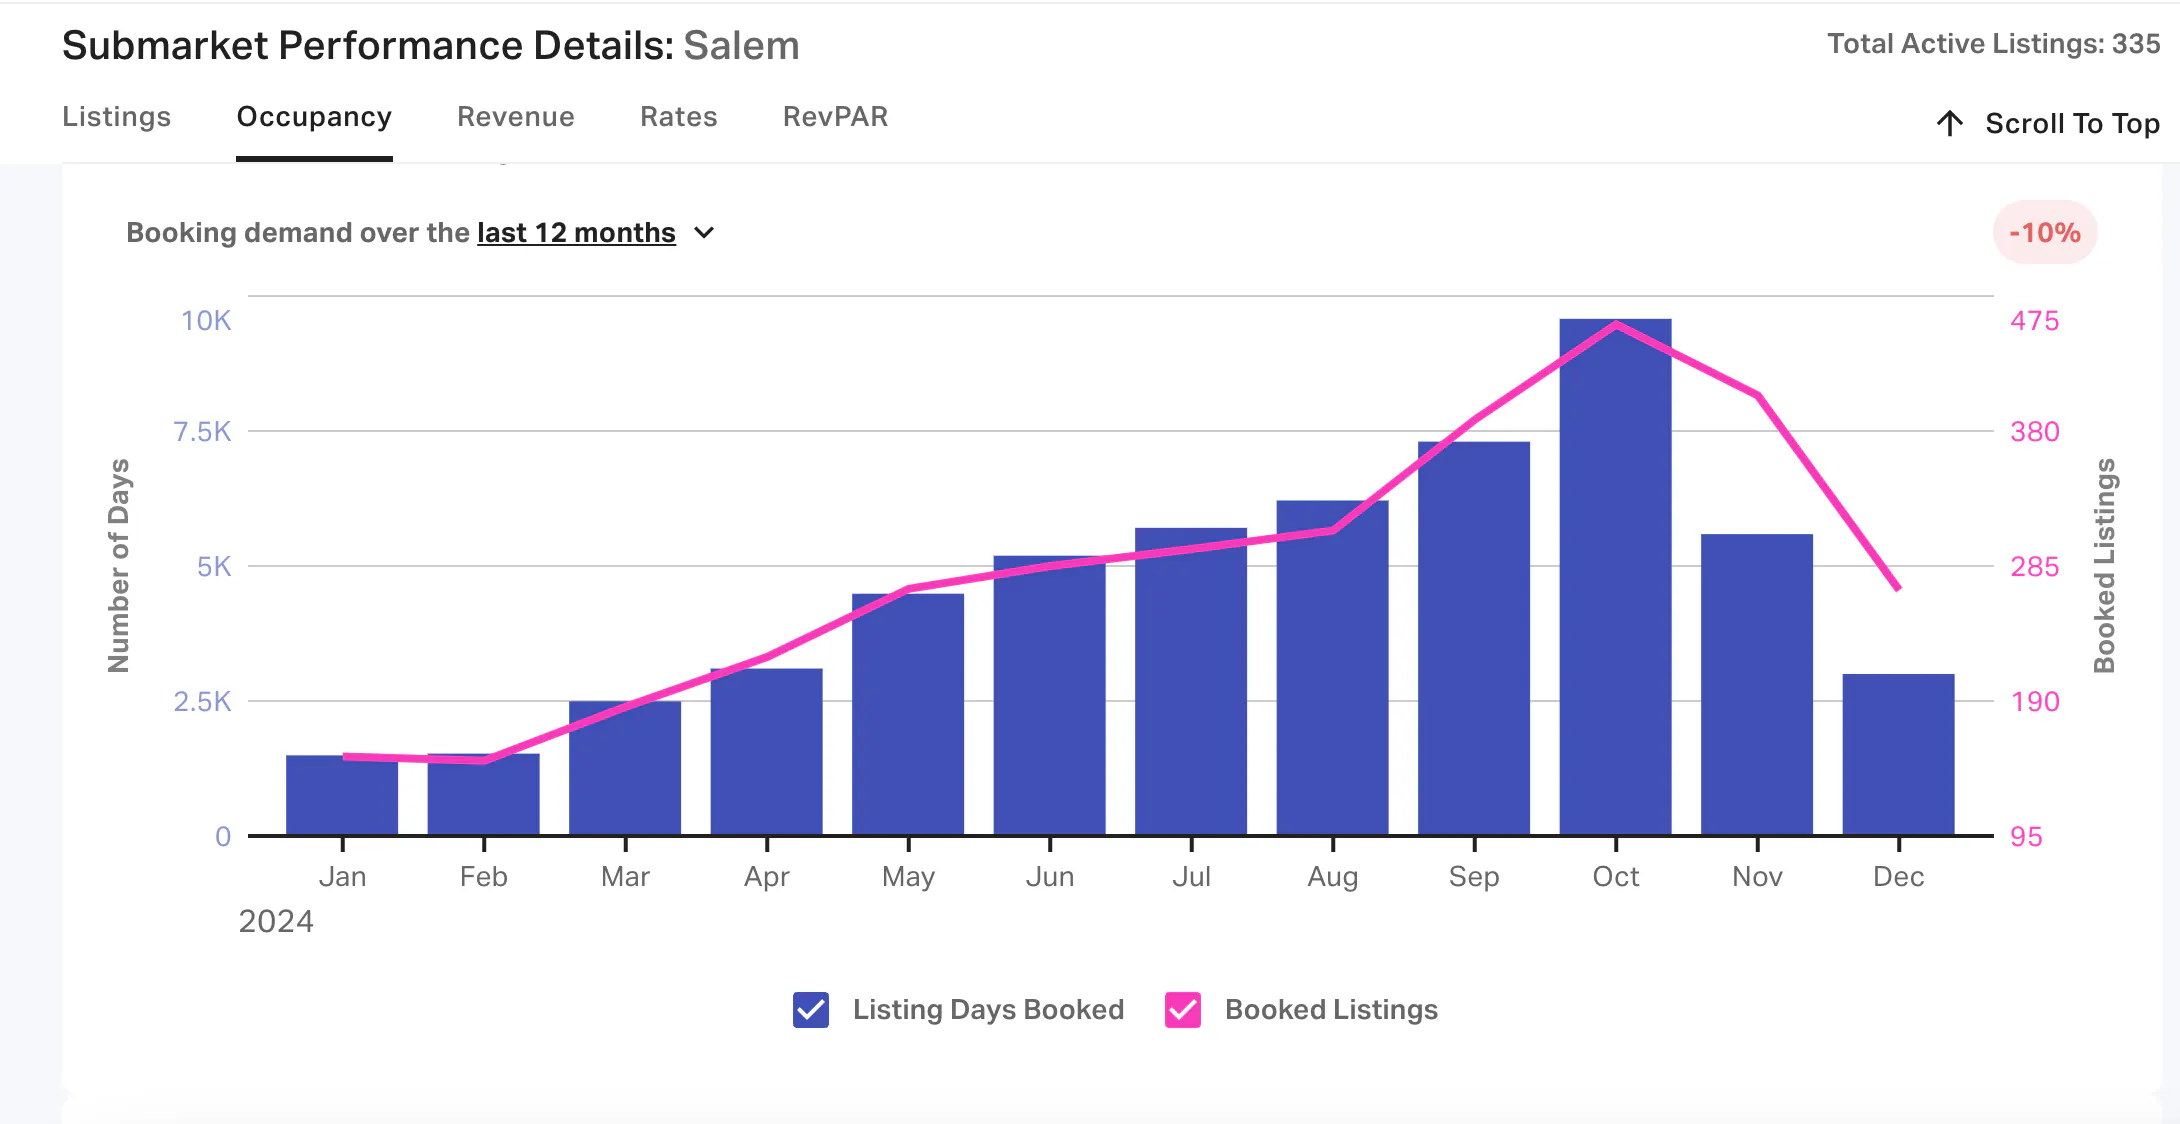
Though it’s only a few miles further outside of Boston, Salem shows very different demand patterns compared to Newton. While relatively quiet during graduation season, Salem short-term rentals see a massive surge in October, when its famous Halloween festivities draw tourists from around the world. AirDNA data shows October bookings nearly quadrupling compared to reservations in earlier months.
Analyzing submarkets reveals a fundamental truth about Airbnb demand: your property's success hinges more on neighborhood-specific dynamics than broad city-level trends.
Use neighborhood-level insights to:
- Target properties near specific demand drivers (universities, business districts, tourist attractions).
- Anticipate and prepare for seasonal fluctuations.
- Price strategically based on hyperlocal demand patterns.
- Make informed decisions about which submarkets best align with your investment goals.
Your property's success hinges more on neighborhood-specific dynamics than broad city-level trends.
How to Assess Airbnb Demand in My Area
Now that you understand what drives demand, let's dive into the nuts and bolts of how to analyze Airbnb property potential. Here’s a step-by-step guide to turning raw data into investment decisions you can bank on.
Analyze demand with AirDNA
AirDNA's Market Overview dashboard breaks down short-term rental data from broad market trends to granular submarket insights. You'll find detailed metrics on occupancy, revenue, and booking patterns—all updated in real-time to reflect current market conditions.
Let's walk through a real-world example of how to assess demand in a market using AirDNA. Looking at the Market Overview dashboard for the Phoenix/Scottsdale market, you’ll immediately spot some telling patterns in the booking data.
Start by focusing on the Occupancy tab in the Market Overview dashboard. The charts and data in this tab will paint the clearest picture of demand.
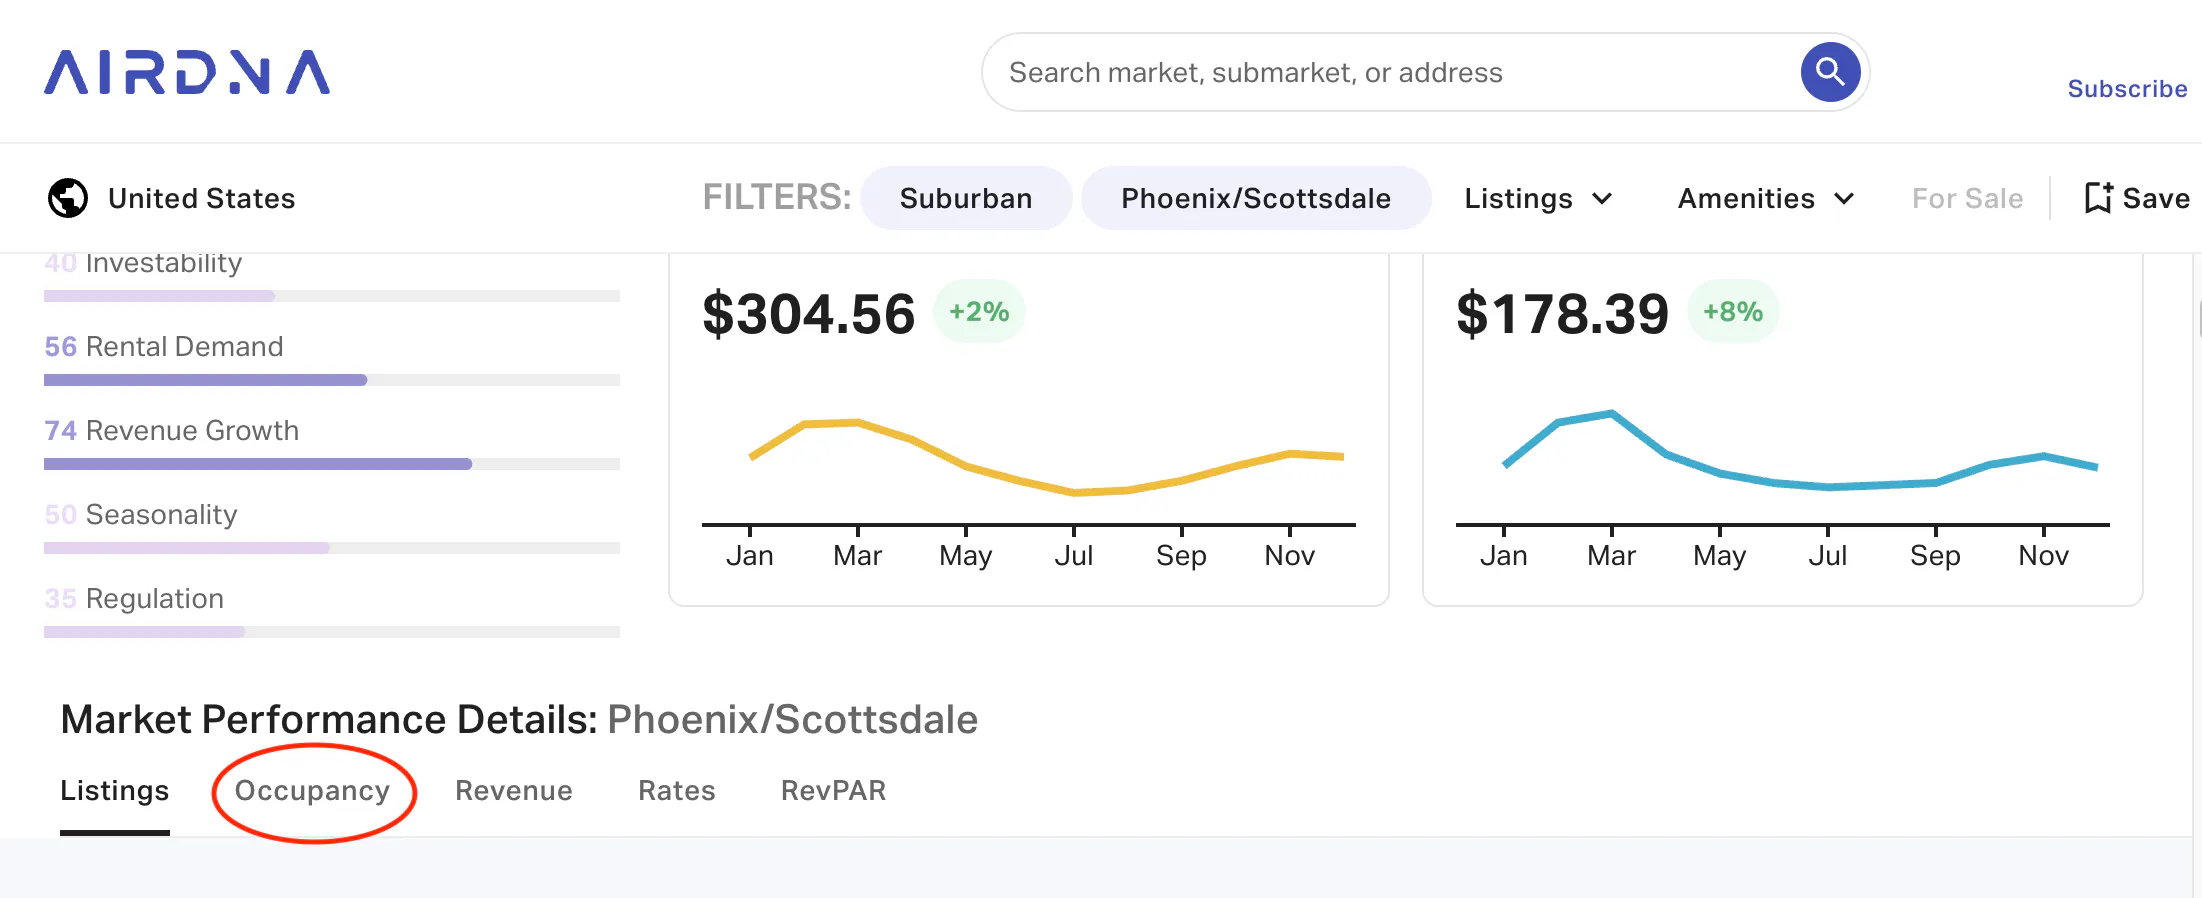
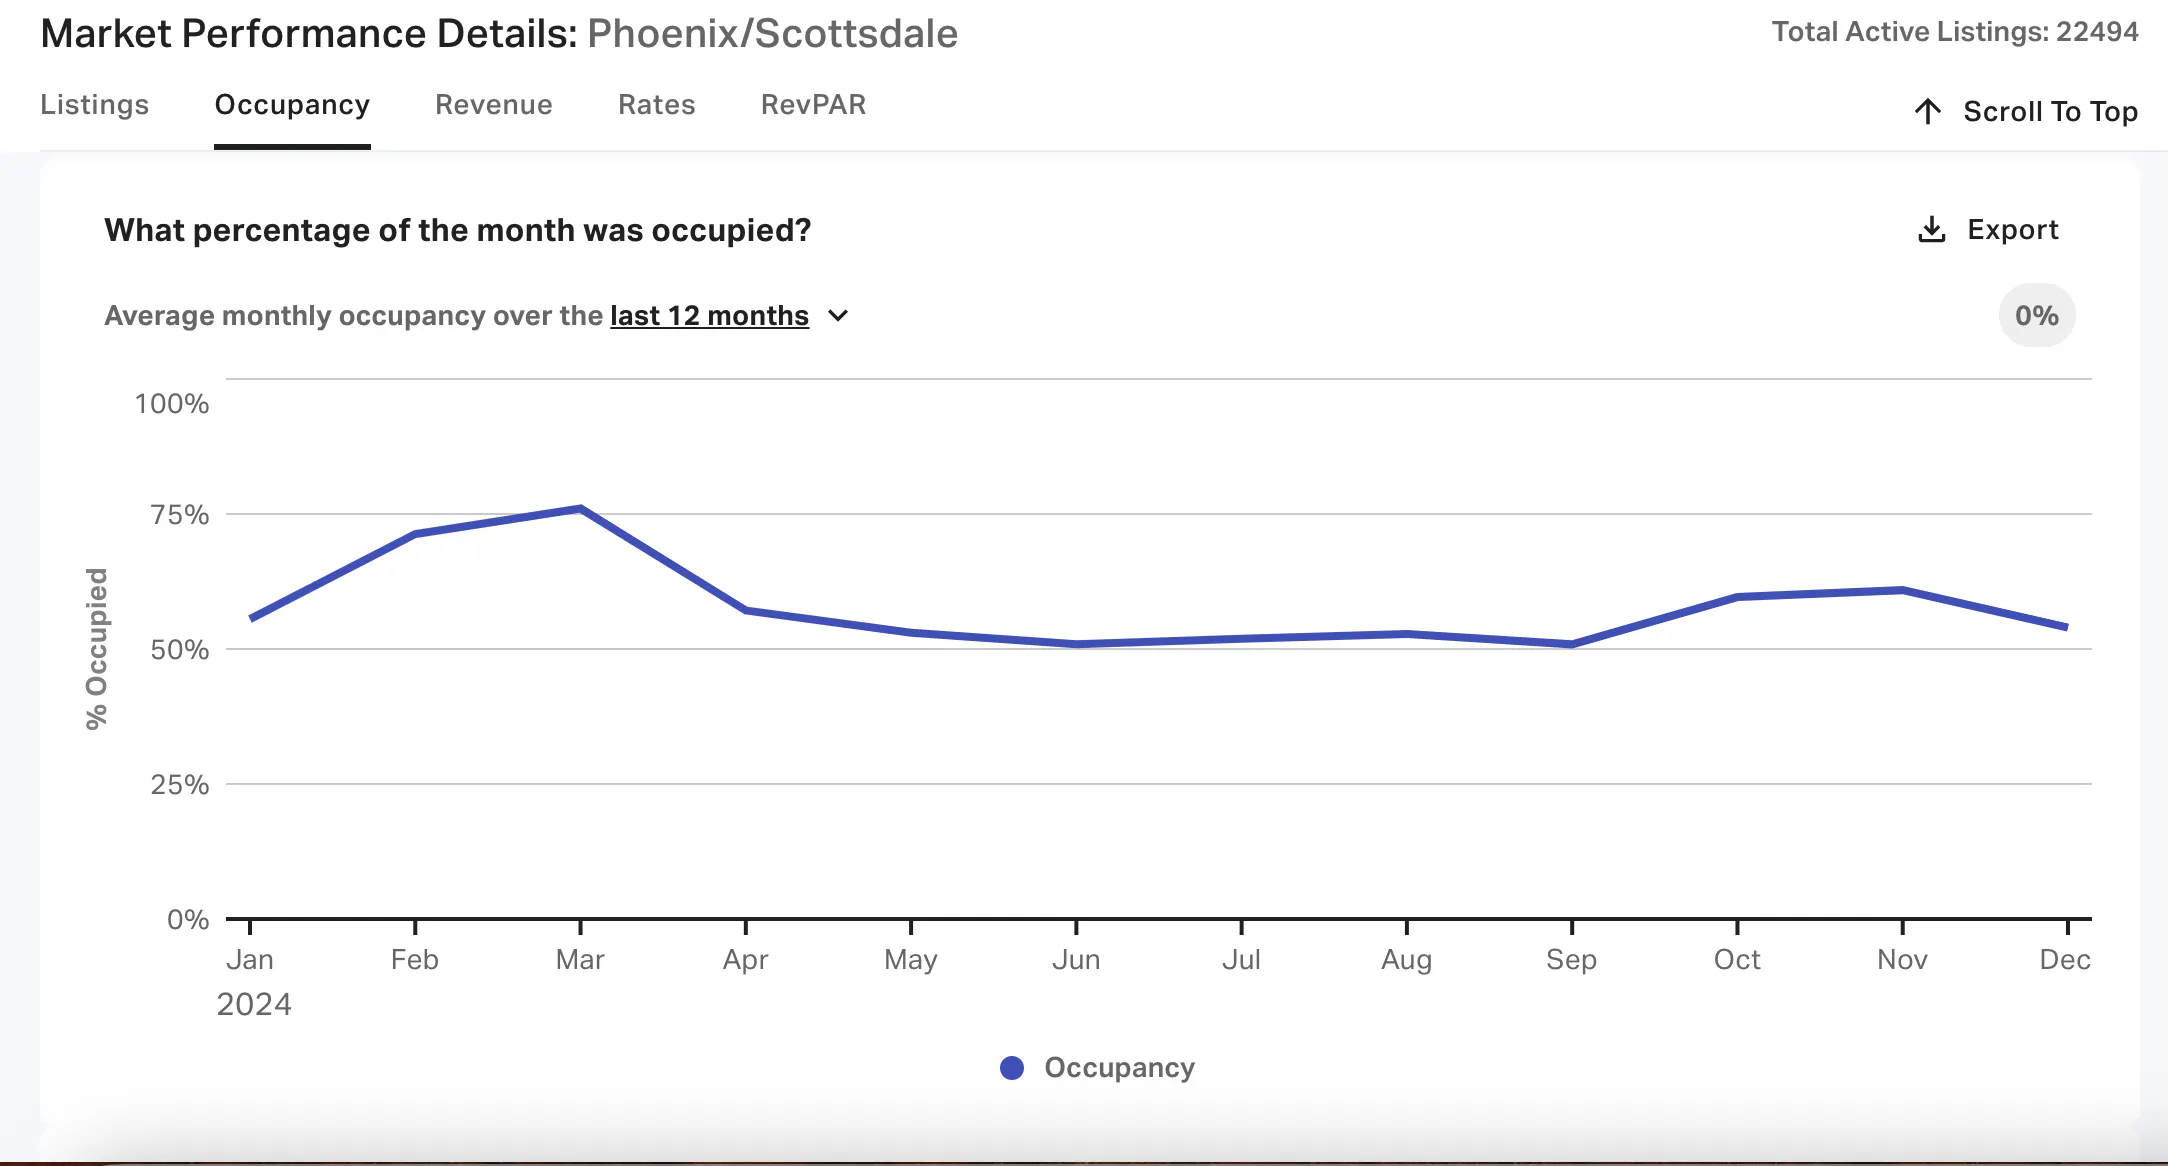
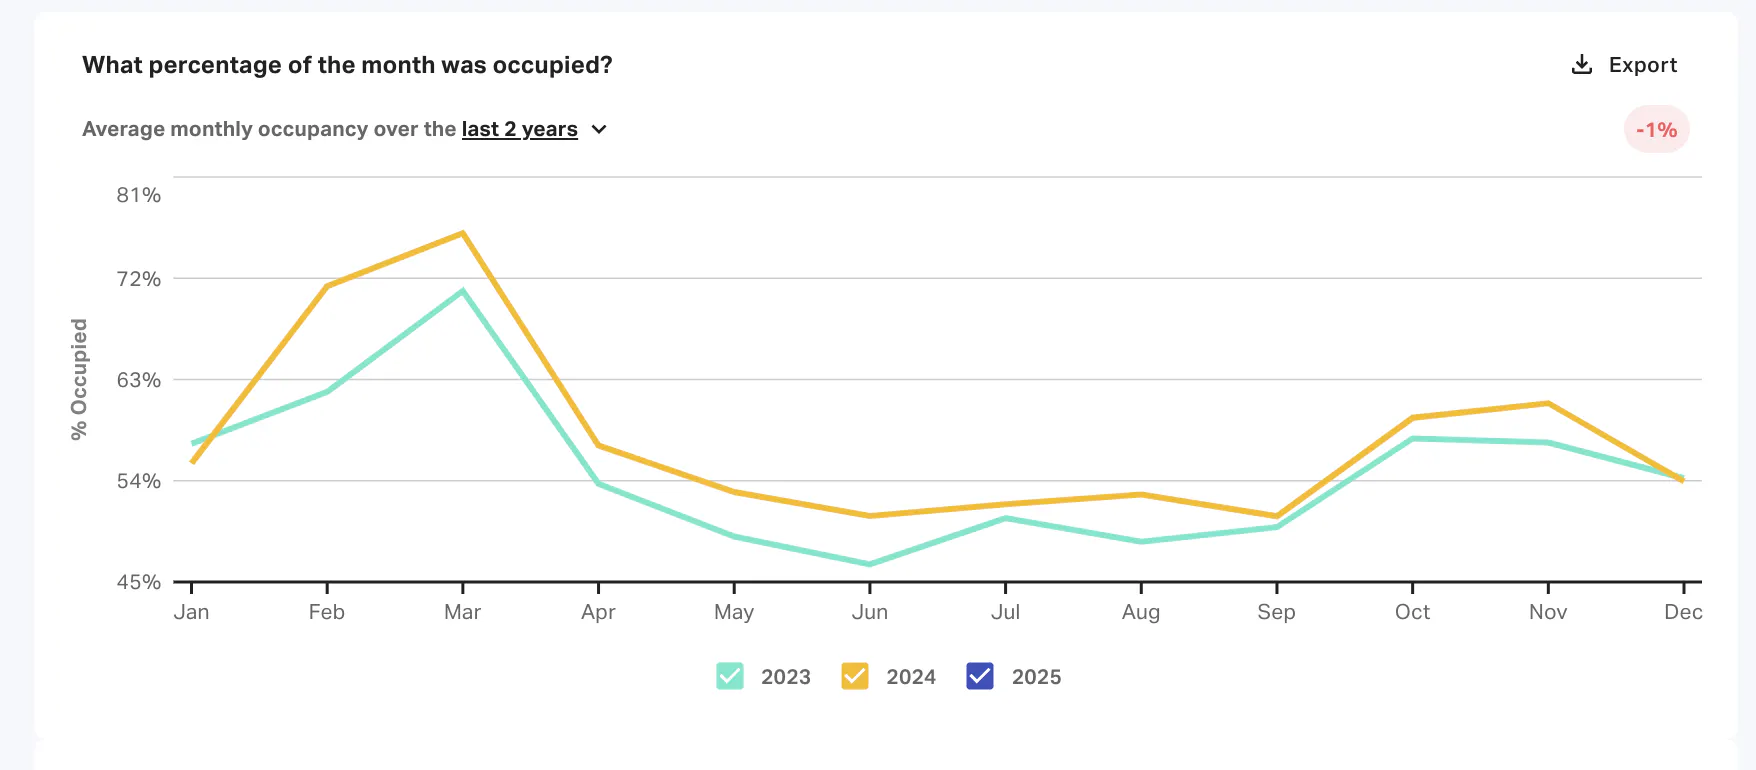
First, you’ll find data on occupancy rates by month over the last 1-3 years (you can also opt to view pre-Covid data from 2018 with an advanced tier subscription). What’s most helpful to note are the highs and lows—for example, in Phoenix/Scottsdale, monthly occupancy never dipped below 51% in 2024, and reached as high as 76% in March of 2024.
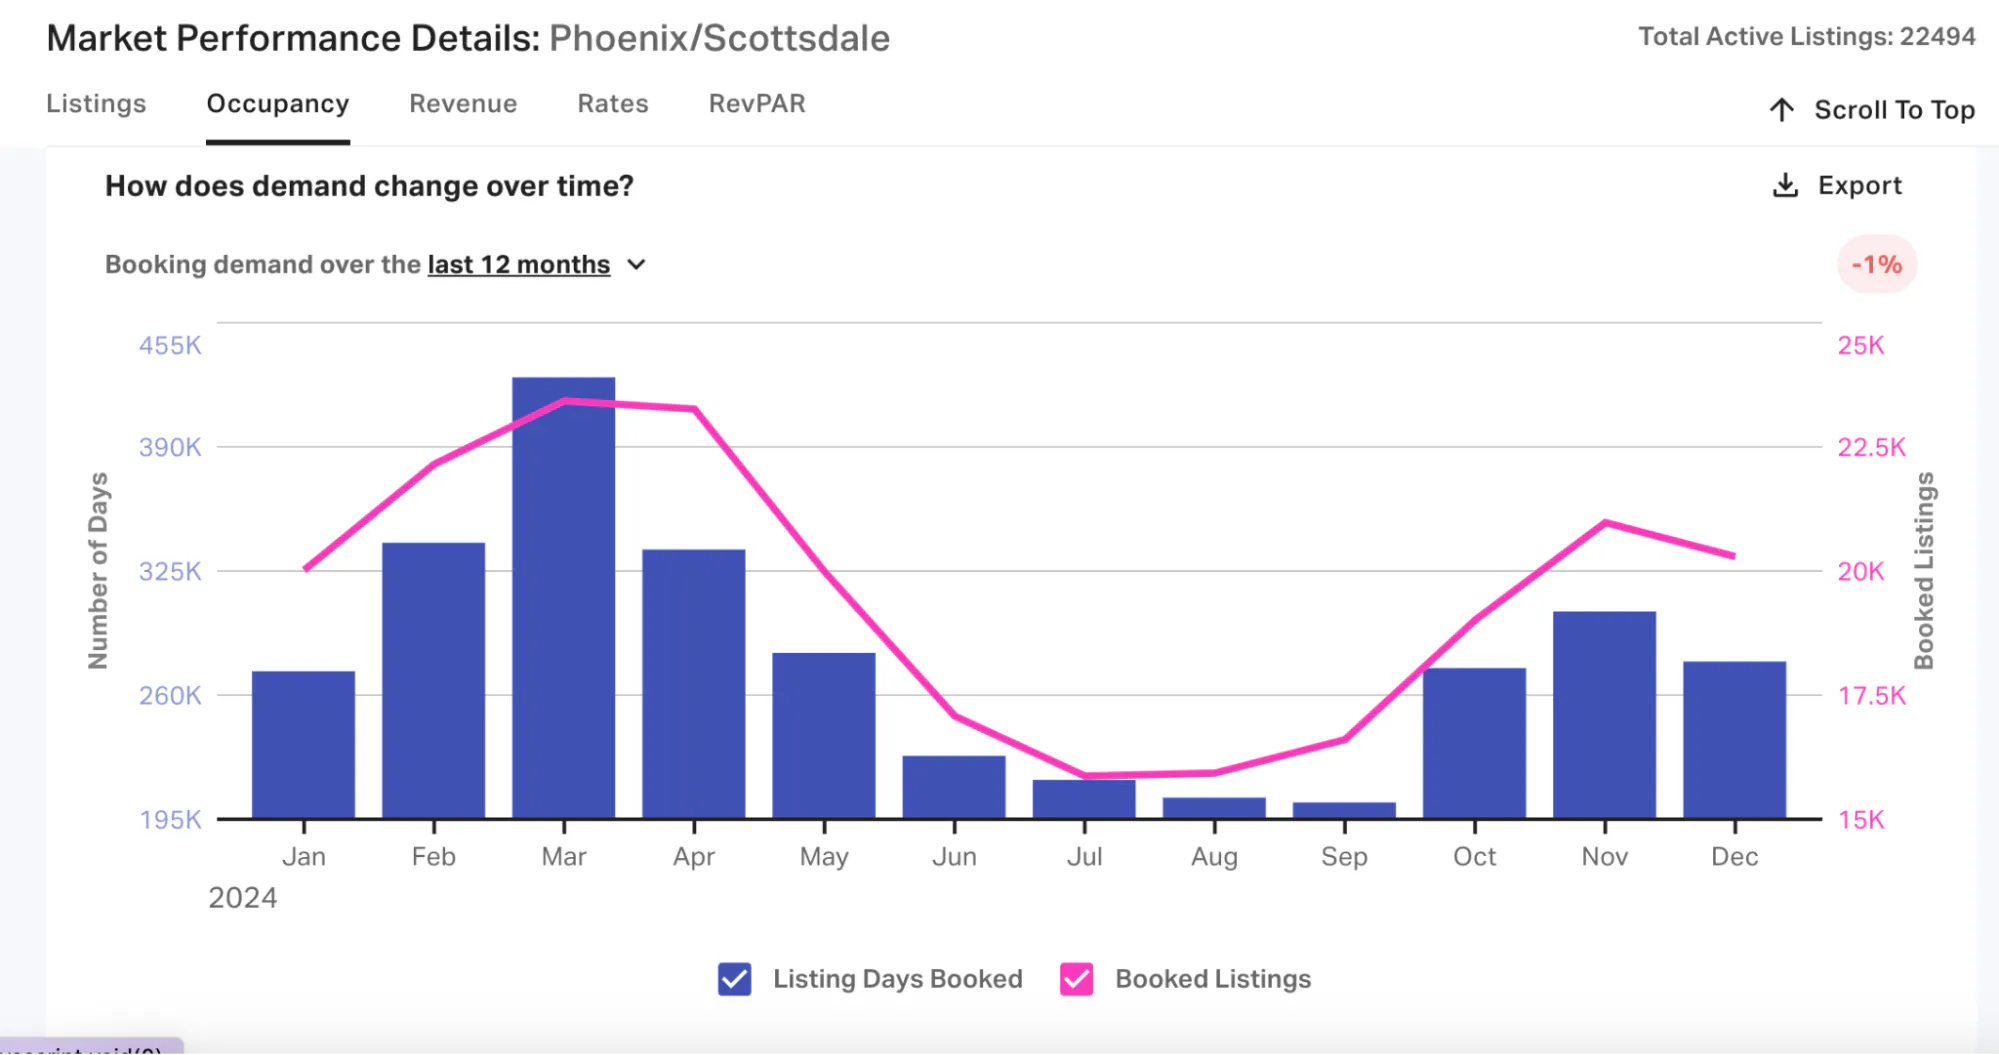
From the Occupancy tab, you should also review demand changes over time. Again, you can view patterns for just the last year, or extend that range to 2 or 3+ years.
You’ll gain insights into more recent trends by zooming in on just the last 12 months. The example for Phoenix/Scottsdale below reveals greater demand in the fall and spring, with a sharp decline during the hot summer months.
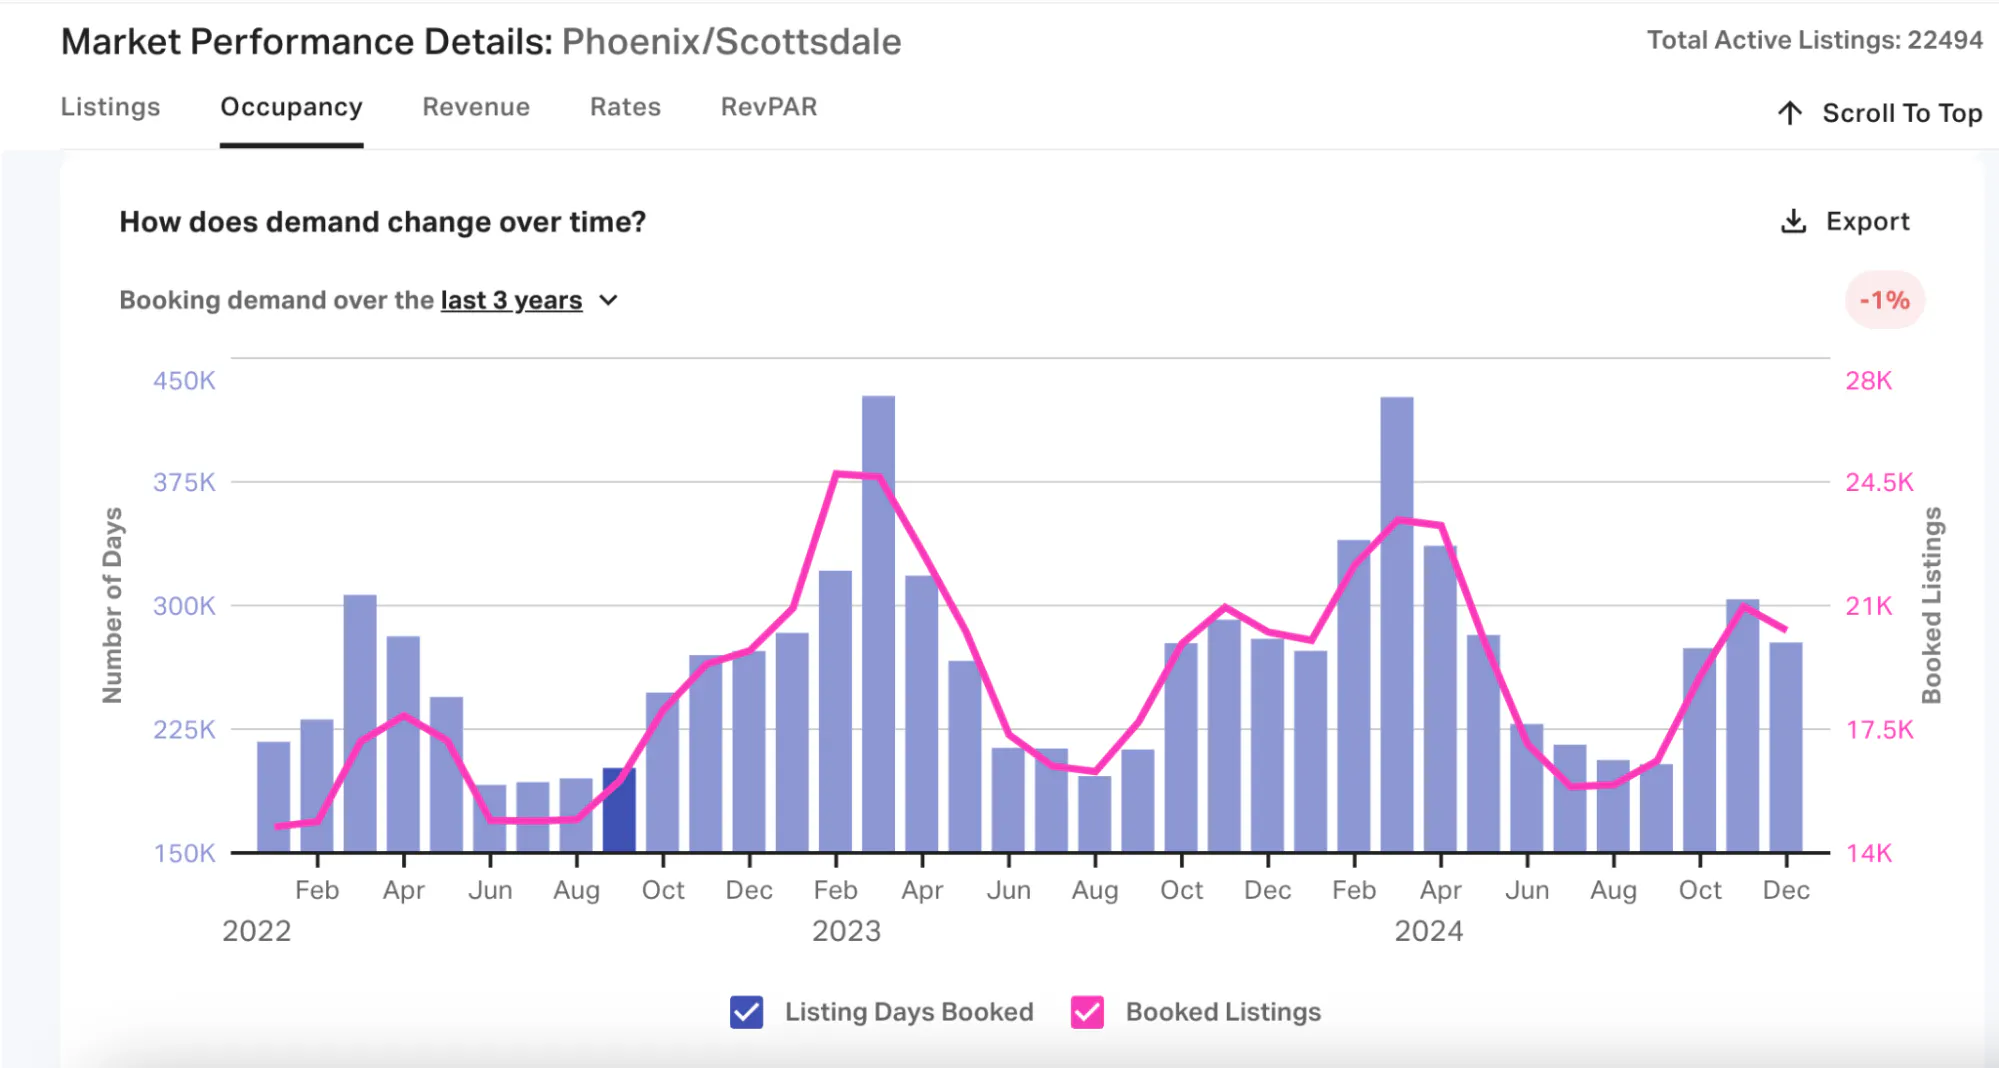
You’ll start to notice year-over-year trends by zooming out to see booking demand over the last 3 years. Although demand in 2022 was much lower overall than 2023 and 2024, it followed a similar pattern as the following years: low demand in the summer, high demand in the fall and spring.
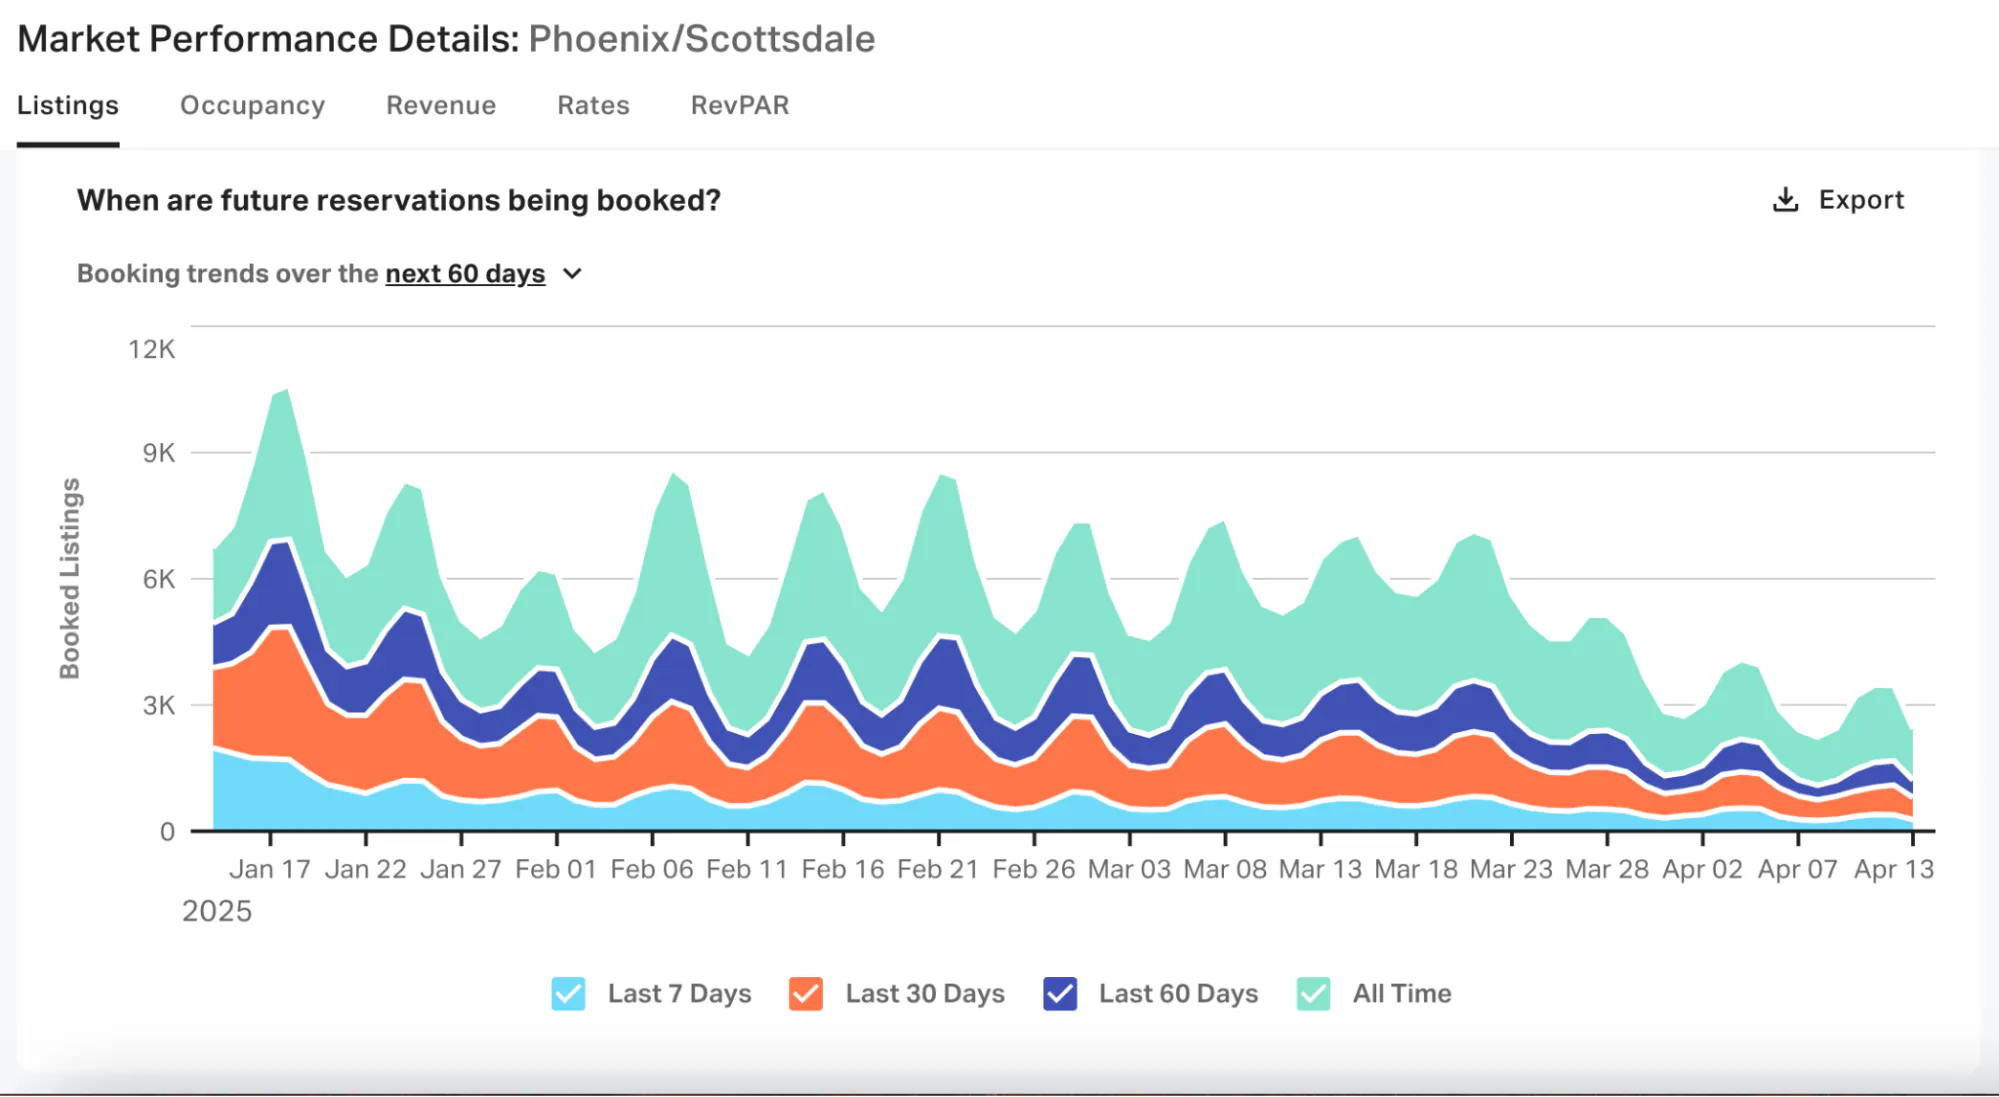
Another helpful tool to assess Airbnb demand in your area is the future reservations chart. This data can help you assess average booking lead times and pinpoint any upcoming events that drastically influence demand.
Looking at this data for Phoenix/Scottsdale over the next 60 days (starting in January 2025), we can see that the number of booked listings spikes on the weekends. Other than that trend, we see relatively consistent booking trends that don’t reveal any major spikes or declines. Demand starts to dip in April, likely due to guests waiting to book April dates until their travel dates are closer and higher temperatures dampening demand as we move into later spring.
Pro tip: While this market-level data is valuable, connect your listing to unlock even more detailed insights. You'll see how your property's future demand stacks up against competitors, helping you price and position your listing more effectively.
How is your STR performing?
Your vacation rental may be amazing, but is it better than your competition? Connect your Airbnb listing to AirDNA to see its Booking Performance Score.
Compare market demand vs. supply
Understanding supply and airbnb demand in your area is like reading a market's vital signs—both metrics need to be healthy for a thriving investment. Let's walk through how to analyze these patterns using Phoenix/Scottsdale as our example.
First, look at the Listing performance information in the AirDNA Market Performance dashboard. The top of the page showcases information about supply.
In Phoenix/Scottsdale, the annual availability graphic shows that the majority of vacation rentals (66%) are available to book for 6 months or less. This indicates that supply is highly seasonal, which aligns with the line graph that tracks rental growth in the last 3 years. Notice how Phoenix/Scottsdale's active listings fluctuate seasonally, with consistent dips in summer months and peaks during spring and fall.
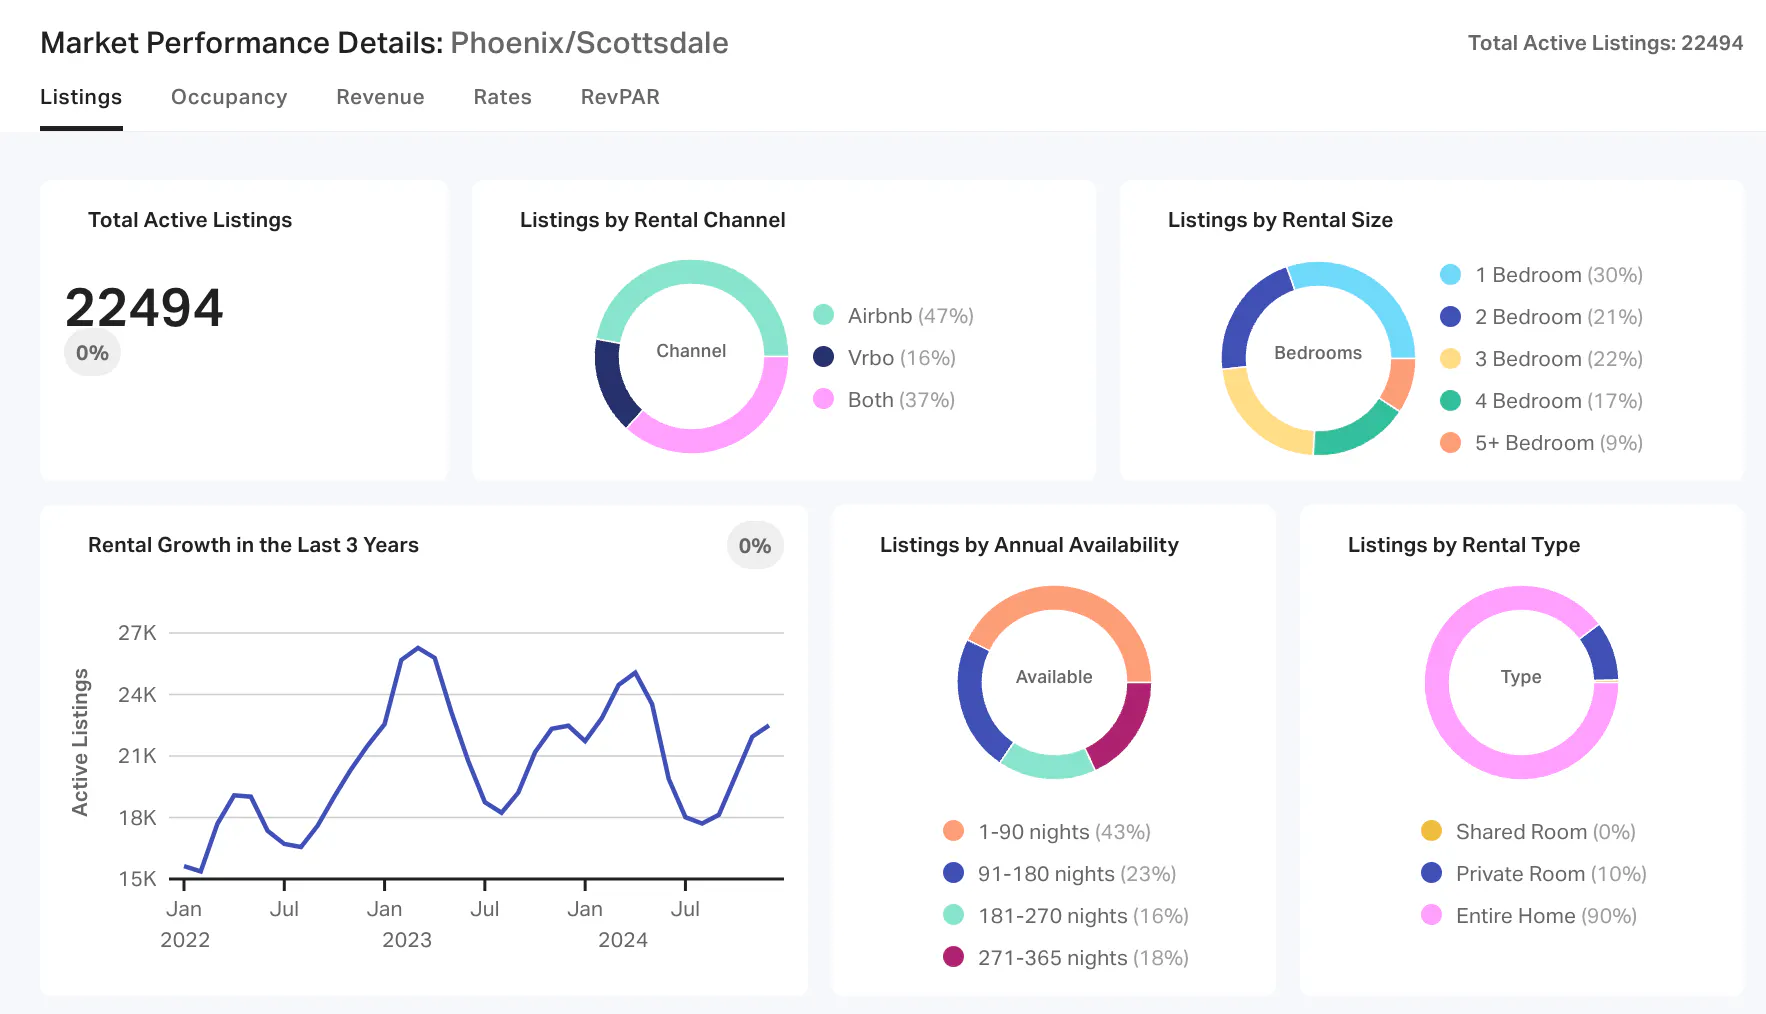
If you scroll down to view occupancy information, you’ll see that demand fluctuates in tandem with supply. July occupancy, which was about 52% in 2024, correlated with one of the low points in the year for supply, when approximately 18,000 listings were available to book.
In contrast, March occupancy peaked at 76% in 2024 when the maximum number of listings were available—around 26,000. It’s a sign of improving performance overall that monthly occupancy was higher in 2024 than in 2023.
The interplay between supply and demand is important here. Imagine how much lower the average occupancy rate would be if available listings stayed the same year round. The reduced demand in the summer months barely supports a 50% occupancy rate for the hosts who remain listed. That occupancy rate would surely tank if the supply was 30% higher as it is in the winter months.
As a host, this interplay between supply and demand can help you make informed decisions about when to make your vacation rental available. There may be times of the year when supply outpaces demand, and it’s a smarter choice financially to take your rental off the market until demand better matches supply.
AirDNA also has custom filters that empower you to explore how supply and demand differs based on listing, performance, and amenity characteristics. A market might appear to be oversaturated with listings, leading to depressed occupancy overall. However, there may be pockets of opportunity if supply is lacking for a certain type of listing that garners higher demand than the market average.
You can apply a filter to the results so that the performance information only reflects listings with pools, for example. Vacation rentals in Phoenix/Scottsdale with this amenity tend to perform slightly better during peak months than the market average—78% versus 76% occupancy in March.
Using this amenity filter also reveals that short-term rentals with pools account for 15,417 of the 22,494 listings, or 68% of total supply. With the majority of rentals offering this premium amenity, hosts without a pool may struggle to compete with other Airbnbs in the area.
Key Supply & Demand Indicators
When evaluating a market, watch for these key signals:
- High supply + moderate demand = potential oversaturation, like many urban cores during post-pandemic recovery.
- Low supply + high demand = market opportunity, which is often seen in emerging vacation markets.
- Balanced growth in both supply and demand = healthy market, such as what we're seeing in Phoenix/Scottsdale's spring/fall peaks.
Sometimes the most promising opportunities aren't where you'd expect. While popular areas might seem attractive, they often face fierce competition. For instance, you might discover that downtown Phoenix has hundreds of listings competing for guests, while a nearby suburb with fewer properties maintains consistently higher occupancy rates.
Pro tip: Take your analysis to the next level by connecting your listing to AirDNA and building a custom comp set. This unlocks more detailed insights about your direct competitors, including real-time pricing strategies, occupancy patterns, and revenue potential.
Identify demand drivers
What makes some properties outperform their neighbors? It goes beyond basic metrics like location and price.
As we saw with the example of pools in the Phoenix/Scottsdale market, AirDNA's custom filters help you uncover the factors that set high-performing properties apart from the rest. Use AirDNA's filters to compare performance across:
- Property sizes: Notice if one-bedroom units outperform larger homes, for instance.
- Specific amenities: Is demand higher for rentals with dedicated workspaces or hot tubs?
- Property types: Apartments, B&B’s, houses, and unique listings may have unique supply and demand dynamics that differ from market averages.
- Price ranges: Is demand higher for budget properties or luxury listings?
Another way to pinpoint what drives bookings in your market is to assess guest preferences. Study the Airbnb rental occupancy patterns of your market's top performers. What do their reviews consistently mention? Which amenities do guests highlight?
Calculate potential earnings
Understand the investment potential of any address in the world.
Common Mistakes When Evaluating Airbnb Demand in My Area
Even experienced investors can stumble when analyzing market opportunities. Here are the most common pitfalls to avoid when evaluating demand for Airbnb in your area.
Disregarding seasonal and local nuances
Looking at annual averages alone is like trying to plan a picnic using yearly weather averages—it might tell you it's usually sunny, but it won't warn you about the spring rain. Markets have their own rhythms and peculiarities that annual data can mask.
Take a college town, for instance. An impressive 85% annual occupancy rate might hide the fact that bookings plummet during summer breaks and holidays. Or a beach destination showing moderate yearly demand might actually deliver exceptional returns during peak season, if you know how to capitalize on those prime weeks.
Ignoring supply trends
Strong demand numbers can be deceiving if you're not watching supply trends just as closely. Picture this: you spot a market with soaring Airbnb demand data, only to discover that dozens of new properties are about to enter the market, potentially diluting your future bookings.
Pay attention to:
- New properties entering the market
- Changes in local regulations that could impact supply
- Seasonal fluctuations in available listings
- Long-term market growth or contraction patterns
Overlooking the bigger picture
Airbnb rental occupancy is only one piece of the puzzle. A property with 80% occupancy might actually generate less revenue than a property with 60% occupancy if the latter commands higher nightly rates or has lower operating costs.
Key metrics to consider alongside occupancy:
- Average Daily Rate (ADR)
- Revenue Per Available Room (RevPAR)
- Seasonal rate variations
- Operating costs in your market
- Length-of-stay patterns
Misinterpreting data
Raw numbers only tell part of the story. When you hear a market has "high demand," that data point alone doesn't give you enough information to make smart investment decisions. You need to dig deeper and determine:
- What drives that demand
- How consistent it is throughout the year
- Whether demand growing or declining
- How it compares to similar markets
- What type of guests are traveling to the area

FAQs
How to find Airbnb occupancy rates?
You'll need access to reliable market data to find accurate short-term rental occupancy rates. While you can make rough estimates by manually tracking competitor calendars, this approach is time-consuming and often inaccurate. Professional tools like AirDNA provide:
- Historical occupancy data for any market
- Future booking trends
- Seasonal patterns
- Competitive benchmarking
- Vacation rental occupancy rates by property type
Beyond just finding the numbers, make sure you're looking at both market-wide trends and comparable properties within your specific submarket. For example, comparing your three-bedroom house to studio apartments won't give you meaningful insights about your property's potential performance.
How do you analyze an Airbnb property?
A thorough Airbnb investment analysis should evaluate multiple factors:
Market performance:
- Overall market health and growth trends
- Seasonal demand patterns
- Short-term rental statistics for your area
- Local regulations and their impact
Property-specific factors:
- Location within the market
- Size and amenities compared to competitors
- Renovation opportunities
- Operating costs and potential return on investment (ROI)
Competitive analysis
- Number of similar properties
- Competitor pricing strategies
- Occupancy patterns
- Guest reviews and preferences
ARTICLE SUMMARY
Wondering if your potential Airbnb investment will actually get bookings? Learn how to analyze market demand like a pro, using real-time data to spot profitable opportunities and avoid costly investment mistakes.
Dillon DuBois
AirDNA Senior Product Manager
Dillon DuBois is a seasoned expert in the short-term rental space, having worn many hats at AirDNA since joining in 2019. From driving B2B marketing initiatives to shaping product strategy, Dillon’s deep understanding of both the company and the industry makes him a key player in delivering innovative solutions. Now a Senior Product Manager, he leverages his experience to bridge the gap between data and user needs. He manages his own short-term rental in Medellín, Colombia, and enjoys all things outdoor adventure, travel, cooking, & surfing.
