

 Calculate Revenue
 Research Markets
 Find For Sale Properties
 Compare My Listing
 STR Revenue Calculator
 Custom Comp Sets
 Submarket Insights
 Custom Search Filters
 Rate Recommendations
 Performance Benchmarking
 Competitor Comparison
 Owner Contact Details
 Property-level performance data
 Tourism Insights
 Real Estate Investment Analytics
 About Us
 Sales
Sales Support
 Press
Press10 Best National Park Airbnb Markets for STR Investors
Published: August 2, 2024
Last updated: February 26, 2025

Jamie Lane
Key Takeaways
- National parks have experienced a 104% increase in short-term rental demand since 2018.
- The expanding travel season for national parks offers Airbnb hosts increased opportunities for year-round revenue.
- Use AirDNA dashboards to explore short-term rental trends in the national park of your choice.
Are you dreaming of owning a slice of paradise near one of America's breathtaking national parks? With the surge in national park visits and the growing popularity of unique, nature-centric accommodations, investing in Airbnbs near national parks has become an enticing opportunity for savvy short-term rental investors.
In this comprehensive guide, we'll explore the top 10 national park Airbnb markets, uncover the latest national park travel trends, and provide valuable insights to help you make informed investment decisions. So, pack your virtual bags as we navigate the most promising Airbnb national park markets!
Smart investments happen here.
AirDNA makes hosting and investing a breeze. Every insight you need, all in one place, always up-to-date.
10 Best Places to Invest in Airbnbs Near National Parks
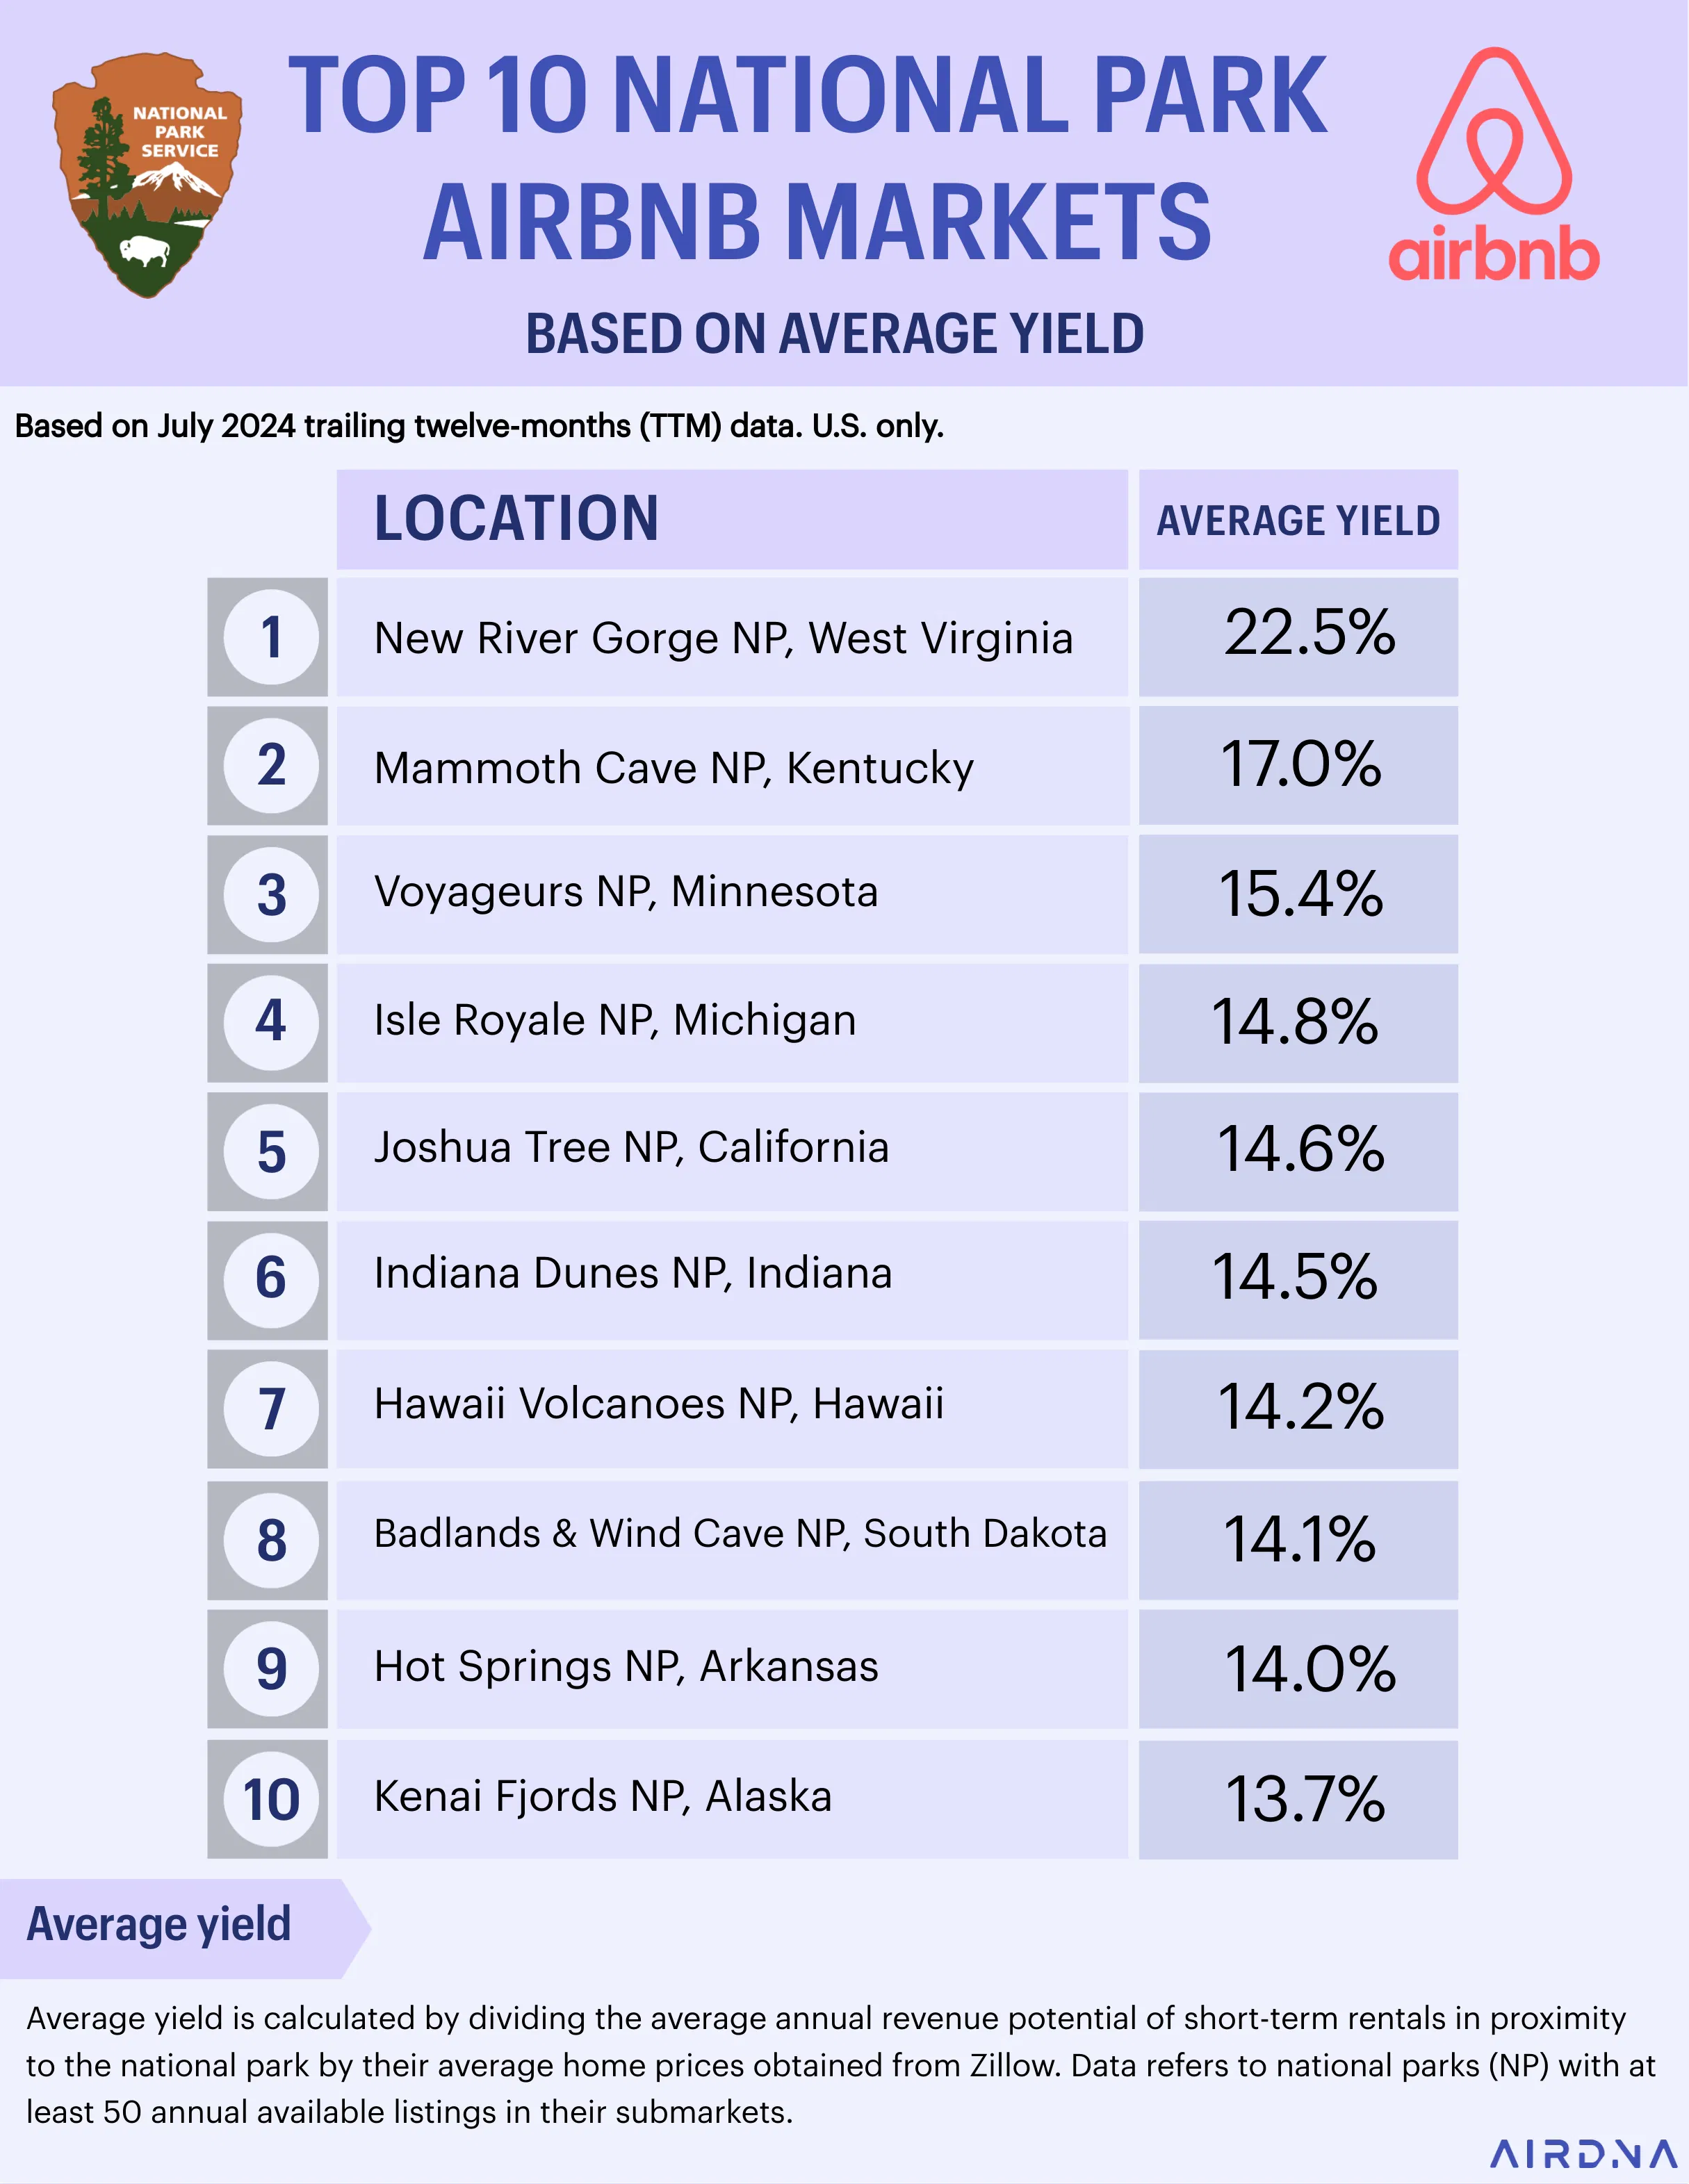
When considering where to invest in Airbnbs near national parks, the key is to look for submarkets with high yields. We’ve chosen to rank national park airbnb markets by their yield to get a fuller and more accurate picture of profitability than revenue potential alone can provide. The yield takes into account the initial barrier to entry—that is, the cost to invest.
You calculate yield by dividing annual revenue potential by average home prices for each short-term rental submarket that serves a national park. Higher yield means greater rate of return on investment.
Note that average annual revenue potential figures are gross figures based on annual yield if a property is listed year-round. In reality, though, the majority of short-term rental (STR) owners are not offering their properties 365 days per year. Most hosts’ earned revenue will fall short of these projected revenue numbers.
1. New River Gorge National Park, West Virginia
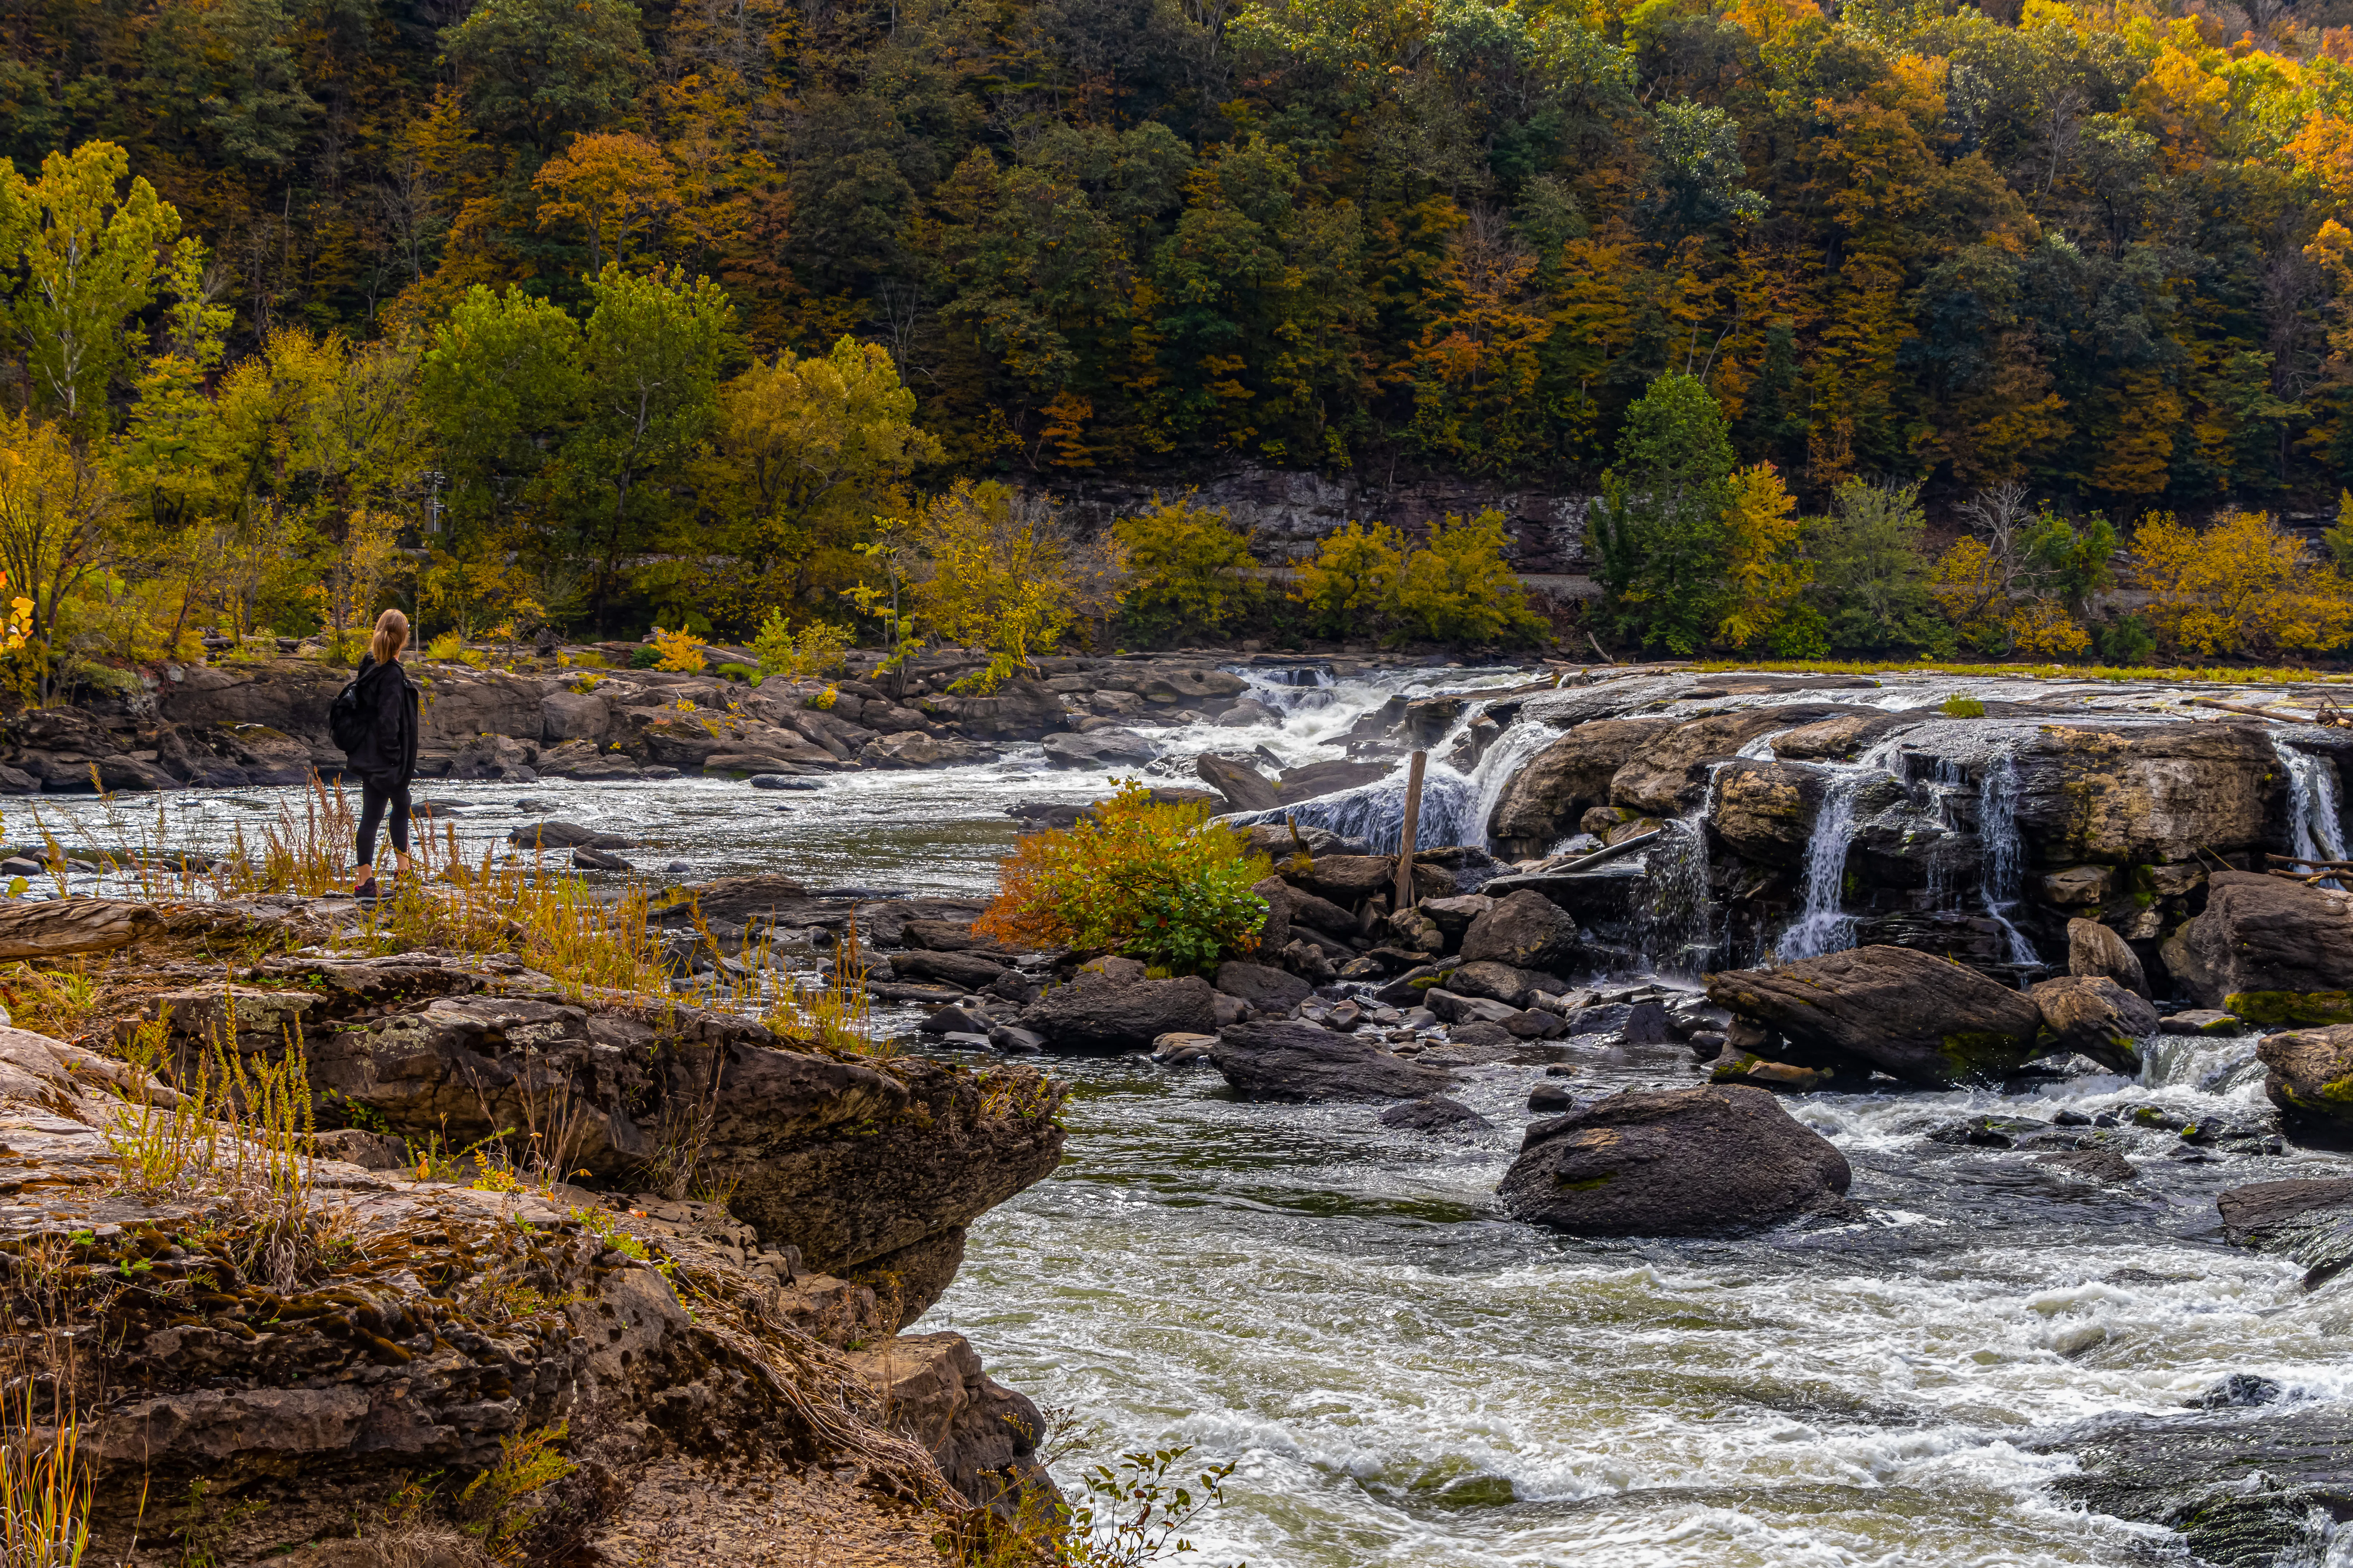
Known for its stunning canyons and white-water rafting, New River Gorge National Park has seen a surge in popularity since becoming a national park. The West Virginian submarkets that serve New River Gorge National Park include Beckley, Fayetteville, Hinton, Deming, and Marblemount.
- Average Daily Rate (ADR): $234
- Average occupancy rate: 48%
- Average home value: $146,582
- Annual revenue potential: $32,930
- Yield: 22.5%
Why Invest Here?
The park's re-designation as a national park in 2020 has significantly boosted tourism. Its year-round appeal for outdoor activities like rock climbing, hiking, and fishing ensures steady demand for short-term rentals (STRs). With a $146,582 property price tag and over $30,000 in earning potential, New River Gorge has the highest annual yield of all national parks at 22.5%
2. Mammoth Cave National Park, Kentucky
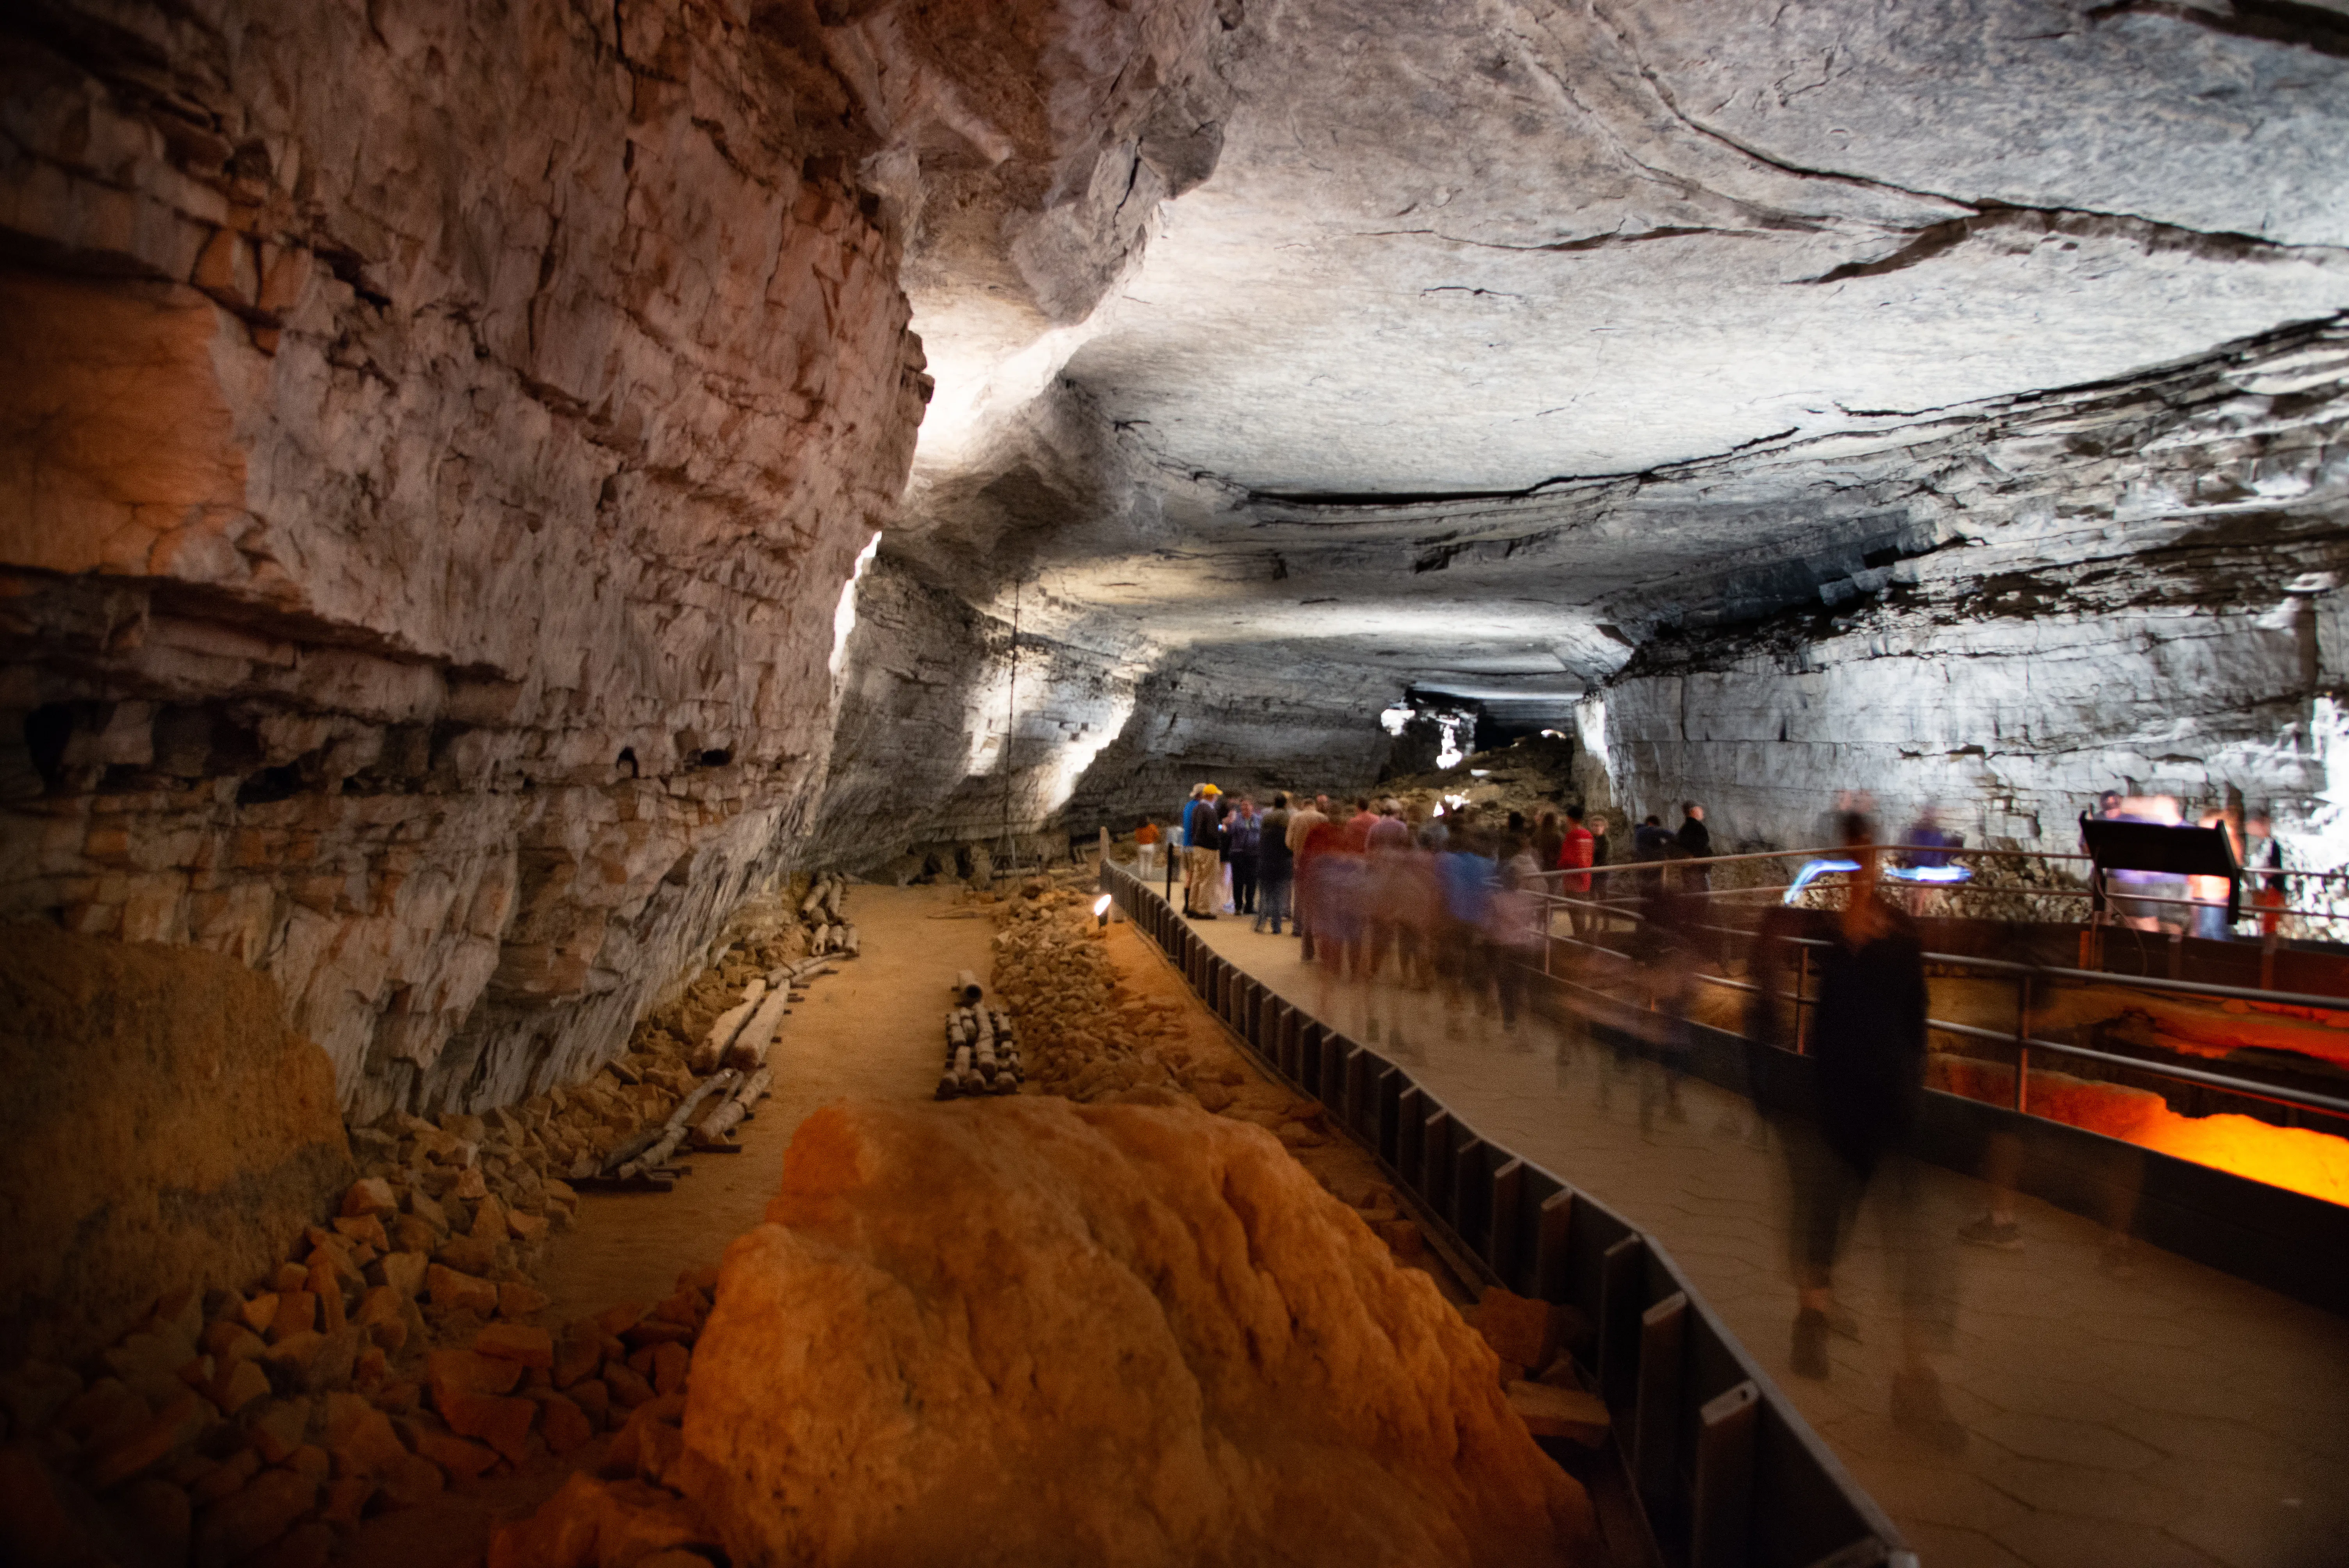
Mammoth Cave, the world's longest known cave system, attracts adventure seekers and nature enthusiasts. Mammoth Cave has just one submarket serving guests to the park: Nolin River Lake/Mammoth Lake.
- Average Daily Rate (ADR): $246
- Average occupancy rate: 48%
- Average home value: $195,189
- Annual revenue potential: $33,259
- Yield: 17.0%
Why Invest Here?
The park's unique cave tours and diverse recreational opportunities, including horseback riding and kayaking, make it a popular destination. Proximity to Bowling Green also boosts its attractiveness for weekend getaways. Mammoth Cave National Park submarkets offer one of the lowest investment hurdles of the top 10 list behind New River Gorge National Park. Investors can get a slice of the STR profit pie at less than $200,000.
3. Voyageurs National Park, Minnesota
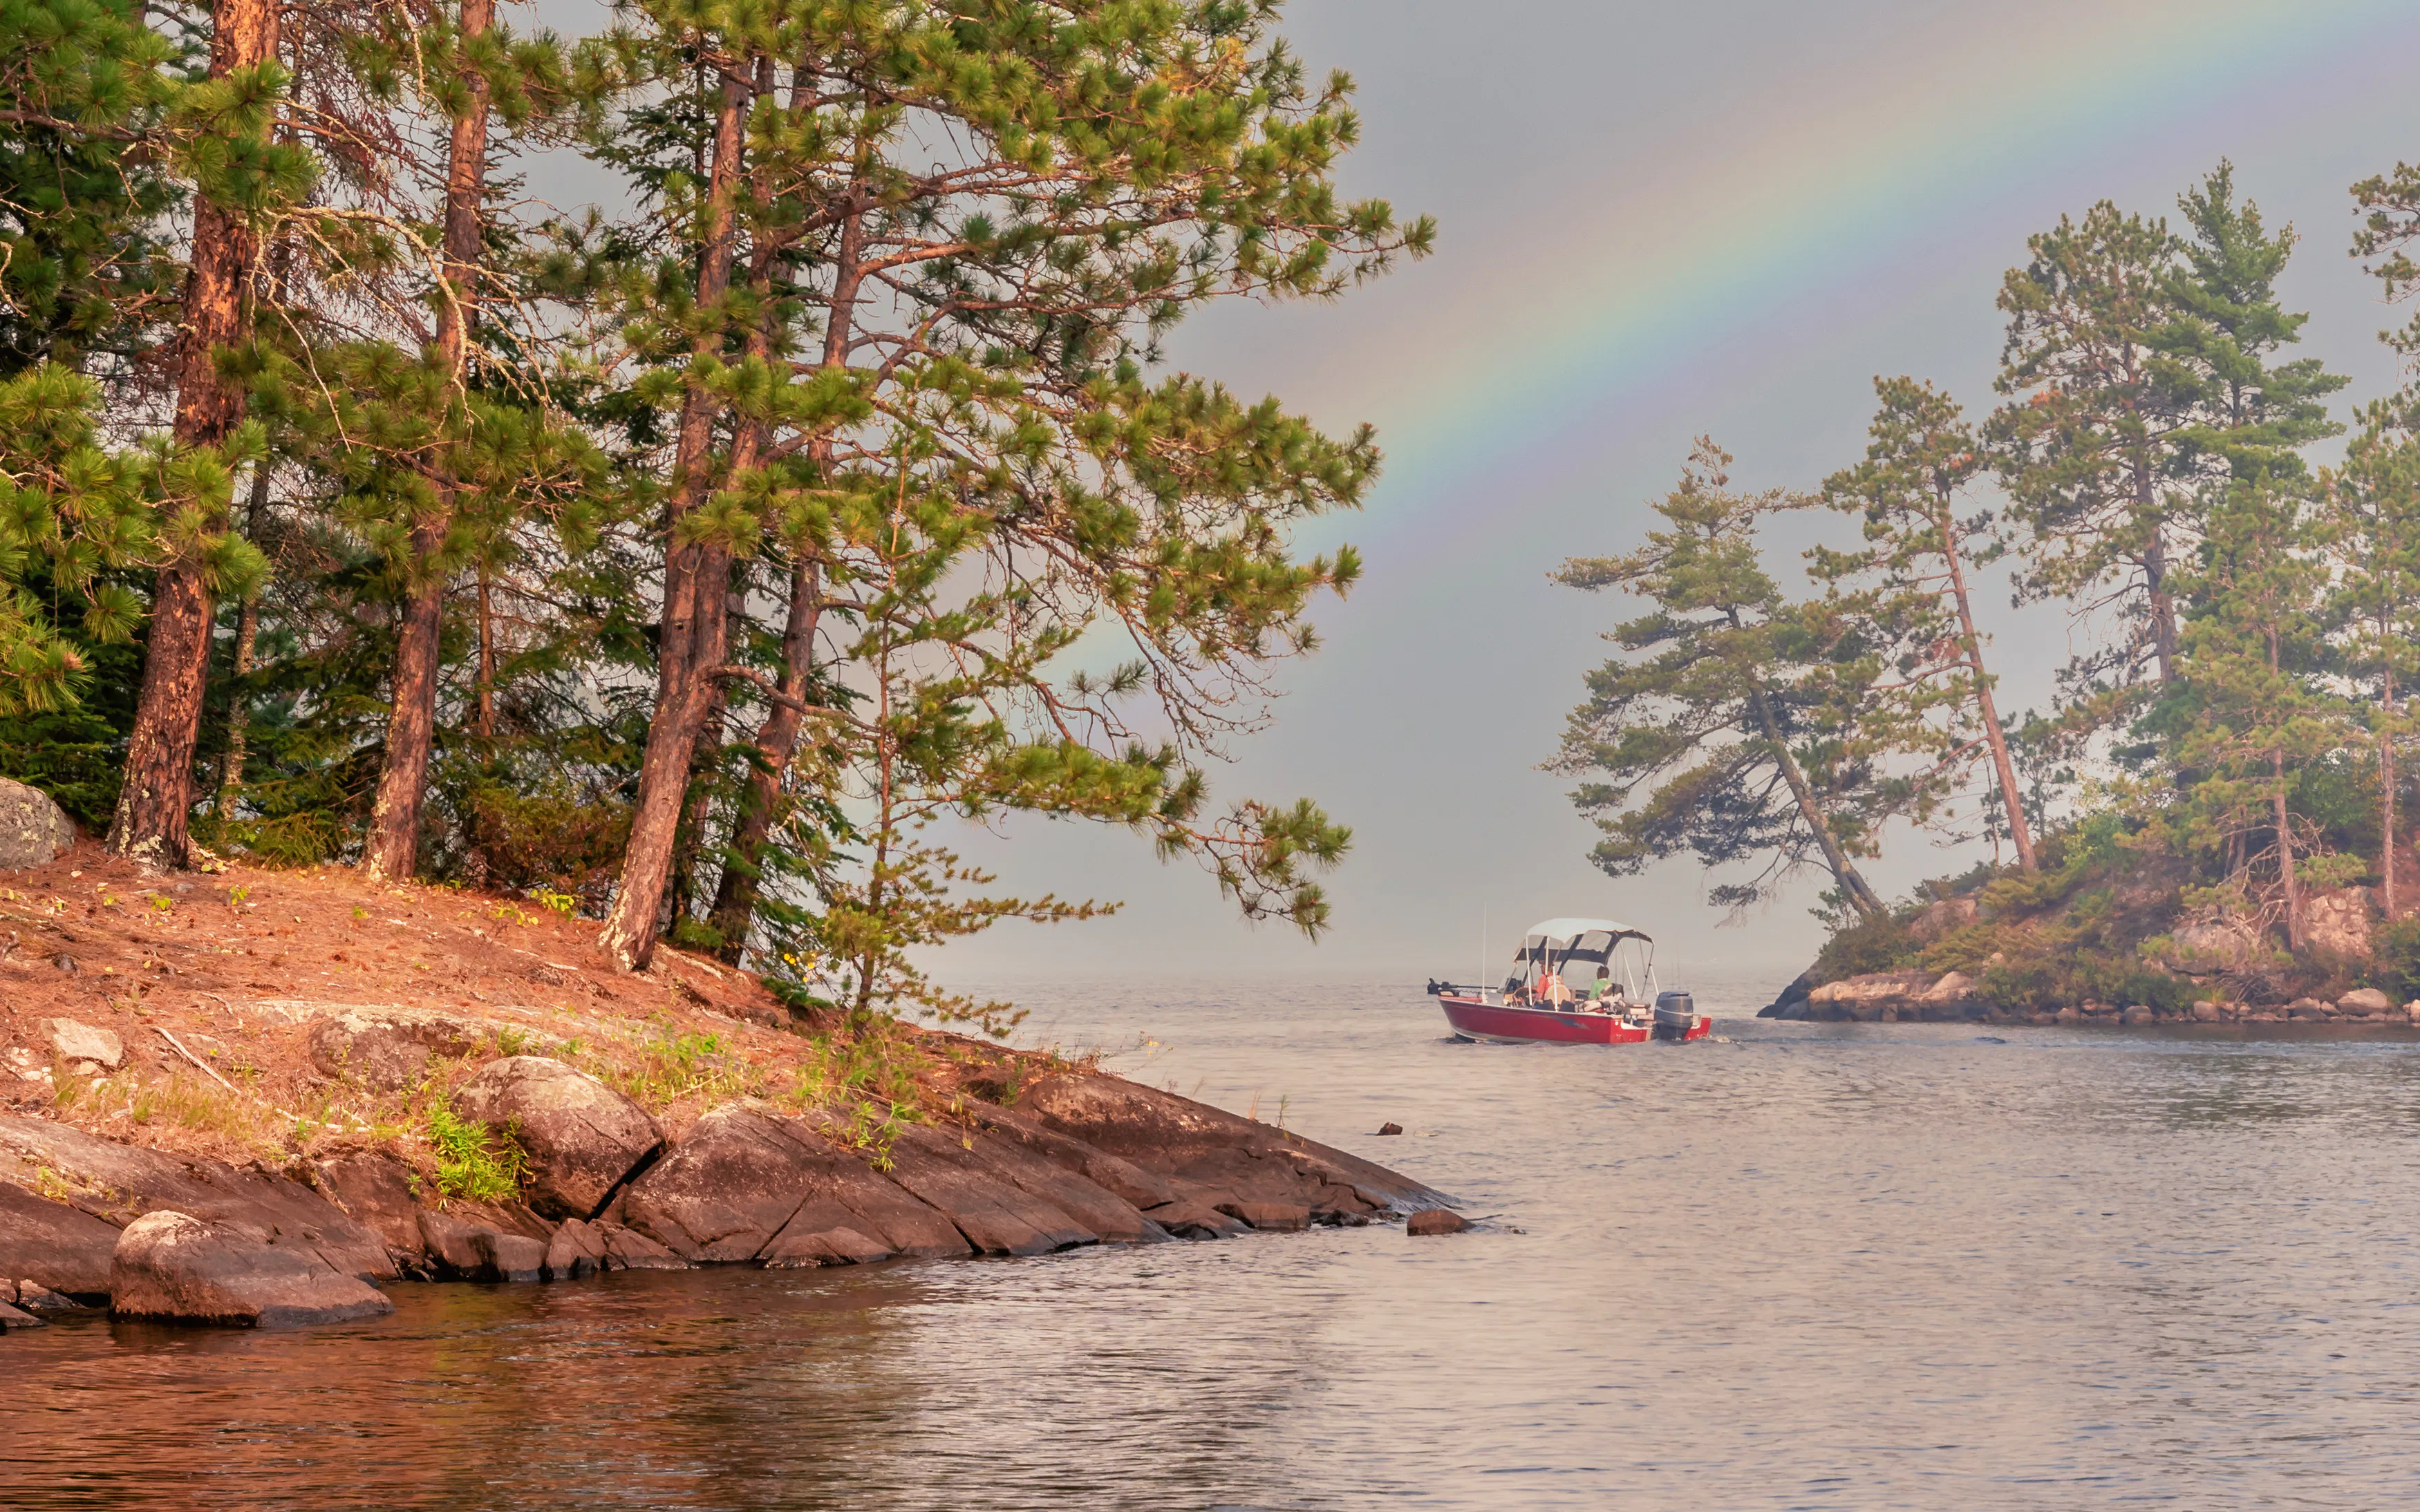
Known for its water-based activities and stunning night skies, Voyageurs National Park offers a unique wilderness experience. Boundary Water, Minnesota is the submarket that hosts travelers visiting Voyageurs National Park.
- Average Daily Rate (ADR): $312
- Average occupancy rate: 53%
- Average home value: $256,642
- Annual revenue potential: $39,537
- Yield: 15.4%
Why Invest Here?
The park's remote location and emphasis on boating, fishing, and stargazing attracts a steady stream of visitors looking for an immersive natural experience. Its relative seclusion ensures high demand for well-appointed STRs at a premium average nightly rate of $312.
4. Isle Royale National Park, Michigan
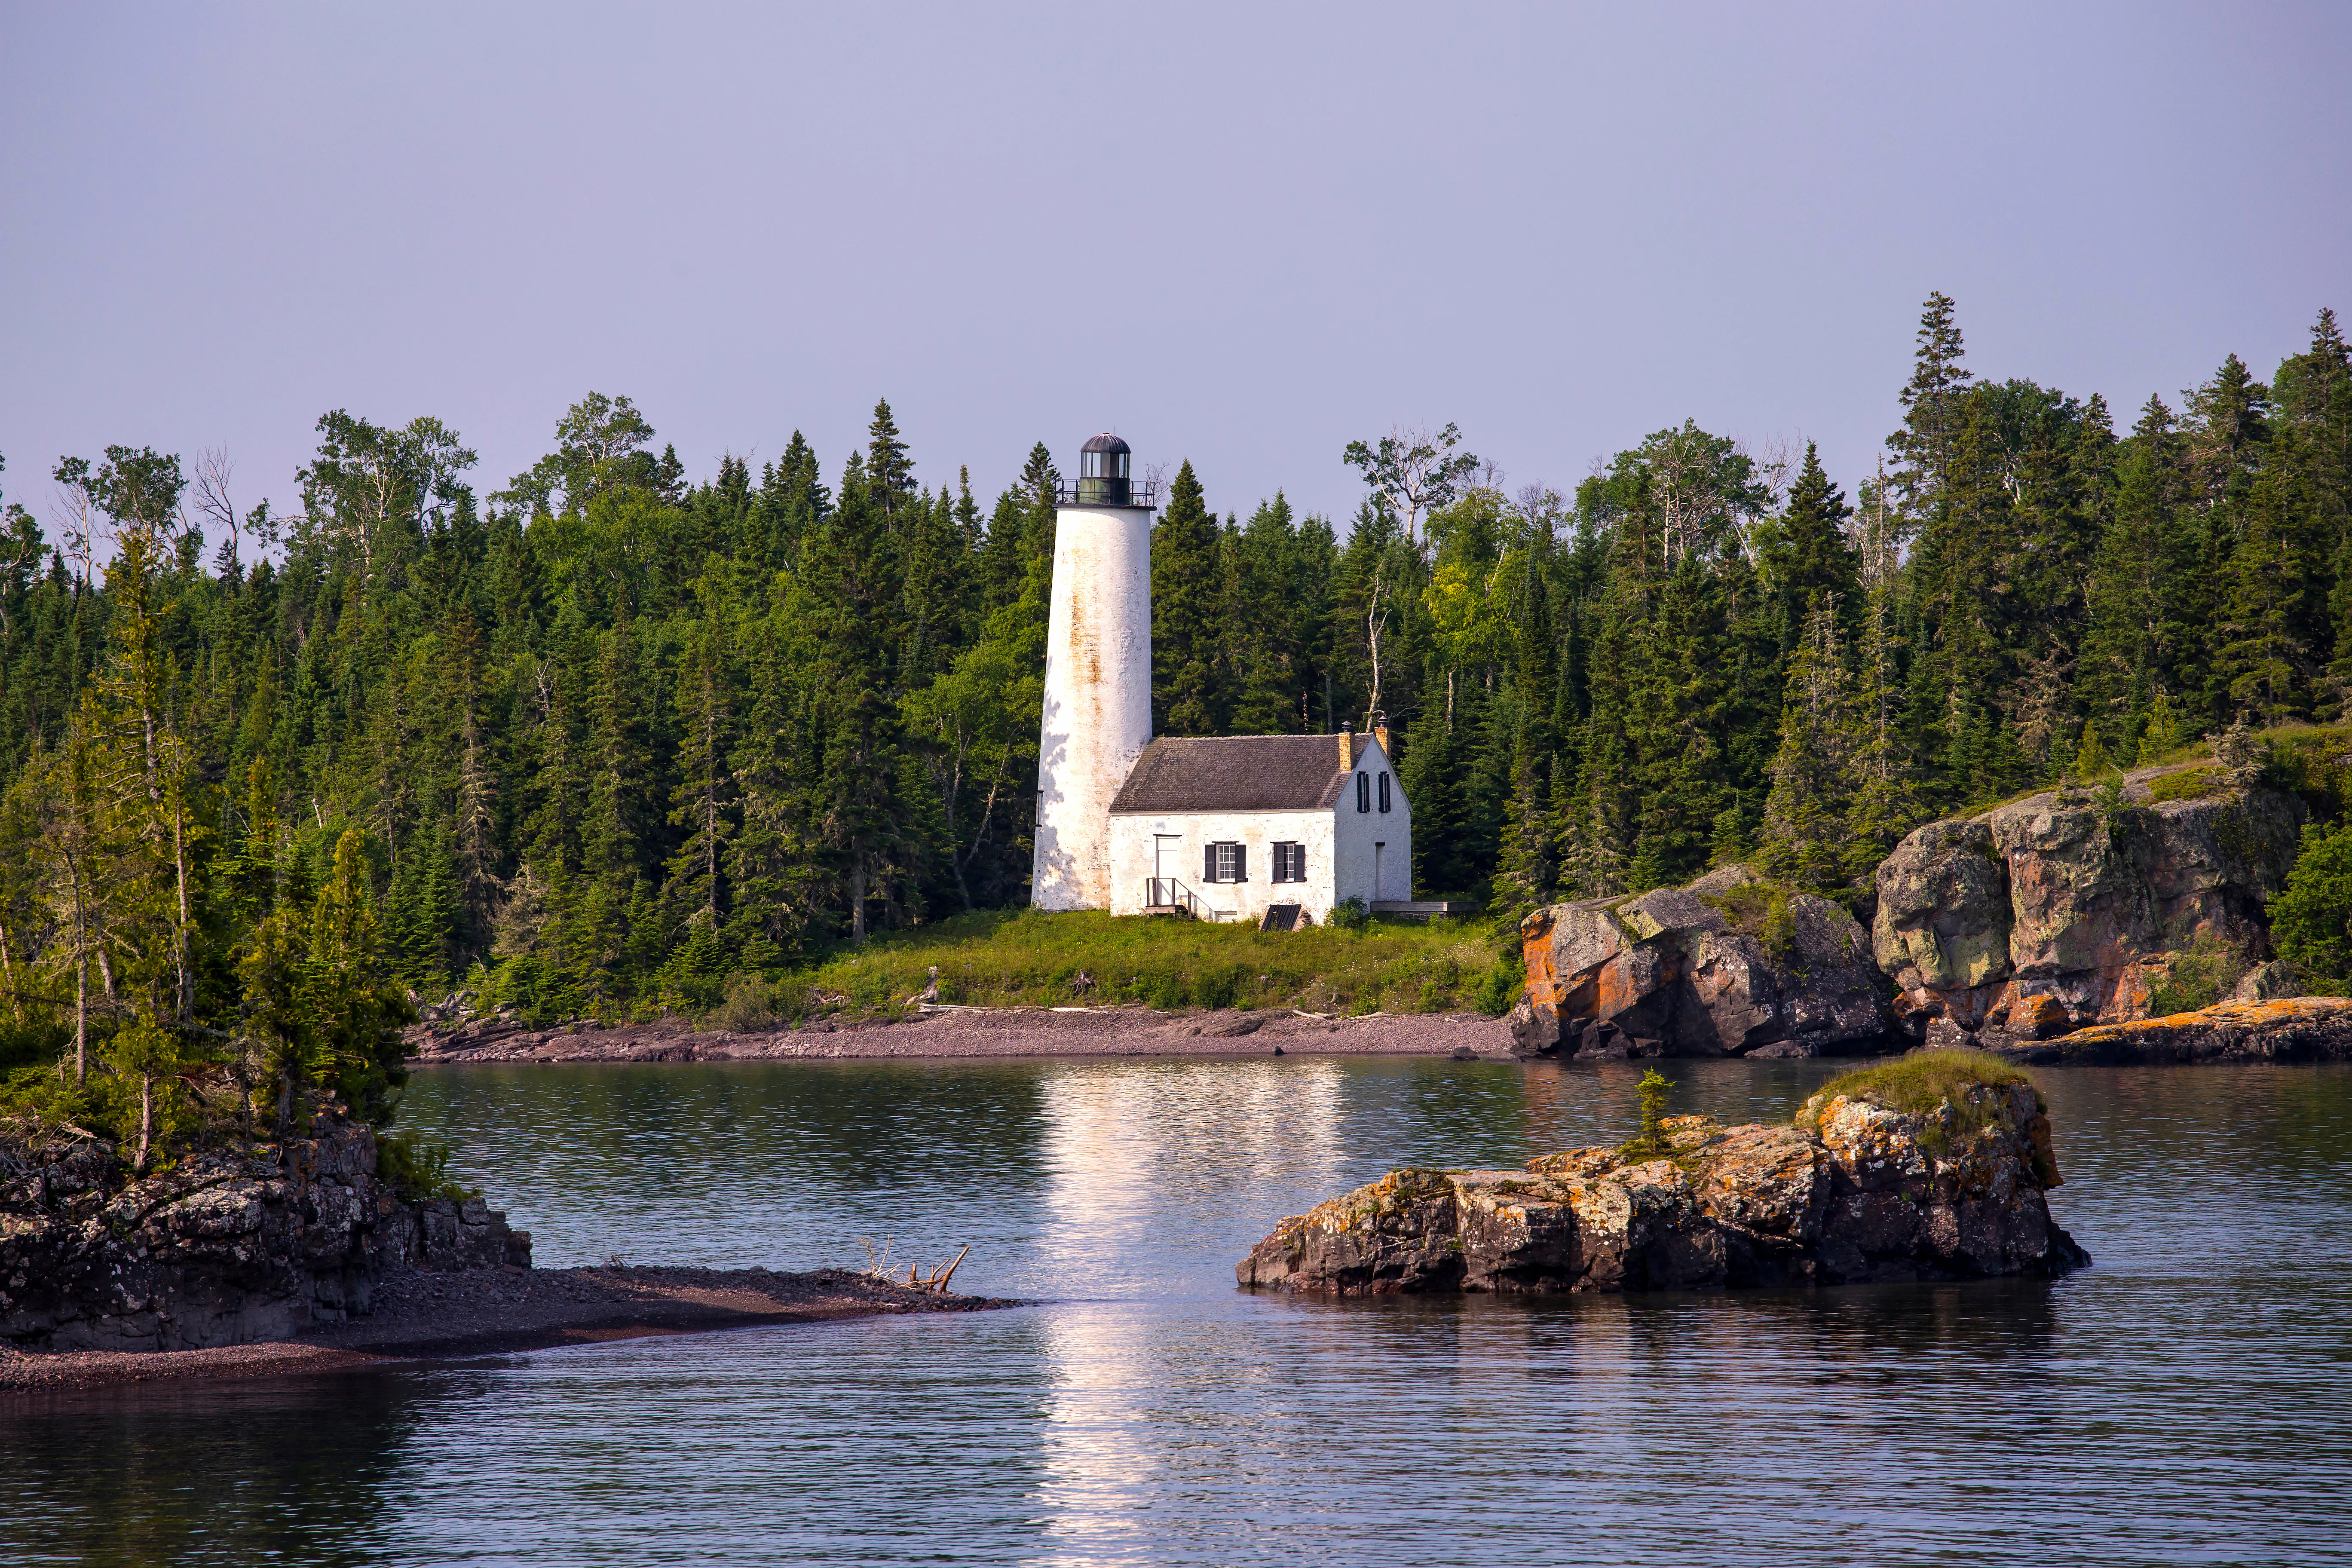
This island park in Lake Superior is a haven for backpackers, boaters, and scuba divers. The 3 submarkets serving visitors to Isle Royale National Park are Copper Island, Houghton, and Grand Marais.
- Average Daily Rate (ADR): $284
- Average occupancy rate: 50%
- Average home value: $320,349
- Annual revenue potential: $47,310
- Yield: 14.8%
Why Invest Here?
Isle Royale’s unique island ecosystem and limited visitor access create high demand for available accommodations. The park's appeal to adventure seekers and nature lovers makes it a lucrative market for STR investments.
5. Joshua Tree National Park, California
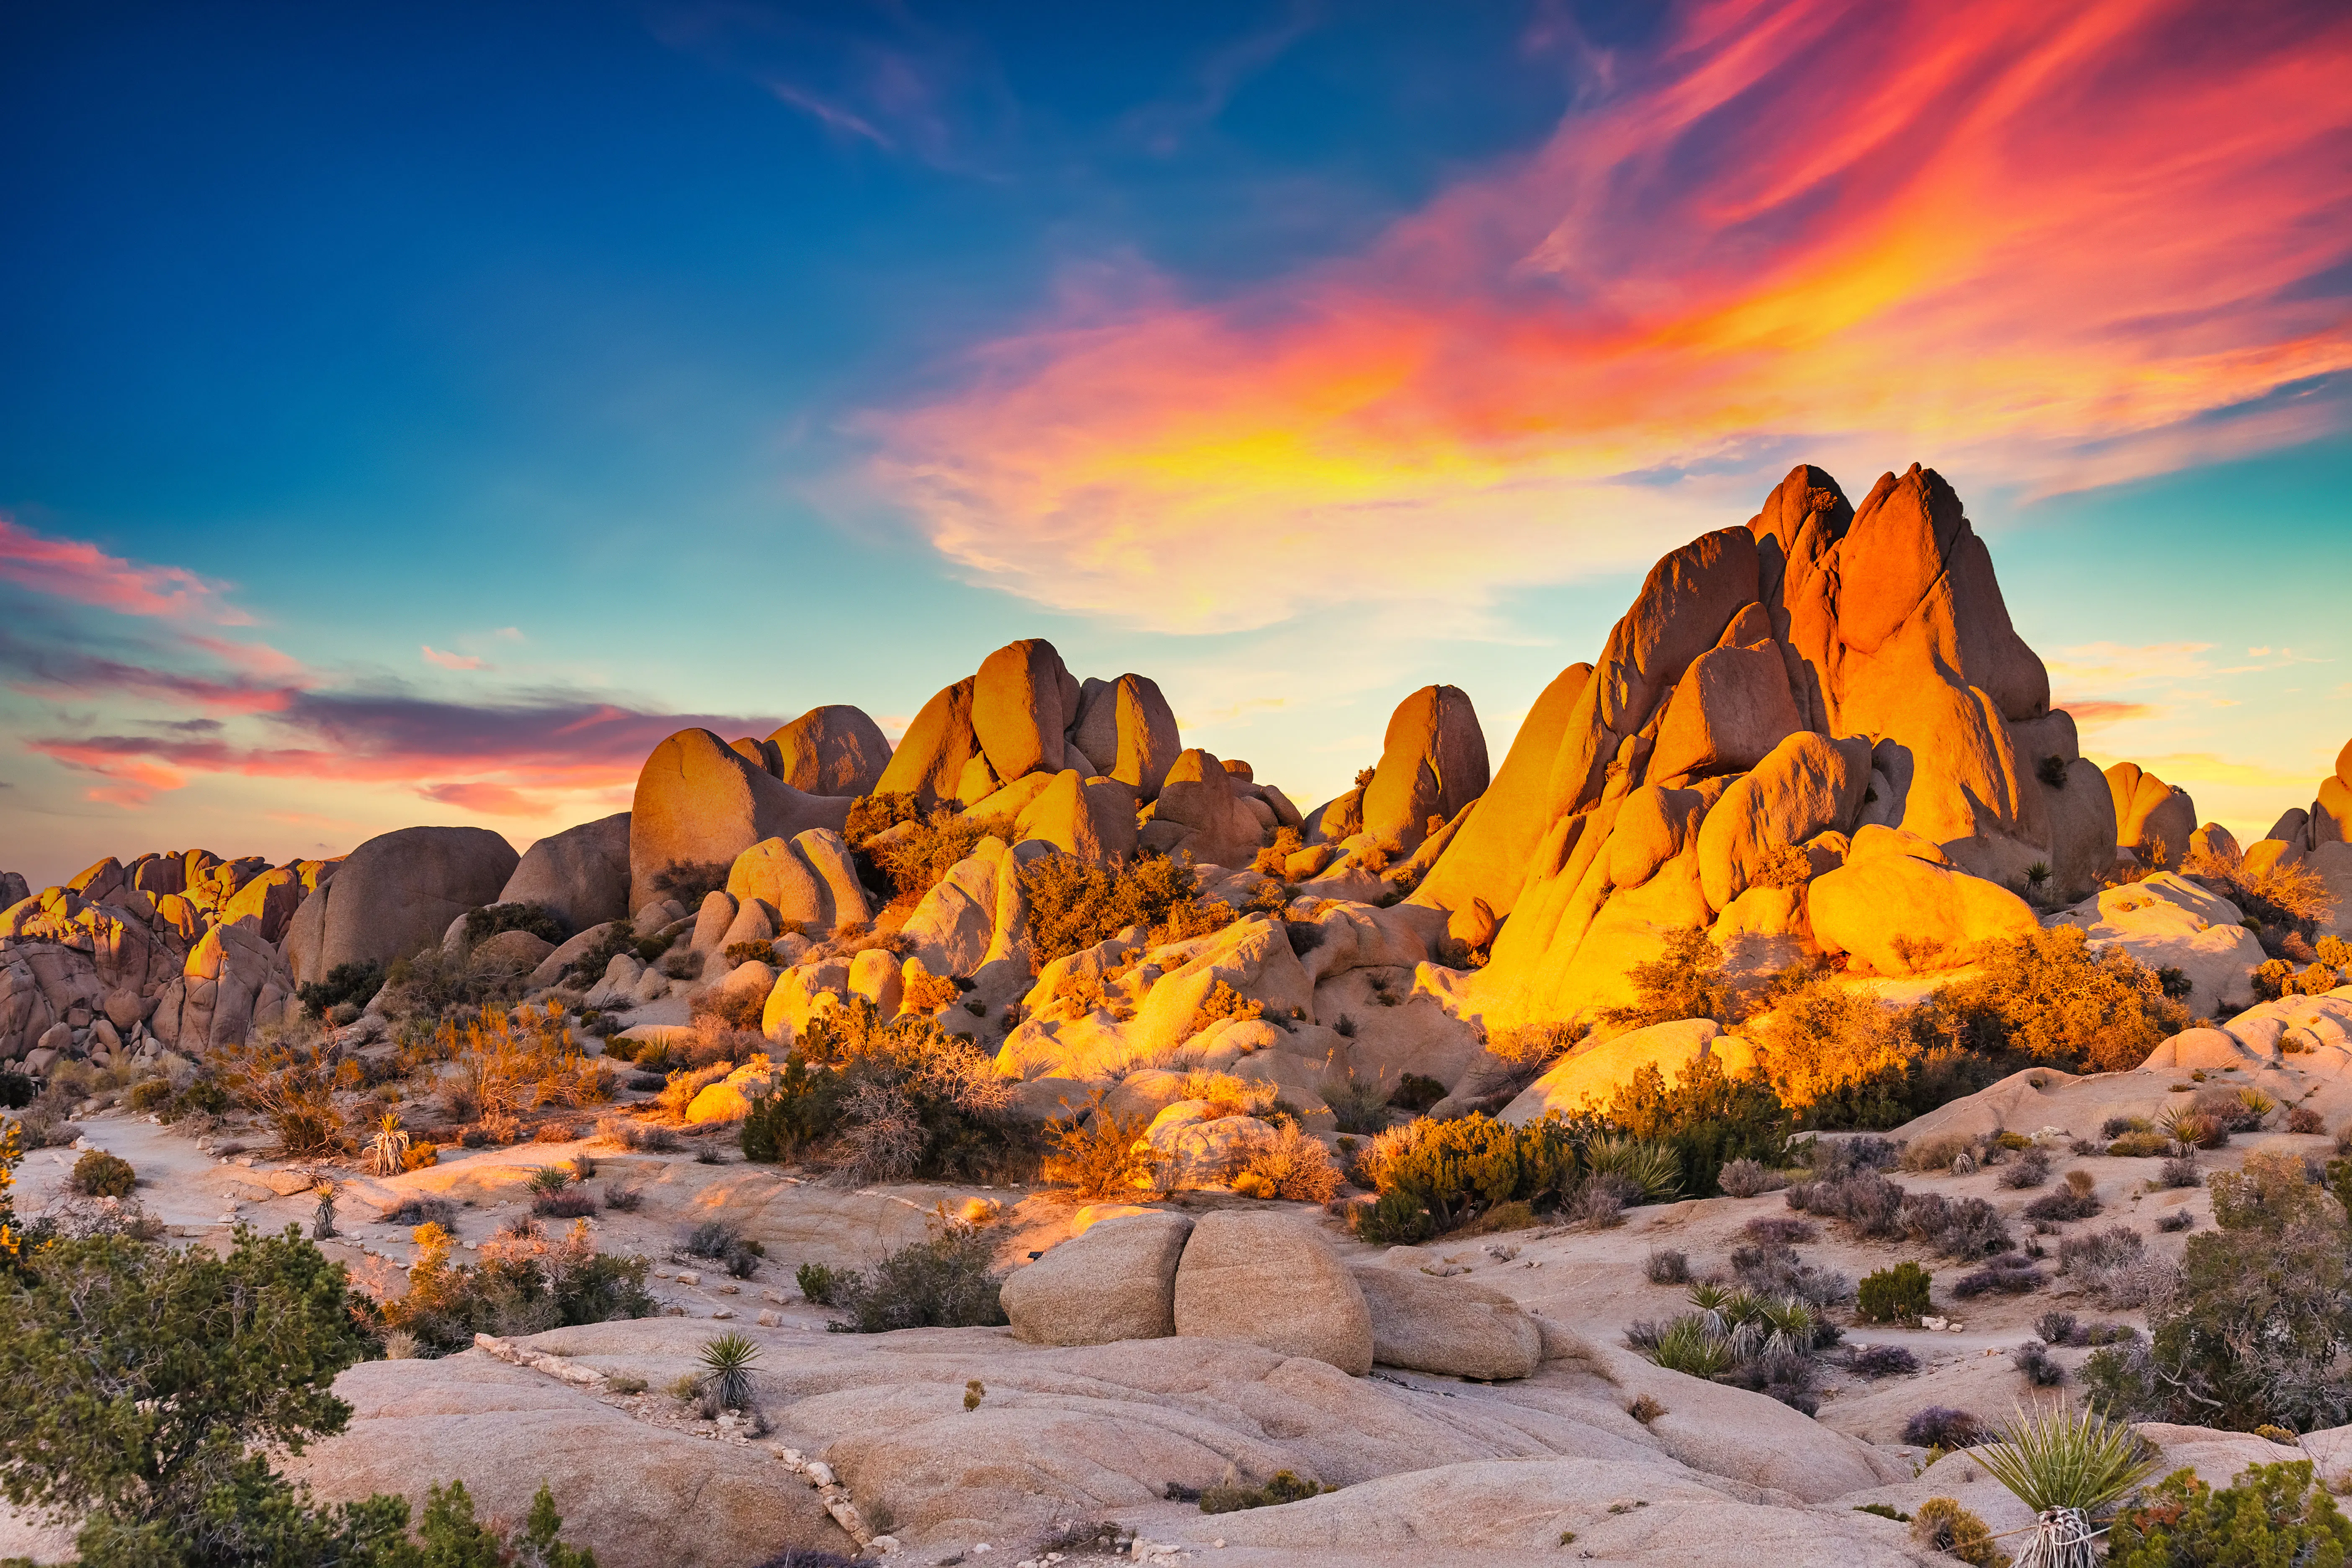
Known for its unique desert landscapes and iconic Joshua trees, Joshua Tree National Park has become increasingly popular, especially among millennials and outdoor enthusiasts. The short-term rental submarkets in proximity to this park are Joshua Tree, Landers, Morongo Valley, Pioneertown, Twentynine Palms, and Yucca Valley.
- Average Daily Rate (ADR): $318
- Average occupancy rate: 51%
- Average home value: $345,335
- Annual revenue potential: $50,545
- Yield: 14.6%
Why Invest Here?
The park's popularity has surged in recent years, partly due to its proximity to Los Angeles and its reputation as a prime spot for stargazing, rock climbing, and music festivals. Despite relatively high home prices compared to other national park Airbnb markets on this list, $345,335 is still well below the typical home value for the state of California ($806,674). The distinctive desert environment of Joshua Tree attracts artists, photographers, and nature lovers, creating a diverse and constant demand for accommodation.
6. Indiana Dunes National Park, Indiana
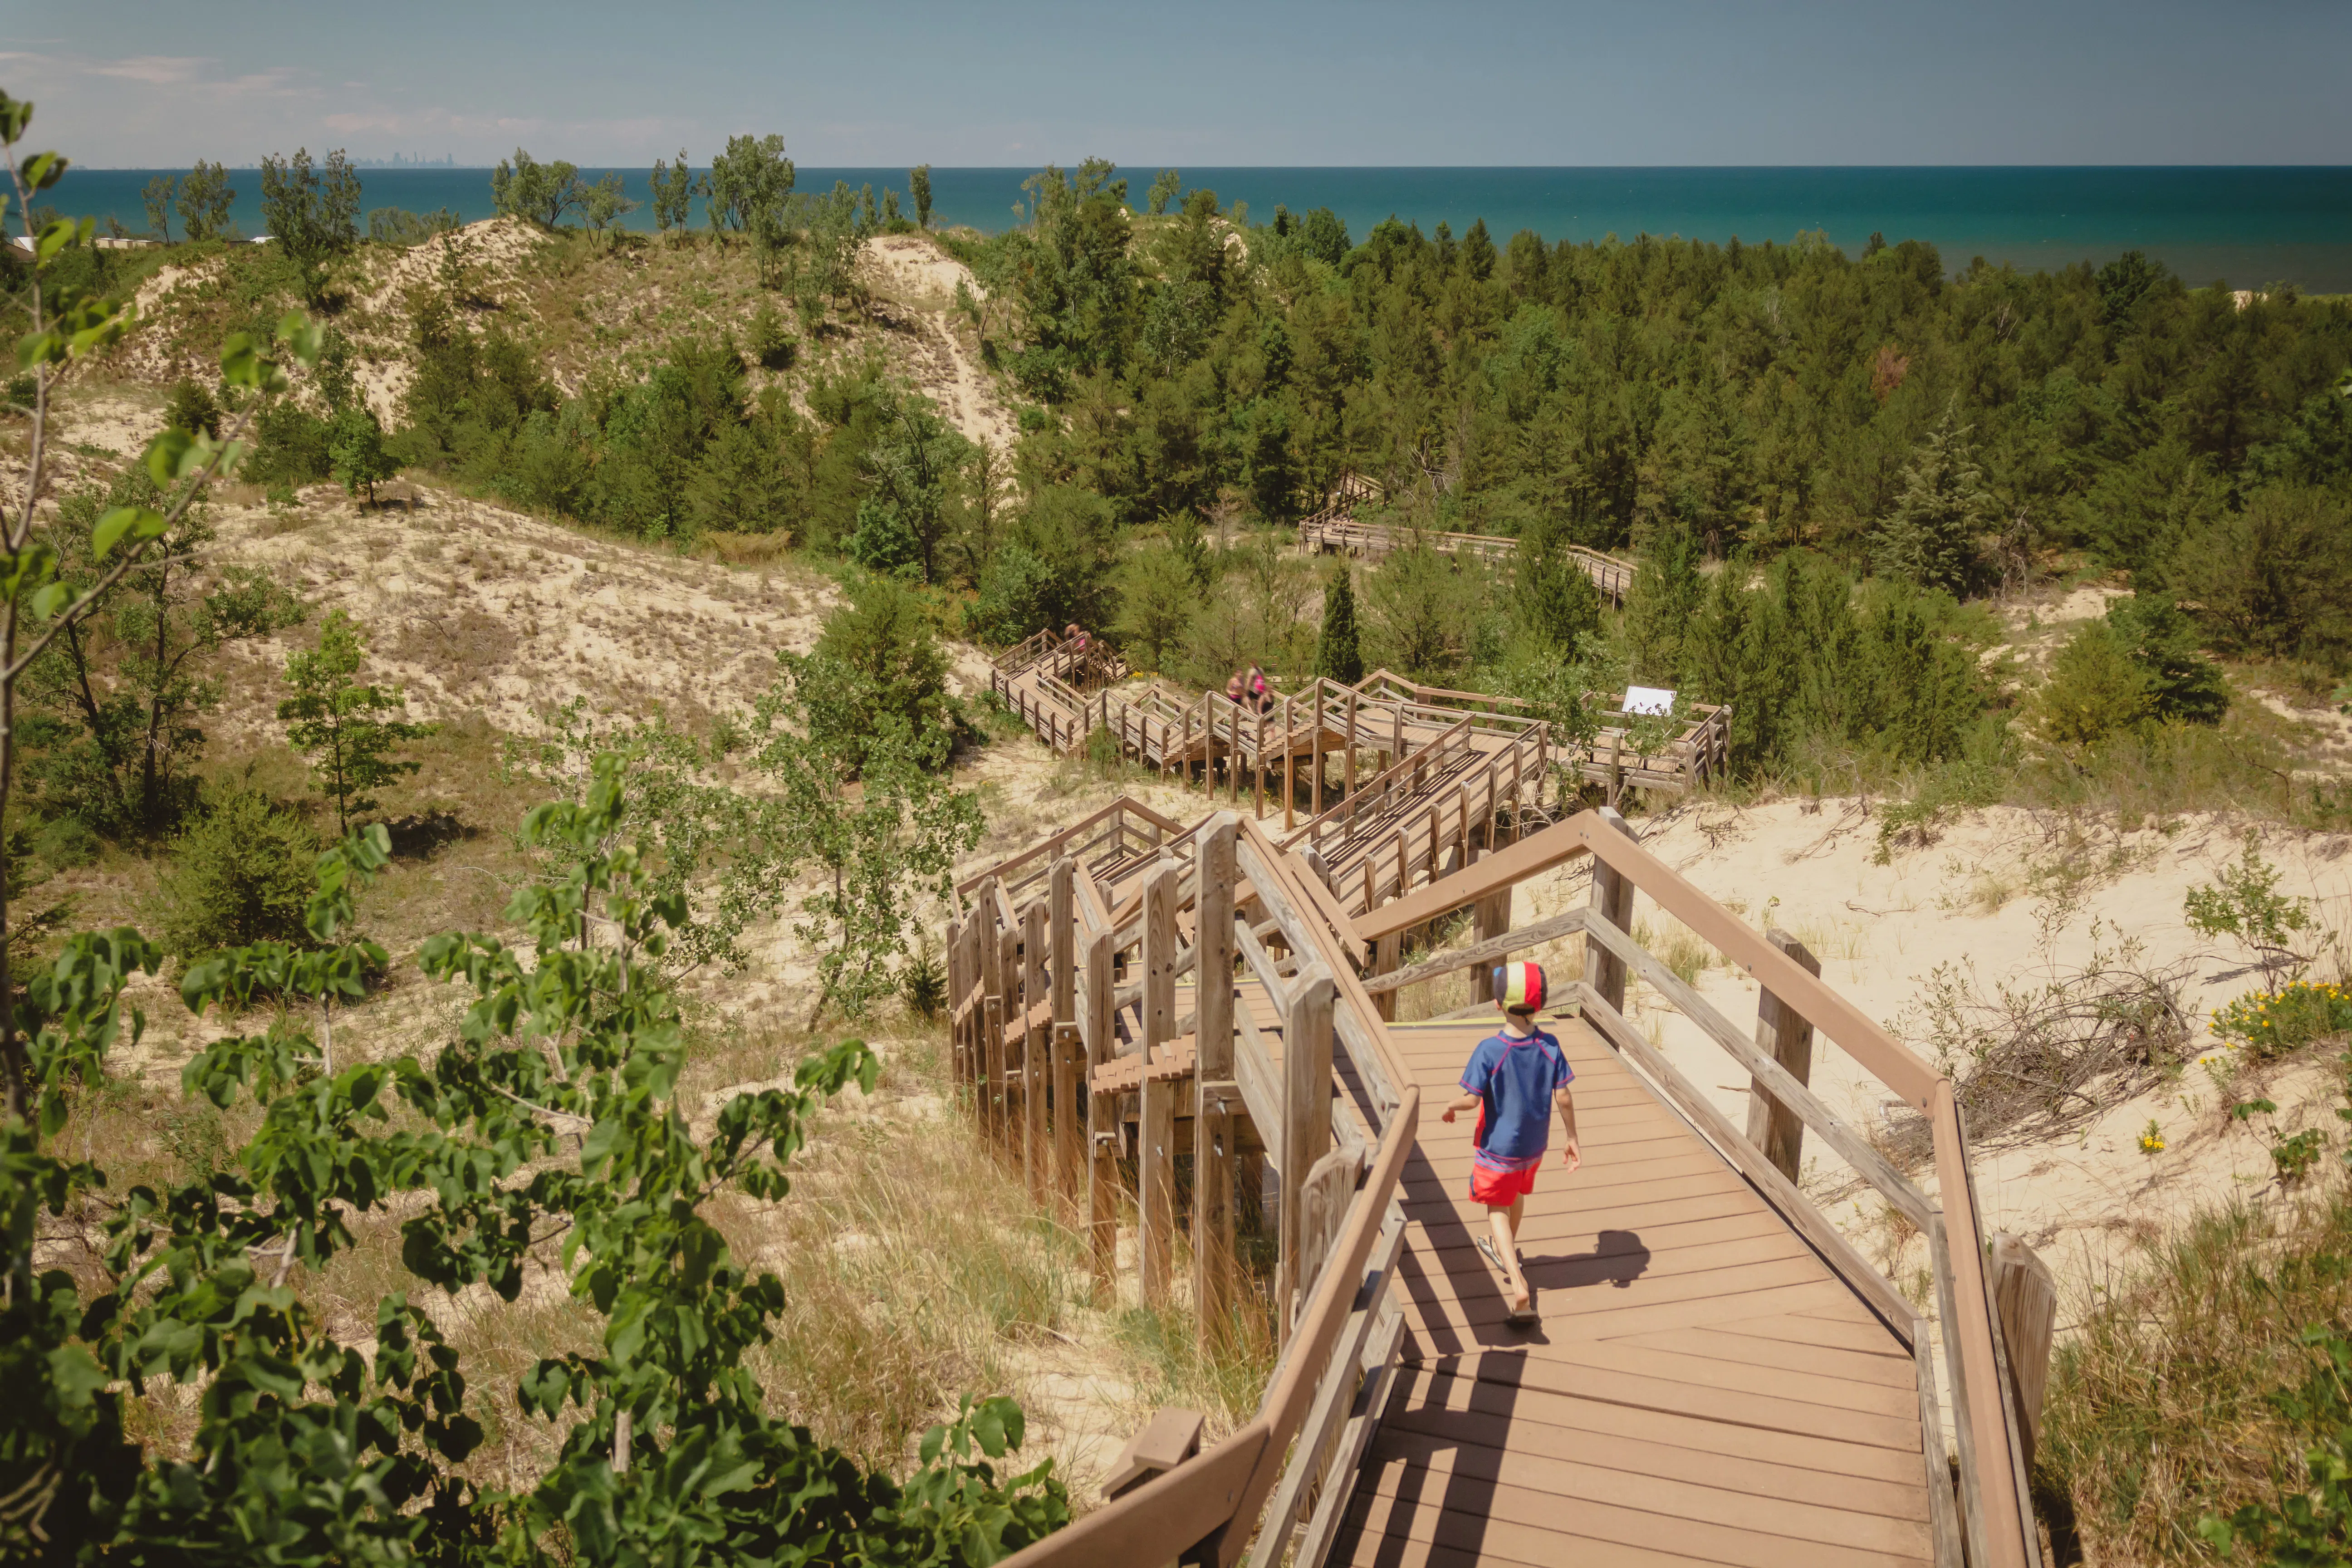
Located on the southern shore of Lake Michigan, Indiana Dunes offers a blend of beaches and biodiversity. Guests traveling to Indiana Dunes National Park are likely staying in the submarkets of Gary and Michigan City.
- Average Daily Rate (ADR): $326
- Average occupancy rate: 47%
- Average home value: $268,048
- Annual revenue potential: $38,757
- Yield: 14.5%
Why Invest Here?
The park's easy accessibility from Chicago and other Midwest cities, combined with its mix of beach and forest landscapes, attracts a variety of visitors. The high demand during the summer months and growing popularity in other seasons make it a strong market for STRs. The Indiana Dunes National Park market boasts the highest average ADR of the national parks on this list at $326 per night.
7. Hawaii Volcanoes National Park, Hawaii
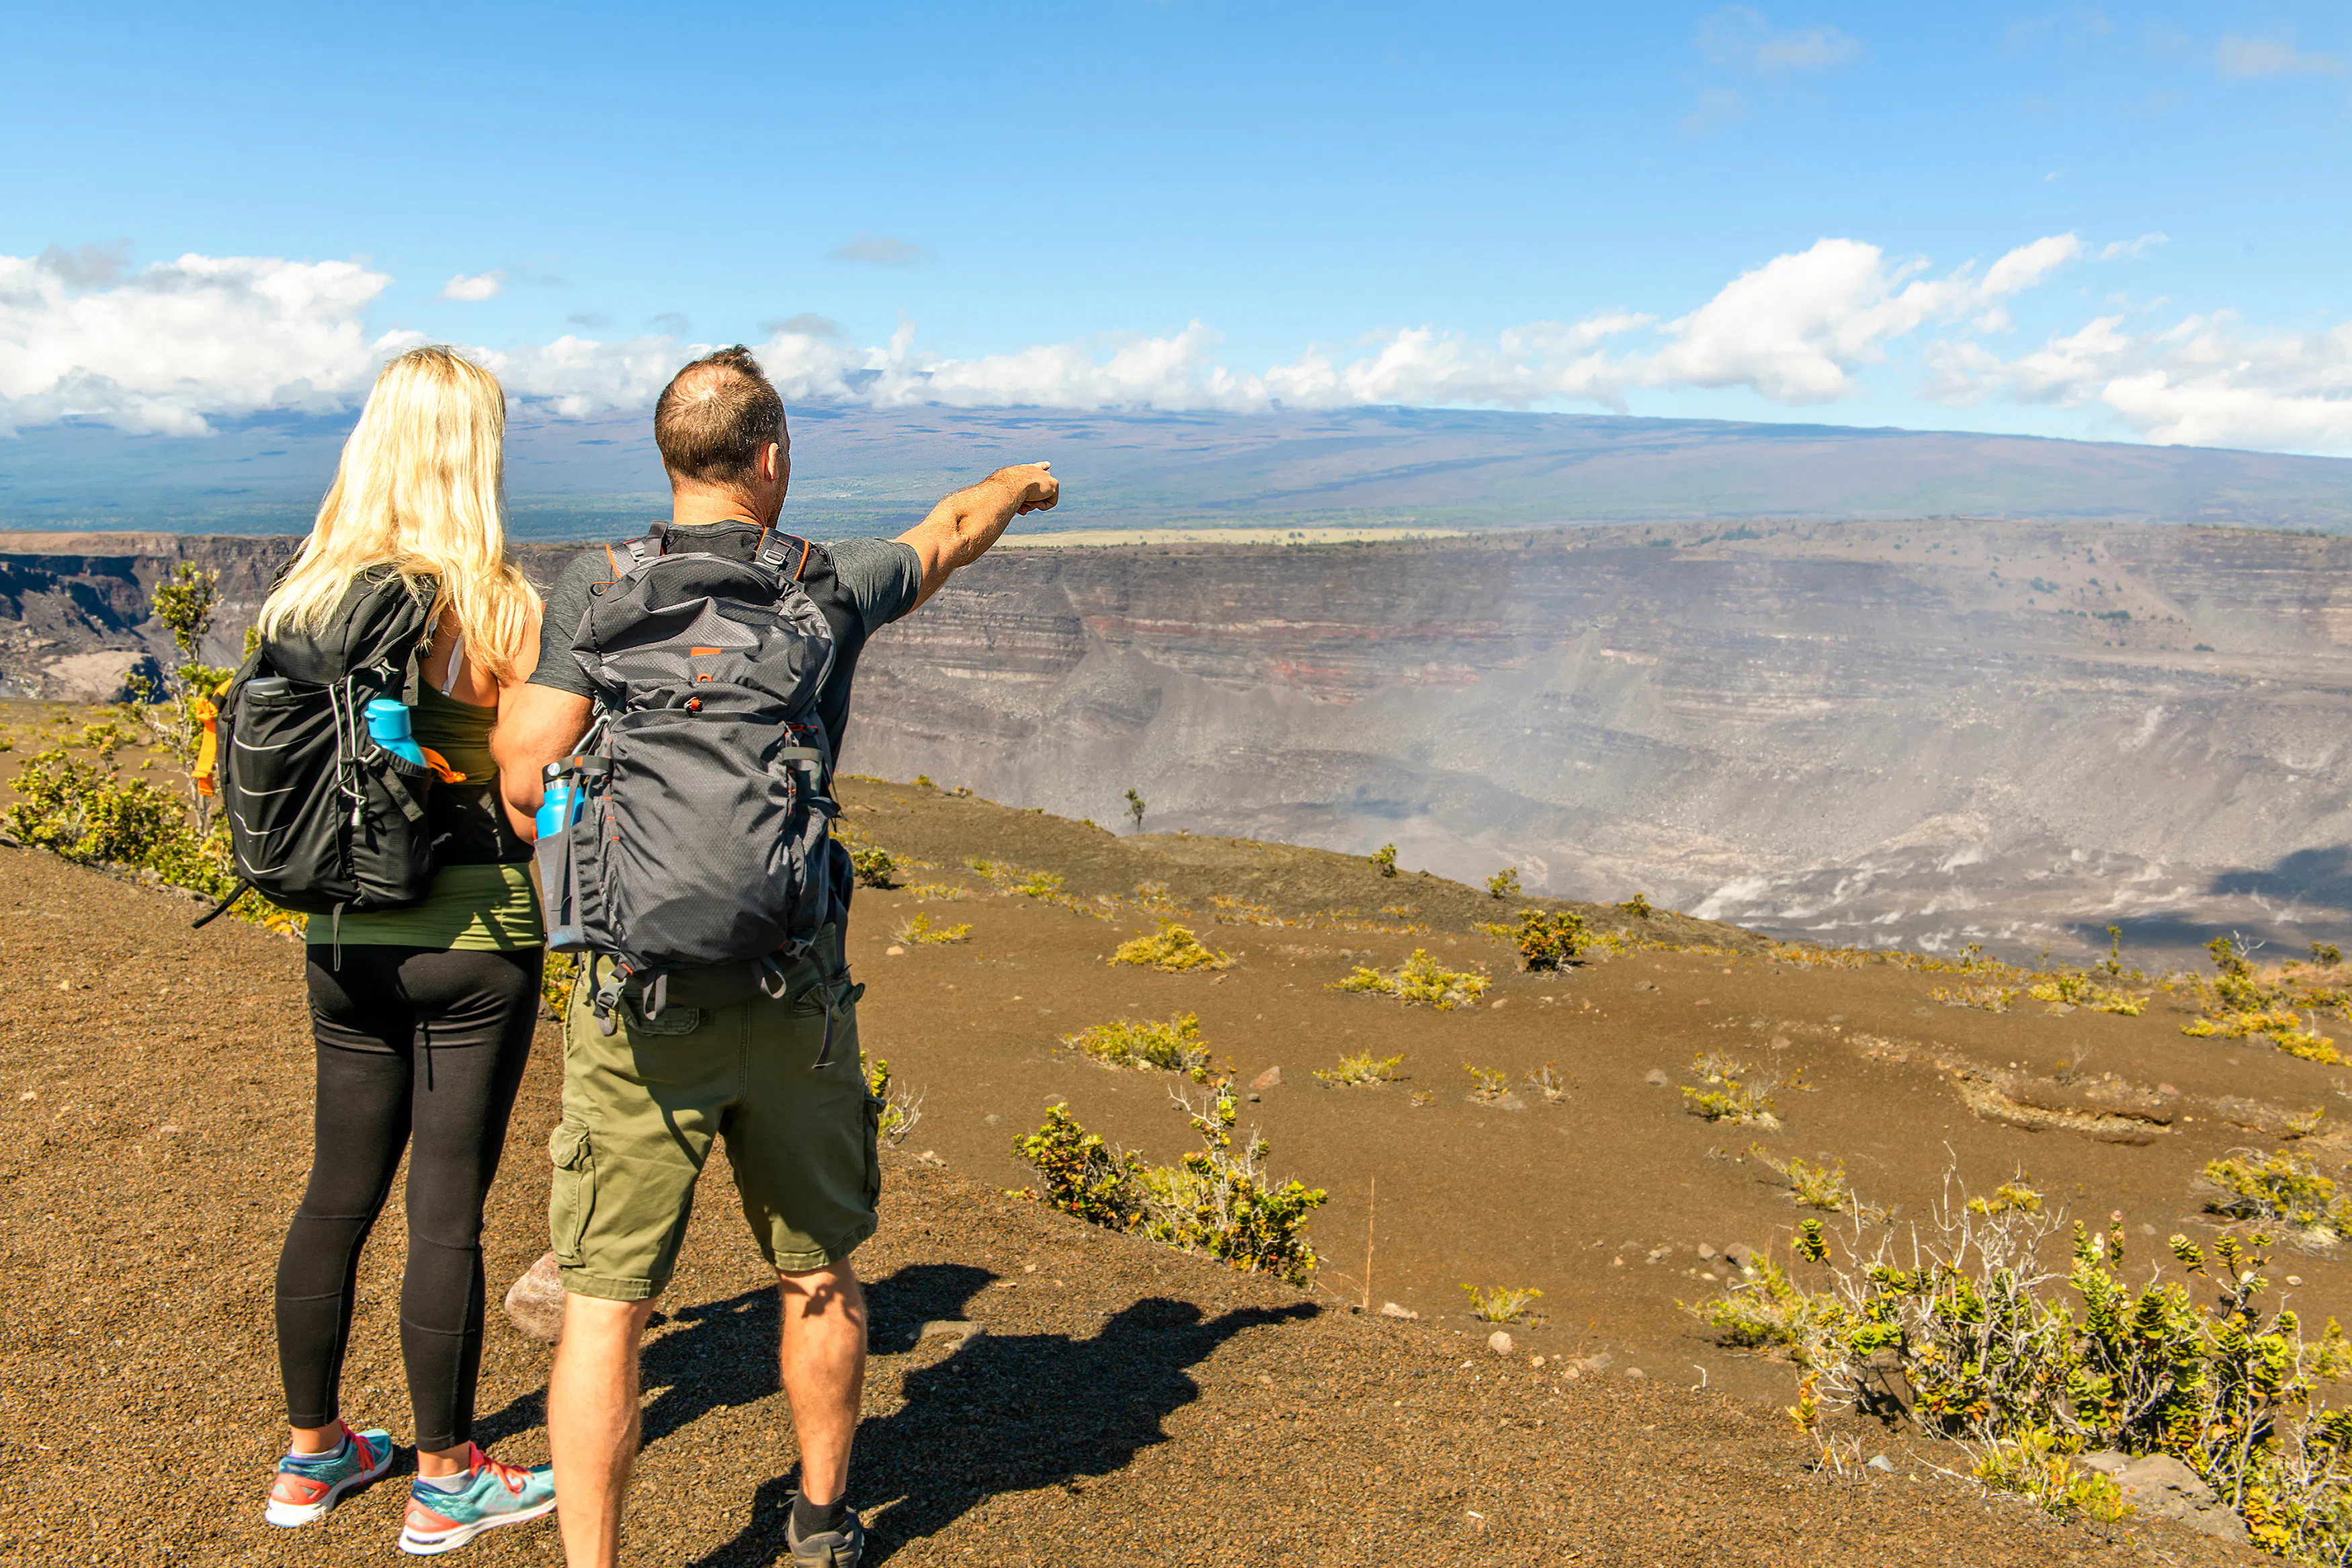
This park offers a unique opportunity to witness active volcanic activity along with lush tropical landscapes. The Volcano submarket is the main STR market serving visitors to this park.
- Average Daily Rate (ADR): $216
- Average occupancy rate: 59%
- Average home value: $271,009
- Annual revenue potential: $38,460
- Yield: 14.2%
Why Invest Here?
The park's unique volcanic landscapes and cultural significance draw visitors from around the world. The steady stream of international tourists, combined with the year-round appeal of Hawaii, ensures a consistently high-performing STR market.
8. Badlands and Wind Cave National Parks, South Dakota
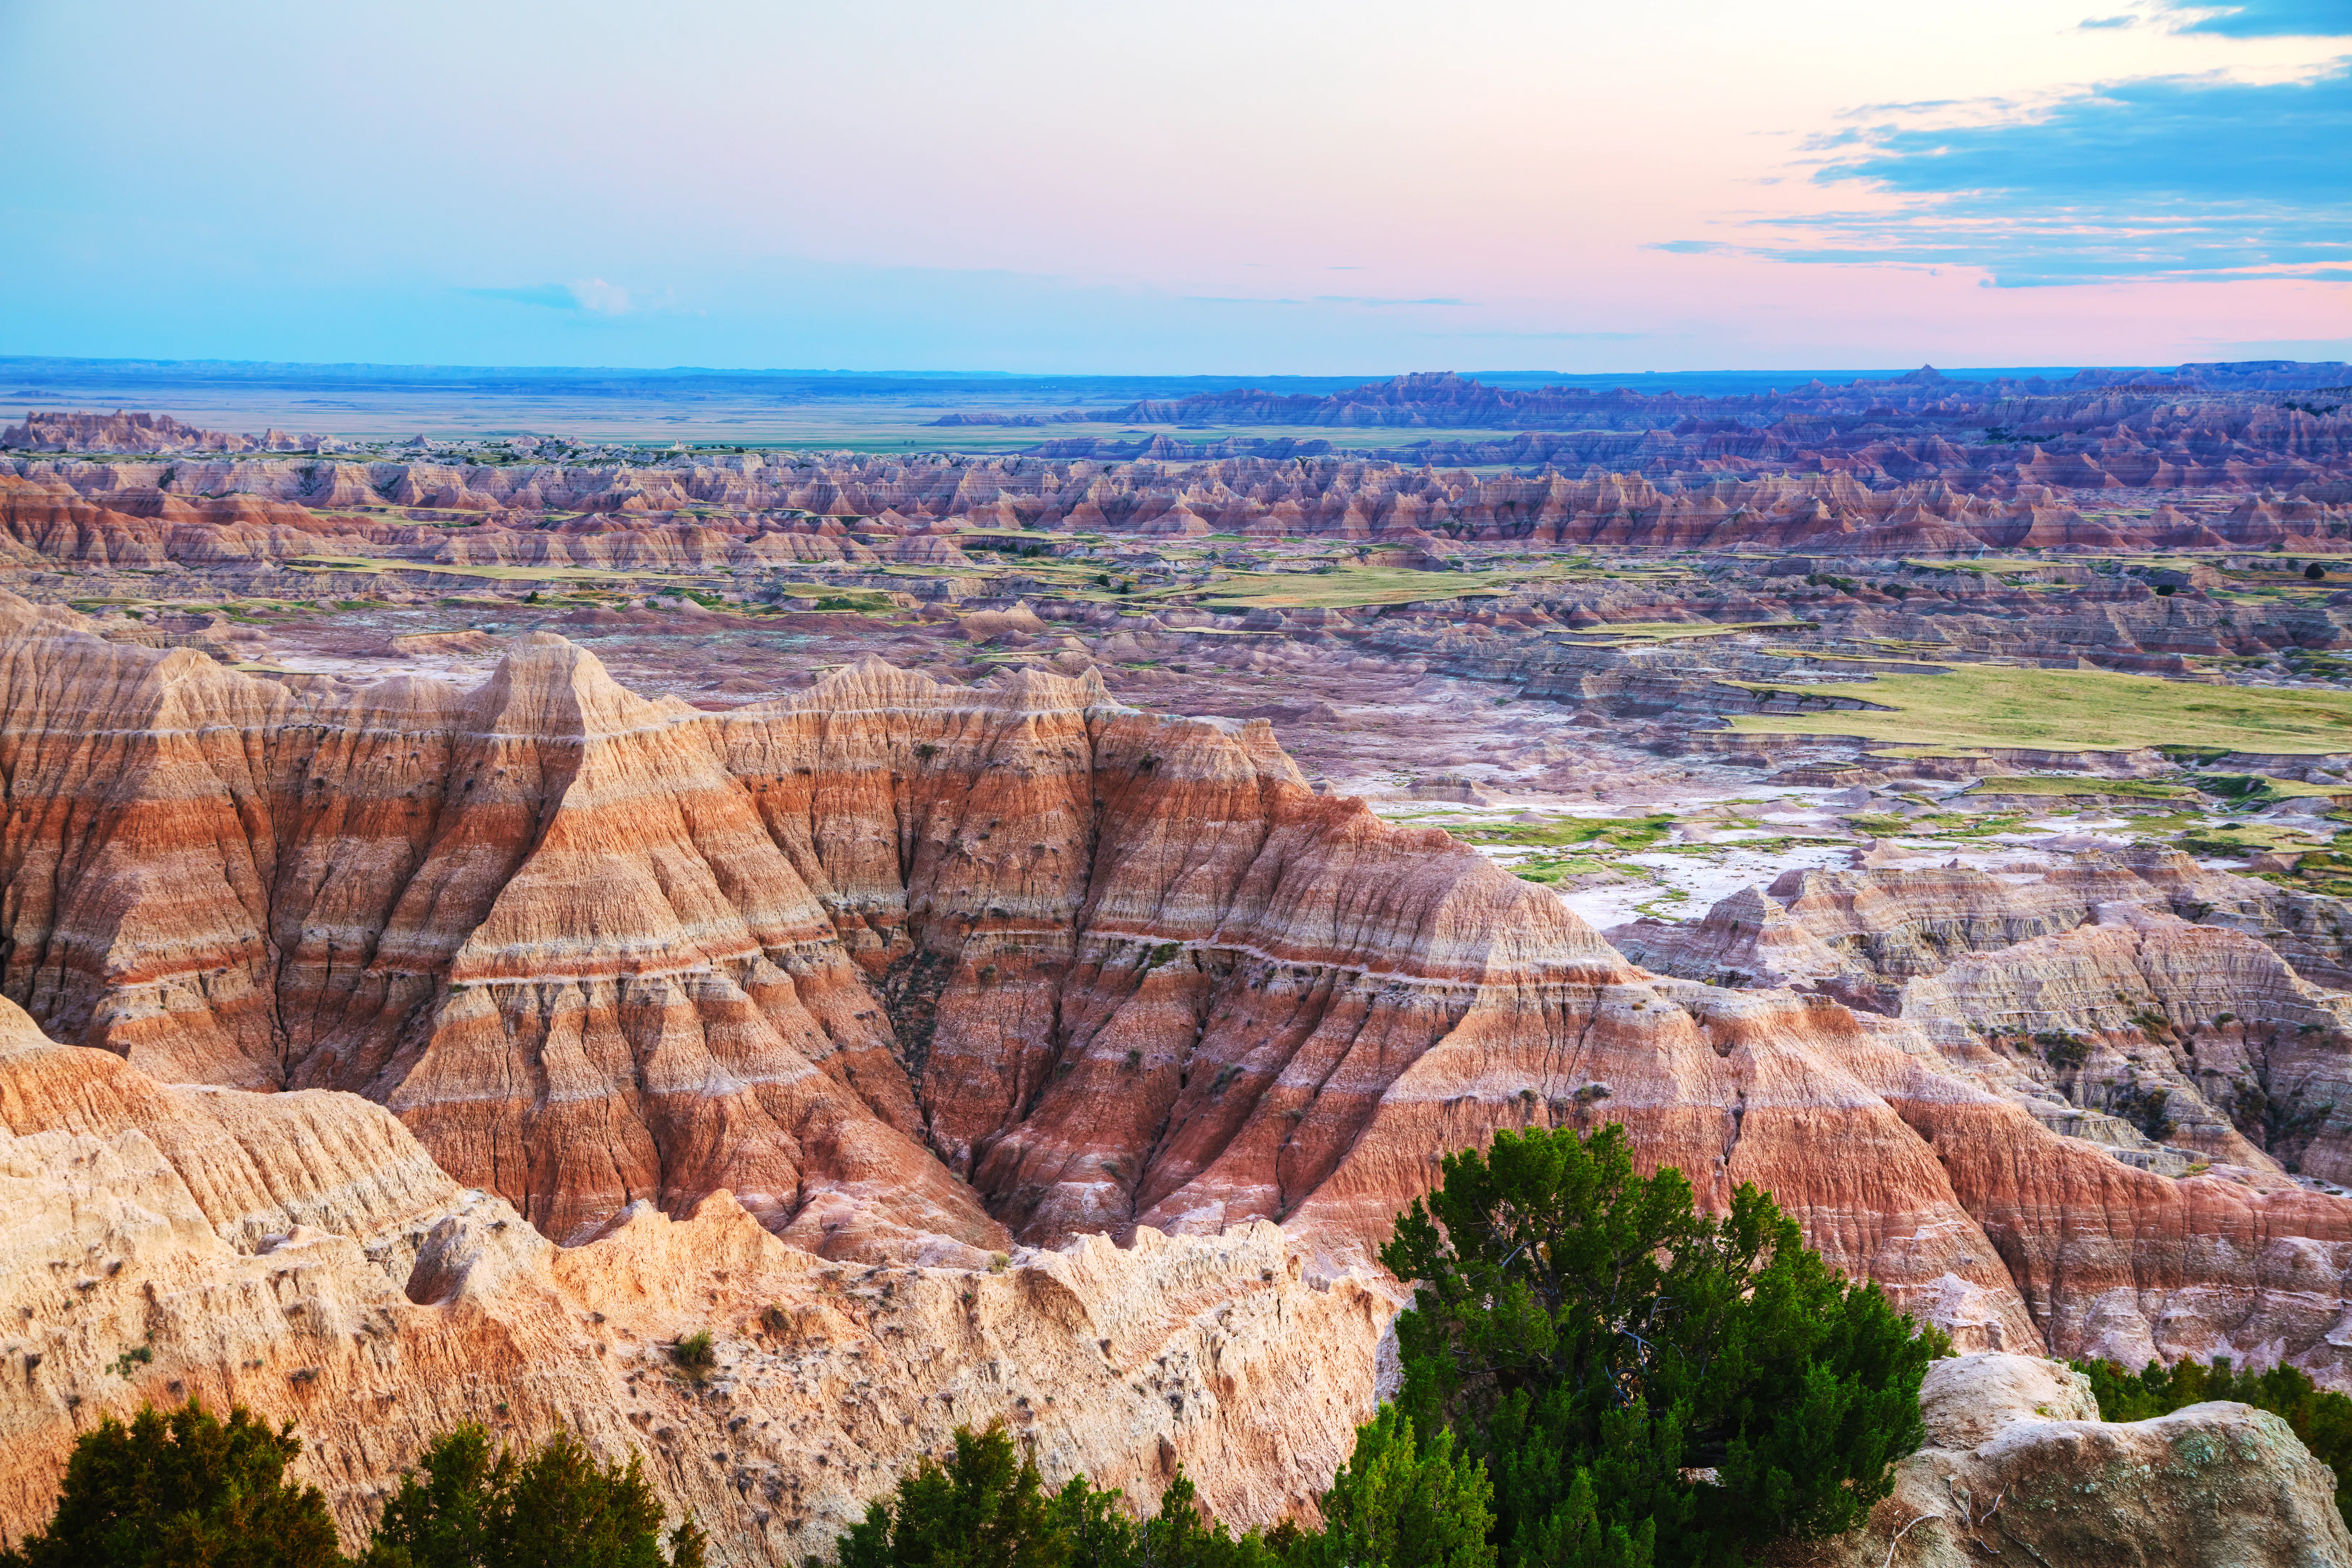
These parks offer striking geological formations and rich wildlife, making them attractive destinations for nature enthusiasts. Visitors to Badlands and Wind Cave National Park have lots of accommodation options in the surrounding submarkets, which include Rapid City, Hill City, Sturgis, Custer, Hot Springs, Kadoka, Martin, and Wall.
- Average Daily Rate (ADR): $255
- Average occupancy rate: 55%
- Average home value: $384,140
- Annual revenue potential: $54,076
- Yield: 14.1%
Why Invest Here?
Airbnb investors in this area of South Dakota get a 2-for-1 park deal—visitors to this area are uniquely drawn by the opportunity to cross 2 national parks off their list in a single visit. The dramatic landscapes and opportunities for exploration in the Badlands and Wind Cave create a strong pull for tourists.
9. Hot Springs National Park, Arkansas
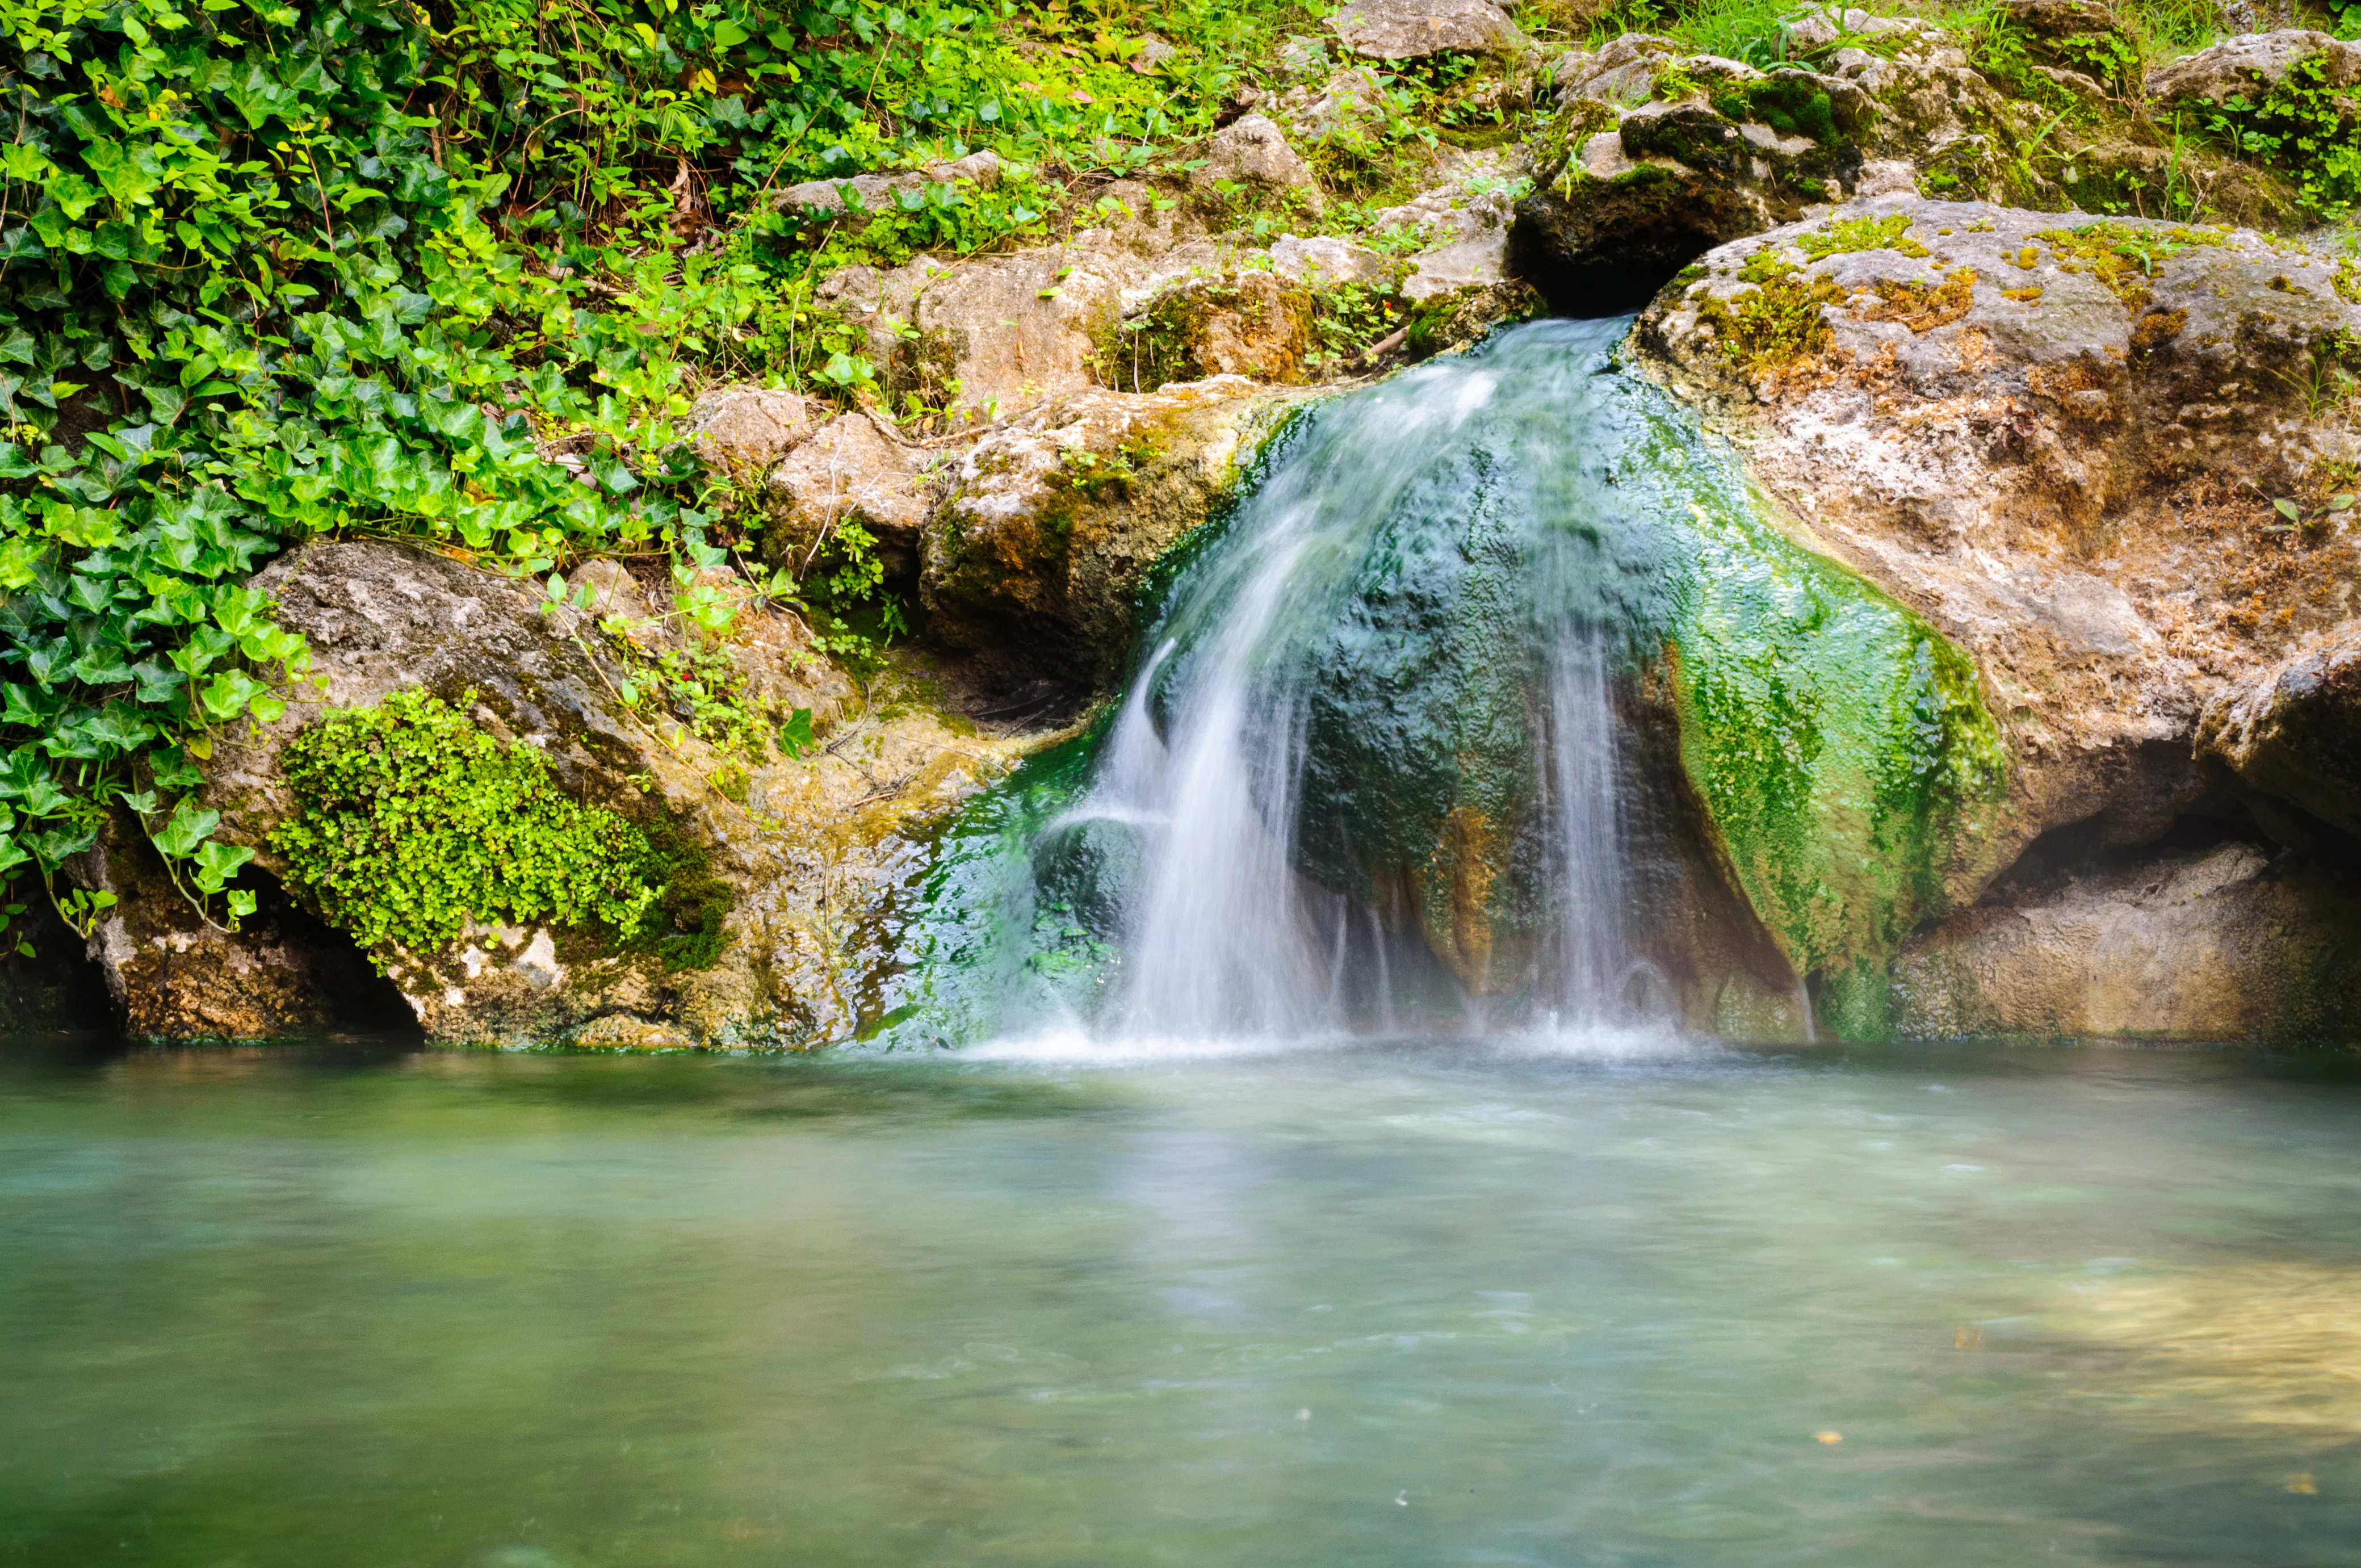
Known for its thermal springs and historic bathhouses, Hot Springs National Park combines natural beauty with historical significance. Hot Springs National and Hot Springs Village are the two submarkets serving this national park.
- Average Daily Rate (ADR): $267
- Average occupancy rate: 45%
- Average home value: $267,217
- Annual revenue potential: $37,331
- Yield: 14.0%
Why Invest Here?
The combination of therapeutic hot springs and the charm of Hot Springs town provides a unique visitor experience. The park's year-round appeal and the town's amenities ensure a steady demand for STRs.
10. Kenai Fjords National Park, Alaska
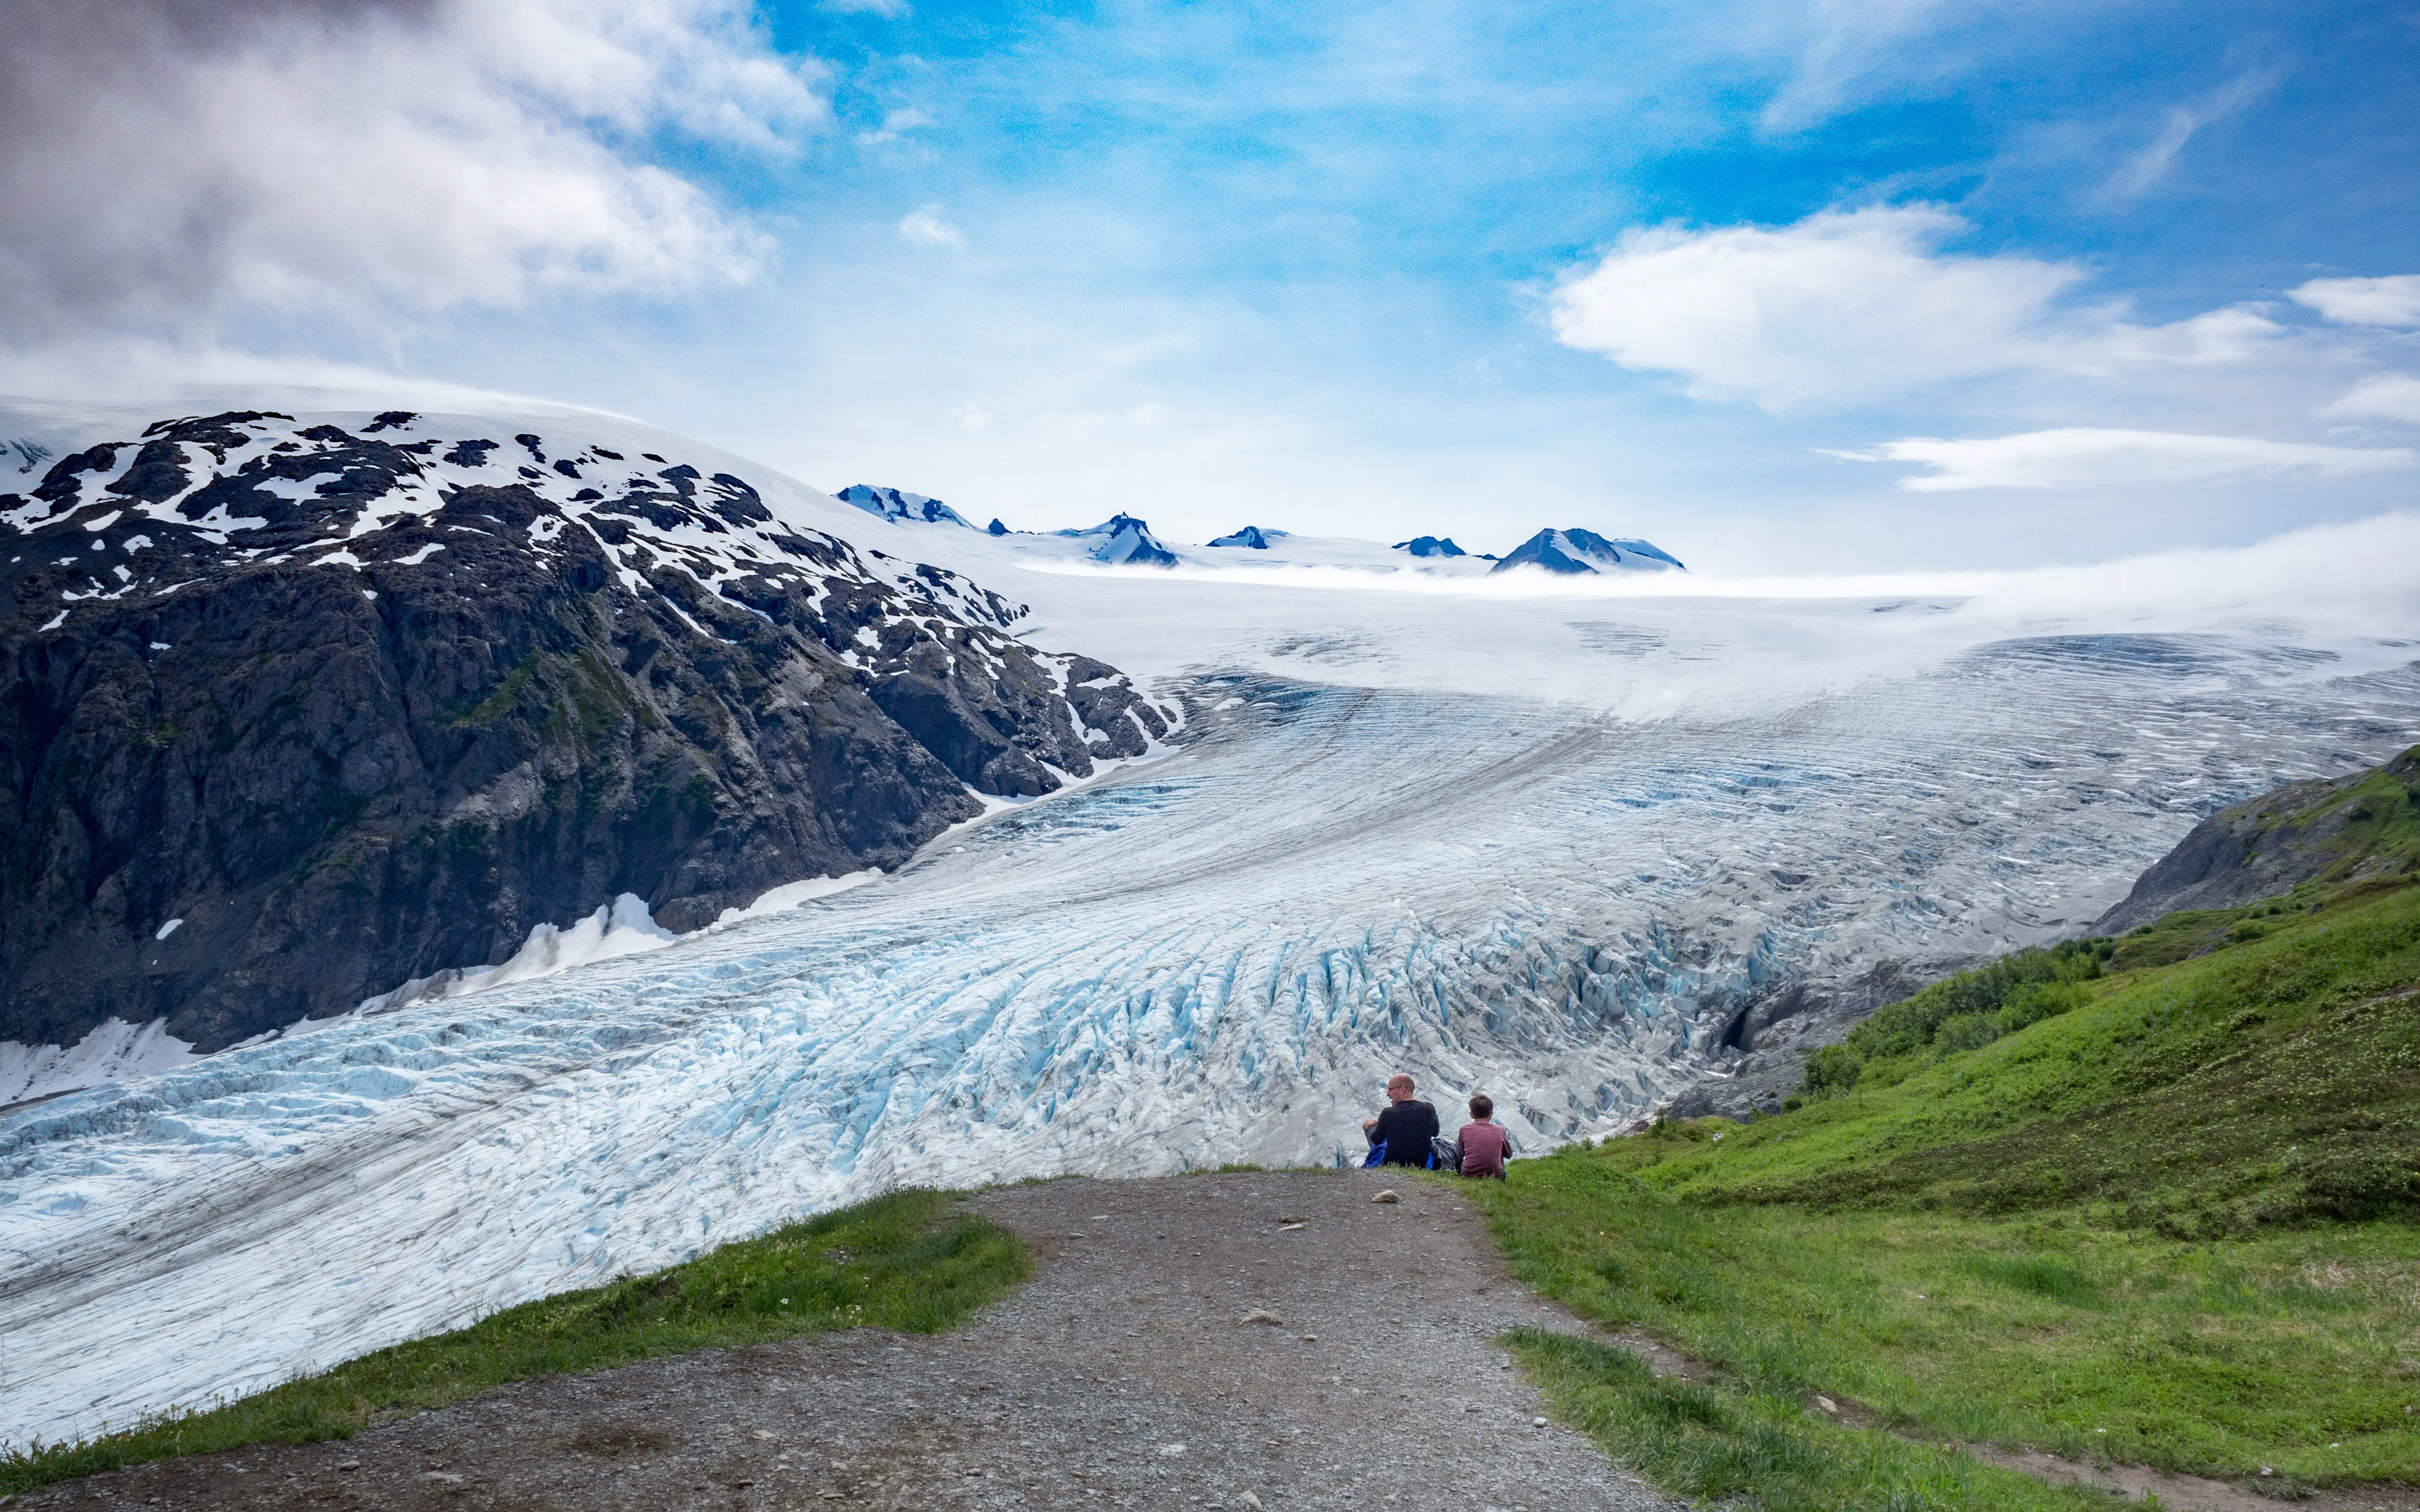
- This park is renowned for its stunning glaciers, marine wildlife, and rugged coastline. Seward, Alaska is the short-term rental submarket serving Kenai Fjords National Park.
- Average Daily Rate (ADR): $303
- Average occupancy rate: 64%
- Average home value: $398,877
- Annual revenue potential: $54,790
- Yield: 13.7%
Why Invest Here?
The breathtaking scenery and adventure opportunities, including glacier tours and wildlife cruises, attract a dedicated stream of visitors. Airbnbs that serve Kenai National Park have the highest occupancy rates of any parks featured in our top 10 list at 64%, though it comes with an average property price tag of nearly $400,000. The park’s remote location ensures that well-located STRs will be in high demand.
Research Airbnb Markets
Gain insights into the revenue and occupancy trends in your market.
Get to Know Your National Park Submarkets
The top 10 national park markets showcased above are only the tip of the investing iceberg. We broke out a total of 54 national parks into 224 submarkets, with detailed STR performance insights for each one. Explore the national park of your choice in the dashboard below. You can click on the submarkets in the dashboard to view more performance metrics in the AirDNA app.
Unique Properties Dominate Near National Parks
If you’re considering investing in a vacation rental near a national park, you might want to consider a unique property. About 10% of unique Airbnb listings in the U.S. are located in national park submarkets.
Unique listings include cabins, campers, RVs, and other unconventional lodgings that attract visitors seeking a one-of-a-kind experience. Below is a list of some of the most common unique property types found near national parks and which national park has the largest percentage of these property types.
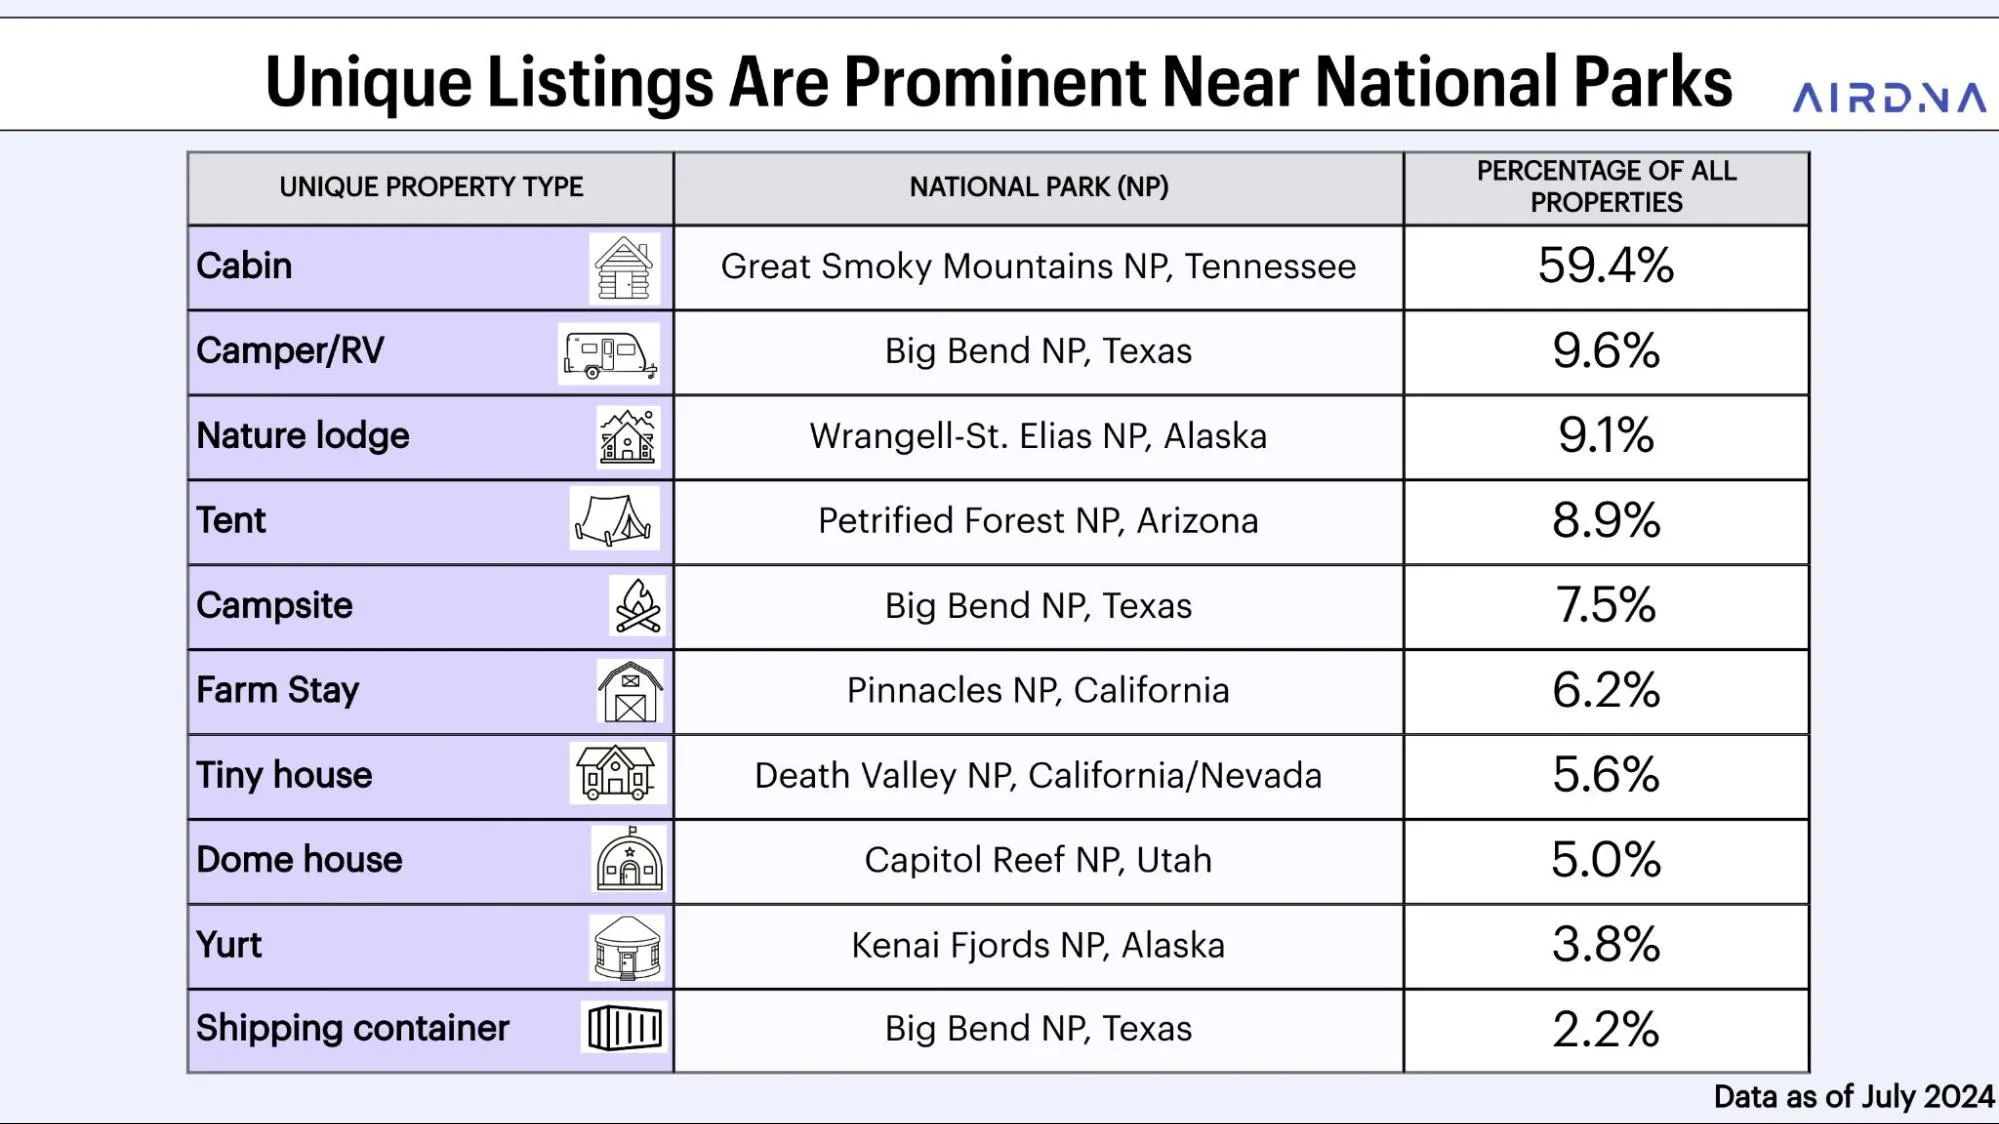
Cabins are the most popular property type near national parks. A whopping 60% of all properties in the Great Smoky Mountains are cabins. Other national parks where cabins make up nearly 50% or more of STRs are:
- Voyageurs National Park, Minnesota (53%)
- Denali National Park, Alaska (45%)
- Mount Rainier National Park, Washington (43%)
Campers and RVs are also very popular in national park submarkets. You’re most likely to find campers and RVs in Big Bend National Park, Texas, where they make up 9.6% of all properties. Campers and RVs are also popular in:
- Death Valley National Park, Nevada (7.4%)
- Theodore Roosevelt National Park, North Dakota (7.4%)
Check out the dashboard above for the top 5 unique property types for each national park.
Smart investments happen here.
AirDNA makes hosting and investing a breeze. Every insight you need, all in one place, always up-to-date.
National Park Travel Trends
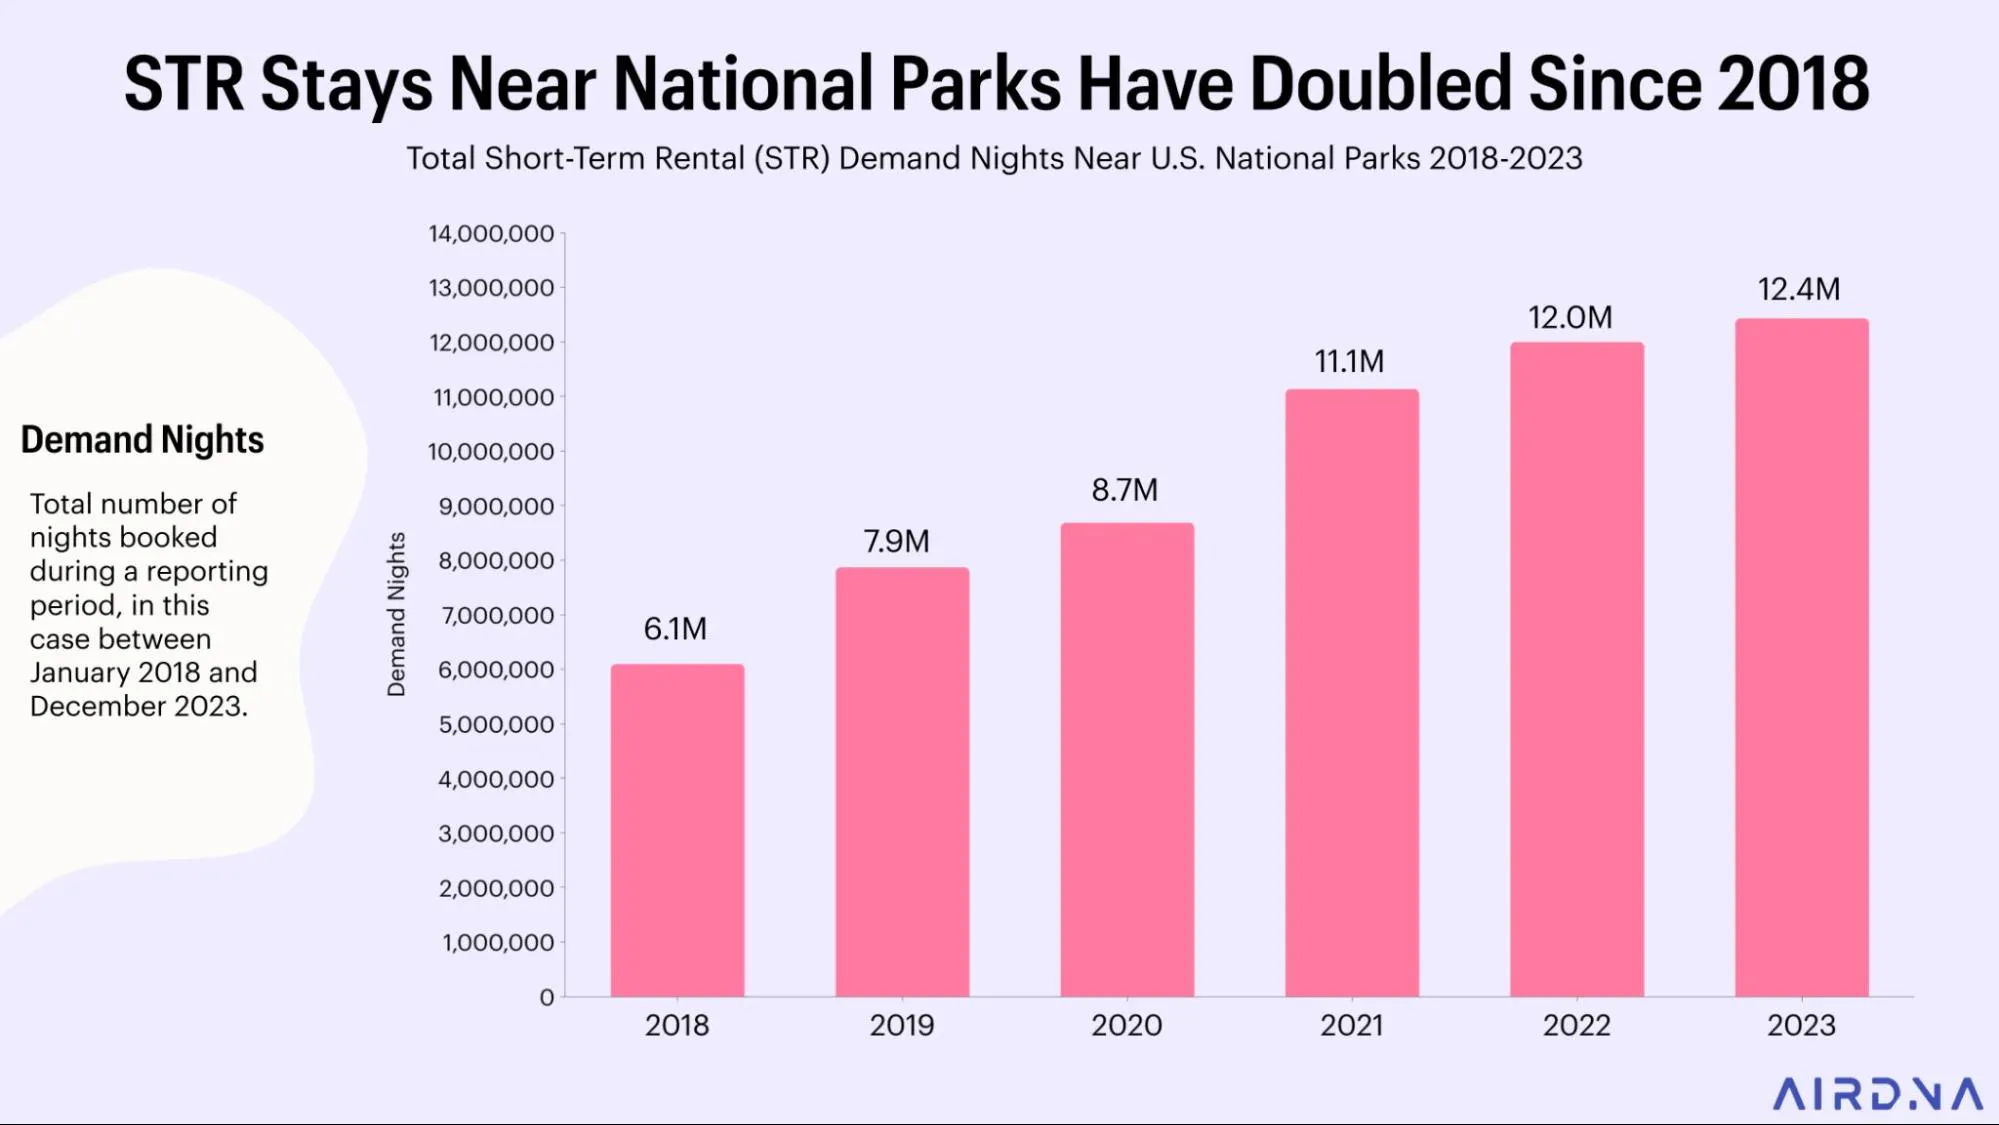
National parks have witnessed a remarkable surge in popularity over the past few years. From 2018 to 2023, demand nights in national park submarkets increased by an astounding 104%.
What’s Driving the Demand for National Park Travel?
The COVID-19 pandemic played a significant role in altering travel preferences. As international travel restrictions were imposed and urban areas were perceived as higher-risk zones, many travelers turned to national parks as safe, outdoor destinations. Short-term rental demand in large metropolitan areas decreased by 30% in 2020, while demand in rural and mountain destinations grew by 13%.
The vast open spaces, fresh air, and opportunities for social distancing made national parks an ideal choice for those looking to escape the confines of lockdowns while still enjoying a vacation. Demand in national park submarkets saw 10% year-over-year growth in 2020.
The pandemic also led to a broader shift in travel patterns. People began to value nature and outdoor activities more, seeking experiences that offered both adventure and tranquility. In 2021, STR demand in national park areas saw 29% YOY growth, which was higher than mountain markets (16%) and rural markets (28%) in general.
Park Visits Reach an All-Time High in 2023
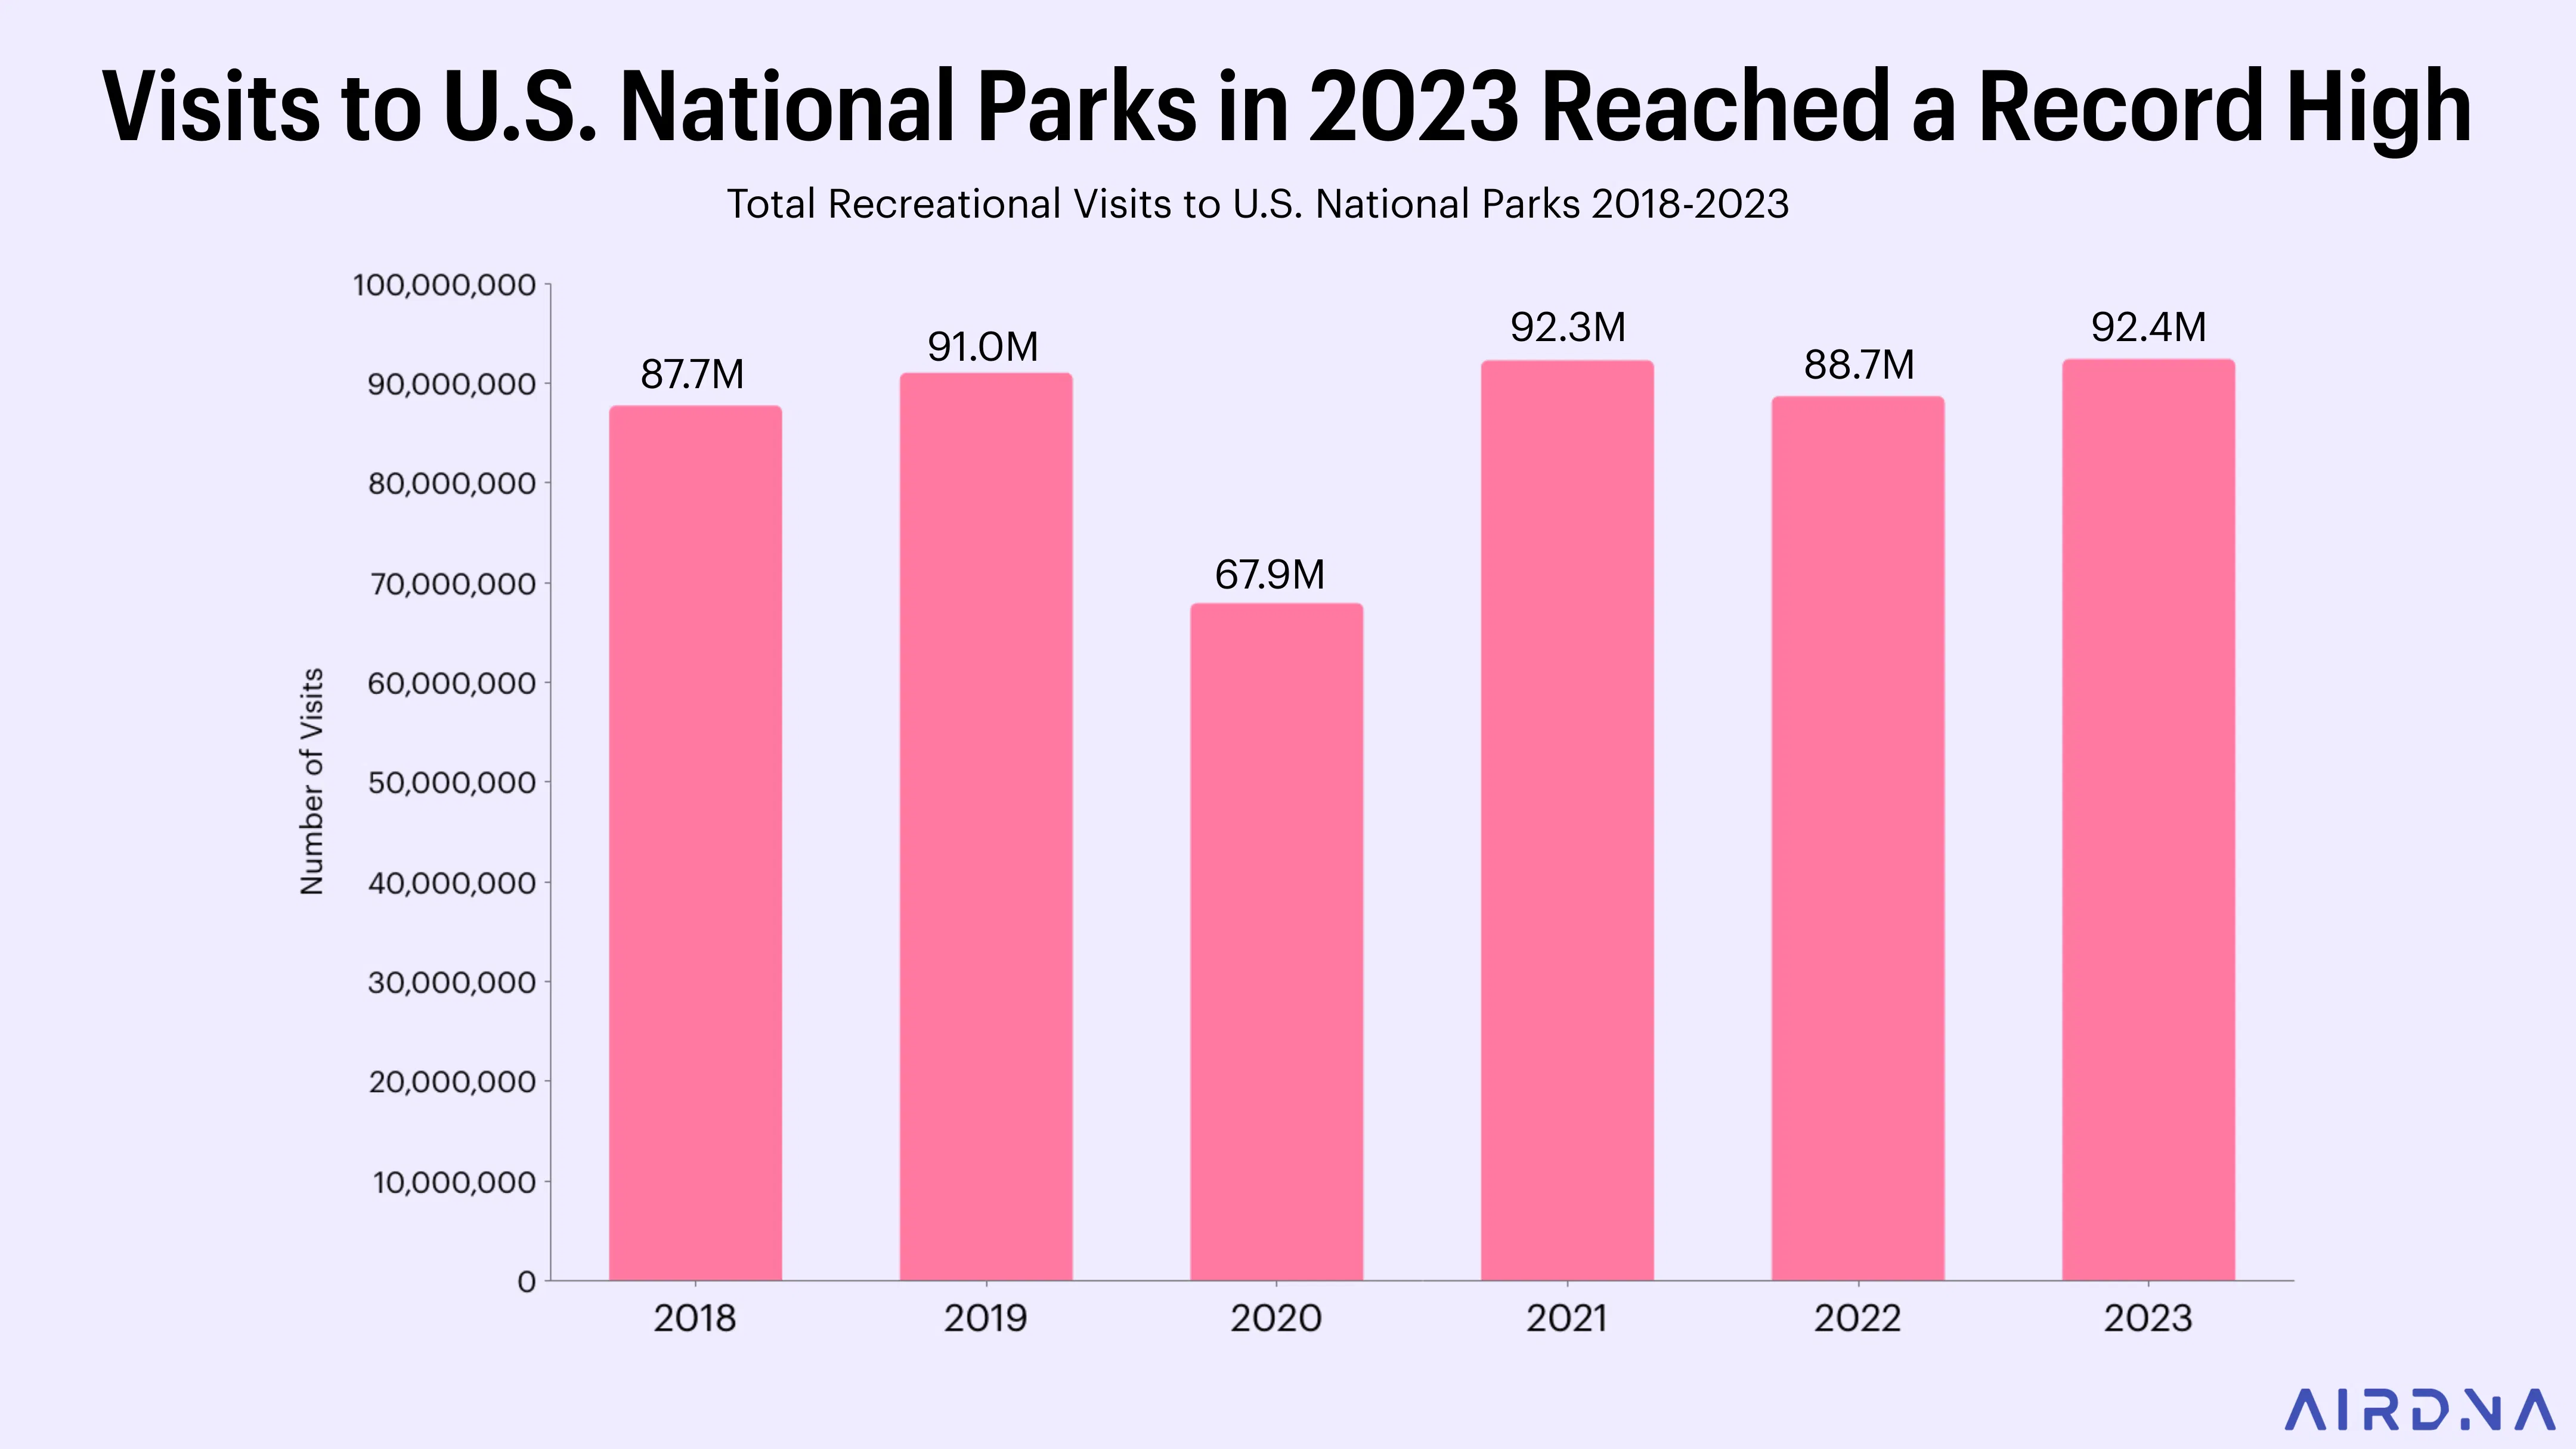
After a significant increase in national park visits during the peak of the pandemic, there was a noticeable dip in 2022. As travel restrictions eased and people felt more comfortable traveling to cities and international destinations, the initial surge in national park visits stabilized.
However, by 2023, national park visitation reached a record high of 92.4 million visits. National park visitation and STR demand each increased 4% YOY. This resurgence highlights the enduring appeal of these natural wonders.
Simultaneously, short-term rental stays in national park submarkets also hit a record high of 12.4 million stays in 2023. Between 2018 and 2023, STR stays near national parks doubled.
Growing Demand for Airbnbs Near National Parks
The surge in national park visitation has had a direct impact on the demand for Airbnbs and other short-term rentals near these parks. Certain national parks have experienced a strong linear relationship between increased visitation and the growth in STR demand over the past few years.
Correlation Between National Park Visitation and STR Demand
AirDNA's analysis of 54 national parks reveals that, for more than one-third of these parks, there is a strong correlation between national park visitation and growth in STR stays.
In the dashboard below, we’ve combined AirDNA STR data with national park visitation data from the National Park Service. We show the change in national park visitation, STR guest stays, and STR listing growth since 2019.
The correlation between national park visitation and STR guest stays can range in value from -1 to 1. Correlation coefficients near 1 suggest that guest stays tend to increase in tandem with greater visitation to the national park. Correlation coefficients nearing zero indicate no linear relationship between guest stays and park visitation. Finally, correlation coefficients nearing -1 suggest that as visitation to a national park increases, guest stays tend to decrease.
In the dashboard below, national parks are color coded based on the strength of the relationship between visitation and guest stays. You can sort national parks by visitation, STR demand, and STR listing growth in the drop down menu.
Top 10 National Parks with Highest Visitation Growth
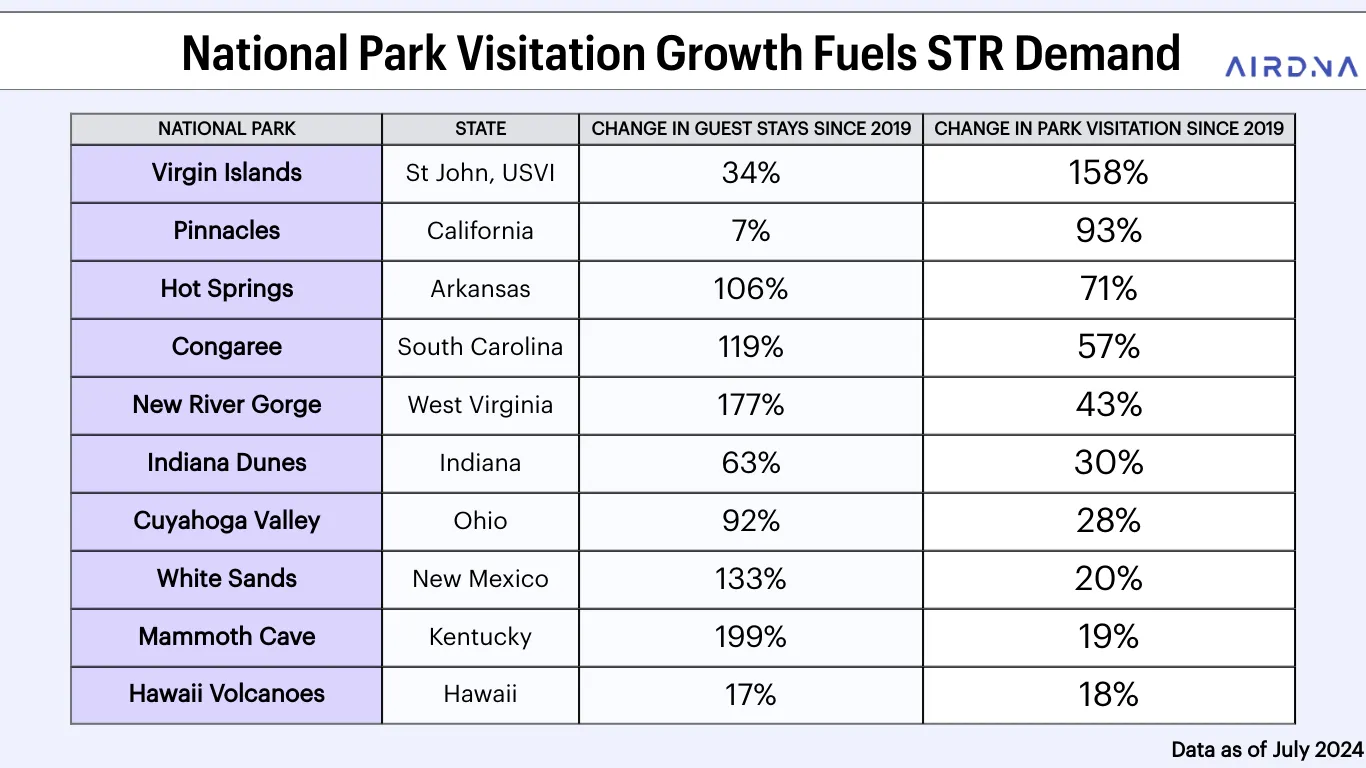
The following 10 national parks have experienced the highest visitation growth between 2019 and 2023:
- Virgin Islands National Park, St. John, U.S. Virgin Islands
- Pinnacles National Park, California
- Hot Springs National Park, Arkansas
- Congaree National Park, South Carolina
- New River Gorge National Park, West Virginia
- Indiana Dunes National Park, Indiana
- Cuyahoga Valley National Park, Ohio
- White Sands National Park, New Mexico
- Mammoth Cave National Park, Kentucky
- Hawaii Volcanoes National Park, Hawaii
Notably, eight of these ten parks were lesser-known before the pandemic but saw dramatic visitation growth over this 5-year period.
The growing popularity of these national parks helped fuel STR demand in the areas immediately surrounding them.
STR guest stays have more than doubled since 2019 in the areas surrounding:
- Hot Springs
- Congaree
- New River Gorge
- White Sands
- Mammoth Cave
Other Factors Driving Demand Growth for Airbnbs Near National Parks
While national park visitation can often correlate with STR demand, that’s not always the case.
For many of the national parks AirDNA analyzed, the correlation between growth in national park visitation and growth in demand for nearby Airbnbs was moderate or weak.
Several other factors contribute to the growing demand for Airbnbs in national park submarkets:
Growth in STR Listings
With more and more STR listings popping up near national parks, travelers have more options available to them and STR stays grow.
For example, Petrified Forest National Park had fewer than 5,000 listings before the pandemic. As of 2023, available STR listings near the park have increased 454% since 2019. Demand for STRs has grown by 189% in that time frame despite park visitation falling by 19%.
External Demand Drivers
Local attractions and events outside of the national park play a crucial role in driving demand for STRs near parks. Areas with popular attractions like theme parks, ski resorts, music festivals, and seasonal events see high STR bookings as tourists flock to these regions for more than just the national park experience.
The Great Smoky Mountains National Park provides a great example. Right outside the park, Gatlinburg and Pigeon Forge are two major towns with significant tourist traffic to nearby theme parks, family-friendly attractions, and entertainment.
Guests staying in short-term rentals near the Smoky Mountains may be visiting the national park, but could also be visiting other local attractions. While visitation to the Great Smoky Mountains National Park has only grown 6% since 2019, STR stays in that area have grown by 83% and listings have grown by 66%.
Other examples of national parks where there isn’t a strong correlation between visitation and STR demand due to other demand drivers in the area would be Olympic National Park, Rocky Mountain National Park, Bryce Canyon National Park, and Zion National Park.
Diverse Guest Preferences
Not all national park visitors choose to stay within close proximity to the park. Some might prefer lodging in nearby towns or cities that offer more amenities, nightlife, and dining options. Others might be looking for budget-friendly options that are not available near the park.
For example, Pinnacles saw a 93% increase in park visitation between 2019 and 2023, but only 7% growth in nearby STR stays.
The Travel Season for National Parks Is Growing
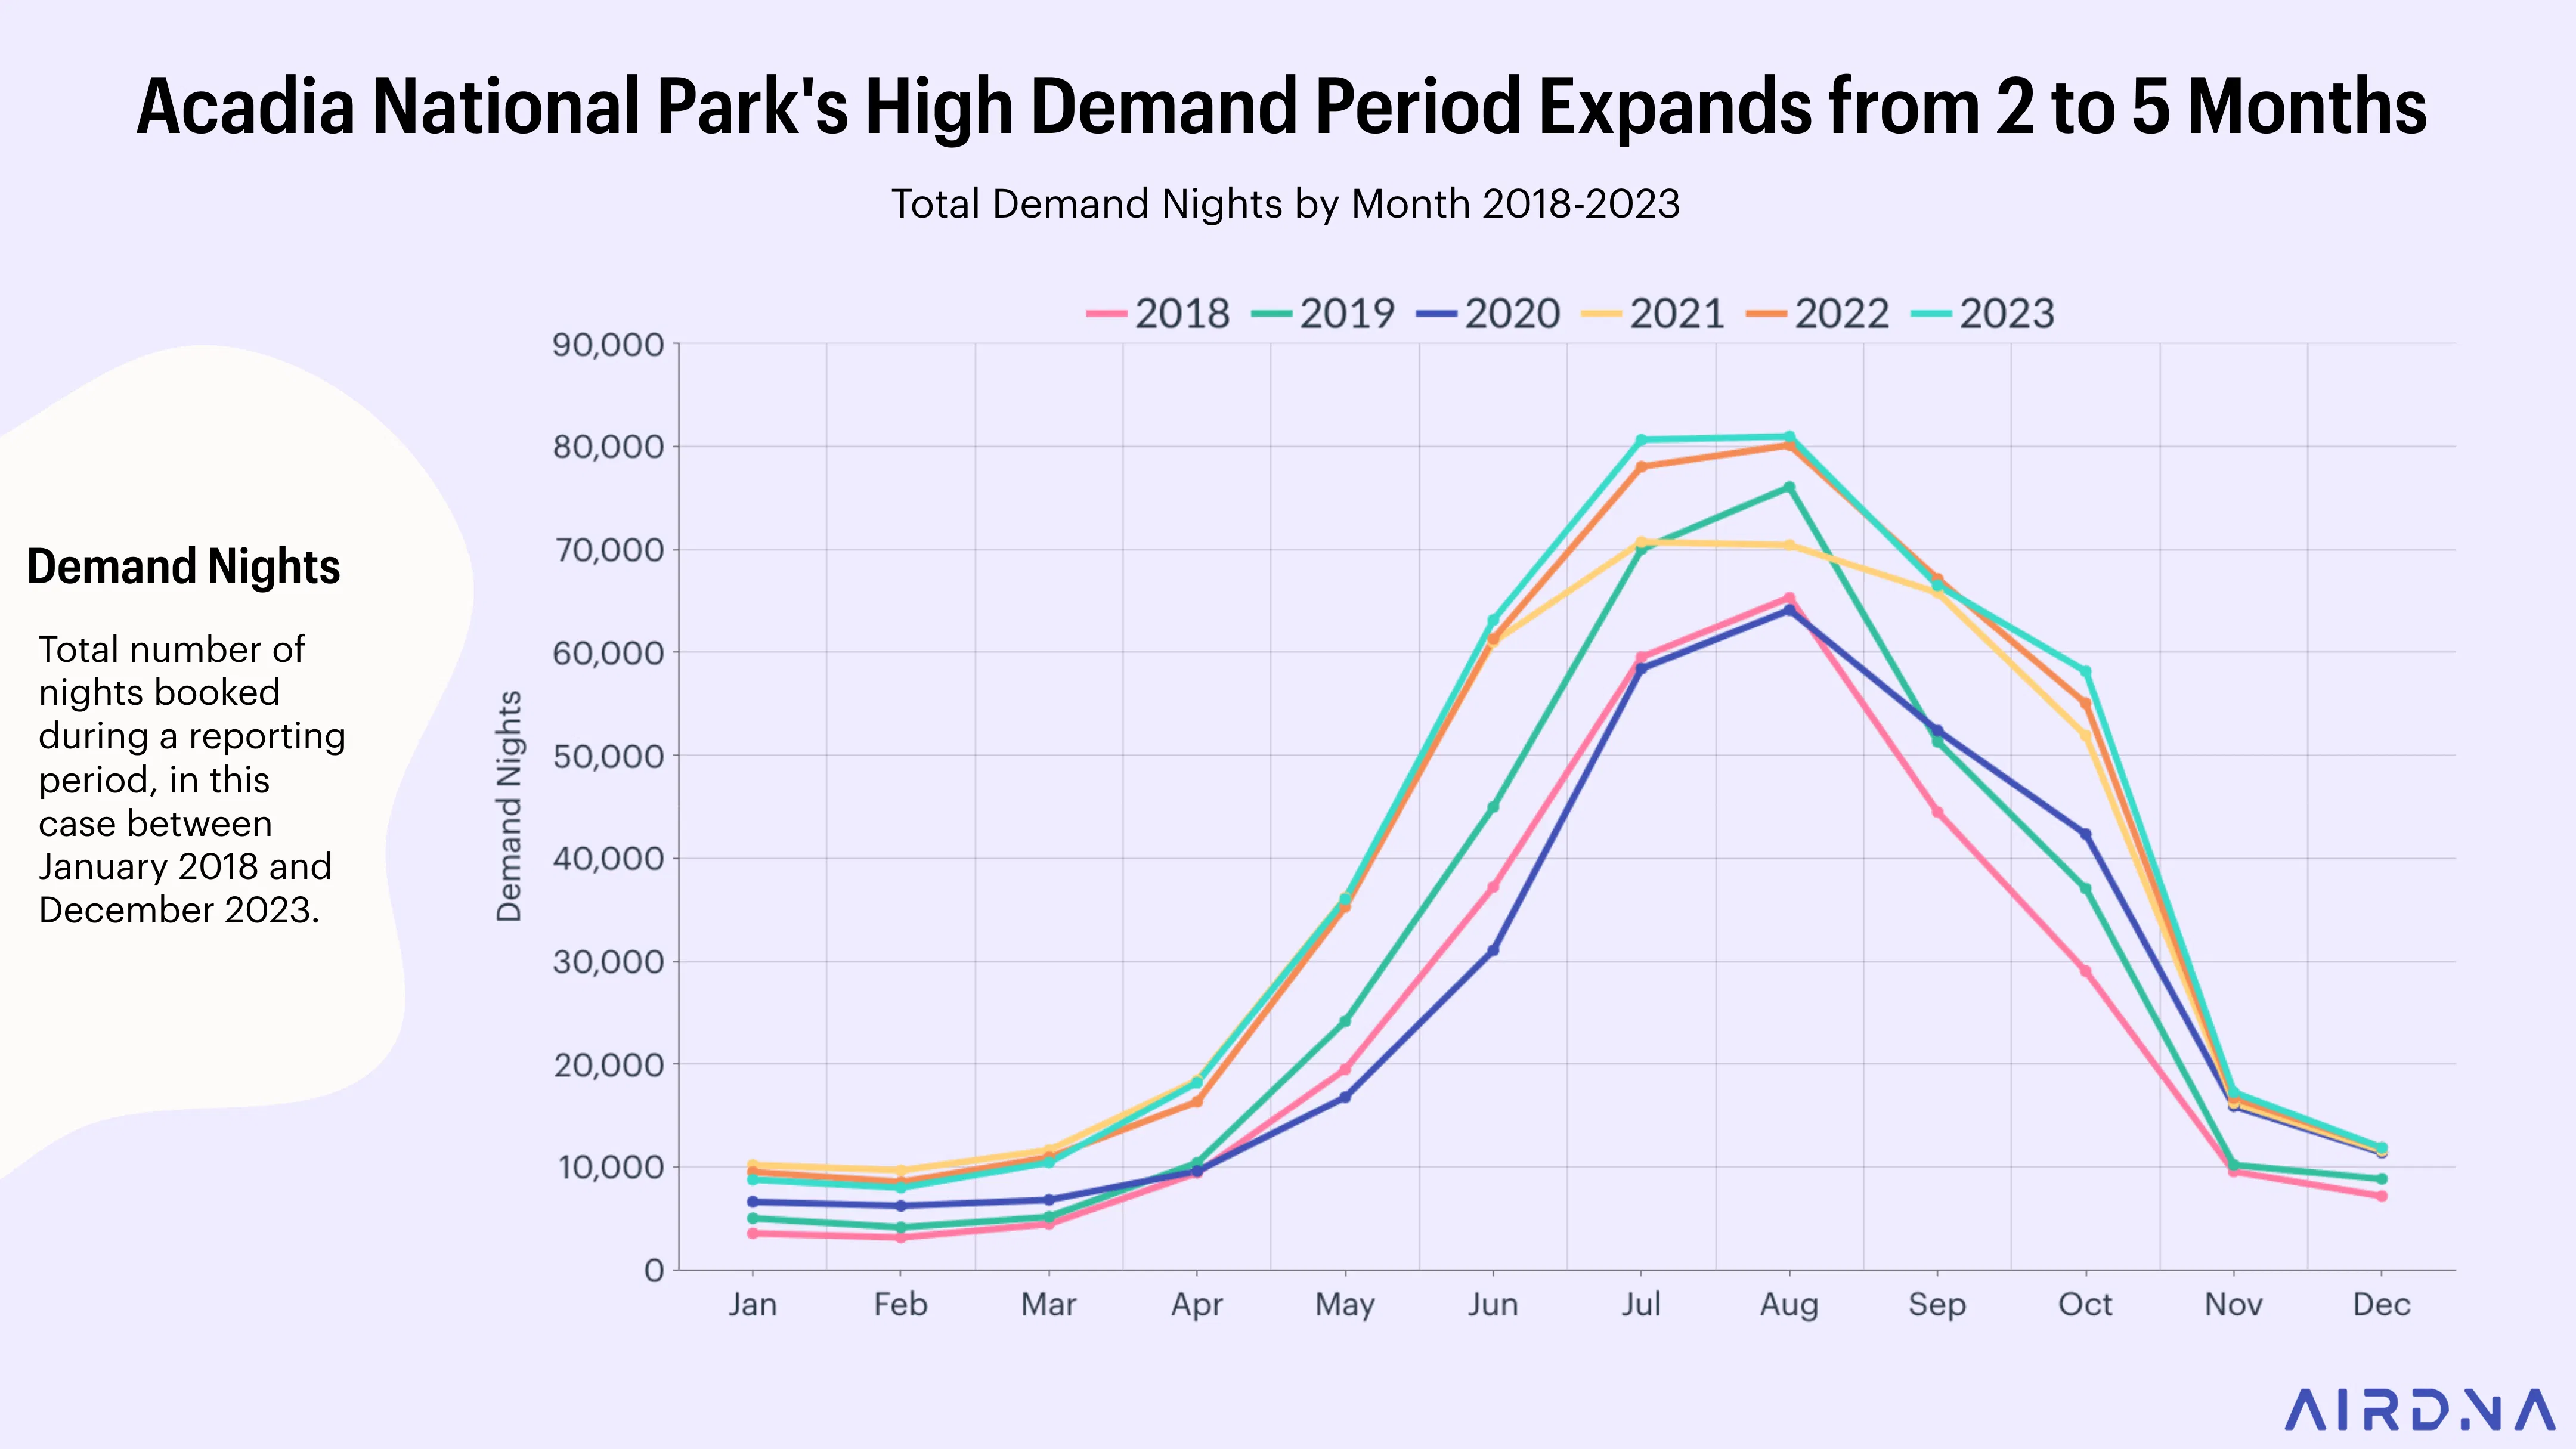
One of the most exciting trends for STR investors is the expansion of the travel season for many national parks. Of the 54 national parks analyzed, 29 have seen their total number of high-demand months increase by at least one month since 2019.
This trend indicates a shift in visitor behavior, as people are no longer confining their national park trips to the traditional peak travel months. The extended season also provides more opportunities for STR hosts to make money throughout the year.
Some notable examples of expanding travel seasons include:
Acadia National Park: Previously a highly seasonal market with only two peak travel months (July and August), Acadia now sees high demand from June through October.
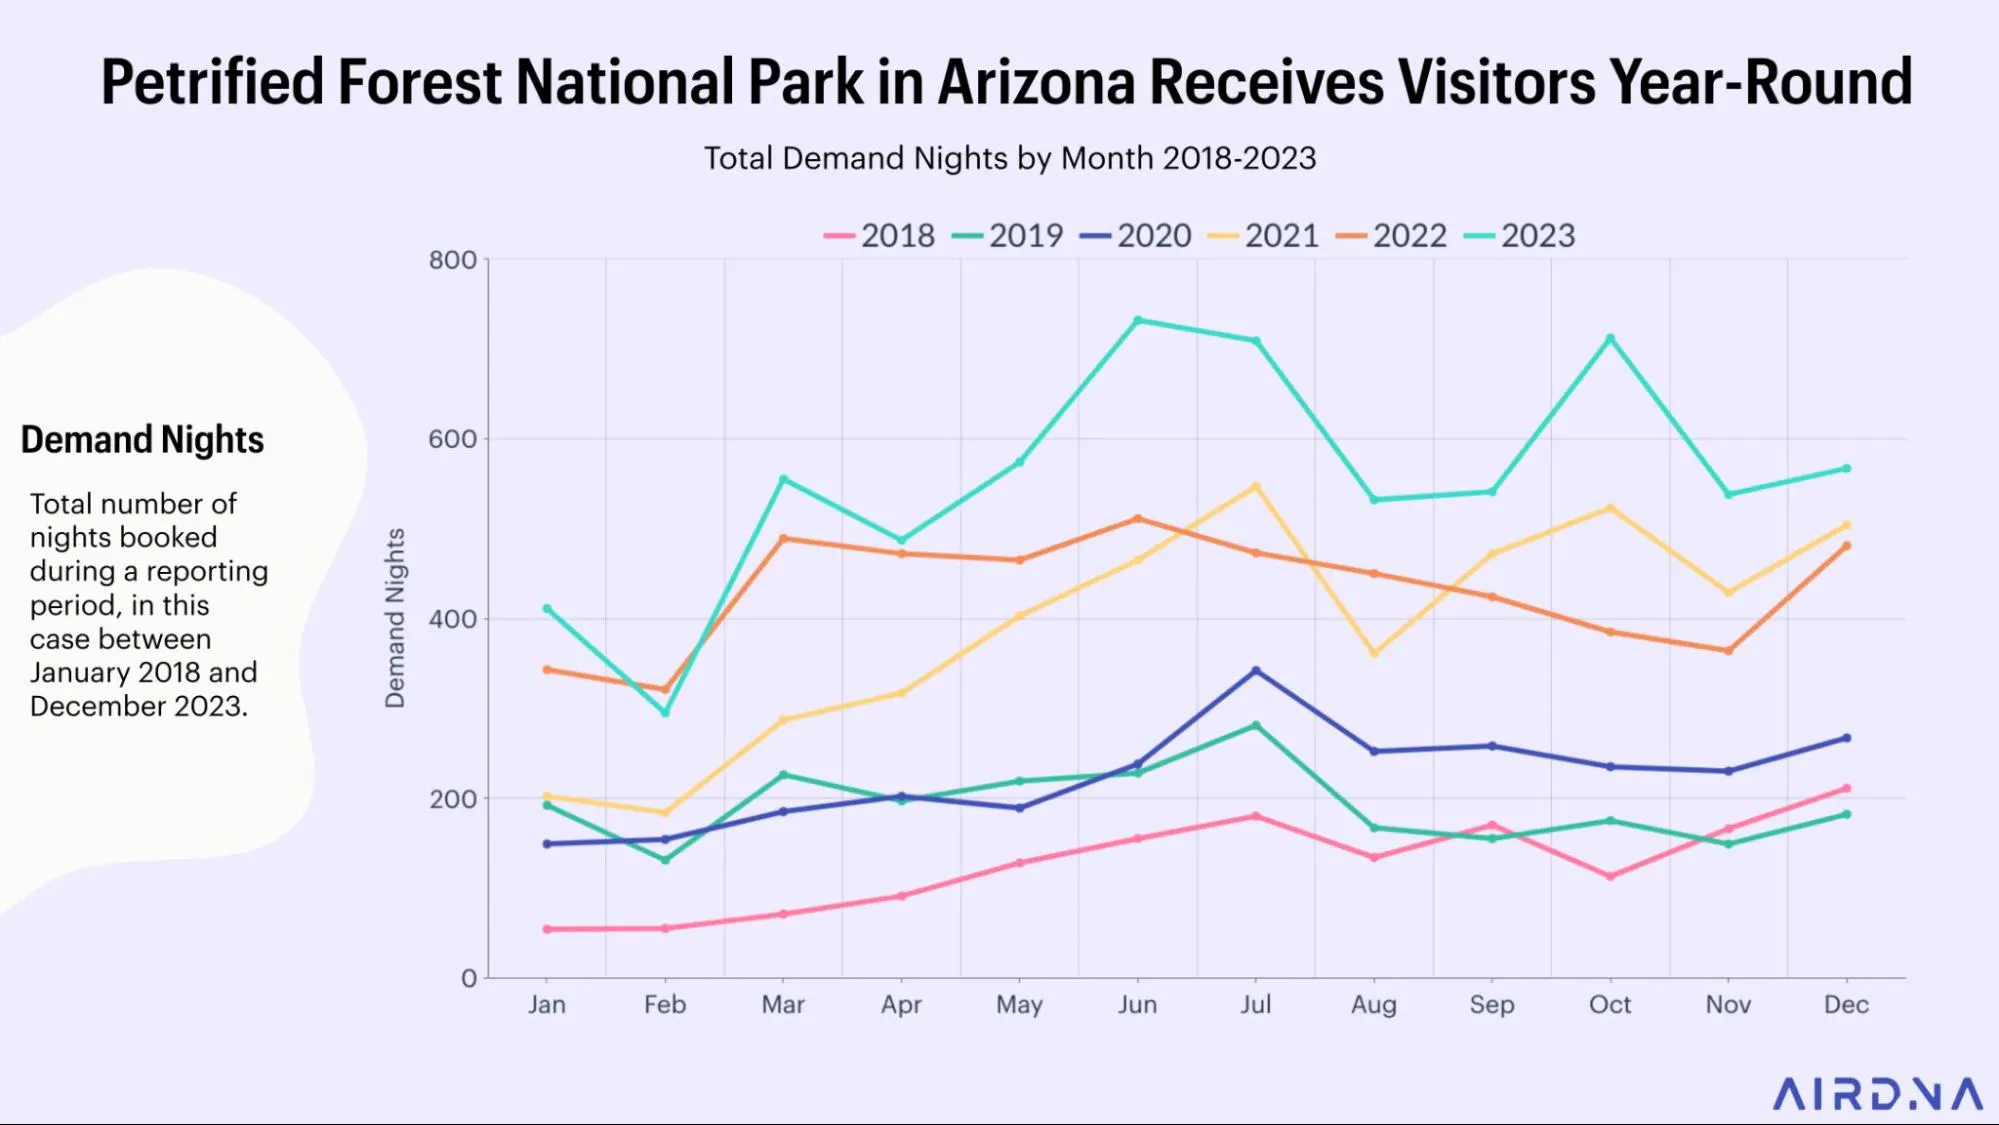
Petrified Forest National Park: In less seasonal markets, there’s not much of a difference between the highest and lowest months of demand. Due to its low seasonality, Petrified Forest had nine high-demand months in 2023, up from five in 2019.
Notably, many of the national parks leading growth in high demand months since 2019 are also the national parks that have seen the most STR demand growth. Longer travel seasons have fueled STR demand growth for national parks like Congaree, Mammoth Cave, and New River Gorge.
It's worth noting that while 36 of the 54 national parks analyzed see demand peak in the summer, there are exceptions:
- Parks that get extremely hot in the summer (e.g., Big Bend, Biscayne, Everglades, Arches, Zion) tend to see demand peak in spring or fall.
- Some parks, like Congaree and Shenandoah, peak in fall due to their stunning foliage.
In the interactive table below, we've color coded each month of the year by the level of short-term rental demand in each national park. Red months indicate higher demand and blue months indicate lower demand. Use the drop-down menu on the upper left hand side to sort national parks by their peak season.
Methodology
We focused exclusively on national parks within the United States to conduct this analysis, of which there are 63. We excluded national parks whose submarkets have fewer than 50 annual available vacation rental listings. In total, nine parks were excluded, leaving 54 national parks in our study.
We did not include other similar types of destinations—such as national monuments, memorials, preserves, or forests—in our analysis. We combined AirDNA short-term rental (STR) data with national park visitation data from the National Park Service to provide a comprehensive view of the market.
We identified submarkets that provide stays for guests visiting each national park, including only those where the national park is the primary attraction for guests staying in the area. Many national parks have more than one STR submarket that serves park visitors.
Every submarket varies in its specific earning potential and short-term rental performance. The average daily rates (ADR) and occupancy rates for each national park airbnb market is an average of all of its submarkets. The average revenue potential, home value, and yield for each national park was obtained by weighing submarket level data based on listing count. The average home values for submarkets serving the national park are obtained from Zillow and weighted by STR supply by zip code and bedroom count.
In order to analyze how travel seasonality has changed since 2019 for each national park, we looked at monthly demand for each national park from 2019 to 2023. We counted the number of months where total demand was at least 70% of total demand during the peak demand month. We consider months that meet the 70% threshold to be high demand months.
For example, in 2023, monthly demand peaked at nearly 7K in July for the Black Canyon of the Gunnison. Counting the number of months in 2023 where demand was at least 70% of July demand gave us a total count of 5 high demand months.
FAQ
Can Airbnb be in national parks?
Airbnbs cannot be located within national park boundaries themselves, as most parks prohibit private property and commercial enterprises. However, many Airbnbs are situated in nearby towns and communities that serve park visitors, providing convenient access to the parks.
What amenities should you add to an Airbnb near a national park?
Consider including amenities that cater to outdoor enthusiasts when outfitting an Airbnb near a national park:
- Secure storage for outdoor gear
- Maps and guidebooks of the park and surrounding area
- Outdoor shower or mudroom for cleaning up after hikes
- Picnic supplies and coolers
- Binoculars and stargazing equipment
- Information on local flora and fauna
- Outdoor seating areas or fire pits
- Hot tubs
- Outdoor kitchen or grill
- High-speed internet for planning activities and sharing experiences
Use AirDNA’s custom comp feature to see what similar listings in your area are offering. You can find out which amenities might be worth adding to your own property by analyzing your competitors.
Which national parks have the best Airbnbs?
While "best" can be subjective, some national parks known for exceptional Airbnb options include:
- Great Smoky Mountains National Park, Tennessee/North Carolina
- Joshua Tree National Park, California
- Zion National Park, Utah
- Acadia National Park, Maine
- Yellowstone National Park, Wyoming/Montana/Idaho
These parks offer a wide range of unique accommodations, from luxury cabins to quirky tiny homes, catering to various preferences and budgets.
Research Airbnb Markets
Gain insights into the revenue and occupancy trends in your market.
ARTICLE SUMMARY
Discover the top 10 national park Airbnb markets for short-term rental investors. We pair investment takeaways with insights on national park visitation trends, high-performing property types, seasonality, and more.
Jamie Lane
AirDNA Chief Economist
He is responsible for data analysis, thought leadership, and leveraging advanced analytical techniques to provide new insights into short-term rental market trends. Native to Atlanta and an Airbnb host himself, Jamie enjoys cycling, mountain biking, backpacking, running, and playing in a dart league in his free time.
