

 Calculate Revenue
 Research Markets
 Find For Sale Properties
 Compare My Listing
 STR Revenue Calculator
 Custom Comp Sets
 Submarket Insights
 Custom Search Filters
 Rate Recommendations
 Performance Benchmarking
 Competitor Comparison
 Owner Contact Details
 Property-level performance data
 Tourism Insights
 Real Estate Investment Analytics
 About Us
 Sales
Sales Support
 Press
Press6 Airbnb Market Analysis Mistakes That Can Cost You
Published: March 26, 2025
Last updated: July 21, 2025

Jamie Lane
Key Takeaways
- Airbnb market analysis mistakes can sink even a promising Airbnb investment—what you don't know about your market will directly impact your bottom line.
- Most cities have hidden pockets where Airbnbs perform exceptionally well, even if the broader market looks weak on paper.
- The vacation rental market changes constantly. Properties that thrived last season may struggle today, which means you need to be doing market analysis often.
Most Airbnb investors know they need to do their homework—but what if they misunderstood the assignment?
Market research isn’t just about looking at numbers—it’s about knowing what actually matters. That’s where many Airbnb hosts run into trouble. They check a few stats, compare some listings, and feel confident in their research, until their bookings don’t match their expectations.
If your short-term rental (STR) analysis is off, so are your profits. Maybe you're working with incomplete data, misreading demand, or assuming you could "set it and forget it" with your pricing after listing. Small mistakes add up fast, and before you know it, your Airbnb isn’t performing the way you expected.
Let’s break down the most common Airbnb market analysis mistakes and, more importantly, how to avoid them. Because in short-term rentals, bad data can cost you just as much as no data at all.
1. Overlooking Local Pockets of Gold
Looks can be deceiving—especially in real estate.
One of the most common Airbnb analysis mistakes to avoid is assuming that if a market looks strong overall, every neighborhood within it will be profitable. Others write off an entire area based on its performance metrics, never realizing that some submarkets outperform the broader region. That kind of thinking leads to missed opportunities and costly mistakes.
Local trends can make or break an investment. The key factors driving STR success—demand patterns, pricing power, and regulations—don’t operate on a citywide scale. They shift from neighborhood to neighborhood, sometimes even block to block. Here’s why:
- Seasonality isn’t citywide – A ski town might attract tourists year-round, but slopeside rentals see the biggest winter surges, while properties in town stay steady. Misreading these patterns leads to pricing mistakes and empty calendars.
- Events can create hyper-local demand – A market report won’t show how one major event—like a golf tournament or music festival—can drive up bookings in certain neighborhoods while leaving others unaffected.
- Not all neighborhoods attract guests – A lively downtown district may be an Airbnb hotspot, while a quieter residential area a few miles away struggles with low demand or community resistance.
- STR rules change block by block – One neighborhood may fully allow short-term rentals, while another has bans, permit requirements, or strict rental caps. Investors who don’t check local regulations risk buying in a no-STR zone.
The bottom line? A market can look great on paper but have underperforming pockets, while a so-called ‘weak’ market can hide high-performing submarkets with real investment potential.
Here’s what we mean.
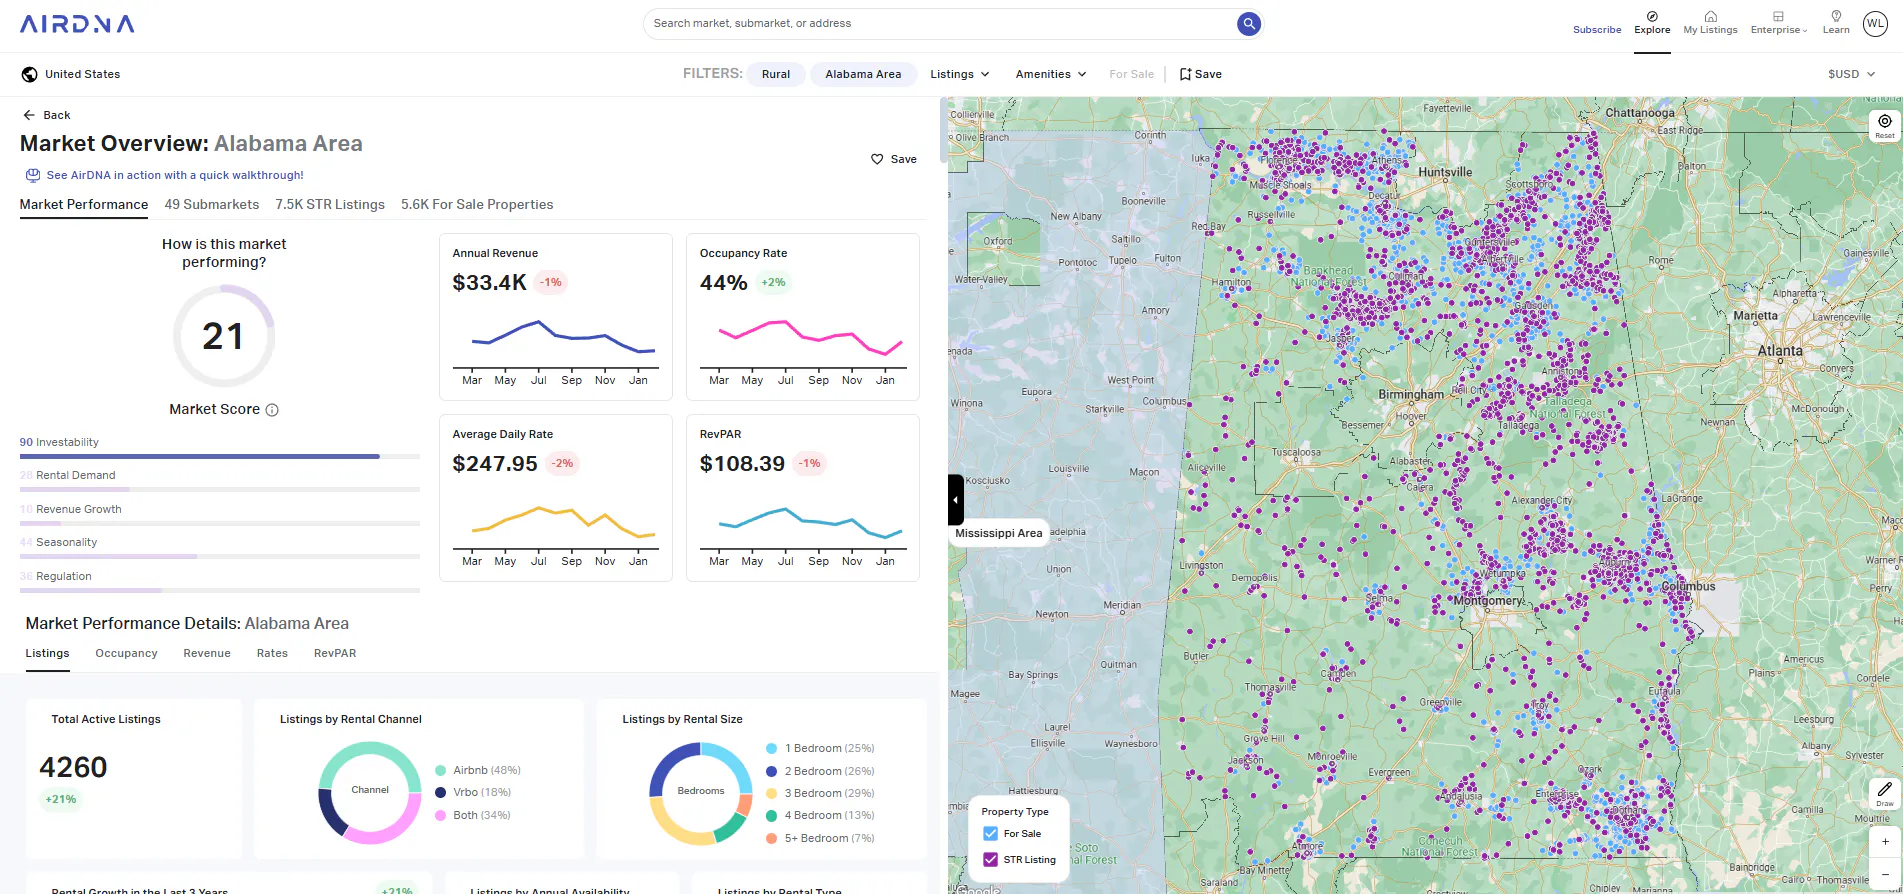
At first glance, the Alabama Area market looks like a flop. The overall Market Score is just 21, dragged down by low rental demand and sluggish revenue growth—but here’s the catch: its investability score is high (90), meaning there’s potential if you know where to look.
If you look at the submarket of Cullman, for example, you’ll find that it’s quietly outperforming the broader Alabama market. Cullman boasts a Market Score of 92, thanks to steadier occupancy, strong investability, and solid revenue potential.
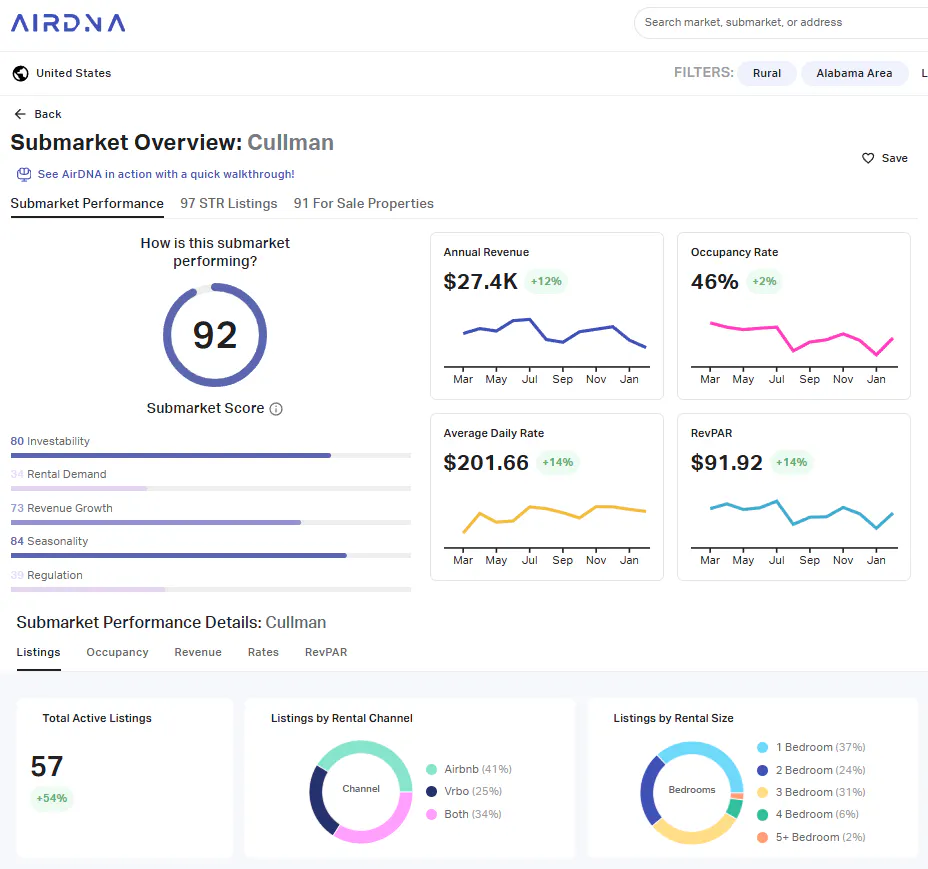
Cullman’s occupancy rate (46%) edges out Alabama’s (44%), meaning properties here are slightly more reliable when it comes to bookings. Sure, its Average Daily Rate (ADR) ($201.66) is lower than Alabama’s ($247.95), but that doesn’t mean weaker returns. In fact, Cullman’s RevPAR ($91.92) isn’t far off from Alabama’s ($108.39)—proof that lower rates don’t always mean lower earnings. In a market like this, stability beats volatility every time.
And here’s another big advantage—Cullman has 91 properties currently for sale. That’s a rare find in a high-performing submarket, giving investors an actual shot at getting in.
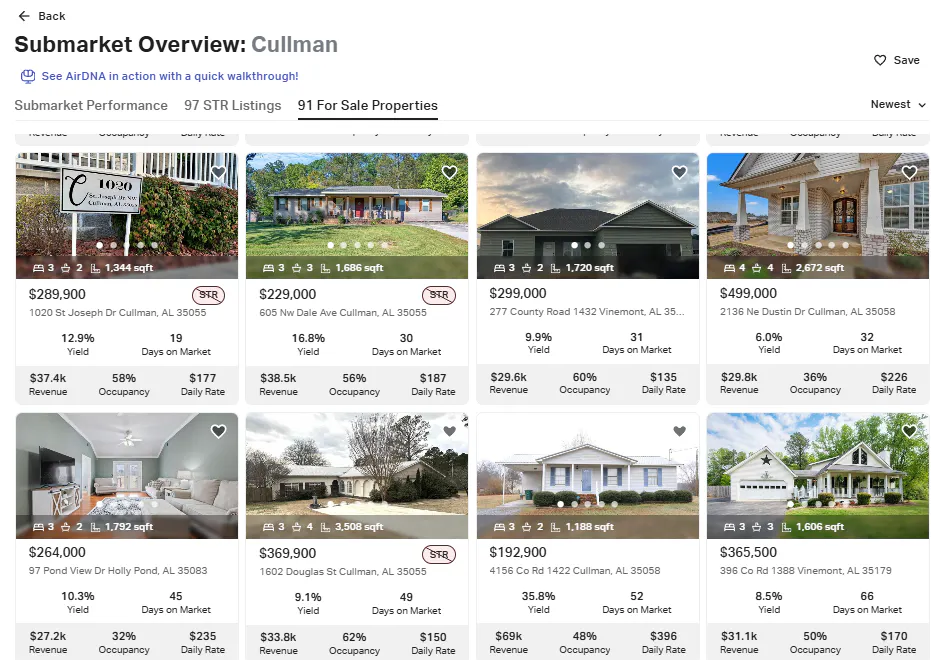
If you judged Alabama by its overall market score, you’d completely overlook Cullman—a submarket quietly outperforming the state. That’s what happens when you rely only on broad market data without digging deeper with a submarket analysis.
2. Mistaking One Metric for the Big Picture
Too many investors fixate on a single impressive metric—like high occupancy rates or attractive ADRs—without examining how different factors interact. This narrow focus is another airbnb analysis mistake to avoid that creates blind spots. Such blind spots can transform promising opportunities into costly mistakes.
Successful STR investing requires comprehensive analysis that connects multiple data points. When investors rely on partial information, they typically:
- Celebrate high occupancy without considering if low rates are driving it
- Chase markets with eye-catching ADRs without checking seasonal fluctuations
- Make decisions based on current trends without historical context
- Focus on revenue potential without examining regulatory restrictions
Even sophisticated investors who use data tools regularly can fall into the trap of single-metric thinking. Our very own Market Score is a perfect example. While it provides a powerful starting point for market evaluation, the number itself isn't enough—it's the components behind it that tell the complete story.
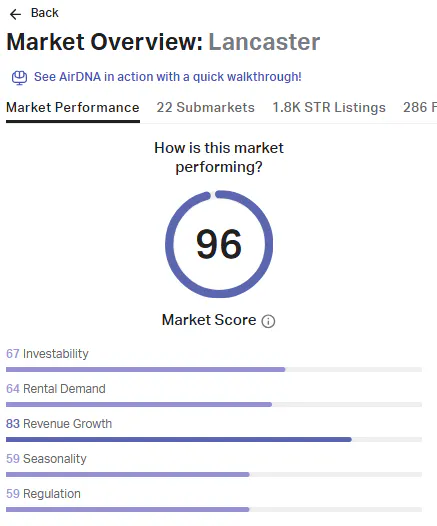
What makes our Market Score a helpful analysis tool isn't just the overall rating but the five distinct elements that work together to reveal a market's true potential:
- Investability measures property costs against potential income.
- Rental Demand tracks traveler interest through occupancy and listing growth.
- Revenue Growth shows year-over-year earnings performance.
- Seasonality reflects how much demand patterns shift (or don’t) across the year.
- Regulation assesses the local regulatory environment.
A market scoring 85 might look universally attractive until you examine its components individually. That same market might have strong Investability and Revenue Growth, but less attractive levels of Seasonality and Regulation. For some investors, those weaknesses matter more than others.
Your specific strategy determines which components deserve priority:
- Financing a property? Seasonality and Rental Demand directly impact your ability to make monthly payments.
- Planning a hands-off investment? Regulation becomes critical as it affects property management complexity.
- Looking for maximum ROI? Investability and Revenue Growth take higher priority.
- Already own a property in a seasonal destination? A market with less seasonality might balance your real estate portfolio.
The most successful STR investors understand that data is a guide, not a guarantee. They look beyond impressive top-line numbers to understand the complete picture—how metrics interact with each other and align with their specific goals. This big-picture approach helps you spot investment opportunities that one or two data points alone won’t show.
3. Ignoring Your Competition
Thinking about installing that $10,000 hot tub to boost your Airbnb bookings? Without analyzing your competition first, you might be throwing money down the drain. Your perfect investment can quickly turn into a disappointment if you ignore what similar properties in your market are actually doing—and whether their strategies are working.
The mistake is common but costly: Investors spend hours researching general market trends but skip studying their direct competitors.
When you skip this step, you risk:
- Setting prices too high during slow periods, leading to empty calendars
- Pricing too low during peak season when guests would happily pay more
- Investing in expensive amenities that don't actually drive bookings
- Creating a listing that looks identical to dozens of other properties
- Missing seasonal strategies other hosts have already perfected

AirDNA makes competitor analysis easy through the STR Listings tab, where you can filter properties by:
- Property characteristics: bedrooms, bathrooms, guest capacity
- Real estate type: apartment, house, B&B, unique properties
- Price tiers: budget, economy, midscale, luxury
- Performance metrics: occupancy rate, ADR, revenue, review count
- Host details: unit count, professional vs. individual hosts
- Amenities: pool, hot tub, pet-friendly, WiFi, and many more
These filters reveal what works in your market. For example, comparing Orlando properties might show pools add $45 to nightly rates only during summer—making that expensive installation questionable for year-round returns. Conversely, in mountain destinations like Aspen, you might discover that properties with hot tubs consistently earn 30% higher rates year-round and book 45% faster—making that $10,000 hot tub a smart investment that pays for itself within a year.
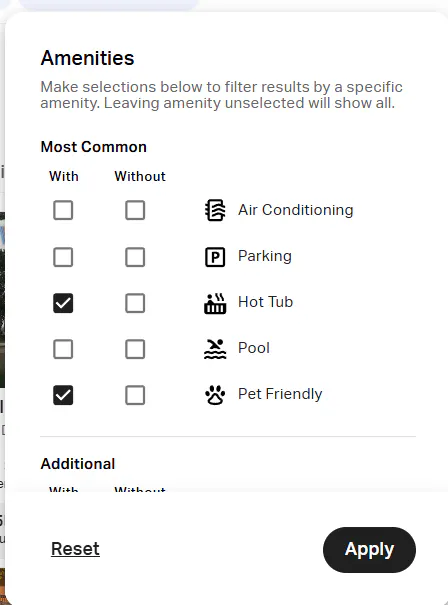
For an even closer look at your competition, try AirDNA's Custom Comps feature. When you connect your Airbnb listing, we automatically create a list of up to 100 nearby properties that match yours. Each property gets a Match Score showing how similar it is to your listing. You can easily adjust this list by adding or removing properties. As you make changes, you'll instantly see how these direct competitors are performing compared to your property.
Armed with this detailed view, you'll make decisions based on what truly works in your market—not what's trendy in host forums or what worked elsewhere. While others guess, you'll know.
4. Chasing ‘Trends’ Without Understanding Them
Many investors fall into the trap of reacting to short-term market swings like they’re chasing ghosts—panicking at every dip and rushing in at every surge. One slow month, and they slash rates, sell off properties, or assume the market is collapsing. The next month, bookings spike, and suddenly they’re all-in, convinced they’ve struck gold.
Both reactions lead to bad decisions. Overcompensating for normal market variations is a classic Airbnb market analysis mistake to avoid.
Not every slowdown is a warning sign, and not every spike means you’ve found the next hot market. Some fluctuations are just seasonal shifts—temporary and predictable. Others point to real trends that impact long-term profitability. The key is knowing the difference. Misreading these shifts can lead to bad pricing, mistimed investments, and missed opportunities.
Here’s how you know the difference between a temporary dip and a true market shift:
- Seasonality is predictable — A ski town almost always slows down in summer (though some ski markets have a thriving summer crowd in mountain bikers and hikers). A beach market will see demand drop in winter. Lower occupancy during the off-season isn’t a red flag—it’s just how the market works.
- Real market shifts happen over time — If a city sees steady tourism growth, rising occupancy, or increasing regulations, that’s a true trend. If demand keeps dropping year after year, it could signal deeper issues.
Market data doesn’t exist in a vacuum—external factors often drive short-term fluctuations. Understanding the "why" behind market changes helps separate real opportunities from temporary noise.
- Economic conditions – A booming job market can fuel travel demand, while a downturn can slow bookings.
- Regulations – A ban in one area can push demand to nearby neighborhoods—but is that a lasting shift or a short-term reshuffling?
- One-time events – Big festivals or sports tournaments can drive temporary demand spikes, but unless they happen annually, they’re not a reliable indicator of market strength.
Jumping to conclusions based on short-term swings is one of the most common Airbnb seasonality mistakes. Overreacting to a seasonal slowdown can lead to unnecessary panic, while misinterpreting a temporary surge can set unrealistic expectations. Smart investors focus on long-term data, not month-to-month fluctuations.
5. Assuming Your Market Will Always Allow Short-Term Rentals
Short-term rental regulations aren’t set in stone, yet too many investors act like they are. Just because STRs are allowed today doesn’t mean they’ll be allowed tomorrow.
Overlooking local regulations is one of the costliest Airbnb market research mistakes an investor can make. Cities are constantly tweaking laws, and those changes can come fast. A market that looks like an investor’s dream today could be buried under red tape next year. If you’re not paying attention, you could find yourself stuck with a property that’s suddenly illegal, restricted by strict caps, or facing expensive permits just to stay in business.
We’ve seen it happen before. New York cracked down on short-term rentals, forcing thousands of listings offline. Dallas imposed new zoning rules that left many Airbnb investors scrambling. Barcelona is set to ban new short-term rental licenses entirely. These shifts didn’t happen overnight—but many hosts still got caught off guard. If you’re not factoring in regulations, you’re not investing—you’re gambling.
Here’s how to stay ahead of regulatory changes:
- Research before you buy — Check zoning laws, permit requirements, and any proposed legislation that could impact STRs. Don’t assume a market is safe just because it’s booming now. Here are 10 ways you can look up short-term rental ordinances.
- Monitor local government updates — STR laws change fast. Subscribe to city council updates, follow real estate groups, and join local Airbnb host communities to stay informed.
- Have a backup plan — If regulations tighten, can your property pivot to mid-term or long-term rentals? If the answer is no, rethink the investment.
The bottom line? Assuming regulations won’t change is one of the riskiest mistakes an investor can make. Smart hosts don’t play defense—they stay ahead of the game.

6. Letting Your Data Go Stale
Most investors do their research before buying an Airbnb property—but too many stop there. They check the numbers once, assume the market will hold steady, and never look back. But vacation rental markets don't sit still.
Demand shifts, pricing trends evolve, and seasonal patterns change faster than expected. A new hotel can siphon bookings from STRs. A nearby city easing regulations can suddenly shift demand. Your "off-season" might not be so slow anymore—meaning you've been underpricing when demand is actually rising.
Here's how often we recommend you should check in on your market to stay competitive:
- Weekly: Monitor booking pace and competitor pricing trends, especially if demand is shifting or a high season is approaching. Adjust rates accordingly.
- Monthly: Check your competitive set’s performance, including occupancy, ADR, and revenue trends. Make sure your pricing stays aligned with real-time market conditions. (You can also bookmark AirDNA’s Monthly Market Review)
- Quarterly: Review broader market trends, seasonality patterns, and year-over-year shifts in occupancy and demand to fine-tune long-term strategy.
- Yearly: Analyze high-level market shifts with AirDNA’s Best Places to Invest and other long-term forecasting tools. These resources highlight emerging trends and potential investment opportunities before they impact your market.
- Immediately: React to major events like regulatory changes, economic shifts, or new supply entering the market to avoid unexpected losses.
You could spend hours piecing this data together yourself—jumping between Airbnb listings, scraping spreadsheets, and trying to spot patterns on your own.
Or you could just log in to AirDNA.
Our dashboard gives you complete control over how you view your market (or any market you’re eyeing up!). Filter by last month, last quarter, year-over-year, or custom date ranges. Compare summer 2023 to summer 2024, or see how weekends perform versus weekdays. Switch between monthly, weekly, or daily views to catch micro-trends that others miss. The choice is yours.
These are just some of the metrics you can dive deep into:
- Revenue trends – Spot whether earnings are growing or declining
- Occupancy shifts – See if demand is rising or cooling off
- Average Daily Rate (ADR) – Track how rates fluctuate across seasons
- Booking lead time – Understand if guests are booking earlier or later
- Seasonality patterns – Identify high and low periods to adjust pricing
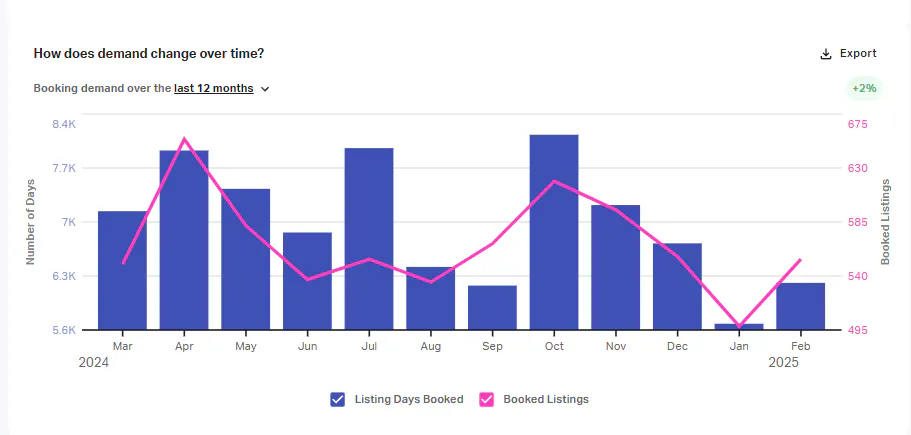
Of course, what you really care about is your Airbnb. The good news is you can easily connect your Airbnb listing to AirDNA to see exactly where you stand, both in the market and against your competitors. Instead of guessing based on old information, you'll know in real-time how your pricing and performance measure up as the market changes around you.
Remember: The market insights that guided your initial investment have an expiration date. In short-term rentals, staying current isn't just good practice—it's the difference between maximizing profits and wondering why your once-thriving property is suddenly struggling.
FAQs
What are the biggest Airbnb host market mistakes?
Assuming that "tourists love this city" means any Airbnb in the vicinity will thrive is a costly mistake. Not all neighborhoods perform the same—some have strong demand, while others struggle. Many hosts also ignore short-term rental regulations, assuming current rules won’t change. Pricing errors—overcharging in slow seasons or underpricing during peak demand—can eat into profits. Seasonality and competitor analysis are often overlooked, leaving hosts unprepared for demand fluctuations or unaware of what amenities drive bookings.

What are key Airbnb market analysis tips?
Top hosts dig deeper. In your market analysis, analyze neighborhoods, not just citywide trends. Research STR regulations and enforcement patterns. Track occupancy, ADR, and RevPAR over time. Study competitor pricing and booking pace to adjust rates effectively. Watch for pipeline growth that could affect supply and demand.
How do I know if I’m investing in the right Airbnb market?
A strong tourism market doesn’t guarantee STR success. Look at occupancy rates, revenue growth, and RevPAR to gauge real demand. Check local regulations—just because STRs are allowed now doesn’t mean they always will be. Assess seasonality—is demand year-round, or does the market rely on just a few peak months? Finally, study competitor performance—are similar listings thriving, or is the market oversaturated? A profitable investment requires more than surface-level research.
How often should I update my Airbnb market research?
STR markets change fast, and outdated data can cost you. Check market trends quarterly to track occupancy, pricing, and demand. Review competitor pricing monthly to stay competitive. If major events—like new regulations, economic shifts, or big developments—affect your market, update your research immediately to avoid surprises.
What tools can help me analyze an Airbnb market?
Successful Airbnb investors use data to make informed decisions. AirDNA gives you full visibility into market trends, pricing shifts, and demand patterns, so you’re never flying blind. Whether you’re evaluating a new investment or optimizing a current listing, you can track occupancy, ADR, and revenue performance down to the neighborhood level.
You’re in control of how you view the data—filter by date ranges, compare year-over-year trends, and zoom in on specific property types or price points. Instead of chasing down scattered information across multiple sources, everything you need is in one dashboard.
ARTICLE SUMMARY
Doing some market analysis for your Airbnb? Be careful—looking at the wrong information can lead to fewer bookings and lost income. Here are 6 common mistakes (and how to avoid them).
Jamie Lane
AirDNA Chief Economist
He is responsible for data analysis, thought leadership, and leveraging advanced analytical techniques to provide new insights into short-term rental market trends. Native to Atlanta and an Airbnb host himself, Jamie enjoys cycling, mountain biking, backpacking, running, and playing in a dart league in his free time.
