

 Calculate Revenue
 Research Markets
 Find For Sale Properties
 Compare My Listing
 STR Revenue Calculator
 Custom Comp Sets
 Submarket Insights
 Custom Search Filters
 Rate Recommendations
 Performance Benchmarking
 Competitor Comparison
 Owner Contact Details
 Property-level performance data
 Tourism Insights
 Real Estate Investment Analytics
 About Us
 Sales
Sales Support
 Press
PressHow to Forecast Rental Income (And Avoid Costly Surprises)
Published: April 19, 2025
Last updated: September 8, 2025

Dillon DuBois
Key Takeaways
- You should always forecast income before buying or listing a rental. A simple rental forecast helps you understand if a property can actually meet your goals.
- Short-term and long-term rentals need different forecasting approaches. Long-term rentals are more stable, but short-term rentals can earn more—if you understand how to model things like occupancy, nightly rates, and seasonality.
- Tools like AirDNA help you go beyond estimates by showing what similar rentals are actually earning, so your numbers are based on real data.
A rental property can look like a great deal… until the income doesn’t add up.
Before you commit to buying, listing, or renovating, it’s worth asking: What will this place actually earn? Too often, investors and hosts rely on rough guesses or hopeful projections. But the best rental strategy starts with knowing your numbers.
Forecasting helps you test your assumptions, spot red flags early, and see if a property truly fits your goals. It’s not about getting every number perfect—it’s about giving yourself the clarity to move forward with confidence, whether you’re renting long-term or listing on Airbnb.
Why Rental Income Forecasting Matters
Forecasting isn’t just a box to check—it’s the foundation of everything that comes next. It helps you answer big-picture questions early, like:
- Is this property worth the purchase price?
- Can it cover the mortgage and still bring in profit?
- What could I realistically earn each month—and over the long term?
When you know the answers before you commit, you’re less likely to be caught off guard later by high expenses, low demand, or income that doesn’t match your expectations. It’s how you move from “I think this might work” to “I know what I’m getting into.”

Smart investments happen here.
AirDNA’s powerful yet easy-to-use tools make hosting and investing a breeze. This means having every insight you need, all in one place, always up-to-date.
How to Forecast Rental Income Yourself in 5 Steps
If you’re just getting started, or want to run the numbers before diving into advanced tools, building a basic rental property income projection yourself is a solid place to begin. Whether you're thinking of long-term leases or short-term stays, this approach helps you understand the financial shape of a property before you commit.
1. Estimate your upfront and ongoing costs
Before you look at what you might earn, you need to understand what the property will cost—both to purchase and to operate.
Start with your one-time costs (essentially, your cost to purchase):
- Home price
- Down payment
- Closing costs
Add these together to get your total upfront investment. This is important if you want to evaluate your return later.
Next, estimate your ongoing monthly costs:
- Mortgage payment
- Property taxes
- Insurance
- HOA fees (if applicable)
- Routine maintenance and repairs
= Estimated monthly expenses
These are the numbers that stay fairly steady in most forecasts. You’ll use them to calculate cash flow and ROI.

2. Project your rental income
This is where you estimate how much revenue the property might bring in based on the rental strategy you’re considering.
For long-term rentals:
Projected Monthly Income = Market Rent for Similar Properties
Check listings in your area or speak to a local agent or property manager. If you expect rent to grow over time, you might add a conservative 2–5% annual increase to your model.
For short-term rentals:
Projected Monthly Income = Average Daily Rate × Occupancy Rate × 30
Let’s say you expect $180/night and 70% occupancy:
→ $180 × 0.7 × 30 = $3,780/month
Short-term income can vary a lot with seasonality, so it helps to create separate projections for peak and off-season periods. Tools like AirDNA can give you this breakdown based on real data, but you can start by looking at local listings and booking platforms.
3. Estimate monthly cash flow
Now that you’ve got income and expenses, you can forecast cash flow:
Monthly Cash Flow = Projected Monthly Income – Monthly Expenses
This tells you how much you might earn each month after covering costs. To be safe, it’s smart to run a few versions—best-case, worst-case, and somewhere in between—so you know where things stand if bookings slow down or costs rise.
4. Think about longer-term returns
Cash flow is just one part of the picture. You'll also want to understand how the property performs over time.
Start by asking:
- How long will it take to recover my upfront investment?
- What happens if rent or revenue grows each year?
- How does this property compare to others I’m considering?
If you want to go deeper, you can calculate metrics like cap rate, cash-on-cash return, or rental yield. These help compare properties across markets or financing strategies, and can be especially useful if you're trying to choose between two or more potential investments.
5. Build in future growth
A good forecast looks beyond year one. Think about how income and expenses might change over time.
- For long-term rentals, it’s common to model expected rent rate increases of 2–5% per year.
- For short-term rentals, growth depends more on seasonal demand, pricing strategy, and improvements you might make to the guest experience.
This kind of DIY forecast won’t capture every detail, but it’s a strong foundation. It helps you gut-check whether a property might work, compare long-term and short-term strategies, and prep for deeper research. From there, rental income estimation tools like AirDNA can help you sharpen your numbers even further—using real market data, seasonal insights, and tailored income projections that move you beyond estimates and into strategy.

Long-Term vs. Short-Term Rentals: Why It Changes How You Forecast
At this point, you’ve seen how to build a rental income forecast from scratch, but not every rental runs the same way. And the kind of rental you’re planning has a big impact on how you forecast.
Long-term rentals tend to be more predictable. You’re usually working with one tenant and a consistent monthly rent, so your focus is on local comps, vacancy rates, and stable expenses.
Short-term rentals, like Airbnbs, are more dynamic. Your income depends on how often you’re booked, what guests pay per night, and how those numbers shift across seasons. Forecasting for STRs means factoring in more moving parts—but it also opens the door to more earning potential.
That complexity is exactly why many hosts and investors turn to tools like AirDNA. When you want to move beyond estimates and into real-world performance, data makes all the difference. Let’s look at how to use it.
Discover hidden gems for your next investment
Get granular insights into which neighborhoods are hottest for vacation rentals.
How to Forecast Airbnb Rental Income with AirDNA
Once you’ve mapped out your income and expenses, the next step is testing your numbers against real-world conditions. No matter what kind of rental you’re considering, it helps to see how similar properties are actually performing—not just in theory, but in practice.
This is especially true for short-term rentals, where income can shift month to month based on seasonality, demand, and location. AirDNA helps you project short-term rental income with tools that show how active listings are earning across markets, neighborhoods, and property types. Whether you're evaluating a specific property or just exploring options, AirDNA gives you multiple ways to forecast Airbnb income based on real data, not rough averages or best guesses.
1. Use Rentalizer to forecast income for a specific property
If you’re looking at a specific property—whether it’s your current home, a rental you’re thinking about turning into an Airbnb, or a listing that just hit the market—Rentalizer is a fast and easy way to see how much income it could generate as a short-term rental.
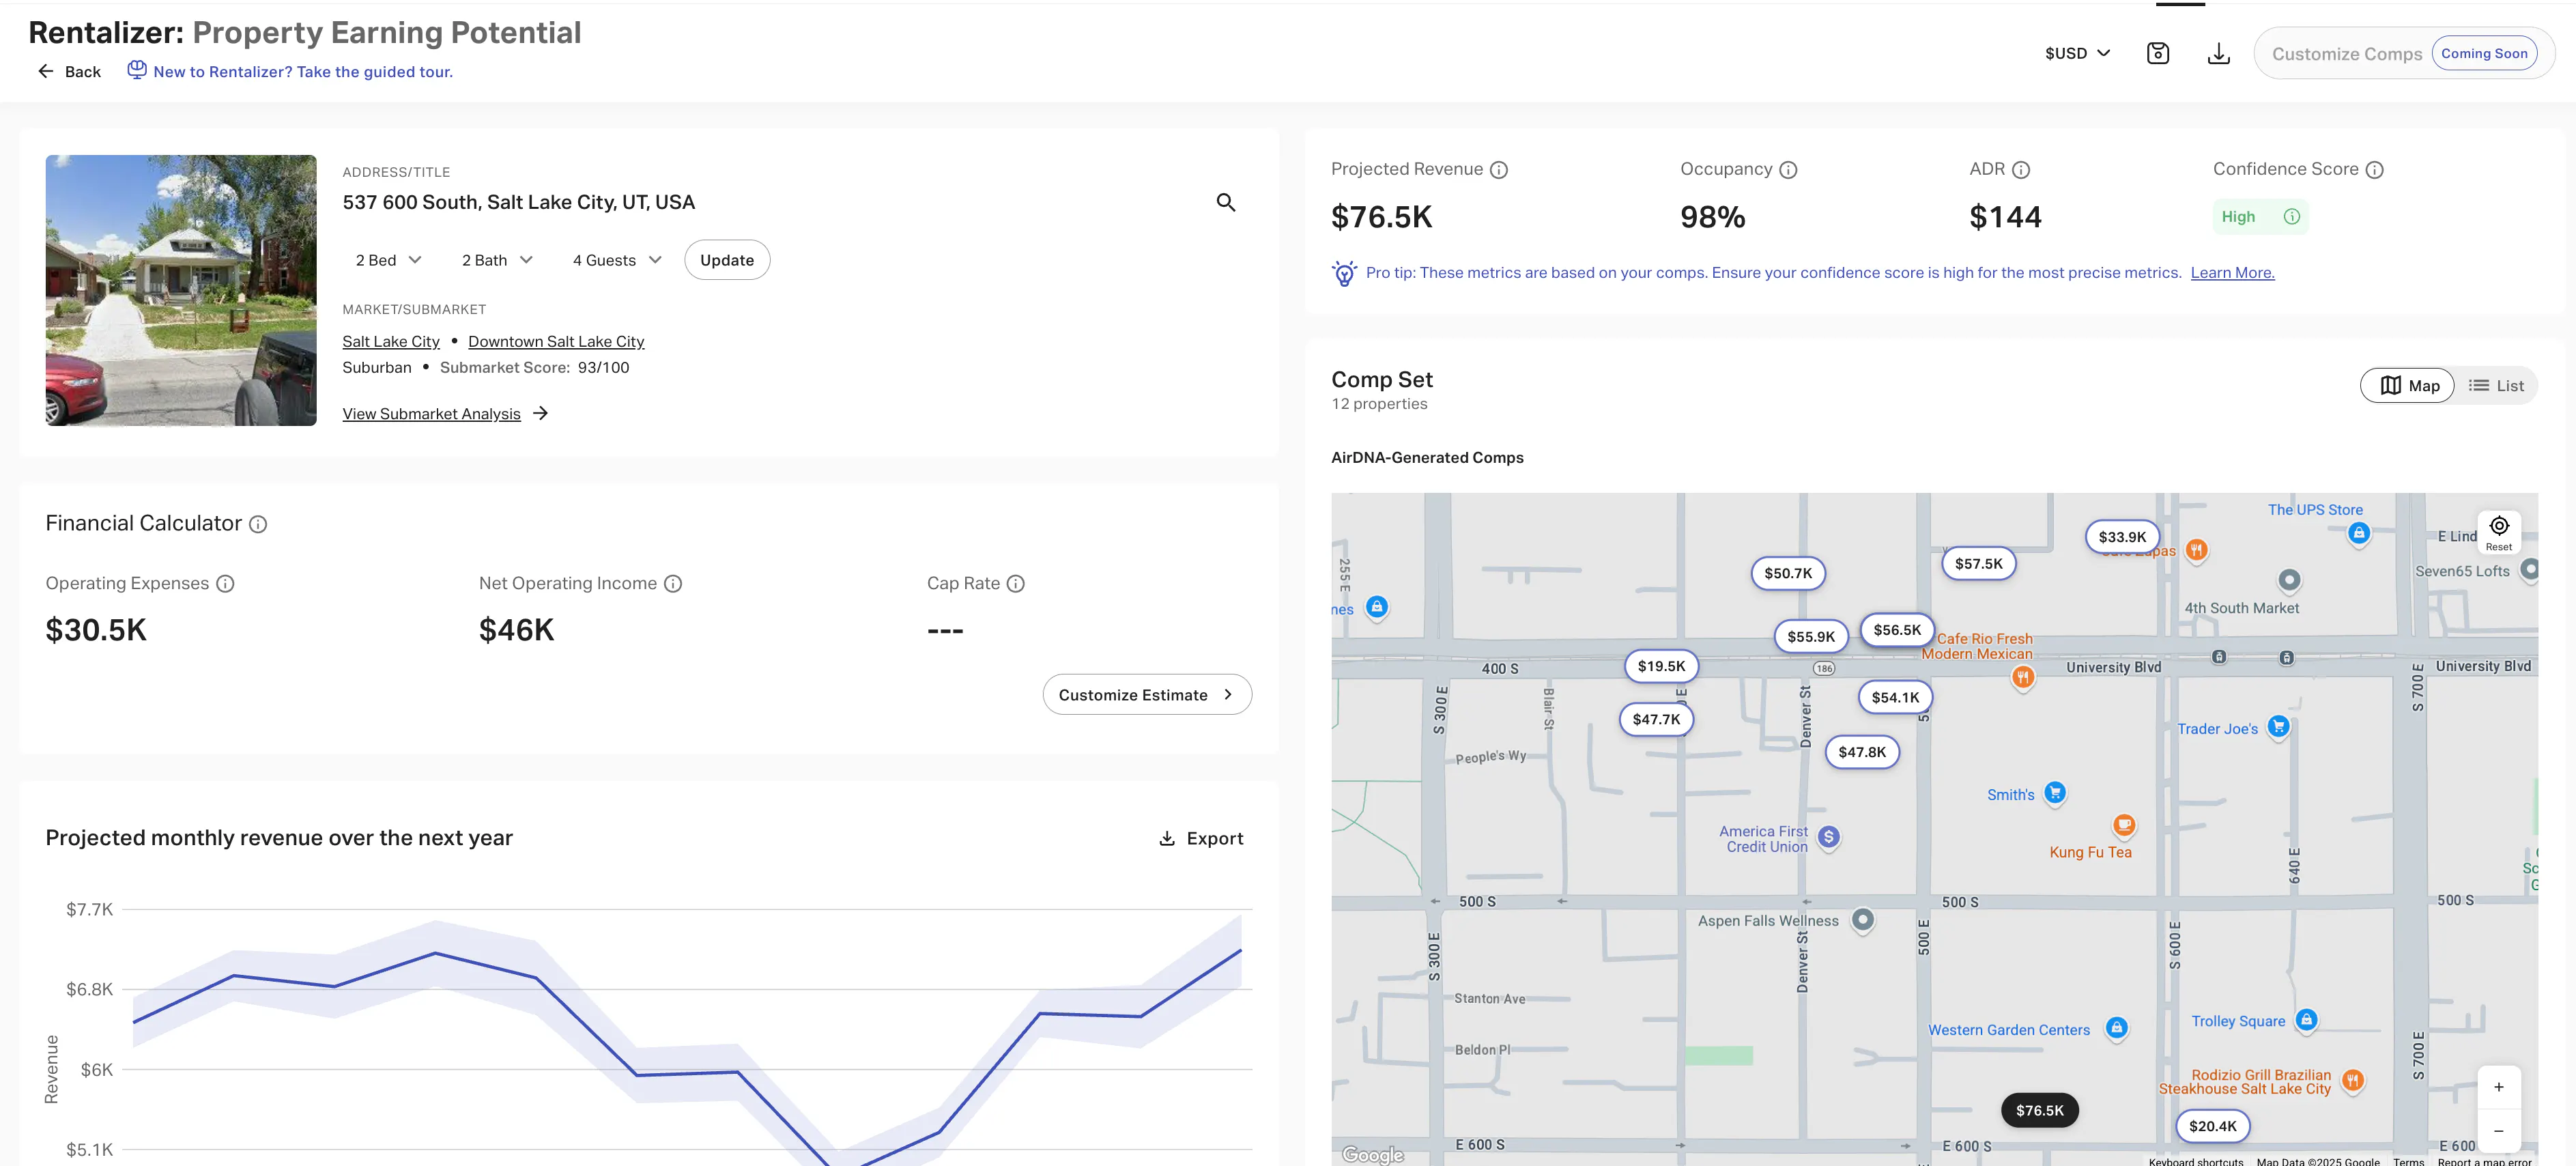
All you need to do is type in the address. From there, Rentalizer pulls together a group of nearby listings that are similar in size, type, and location. This group is called a comp set, and it’s the foundation of your income estimate. Basically, Rentalizer looks at how those similar properties have performed over the past year, then uses that data to estimate how your property might perform too.
Calculate potential earnings
Understand the investment potential of any address in the world.
You’ll also see a confidence score alongside the forecast. This score tells you how closely the comps match the property you entered—and how solid the projection is based on that. If there are lots of similar, active listings nearby with consistent performance, the confidence score will be higher. If it’s a more unique property or the area doesn’t have many comps, the score may be a bit lower.
Rentalizer assumes the property is available all year long, so the estimate you see shows full potential revenue. If you’re only planning to rent part-time or seasonally, you’ll want to scale the numbers accordingly. But it’s a helpful starting point to understand what the property could earn.
Beyond just showing revenue, Rentalizer also gives you a sense of what you might actually profit. Rentalizer automatically factors in typical expenses—like cleaning fees, property management, lodging tax, and property tax—based on typical percentages.
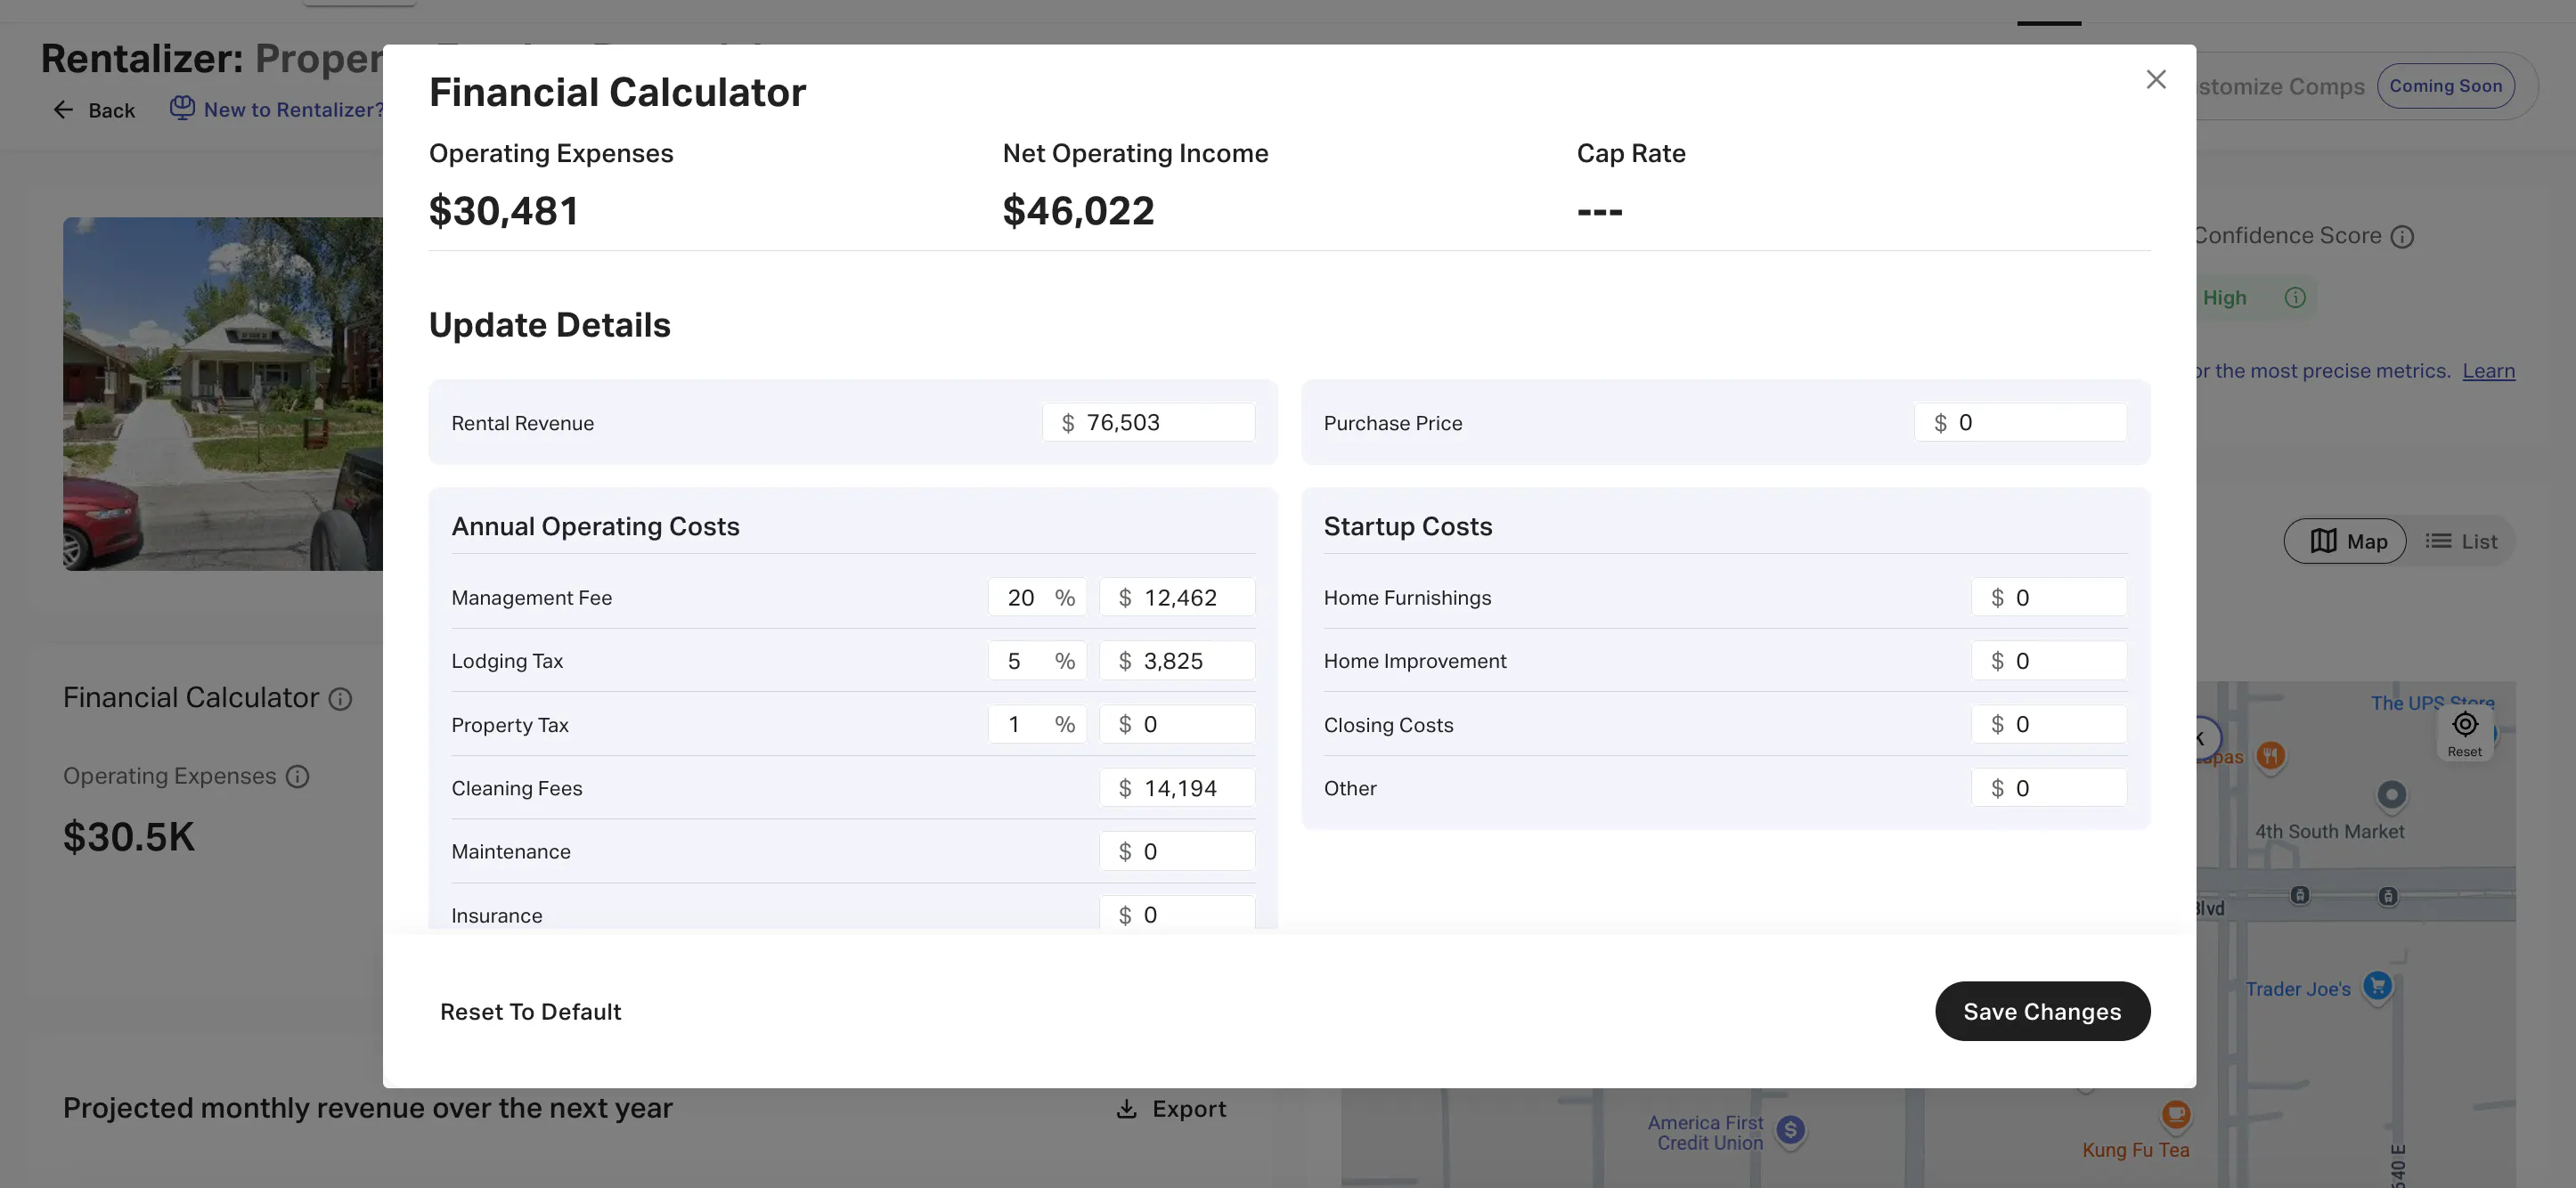
You can also adjust those numbers yourself using the simple built-in calculator or even add specific one-time costs like furniture or renovations. It’s an easy way to understand what’s left after expenses, not just what’s coming in.
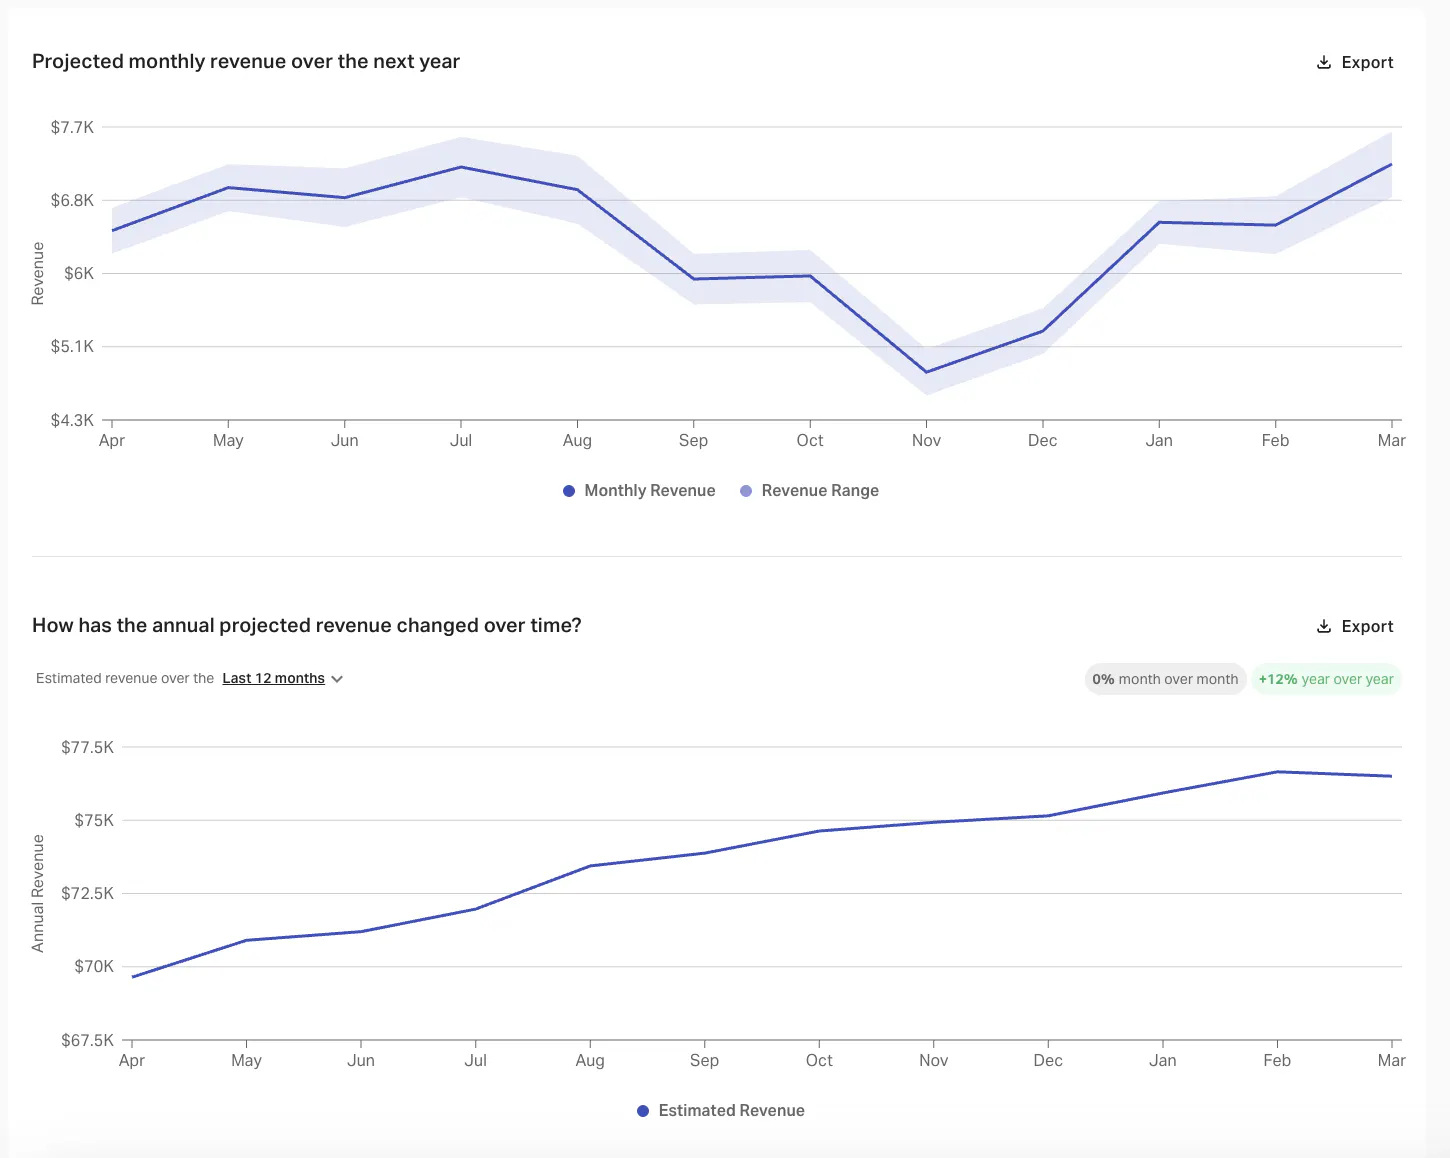
Rentalizer also shows how income varies throughout the year. You’ll see a monthly revenue chart that highlights seasonality, along with a graph that shows how projected income has changed over time. This gives you a better feel for both short-term trends and long-term potential.
If you’re still in the research phase and don’t have a specific address in mind yet, you can also use AirDNA’s for-sale property feature. It’s a searchable list of homes that are currently on the market, each with an income projection already attached. You can explore available properties in your target market and immediately see how they might perform as short-term rentals.
Find a prospective Airbnb for sale
Discover your next profitable short-term rental with real market revenue projections.
3. Build a custom comp set
Maybe you’ve already tried estimating income on your own or used Rentalizer to get a quick snapshot for a specific property. Those tools are great starting points, but what if you want to get more specific? Maybe you’re planning a unique type of rental, comparing multiple neighborhoods, or just want to take a closer look at the kinds of listings your future property would compete with.
Custom comp sets let you choose which properties are included in your income forecast. Instead of relying on broad market averages, you can hand-pick active listings that closely match the type of rental you’re planning to offer based on size, location, guest capacity, pricing tier, amenities, and more. The idea is simple: The more your comps resemble your target property, the more realistic your forecast will be.
There are two ways to build a comp set in AirDNA. You can start with an address, and AirDNA will suggest nearby listings that are a close match.
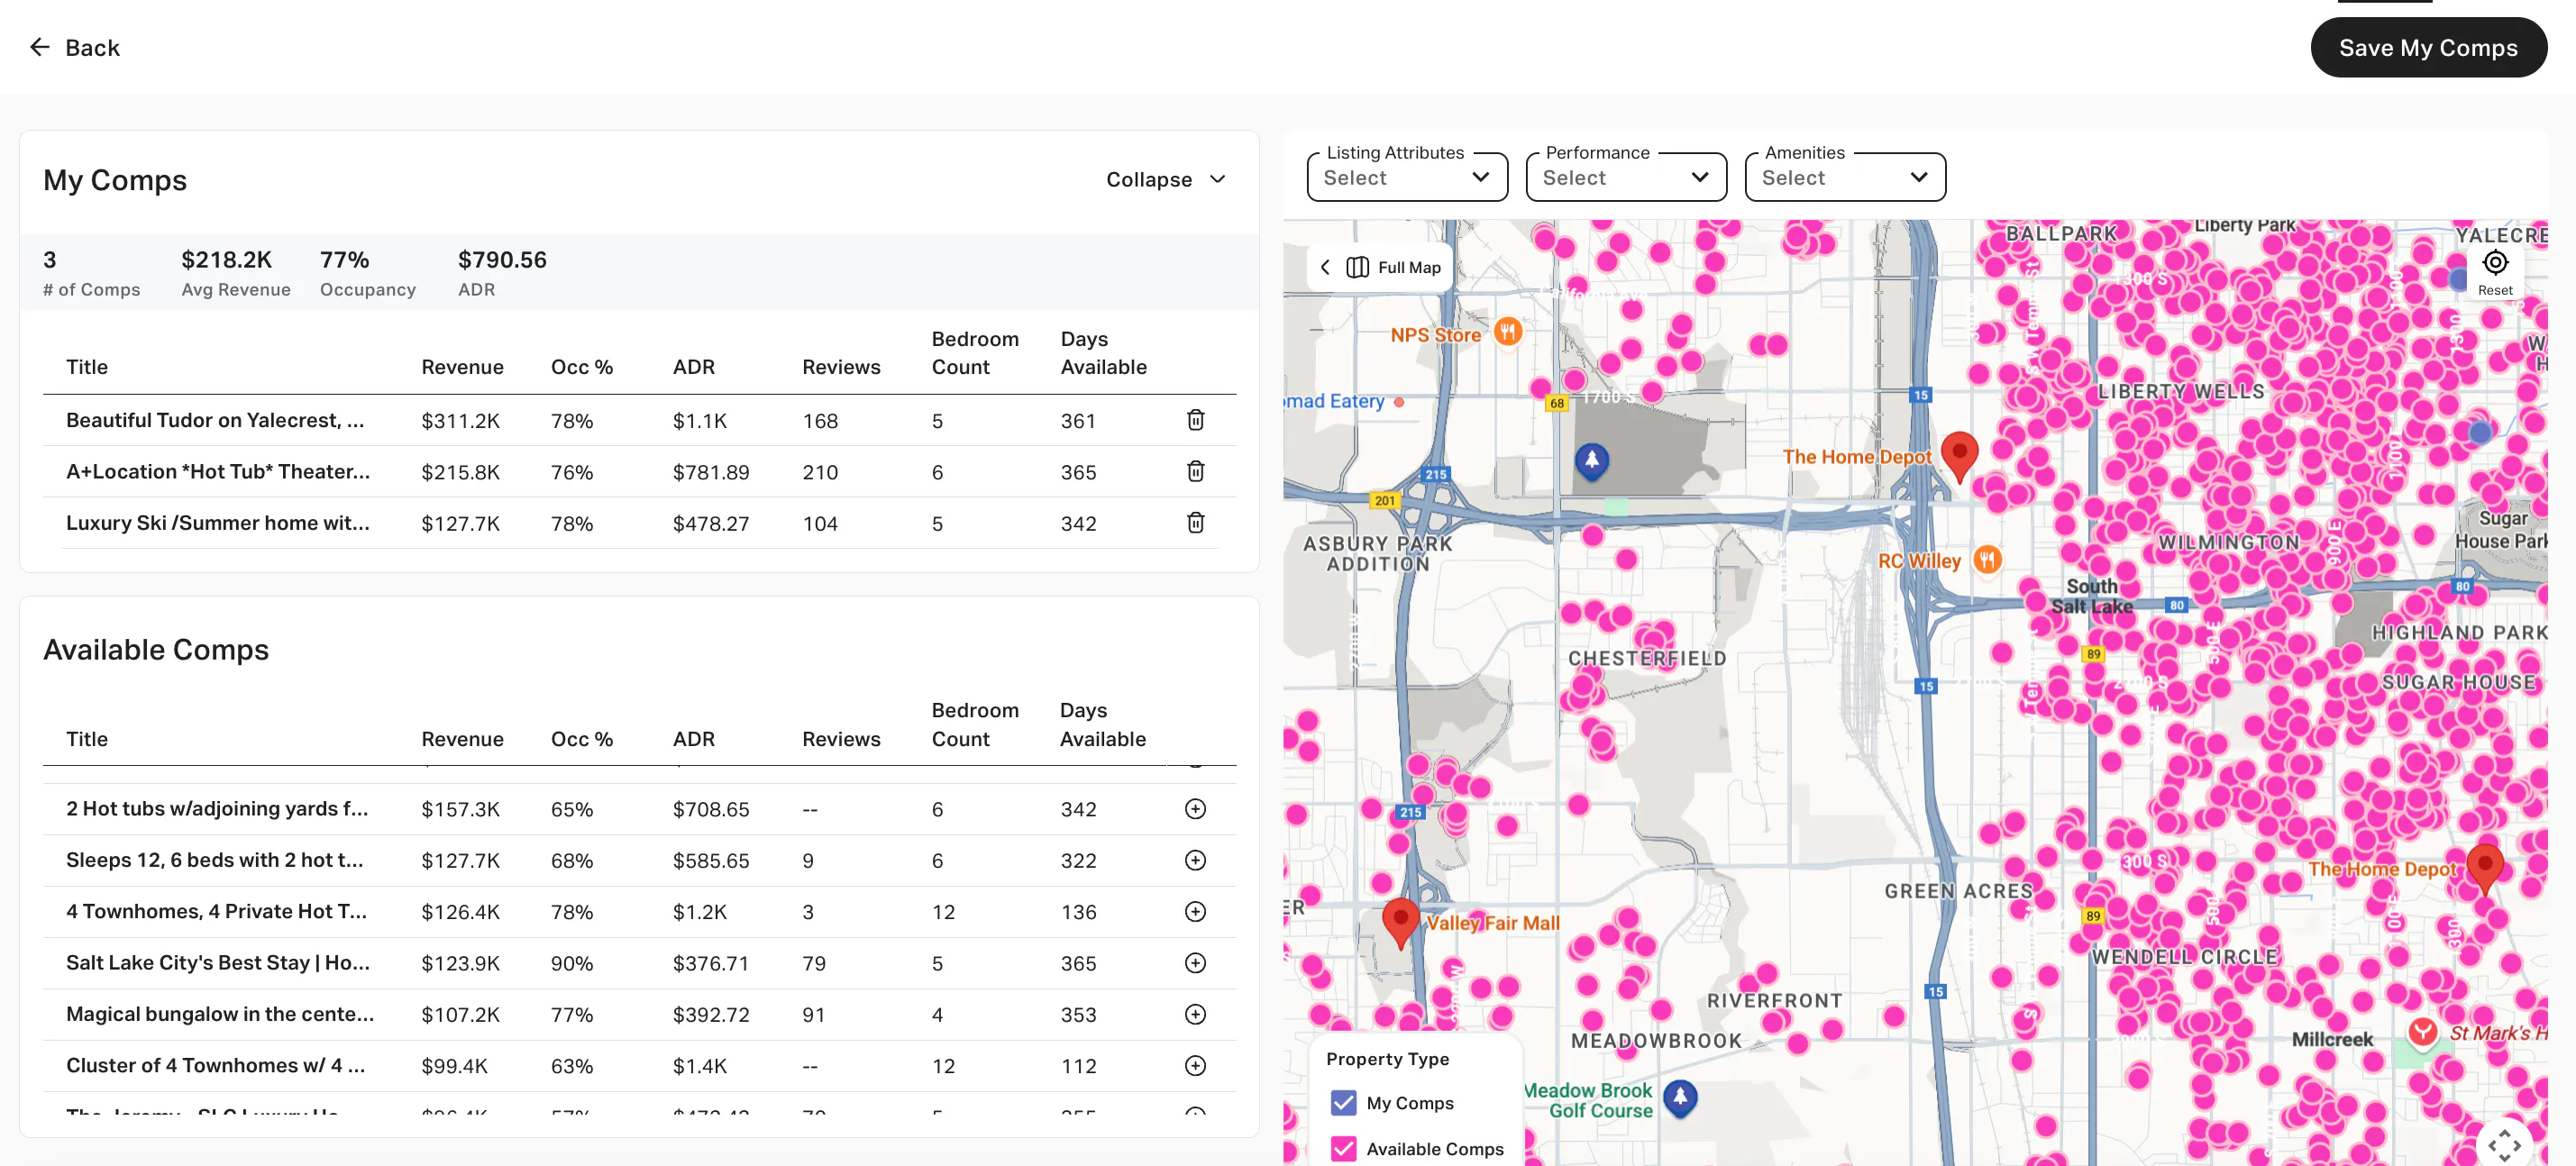
Or you can explore a market manually, using filters to find listings that meet your criteria.
Learn from your competitors
Without reliable rental comps, you're making pricing decisions in the dark. Use real data to compare your listing performance to similar properties and discover your true market position
Once you’ve selected your comps, just hit Save My Comps, and AirDNA will calculate how that group performs on average—showing key income metrics like annual revenue, occupancy, ADR, and RevPAR. You’ll also see how those numbers have changed over time, helping you factor in things like seasonality or growth.
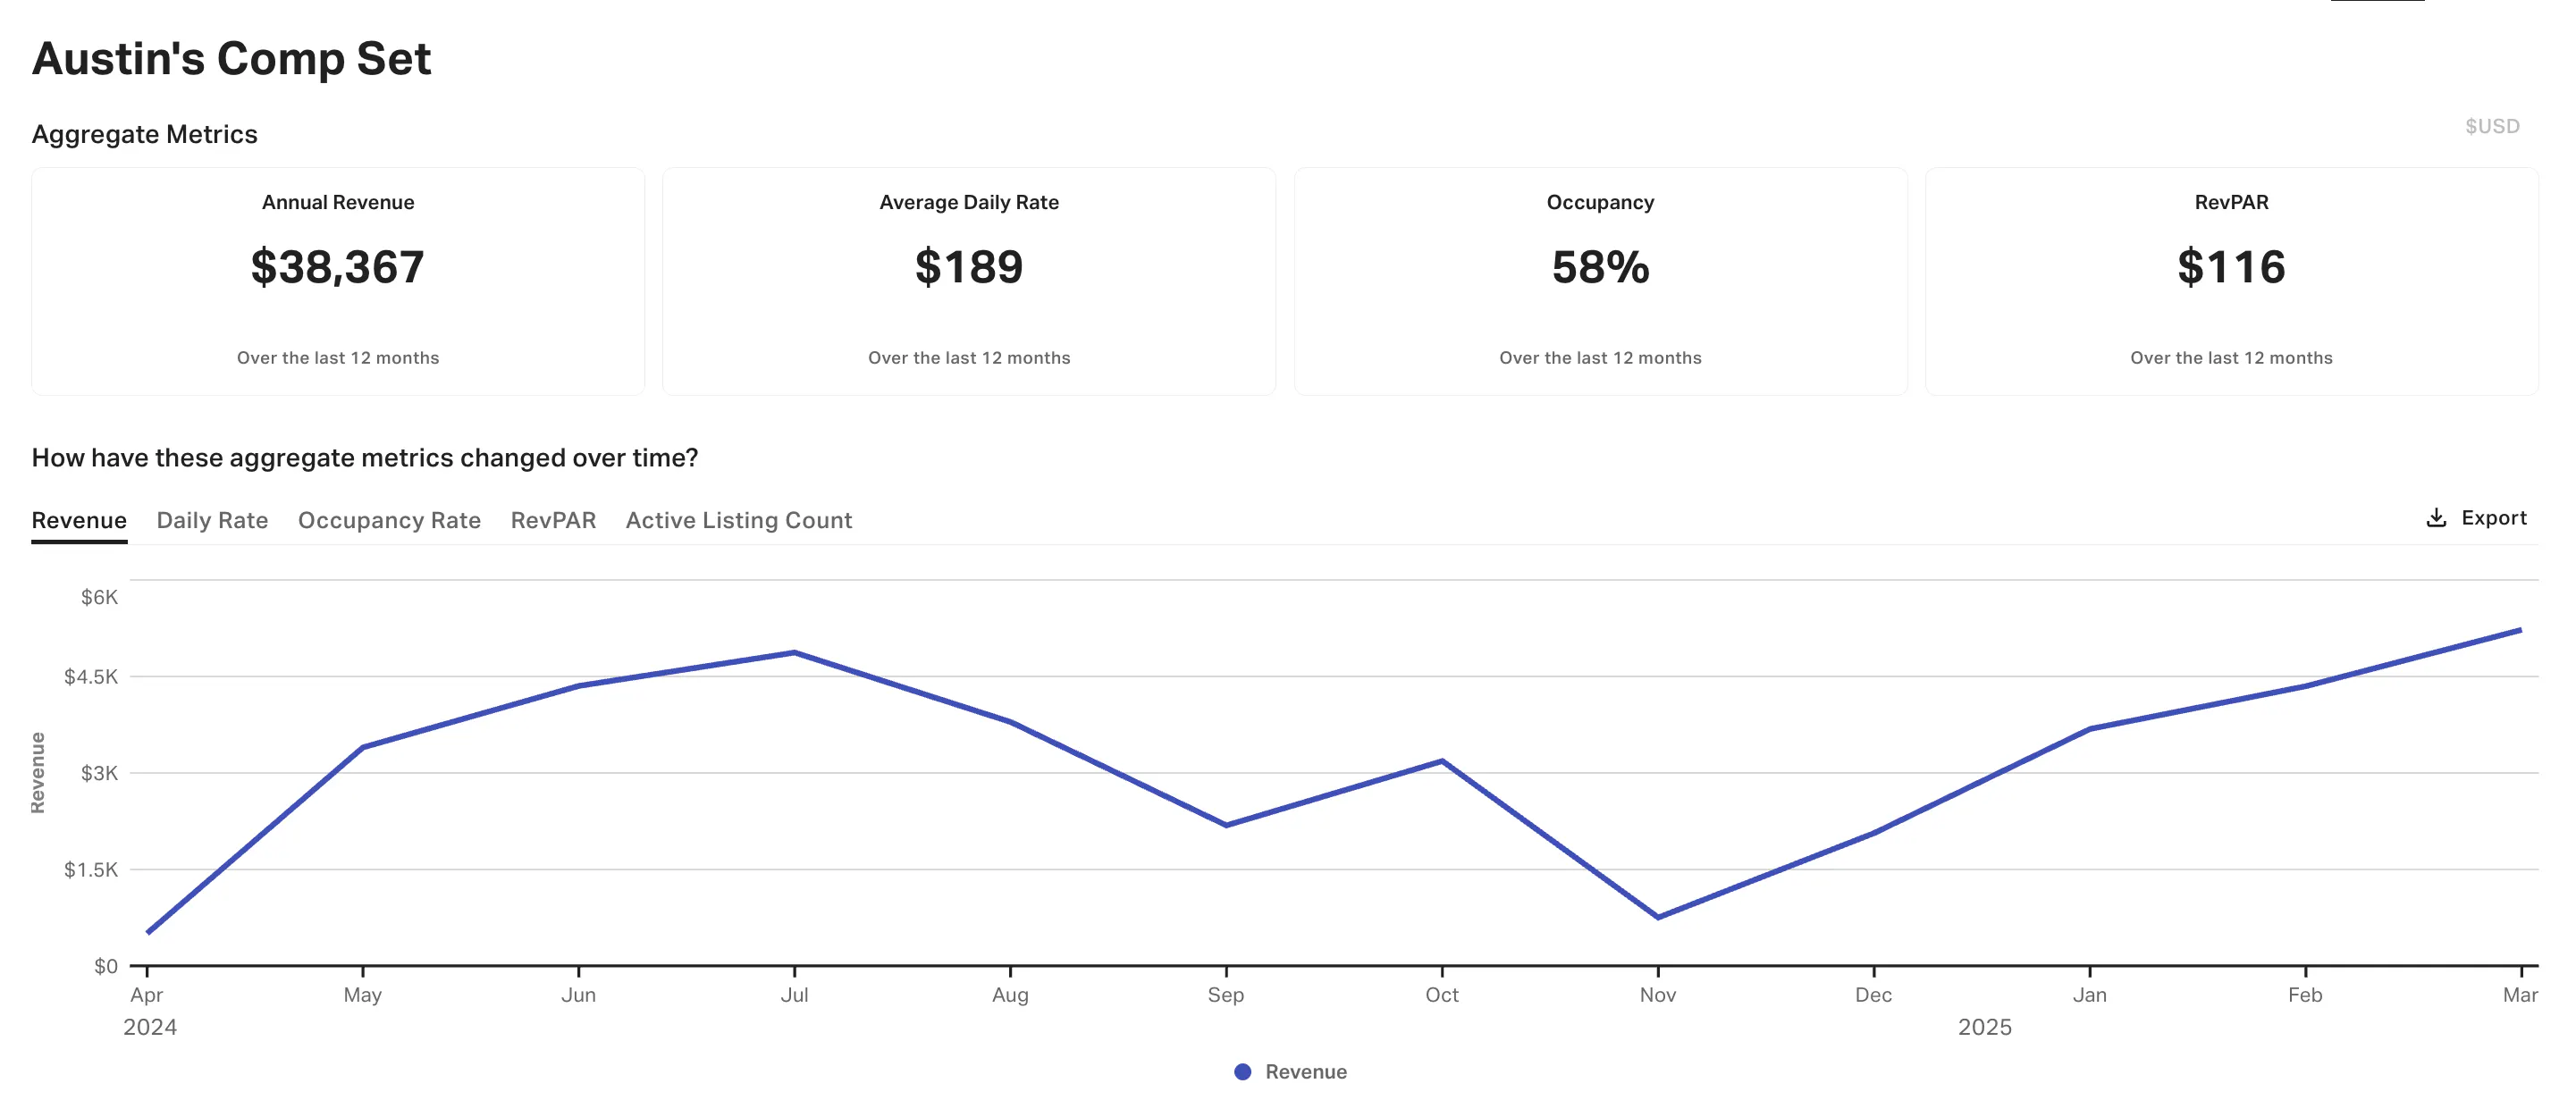
These averages become the foundation of your income forecast. If the group of listings you selected earns, say, $68K a year on average, you now have a realistic benchmark for what your property could earn—because it’s based on real data from listings just like it.
And you’re not limited to one comp set. You can create and compare multiple sets to explore different locations, property types, or pricing strategies. One set might reflect a high-end version of your rental with premium amenities, while another could be built around more budget-friendly options. This makes it easy to model different scenarios—and forecast with much more clarity than a single market average ever could.
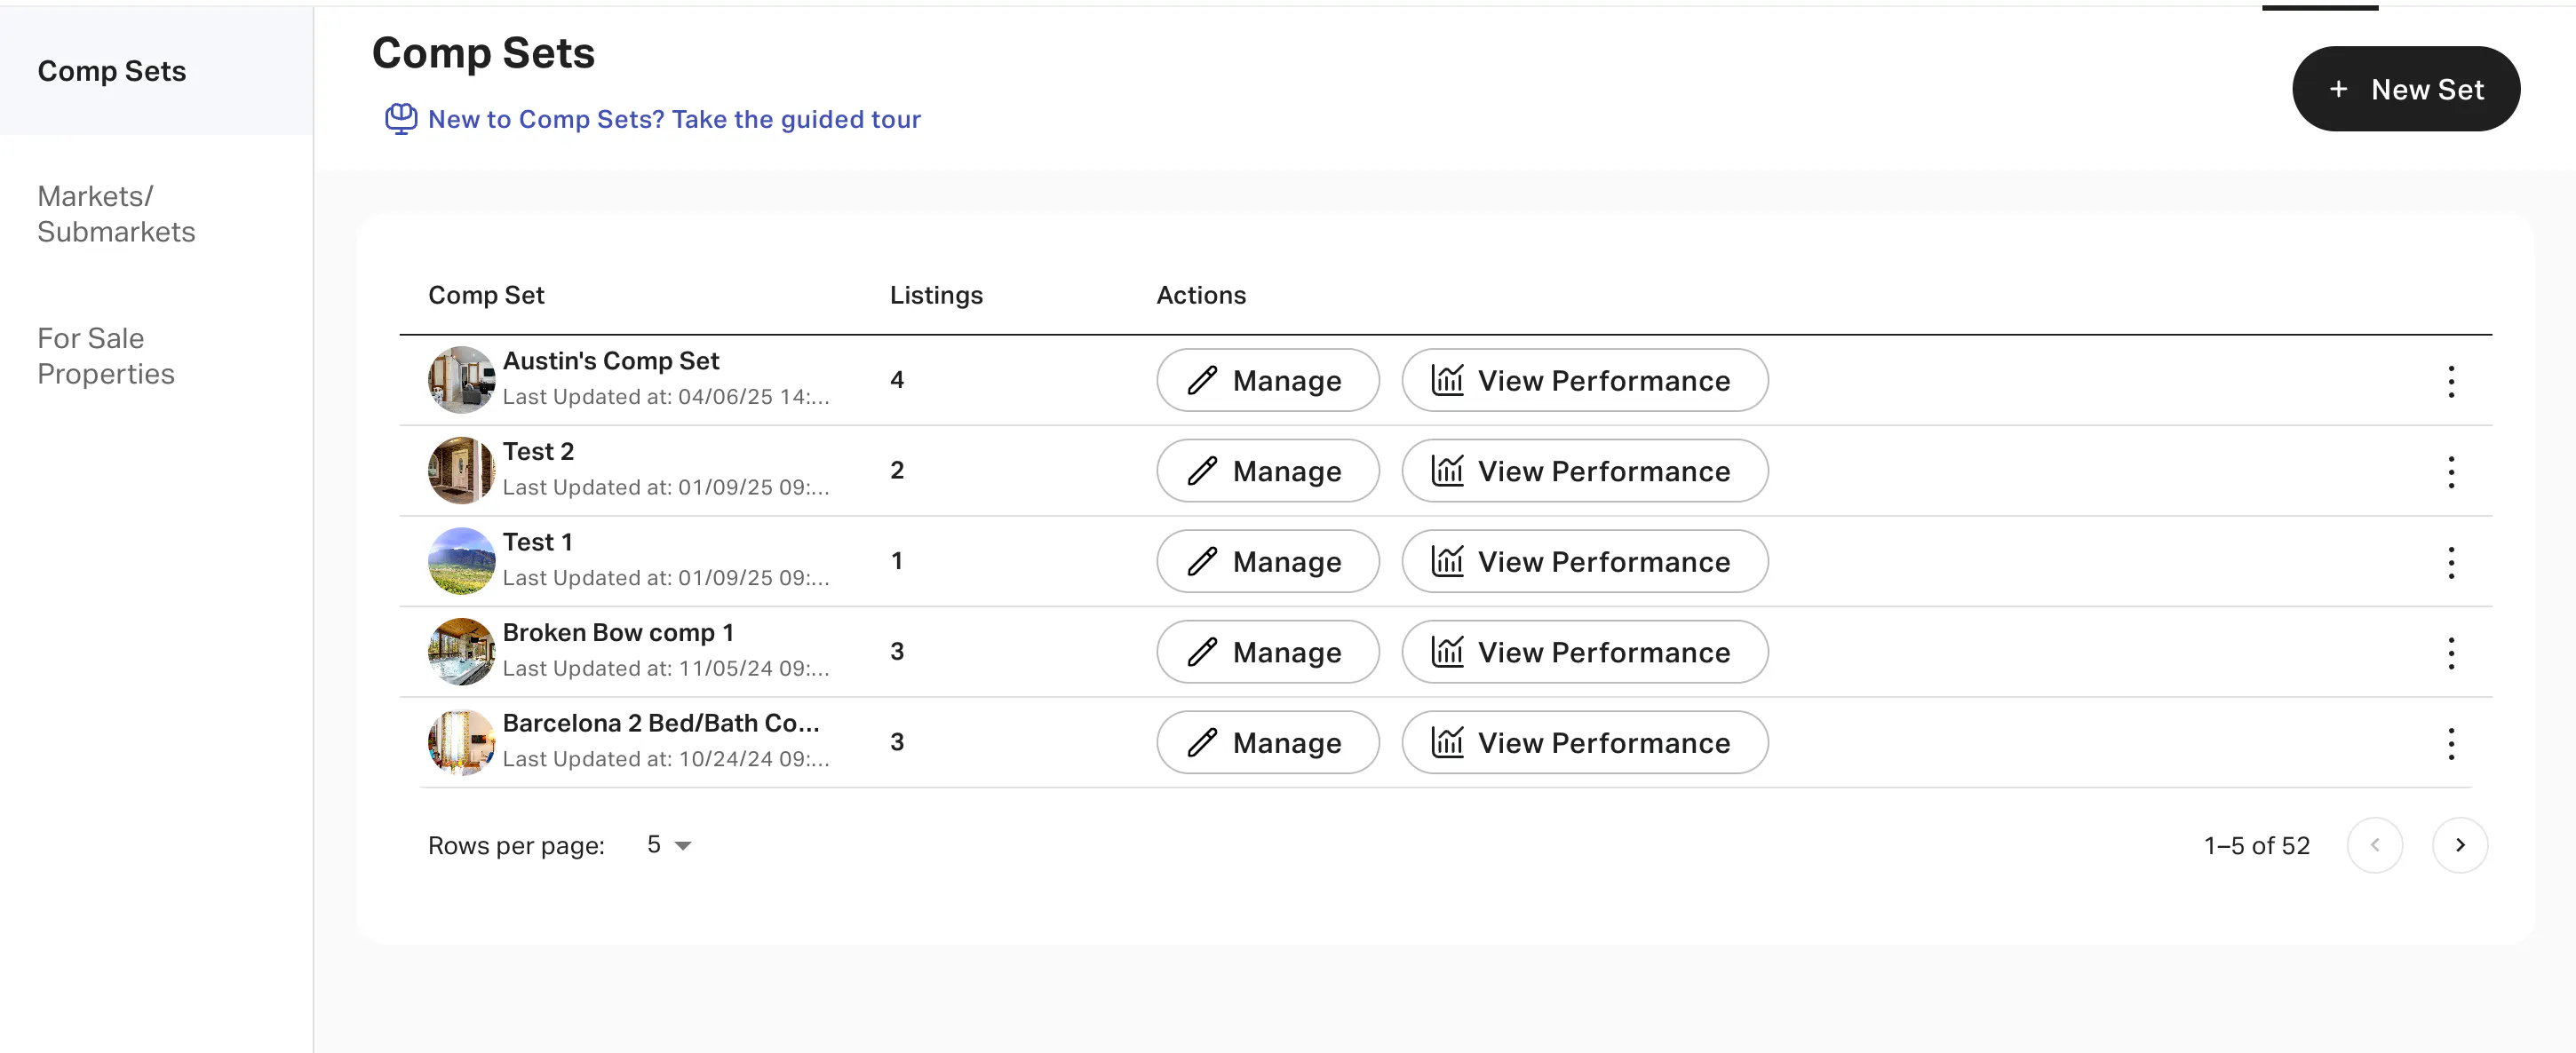
That’s the real value of custom comp sets: They let you build forecasts around the kind of property you actually want to run—not just what’s typical in the market.
3. Explore Markets and Listings
Not sure where to invest yet? Or just want to see how properties like yours are performing in a specific area? AirDNA’s Explore feature and Market Overview dashboards are a great starting point for getting a feel for how much you could earn on Airbnb—without needing a specific property in mind.
This is the broadest way to forecast rental income — by looking at how groups of similar properties are performing in a city or region, then filtering down to focus on listings that match what you are planning to offer.
Let’s say you’re interested in Hilton Head, South Carolina. First, open the Hilton Head market page in AirDNA. You’ll see average numbers for things like:
- Annual revenue
- Occupancy rate
- Average daily rate (ADR)
- RevPAR (Revenue Per Available Rental)
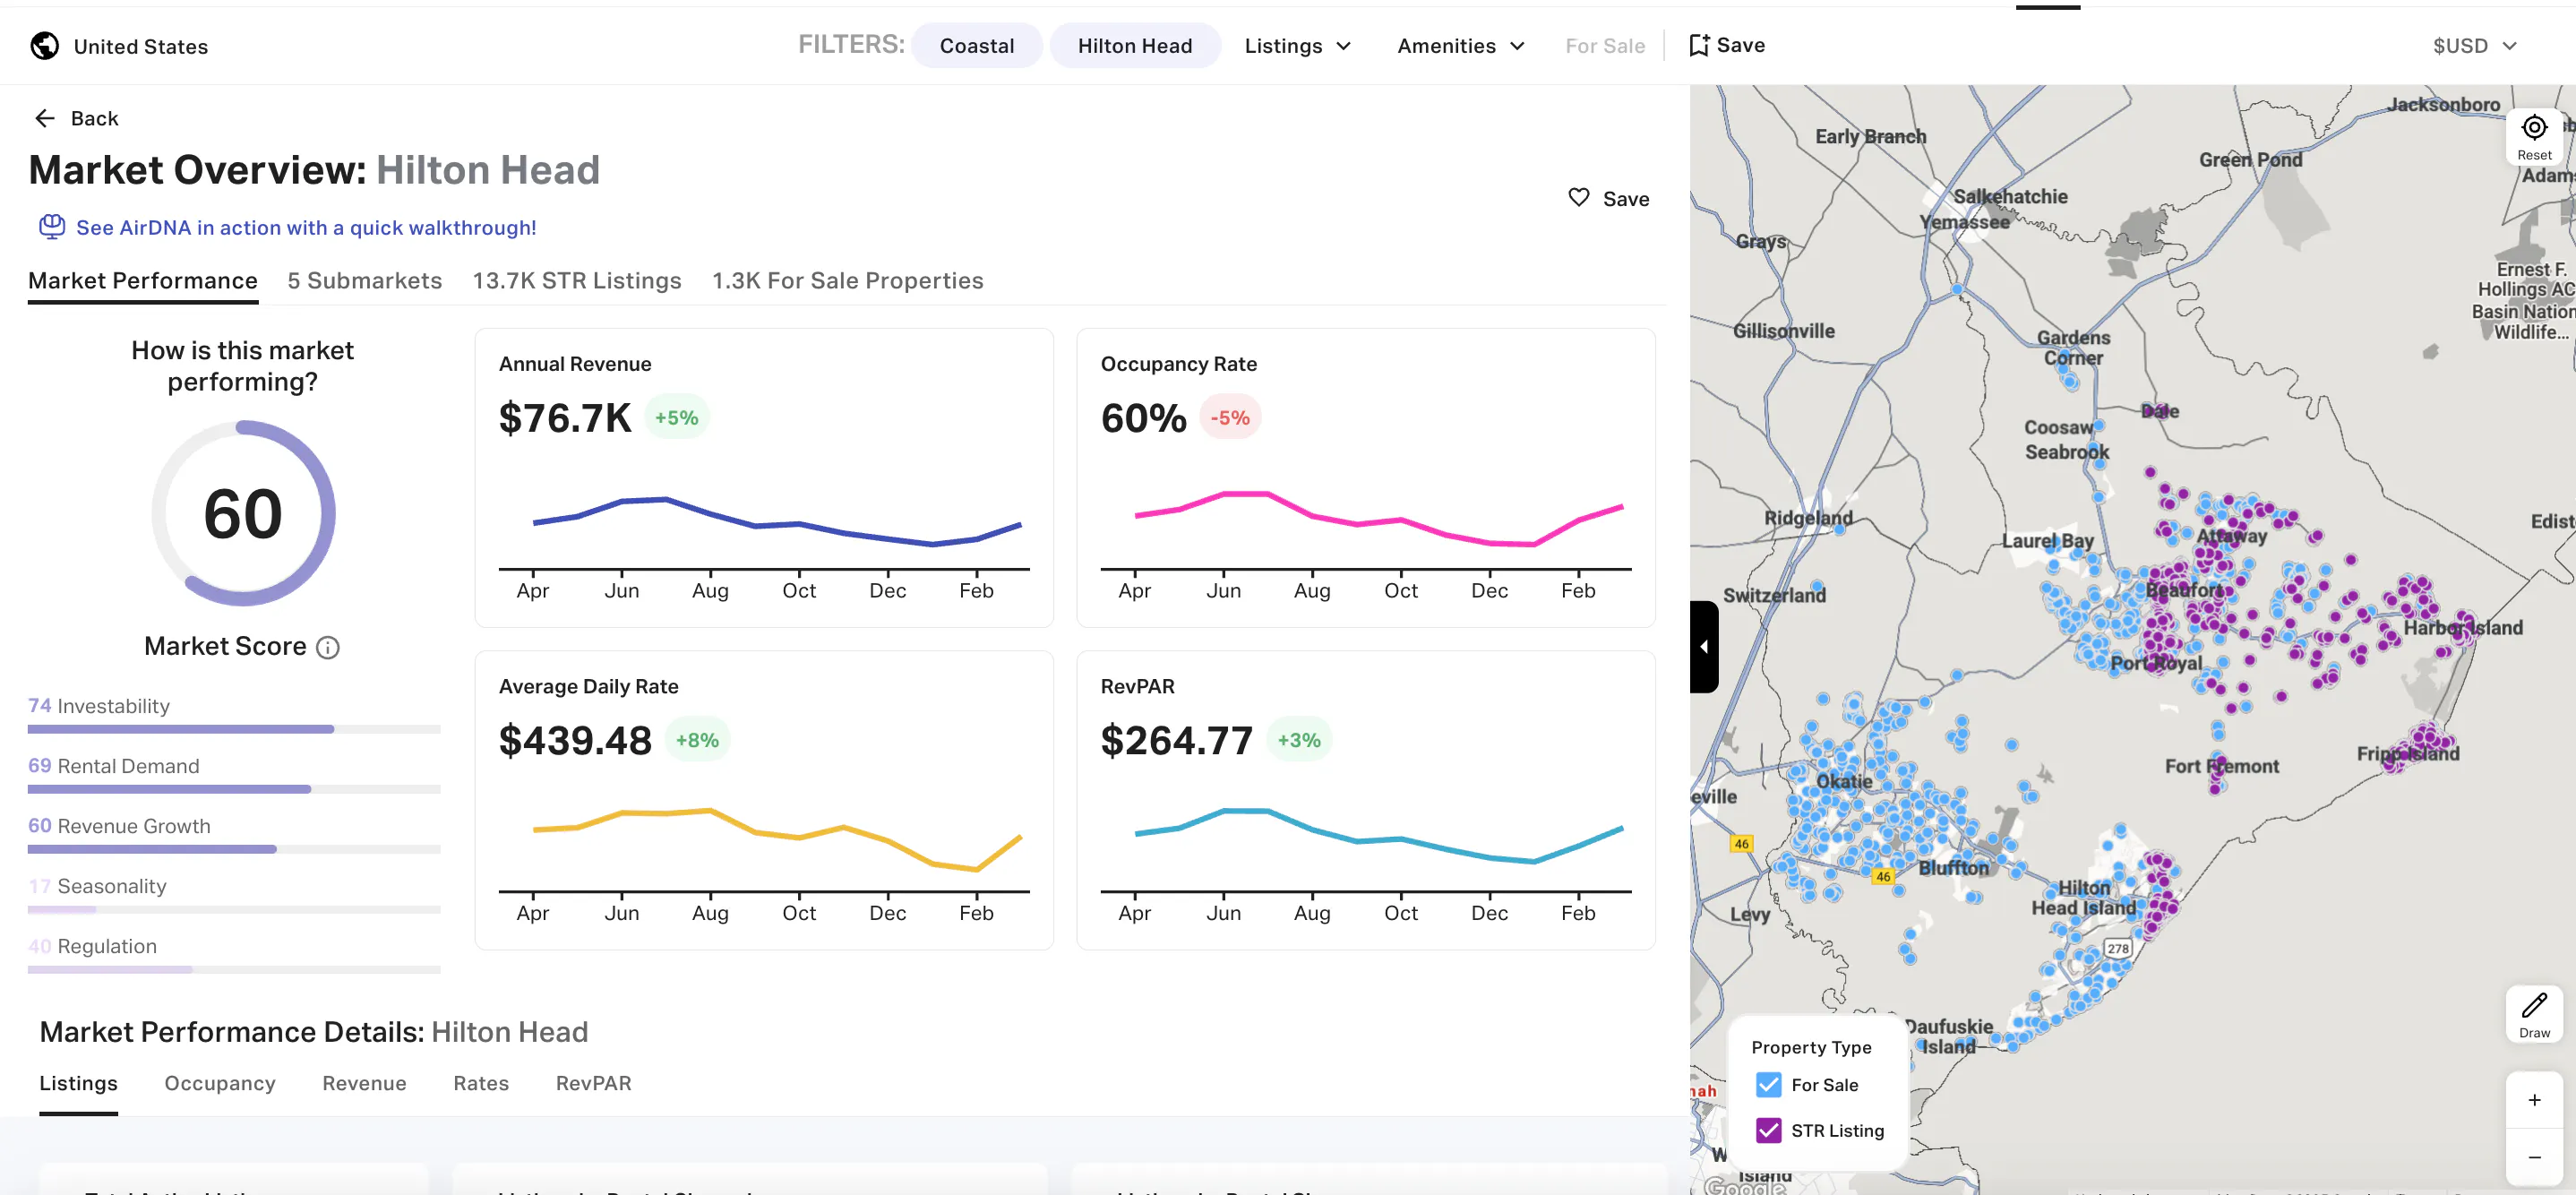
These numbers are based on the past year of actual bookings from active short-term rentals in that area.
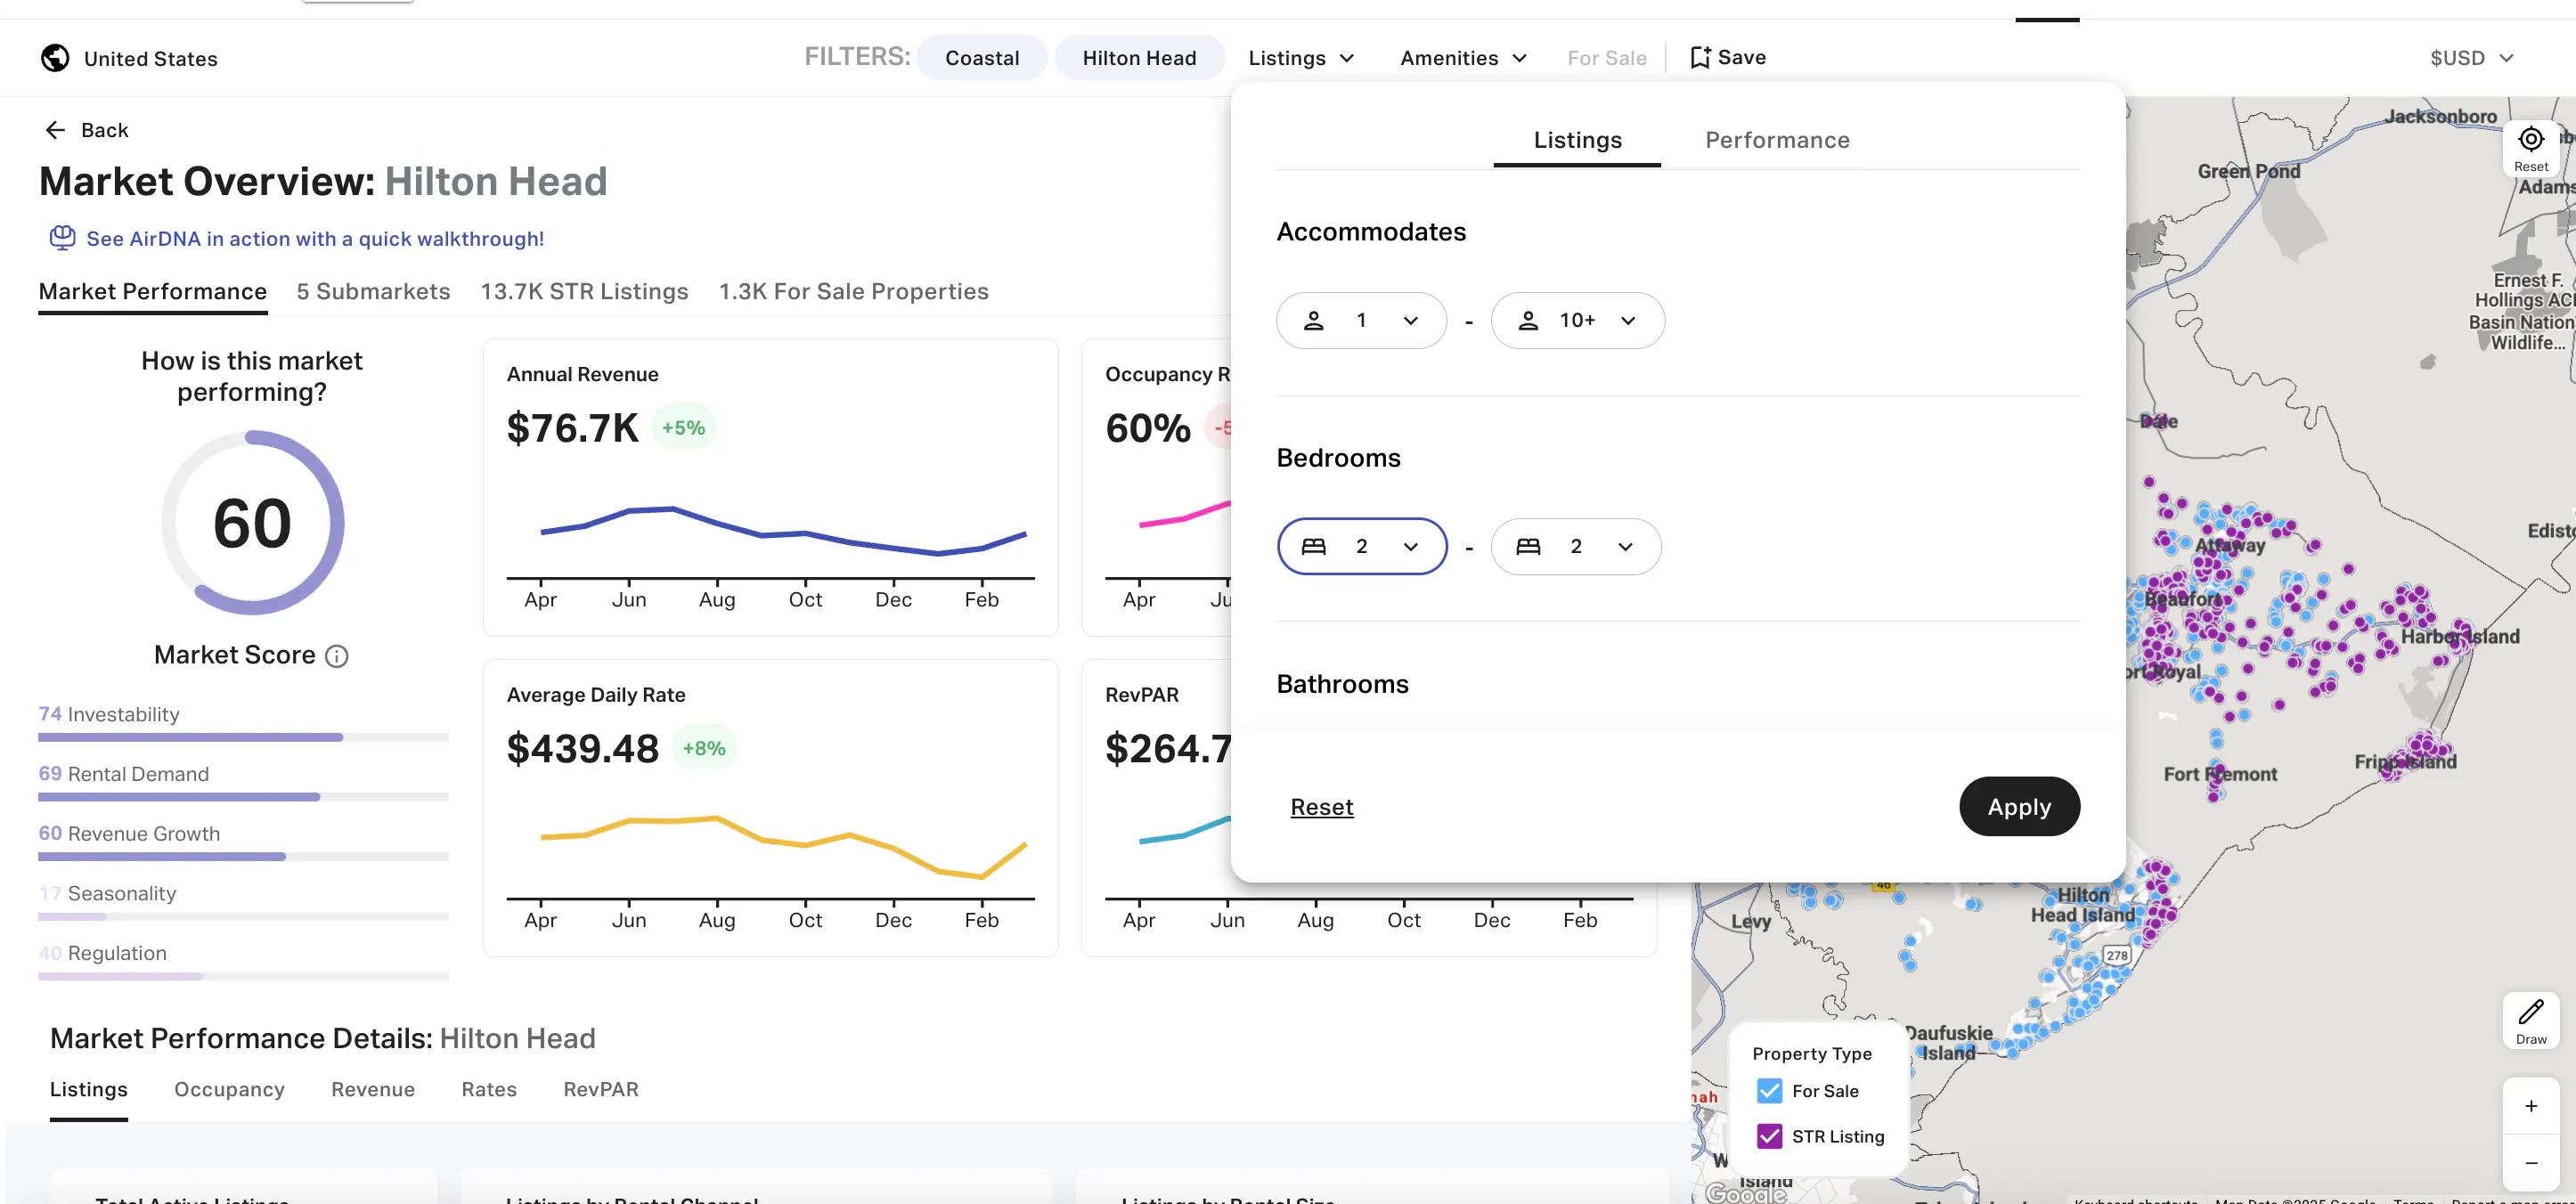
Next, apply filters to narrow it down to listings that look more like what you’d invest in, say, 2-bedroom homes that sleep 10 people.
Now, the dashboard updates to show performance data only for listings that match your filters. This is how you begin forecasting:
If 2-bedroom properties in Hilton Head (the kind you’re thinking about investing in) are earning around $76K per year with 60% occupancy, that gives you a realistic sense of the Airbnb earning potential for that type of rental in this area.
You can also click through individual listings or save them to a comp set to compare later.
The dashboard also shows longer-term trends such as how revenue changes season to season and how performance varies by property size, availability, or listing type. This helps you understand how seasonal rental demand and occupancy rates may affect your income over time.
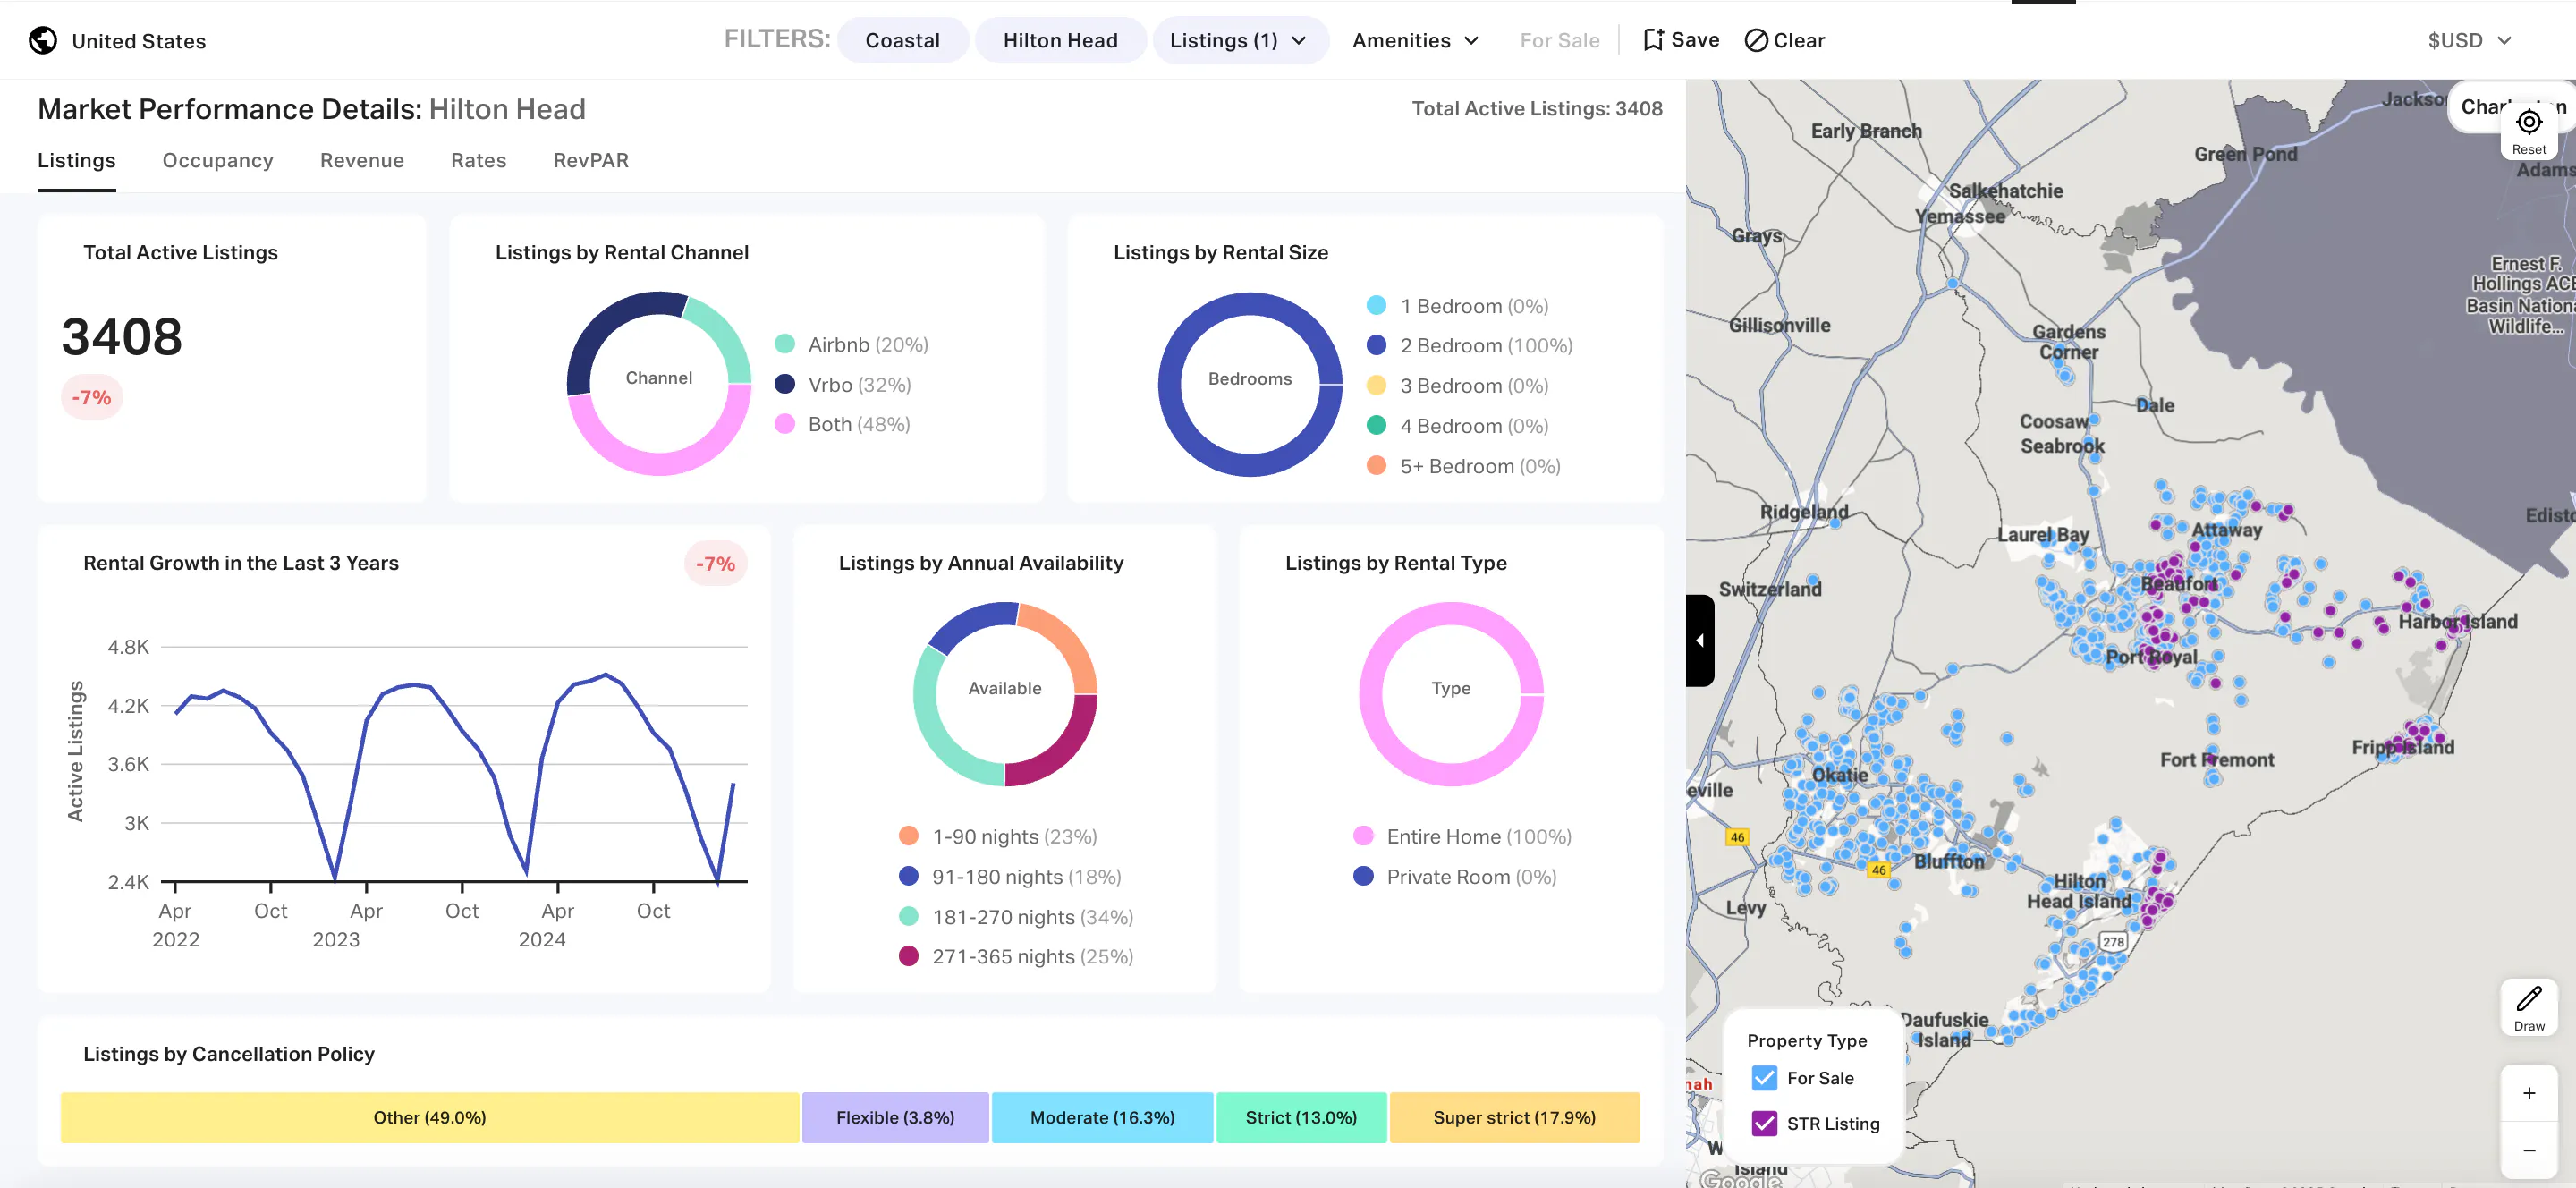
This is one of the fastest ways to get a grounded sense of what similar properties are earning based on real booking data from your target market. It’s a great place to start when you’re still exploring locations or narrowing down what kind of rental you want to operate.
The best forecasts match where you are in the process. Maybe you’re still figuring out the right market. Maybe you’ve got a few properties in mind. Either way, AirDNA helps you make sense of what’s possible, using real numbers. You don’t need to build complicated spreadsheets or rely on rough estimates. Just tools that help you see the bigger picture, so you can move forward with more clarity and less stress.

Research Airbnb Markets
Gain insights into the revenue and occupancy trends in your market.
What Can Affect Your Forecast (and How to Account for It)
Even the most well-built income forecast can miss the mark if you don’t account for real-world factors. Some things won’t show up in a calculator, but they can still make a big difference in what you actually earn on your rental investment property.
Whether you’re planning a short-term or long-term rental, it’s worth thinking through the variables that could shift your numbers. For short-term rentals in particular, these factors can change quickly and having a clearer picture now can help you avoid surprises later.
Here are a few things to consider:
Rental regulations
Rules around renting vary by city, county, and even neighborhood. Some areas limit how often a property can be rented or require special permits. While this applies to all types of rentals, short-term rentals are more commonly regulated. Zoning restrictions, licensing requirements, or caps on rental days can all limit your income potential—so it's essential to factor in regulations before finalizing a forecast.
Seasonal demand
Rental income isn’t always consistent throughout the year. Long-term rentals might have slower leasing seasons, but short-term rentals are especially affected by seasonality. High seasons can drive up nightly rates, while off-seasons can lower occupancy. Forecasting with seasonality in mind helps you better prepare for fluctuating income.

Capital expenses
Every property will eventually need maintenance or upgrades—whether it’s replacing a water heater or budgeting for a future roof. These large, irregular expenses can catch new investors off guard if they’re not built into the forecast. For STRs, keeping things guest-ready may also involve more frequent furniture or appliance replacements due to higher wear and tear.
Insurance and property taxes
Operating costs can vary widely depending on location. Long-term rentals and short-term rentals alike can see differences in property tax rates or homeowners insurance premiums across state lines or even neighborhoods. STRs may also require additional insurance coverage or higher premiums, which can eat into your profit if not accounted for upfront.
Vacancy and availability
No rental is booked or occupied 100% of the time. While long-term vacancies tend to happen between leases, short-term rentals may experience gaps between bookings, cancellations, or seasonal swings. Building in a buffer—whether that’s a few weeks per year or a percentage of unbooked nights—helps create a forecast that’s more grounded in reality.
Ultimately, accurate investment property forecasting comes down to knowing what’s within your control—and planning for what isn’t.
Tips for More Accurate Rental Income Forecasting
Once you've built your forecast and considered the variables, the next step is making sure your numbers hold up on paper and in practice. Whether you're evaluating a long-term or short-term rental, these tips can help make your income projections more reliable.
Cross-check your numbers with multiple tools
No single source gives you everything. Use rental income estimation tools like AirDNA, but also tap into public data, talk to local property managers, and review similar listings in your market. The more angles you explore, the more balanced—and believable—your forecast will be.
Account for vacancy and turnover
No property stays rented all the time. Long-term rentals often sit vacant between leases, and short-term rentals naturally have gaps between bookings. Even in high-demand areas, it’s smart to factor in a buffer—maybe a few weeks a year for LTRs, or seasonal shifts in occupancy for STRs depending on season and location.
Include one-time and upfront costs
Startup expenses can sneak up fast. Think about the cost to purchase the property—including your down payment and closing costs—as well as furnishing, repairs, or any renovation work needed to get the unit rent-ready. For STRs in particular, the setup phase often costs more than people expect, and it’s important to include those early costs in your forecast.
Don’t forget financing and ongoing expenses
Your forecast should reflect your full financial picture, not just the income. That means factoring in financing and common expenses like your mortgage, insurance, property taxes, utilities, HOA dues, and maintenance. These are often the biggest drivers of your monthly cash flow and shouldn’t be treated as afterthoughts.
Use conservative estimates for key variables
It’s tempting to forecast with your best-case scenario in mind, but slightly underestimating income (and overestimating costs) creates a much more dependable projection. Be especially cautious with variables like rent, occupancy rate, and ADR. A forecast that still works when the market softens is one you can feel confident about.
Watch the broader market
Even the most detailed model needs context. Pair your forecast with ongoing real estate market analysis to stay ahead of shifting trends, policy changes, or demand swings, especially in fast-moving STR markets. Income potential can change quickly, and staying informed helps you adjust your strategy early.
The more realistic your assumptions, the more useful your forecast will be. It’s not about aiming for perfection—it’s about building a model you can trust when it’s time to make real investment decisions.

FAQs
How much can I earn on Airbnb?
Earnings can vary widely depending on your location, property type, guest capacity, and how often you make the rental available. A one-bedroom condo in a seasonal beach town will perform very differently from a five-bedroom home near a ski resort. The best way to get a realistic idea is by looking at how similar properties are performing in your area—and adjusting based on your own availability and pricing strategy.
How do you calculate how much an Airbnb will make?
To estimate Airbnb income, you’ll want to look at the average nightly rate, expected occupancy, and the number of days the property will be available each month. AirDNA’s Airbnb earnings calculator (called Rentalizer) simplifies this by pulling in real booking data from comparable listings near your address. It gives you a projection based on actual market performance—not just rough estimates—and also includes common expenses to help you understand your potential profit, not just your revenue.
Can I use the same forecast method for both long-term and short-term rentals?
The basic approach—looking at income, expenses, and return—is similar, but the details differ. Long-term rental forecasts are usually more stable and focus on monthly rent and fixed costs. Short-term rental income can fluctuate more due to seasonality, occupancy rates, and pricing strategy. That’s why tools that track short-term performance, like AirDNA, are especially helpful if you’re going the STR route.
What are expected rent rate increases I should include in my forecast?
For long-term rentals, many investors use a conservative 2–5% annual rent increase to model future income. For short-term rentals, revenue growth depends more on market demand, seasonal pricing, and how you manage the property. Historical performance data can help you understand what kind of growth—or variability—you might see year over year.
Do I need forecasting tools, or can I do this on my own?
You can absolutely start with a DIY approach using a simple formula to estimate income and subtracting known expenses. But if you want to build a more confident forecast, especially for a short-term rental, using data-backed rental income estimation tools like AirDNA can save you time and give you a much clearer picture of what to expect. They're especially helpful when comparing properties or planning for seasonal shifts.
How is your STR performing?
Your vacation rental may be amazing, but is it better than your competition? Connect your Airbnb listing to AirDNA to see its Booking Performance Score.
ARTICLE SUMMARY
Learn how to forecast Airbnb income with confidence. This step-by-step guide breaks down what affects your earnings—and how to model short-term and long-term rental returns realistically.
Dillon DuBois
AirDNA Senior Product Manager
Dillon DuBois is a seasoned expert in the short-term rental space, having worn many hats at AirDNA since joining in 2019. From driving B2B marketing initiatives to shaping product strategy, Dillon’s deep understanding of both the company and the industry makes him a key player in delivering innovative solutions. Now a Senior Product Manager, he leverages his experience to bridge the gap between data and user needs. He manages his own short-term rental in Medellín, Colombia, and enjoys all things outdoor adventure, travel, cooking, & surfing.
