

 Calculate Revenue
 Research Markets
 Find For Sale Properties
 Compare My Listing
 STR Revenue Calculator
 Custom Comp Sets
 Submarket Insights
 Custom Search Filters
 Rate Recommendations
 Performance Benchmarking
 Competitor Comparison
 Owner Contact Details
 Property-level performance data
 Tourism Insights
 Real Estate Investment Analytics
 About Us
 Sales
Sales Support
 Press
PressBest Hidden Gem Airbnb Locations in the U.S.
Published: September 21, 2026
Last updated: September 25, 2026

Linda Rollins
Key Takeaways
- A hidden gem submarket has 400 to 1,000 listings, a yield above 10%, and positive year-over-year growth in both RevPAR and listings.
- Fewer than 20% of properties in these submarkets are professionally managed, which means less established competition and more room for an individual host to win share.
- Rockford, Illinois tops the 2026 list with a 14% yield on an average home value of $300,442.
Most investors start their search where everyone else already is: Phoenix, Nashville, Denver, Tampa. Those cities are worth understanding if you want to know which American cities are hottest for Airbnb investments, but they are also where competition is thickest and entry prices are highest.
A hidden gem is different. It is a smaller submarket that is still growing, still affordable, and still largely un-professionalized, which is the combination that produces high yield.
We screened AirDNA data covering 15M+ Airbnb, Vrbo, and Booking.com listings across 120K+ markets to find the small submarkets, between 400 and 1,000 listings, that deliver the strongest yield for investors in 2026.
Here are the 17 that made the list, ranked by yield.
The 17 Best Hidden Gem Airbnb Locations, Ranked by Yield
Here are the top 10 short-term rental submarkets ranked by yield, followed by seven honorable mentions. Every location below is a submarket rather than a headline city market, so the numbers describe the specific area an investor would actually buy in.

1. Rockford, Illinois
- Current Yield: 14%
- Average Home Value: $300,442
- Annual Revenue Potential: $42,024
- Active Listings: 408
- YoY Listing Growth: 13%
- YoY RevPAR Growth: 6%
Rockford sits on the Rock River about 90 minutes northwest of Chicago, close enough to pull weekend traffic out of the city without carrying Chicago prices.
It leads the 2026 list on yield at 14%, built on a $300,442 average home value against $42,024 in annual revenue potential. Listings grew 13% year over year, and RevPAR still rose 6%, so supply is expanding without eroding what each available night earns. Professional management is effectively absent from the submarket, which means an individual host is not competing with a local management company for bookings.

2. Akron, Ohio
- Current Yield: 13%
- Average Home Value: $323,585
- Annual Revenue Potential: $42,100
- Active Listings: 748
- YoY Listing Growth: 10%
- YoY RevPAR Growth: 5%
Akron is a mid-size city south of Cleveland with a university, a large hospital system, and a summer events calendar, so demand does not concentrate in a single season.
A 13% yield comes from $42,100 in annual revenue potential against a $323,585 average home value. At 748 active listings Akron sits at the upper end of our size band, and it still added 10% more listings year over year while RevPAR rose 5%. There were 792 properties for sale in the submarket, the largest for-sale pool in the top 10, so finding inventory is not the constraint here.
3. Warner Robins, Georgia
- Current Yield: 12%
- Average Home Value: $323,760
- Annual Revenue Potential: $39,515
- Active Listings: 411
- YoY Listing Growth: 14%
- YoY RevPAR Growth: 2%
Warner Robins sits in middle Georgia next to Robins Air Force Base, which brings a steady stream of contractors, visiting families, and temporary-duty personnel who need somewhere to stay for weeks rather than nights.
That demand supports a 12% yield on $39,515 in annual revenue potential and a $323,760 average home value. Listings grew 14% year over year, among the fastest on the list, and RevPAR still edged up 2%. Warner Robins also made our previous hidden gems list, so this is a submarket that has held its position rather than spiked once.
4. Utica, New York
- Current Yield: 12%
- Average Home Value: $302,690
- Annual Revenue Potential: $35,408
- Active Listings: 479
- YoY Listing Growth: 5%
- YoY RevPAR Growth: 3%
Utica is in New York's Mohawk Valley, a short drive from both the Adirondacks and Cooperstown, which gives it outdoor-season and event-season demand rather than one peak.
A $302,690 average home value is the second-lowest in the top five, and $35,408 in annual revenue potential turns that into a 12% yield. Growth is steady rather than dramatic: listings up 5%, RevPAR up 3%. For an investor who wants a low entry price without betting on a boom, that is the appeal.
5. Otsego Lake, Michigan
- Current Yield: 12%
- Average Home Value: $321,224
- Annual Revenue Potential: $37,270
- Active Listings: 713
- YoY Listing Growth: 5%
- YoY RevPAR Growth: 5%
Otsego Lake sits in northern Michigan near Gaylord, in the band of inland lake country that fills with families through the summer and with snowmobilers and skiers through the winter.
Two seasons instead of one is what makes the 12% yield work: $37,270 in annual revenue potential against a $321,224 average home value. Listings and RevPAR each grew 5%, so the submarket is expanding evenly. At 8%, professional management is present but still thin, which leaves room for a well-run individual listing to compete on service.
6. Lawton, Oklahoma
- Current Yield: 11%
- Average Home Value: $267,112
- Annual Revenue Potential: $30,473
- Active Listings: 436
- YoY Listing Growth: 5%
- YoY RevPAR Growth: 8%
Lawton sits in southwest Oklahoma beside Fort Sill and the Wichita Mountains Wildlife Refuge, pairing military-related travel with weekend outdoor demand.
At $267,112 it has the second-lowest average home value on the full list, which is how $30,473 in annual revenue potential still produces an 11% yield. RevPAR grew 8% year over year, the second-strongest here, while listings grew a modest 5%. Revenue per available night rising faster than supply is the healthiest version of growth for anyone buying in now.
7. Millersburg, Ohio
- Current Yield: 11%
- Average Home Value: $400,726
- Annual Revenue Potential: $43,698
- Active Listings: 591
- YoY Listing Growth: 8%
- YoY RevPAR Growth: 4%
Millersburg is the seat of Holmes County at the center of Ohio's Amish country, a destination that draws visitors for reasons that have nothing to do with a convention calendar.
Revenue potential is high at $43,698, and against a $400,726 average home value that produces an 11% yield. Listings grew 8% and RevPAR grew 4%. The catch is inventory: only 47 properties were for sale in the submarket, one of the smallest pools on this list, so plan on waiting for the right property rather than choosing between several.
8. Midland, Texas
- Current Yield: 11%
- Average Home Value: $452,350
- Annual Revenue Potential: $48,228
- Active Listings: 641
- YoY Listing Growth: 28%
- YoY RevPAR Growth: 3%
Midland is the commercial center of the Permian Basin, and its short-term rental demand follows oilfield work: crews, engineers, and contractors booking longer stays than a typical leisure guest.
It carries the second-highest revenue potential on the full list at $48,228, which supports an 11% yield even against the highest average home value here, $452,350. Listings grew 28% year over year, by far the fastest on the list, and RevPAR still rose 3%. That pace of new supply is worth watching, and at 14% professional management is also among the highest in the top 10.
9. Geneva, Ohio
- Current Yield: 11%
- Average Home Value: $350,418
- Annual Revenue Potential: $36,990
- Active Listings: 480
- YoY Listing Growth: 2%
- YoY RevPAR Growth: 4%
Geneva is on Lake Erie in Ohio's Grand River Valley wine region, with a state park, a lakefront lodge, and a cluster of wineries that pull weekend traffic from Cleveland and Pittsburgh.
An 11% yield comes from $36,990 in annual revenue potential against a $350,418 average home value. Listing growth was the slowest in the top 10 at 2% while RevPAR grew 4%, so the submarket is tightening rather than flooding. With 57 properties for sale, inventory is the limiting factor.
10. Castle Rock Lake, Wisconsin
- Current Yield: 10%
- Average Home Value: $407,203
- Annual Revenue Potential: $42,736
- Active Listings: 570
- YoY Listing Growth: 7%
- YoY RevPAR Growth: 11%
Castle Rock Lake is one of central Wisconsin's largest lakes, a boating and fishing destination within a few hours of Madison, Milwaukee, and the Twin Cities.
It posted the strongest RevPAR growth of any submarket on this list at 11%, with listings up 7%, which means each available night earned meaningfully more than it did a year ago. A 10% yield on $42,736 in annual revenue potential and a $407,203 average home value rounds out the top 10. Castle Rock Lake is the only submarket that also appeared on our previous hidden gems list, and it has kept growing since.
Honorable Mentions: 7 More Hidden Gems
Seven more submarkets cleared every criterion at a 10% yield. Ranked by yield, then by revenue potential:
- 11. Houghton / Higgins Lake, Michigan: 10% yield, $266,555 average home value, $27,833 annual revenue potential
- 12. Michigan City, Indiana: 10% yield, $482,304 average home value, $50,046 annual revenue potential
- 13. Gary, Indiana: 10% yield, $411,041 average home value, $41,573 annual revenue potential
- 14. Manhattan, Kansas: 10% yield, $413,568 average home value, $41,746 annual revenue potential
- 15. Terlingua, Texas: 10% yield, $417,163 average home value, $41,897 annual revenue potential
- 16. Nolin River Lake / Mammoth Cave, Kentucky: 10% yield, $319,096 average home value, $31,701 annual revenue potential
- 17. Dunnellon, Florida: 10% yield, $390,692 average home value, $37,430 annual revenue potential
Michigan City, Indiana has the highest revenue potential of any submarket on the full list at $50,046. Houghton / Higgins Lake, Michigan has the lowest average home value at $266,555, which is why a $27,833 revenue potential still clears 10%.
Our Criteria for Hidden Gem Airbnb Locations
We defined an Airbnb hidden gem as a submarket that is not already part of a well-known rental market. Every location on this list sits inside a broader state area rather than a headline city market.
We focused on submarkets with:
- 400 to 1,000 listings, which keeps the list to smaller vacation rental areas rather than established markets.
- Positive year-over-year growth in revenue per available night (RevPAR). Many U.S. markets saw RevPAR decline this year, and we only wanted submarkets where earnings per available night are still rising.
- Positive year-over-year growth in listings, a sign that other investors see potential in the area and are acting on it.
- 20% or fewer of properties under professional management.
- A yield of at least 5%. Every submarket that made the final list came in above 10% for entire-home listings.
- No stringent short-term rental regulations.
Professional management share is a useful proxy for maturity. When a large share of a vacation rental area is professionally managed, it usually means the area is established and managers have had time to build a presence there. We deliberately targeted submarkets where that has not happened yet.
On regulation, we avoided markets that are banning short-term rentals or considering rules strict enough to undermine a new investment. Some of these submarkets still have zoning, licensing, or permitting requirements, plus laws enforcing safety and occupancy standards, so research the specific jurisdiction before you buy a property.
The annual ADR, occupancy, RevPAR, revenue potential, average home value, and yield values are only for single family homes that are full time properties.
Hidden Gem Airbnb Locations With the Most Revenue Growth
Yield tells you what a property earns relative to what it costs. RevPAR growth tells you which direction that is heading. These 10 submarkets posted the strongest year-over-year growth in revenue per available night.
- Castle Rock Lake, Wisconsin: 11%
- Lawton, Oklahoma: 8%
- Houghton / Higgins Lake, Michigan: 7%
- Gary, Indiana: 7%
- Rockford, Illinois: 6%
- Terlingua, Texas: 6%
- Dunnellon, Florida: 6%
- Akron, Ohio: 5%
- Otsego Lake, Michigan: 5%
- Millersburg, Ohio: 4%
Six submarkets rank in the top 10 on both measures: Rockford, Akron, Otsego Lake, Lawton, Millersburg, and Castle Rock Lake. Those are the ones where a strong yield today is being supported by revenue that is still climbing.
How to Find Your Own Hidden Gems in AirDNA
This list is a snapshot of one screen run in September 2026. The filters behind it are available to anyone with an AirDNA account, so you can run the same screen against your own criteria in Market Insights.
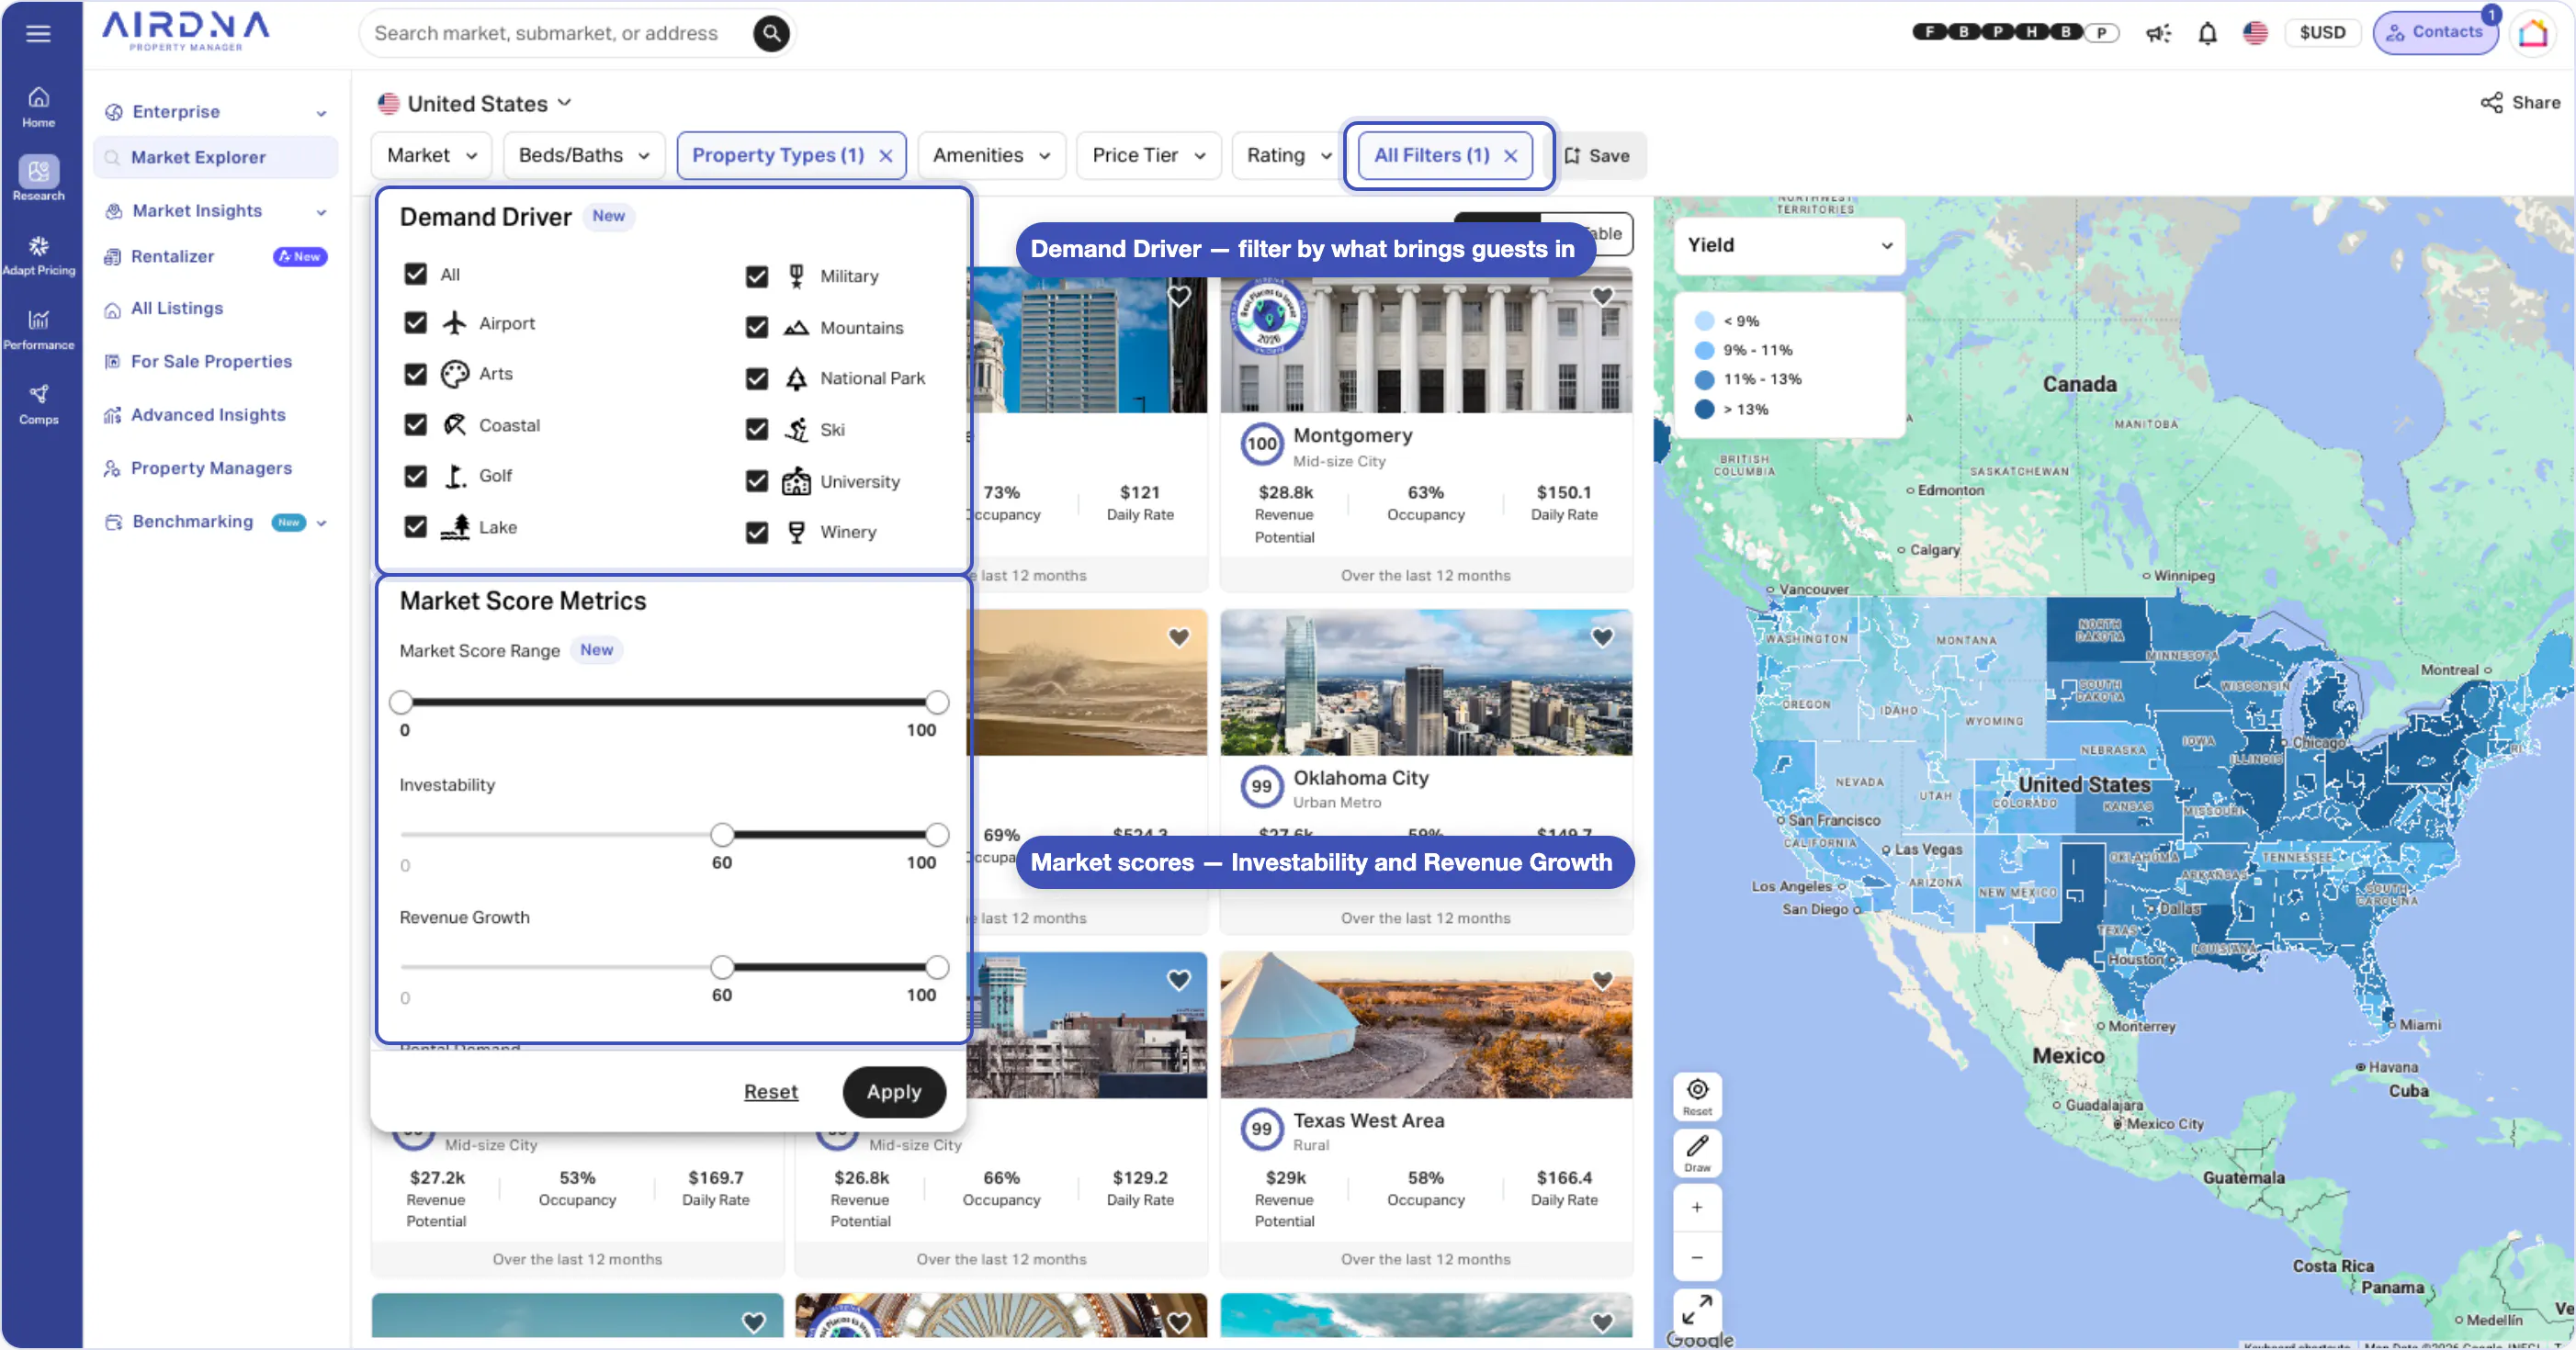
Start with market filters
Narrow the list of markets by size or by what drives demand there. To find the small to mid-size markets that produce lists like this one, set the listing count filter to 5,000 listings or fewer. If you already have a market type in mind, the demand driver filter selects markets by what actually brings guests in, so you can isolate coastal, gulf, or university markets specifically.
Then layer on market scores to match what you are optimizing for. Two matter most when you are hunting for hidden gems. Investability measures gross yield on homes, the ratio between revenue potential and sales price, so a higher score means more income for the price you pay. Revenue growth measures how much revenue is rising year over year, so a high score means hosts in that market are earning more than they did last year and you can rule out markets where revenue is flat or falling.
Narrow to submarkets
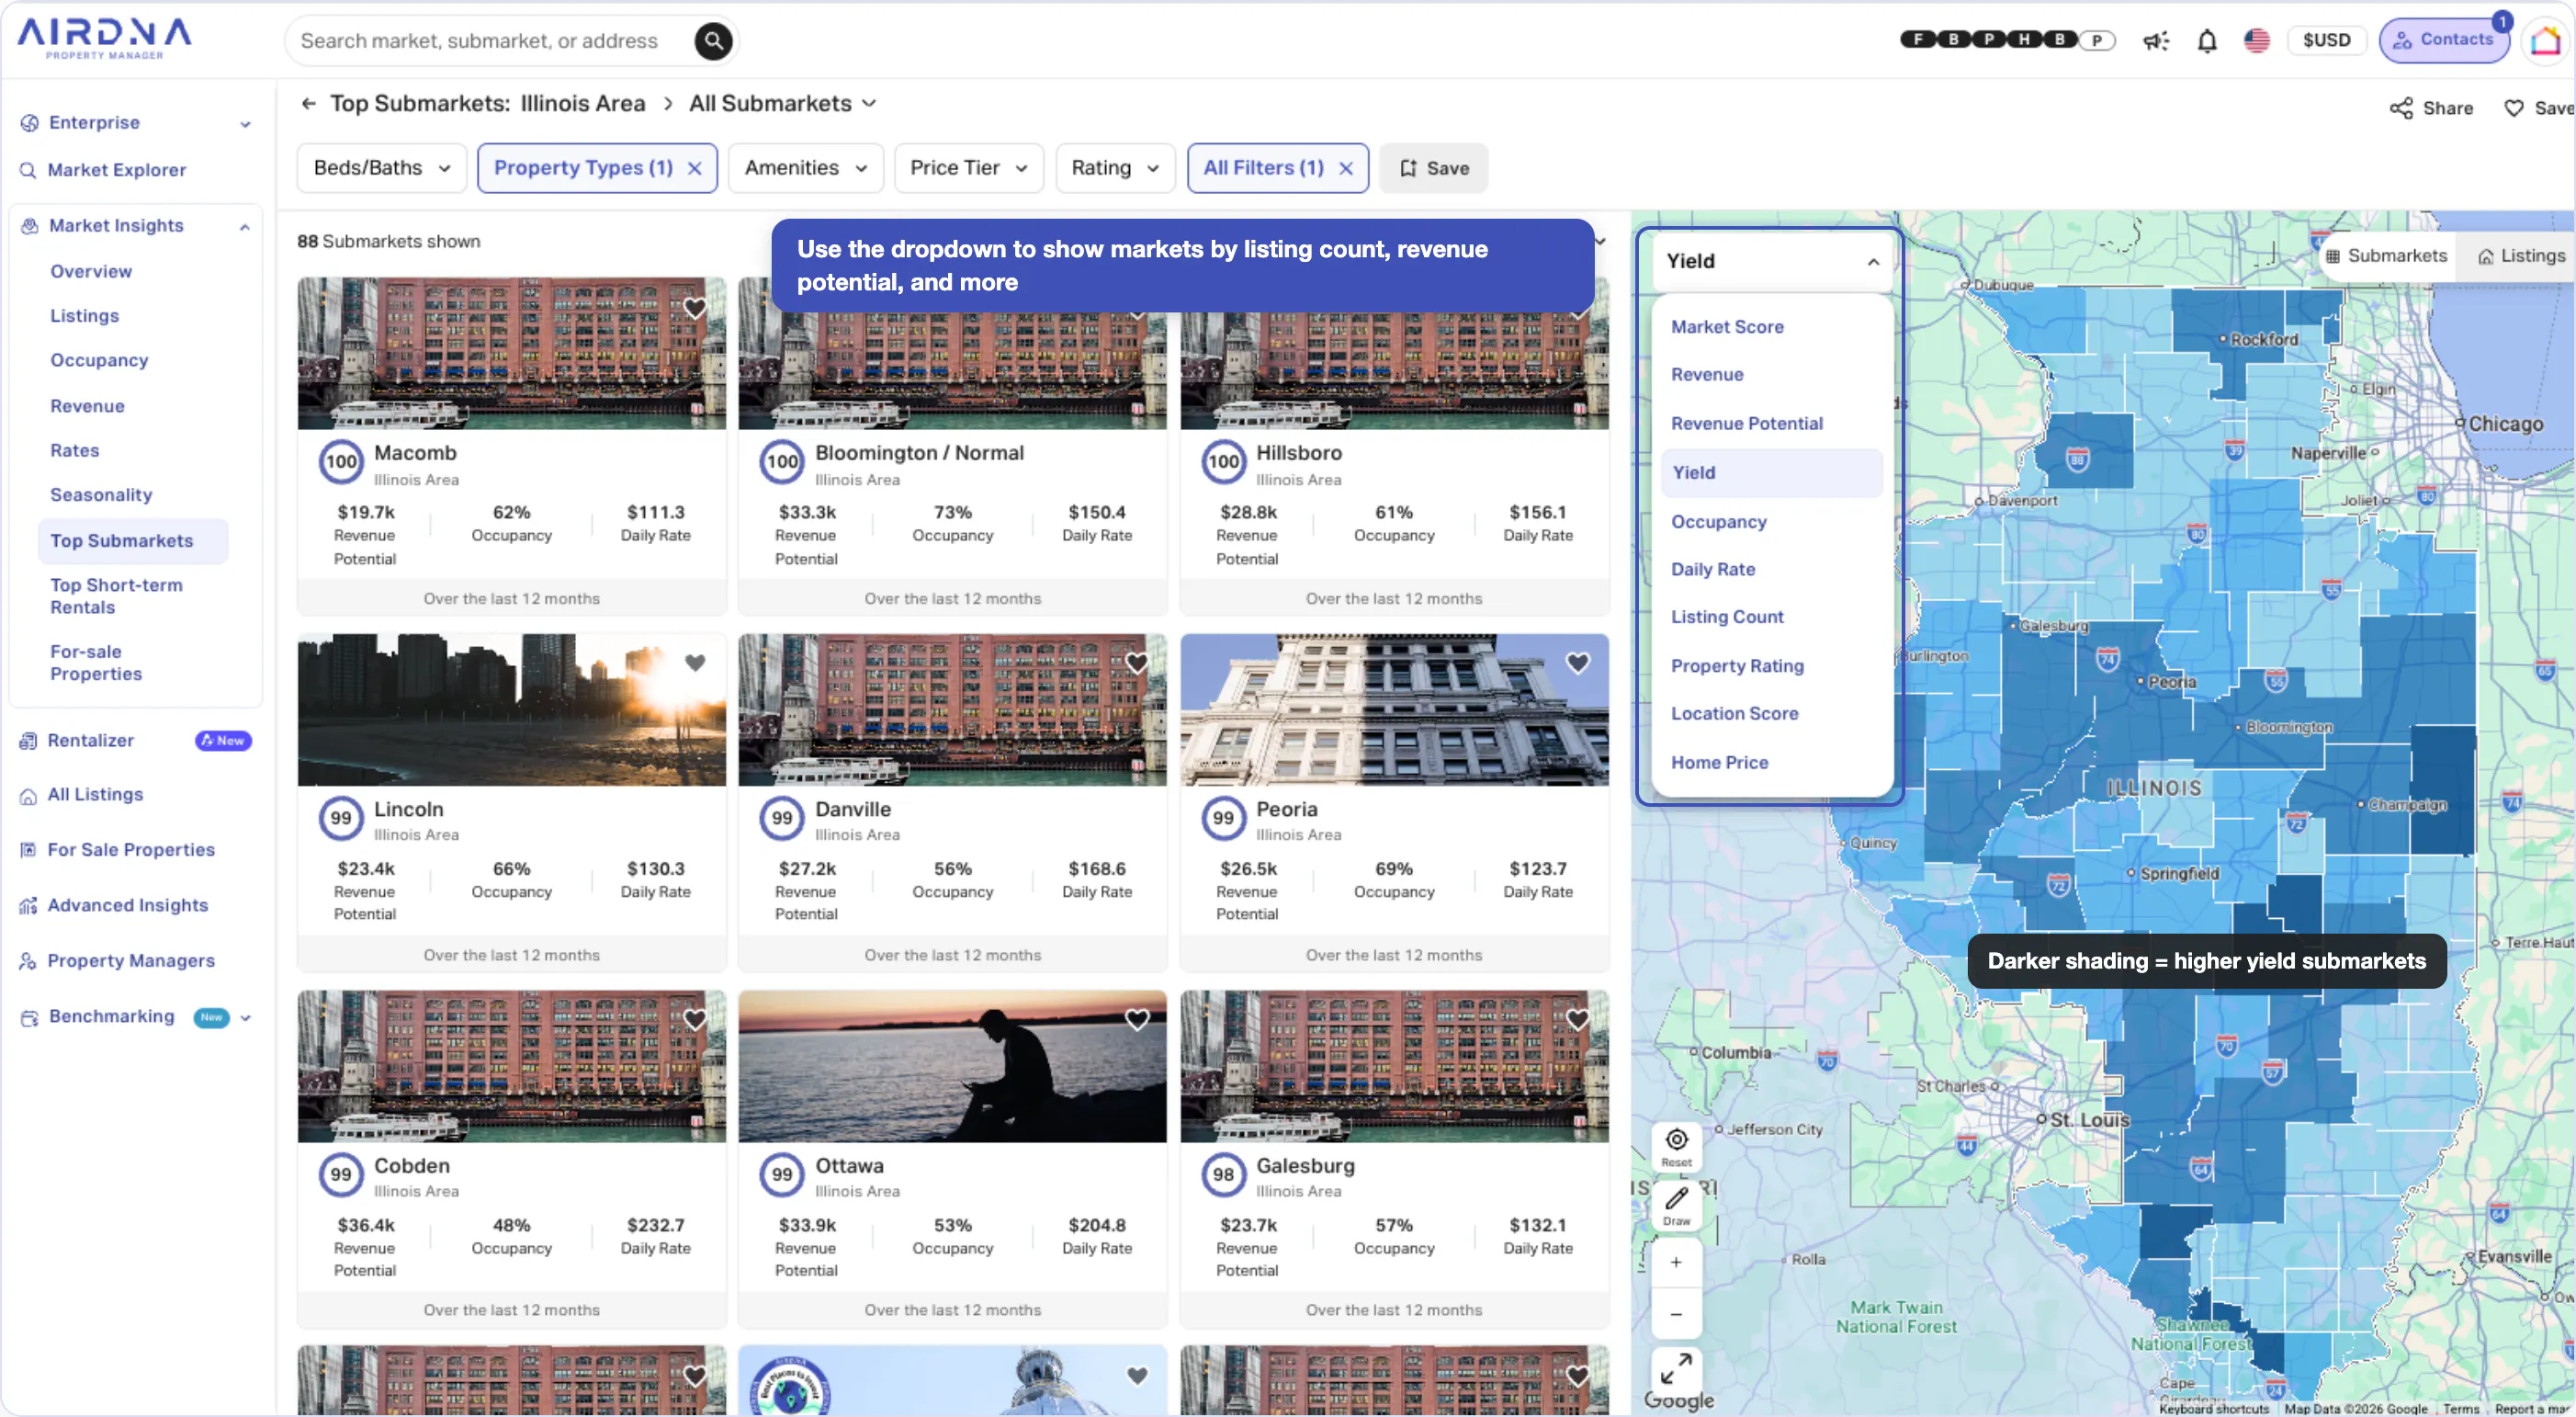
Once you have a list of markets, use the interactive heat maps to find the submarkets inside each market that meet your price range, revenue, and yield targets. A market that looks average on paper often contains a neighborhood that fits your criteria exactly.
Research regulations before you commit
Once you have picked a submarket, research short-term rental regulations at the neighborhood, city, and county level. Jurisdictions can have zoning, licensing, or permitting requirements as well as laws that enforce safety and occupancy standards.
Search any market for your next hidden gem
Type in a city, neighborhood, or address to see its occupancy, ADR, revenue potential, and yield in AirDNA.
Frequently Asked Questions About Hidden Gem Airbnb Markets
What makes an Airbnb market a hidden gem?
A hidden gem is a submarket with 400 to 1,000 active listings, a yield above 10%, positive year-over-year growth in both RevPAR and listings, and 20% or fewer properties under professional management. That combination means the area is growing and still affordable, but has not yet drawn enough professional operators to compete the returns away.
What is the best hidden gem Airbnb market in the U.S. right now?
Rockford, Illinois. It has the highest yield on our 2026 list at 14%, on a $300,442 average home value and $42,024 in annual revenue potential, with listings up 13% and RevPAR up 6% year over year.
Which hidden gem market has the lowest entry price?
Houghton / Higgins Lake, Michigan has the lowest average home value on the list at $266,555. Lawton, Oklahoma is next at $267,112, and Lawton also posted 8% RevPAR growth, the second-strongest of any submarket here.
Which hidden gem market is growing fastest?
Castle Rock Lake, Wisconsin leads on revenue growth, with RevPAR up 11% year over year. Midland, Texas leads on supply growth, with listings up 28%, which is worth watching because fast supply growth can pull yields down.
Are hidden gem markets riskier than established Airbnb markets?
They carry different risks. Smaller submarkets have thinner data, fewer comparable sales, and less proven demand, so one new competitor or a regulation change matters more. In exchange, entry prices are lower and professional competition is thin. Research short-term rental rules at the neighborhood, city, and county level before you buy.
Seize the Moment
The hidden gem markets in this article might not stay hidden. Listing growth in every one of them reflects a growing awareness of their revenue potential among other investors, and the submarkets adding supply fastest are the ones most likely to look ordinary a year from now.
With affordable home values, thin professional competition, and double-digit yields, submarkets like Rockford, Illinois; Akron, Ohio; and Warner Robins, Georgia stand out as entry points worth underwriting now. Explore our guide on how to finance your vacation rental to get the ball rolling on your investment today.
ARTICLE SUMMARY
This article ranks the 17 best hidden gem Airbnb locations in the U.S. for 2026 by yield, using AirDNA data to surface small submarkets with rising revenue, growing supply, and minimal professional management.
Linda Rollins
Senior Research Analyst
Linda Rollins is a Senior Research Analyst at AirDNA and a self-managing short-term rental host, which means she understands the market as both an analyst and an operator. She writes research and blogs for AirDNA and for Adapt, its revenue management tool, making her work a go-to resource for investors trying to find and size up the right opportunities, and for operators looking to understand changing market dynamics and find concrete ways to improve occupancy, rates, and guest experience. Her data is regularly cited in major news outlets, and she has a knack for bringing both the numbers and the story behind them. In her free time, Linda enjoys spending time with her family, traveling, and looking for good eats.
