

 Calculate Revenue
 Research Markets
 Find For Sale Properties
 Compare My Listing
 STR Revenue Calculator
 Custom Comp Sets
 Submarket Insights
 Custom Search Filters
 Rate Recommendations
 Performance Benchmarking
 Competitor Comparison
 Owner Contact Details
 Property-level performance data
 Tourism Insights
 Real Estate Investment Analytics
 About Us
 Sales
Sales Support
 Press
PressHow to Find Emerging STR Markets with Untapped Potential
Published: April 15, 2025
Last updated: September 25, 2026

Bram Gallagher
Key Takeaways
- The most profitable short-term rental (STR) investments often hide in overlooked submarkets with better rent-to-price (RTP) ratios, not overcrowded destinations where everyone's competing.
- Rely on multiple metrics when evaluating markets—a high Revenue Growth Score can mask concerning trends in occupancy and revPAR if you don't dig deeper.
- Emerging markets come in different flavors (occupancy-driven, rate-driven, or balanced growth), so align your chosen market with your specific investment goals and risk tolerance.
While everyone's battling for overpriced properties in Gatlinburg and Scottsdale, the real money is quietly being made in markets you've probably never considered for your portfolio.
The best short-term rental (STR) investing opportunities aren't where most people are looking. They're in the overlooked submarkets with astronomically better rent-to-price ratios and far fewer competitors bidding up acquisition costs.
At AirDNA, we've watched this pattern play out repeatedly: Investors who identify emerging markets before they become mainstream consistently outperform those who chase established destinations.
This guide reveals our proven methodology for uncovering these hidden gems. You'll learn exactly which metrics actually matter (hint: It's not just about Average Daily Rates) and how to identify the patterns that signal a market is primed for exceptional growth before everyone else notices.
Defining Emerging Short-Term Rental Markets
Let's be clear about what we're hunting for here. An emerging STR market isn't just any random town with a few vacation rentals—it's a location showing specific growth signals that most investors haven't recognized yet.
These aren't the mature destinations where you're competing against 5,000 other properties and paying premium prices for diminishing returns. They're the submarkets with enough existing activity to prove the concept, but not so much that you've already missed the opportunity window.
What makes identifying these markets tricky is that they reveal themselves through different data signals. Sometimes it's about finding as yet unsaturated markets with promising upward trends in listing growth, occupancy, and overall yield, like we did when we rounded up the top 18 up-and-coming STR markets in the U.S. and Canada. Other times, it's about tracking growth in “feeder cities” that directly impacts demand in those residents’ favorite vacation destinations—which is how we rounded up our list of the best vacation rental markets in the next five years.
The methodology we're sharing today highlights a new, self-serve approach. Instead of waiting for the next market report to tell you where to invest, we're showing you exactly how to use the AirDNA platform to conduct your own emerging market analysis, so you can stay ahead of the game.

Step-by-Step: How to Find Emerging STR Markets
The markets with genuine growth potential are hiding in plain sight—if you know exactly what to look for.
Here's our precise methodology for uncovering these opportunities using AirDNA:
Step 1: Filter out the overcrowded markets
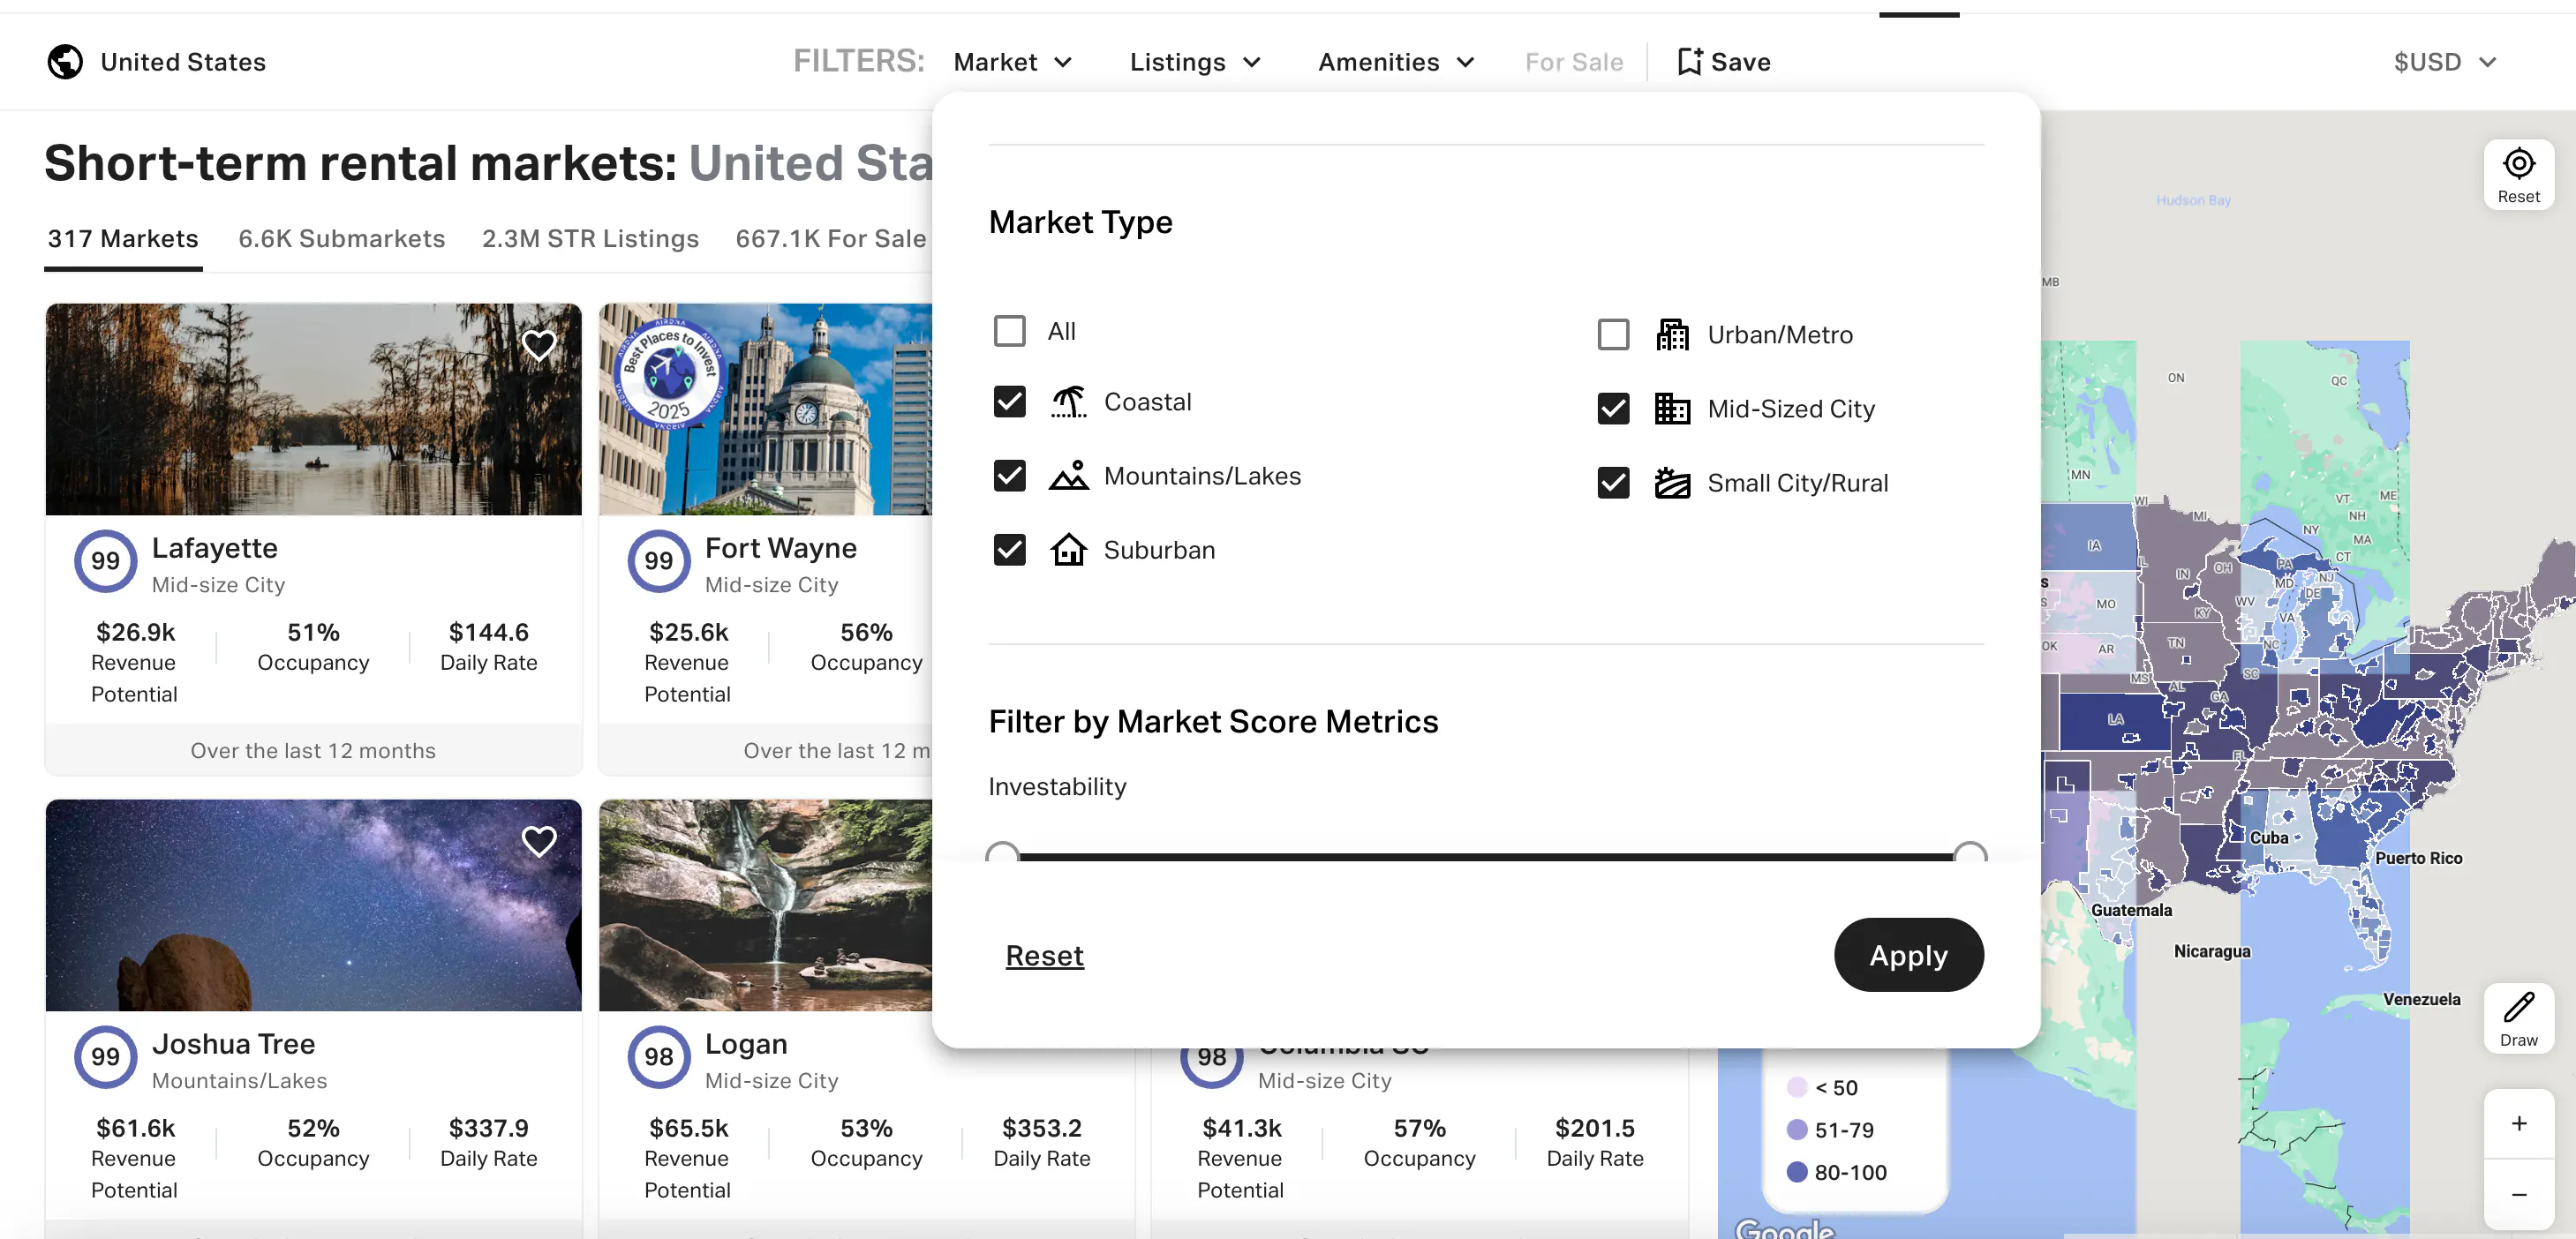
Start by eliminating urban/metro areas entirely.
The most promising emerging markets aren't going to be found in major cities where regulations change overnight and competition is fierce. Instead, focus exclusively on coastal, mountain/lake, suburban, small city/rural, and mid-size city location types.
Do this in AirDNA by tapping the Market filter and scrolling down to Market Types.
Step 2: Target the sweet spot for market size
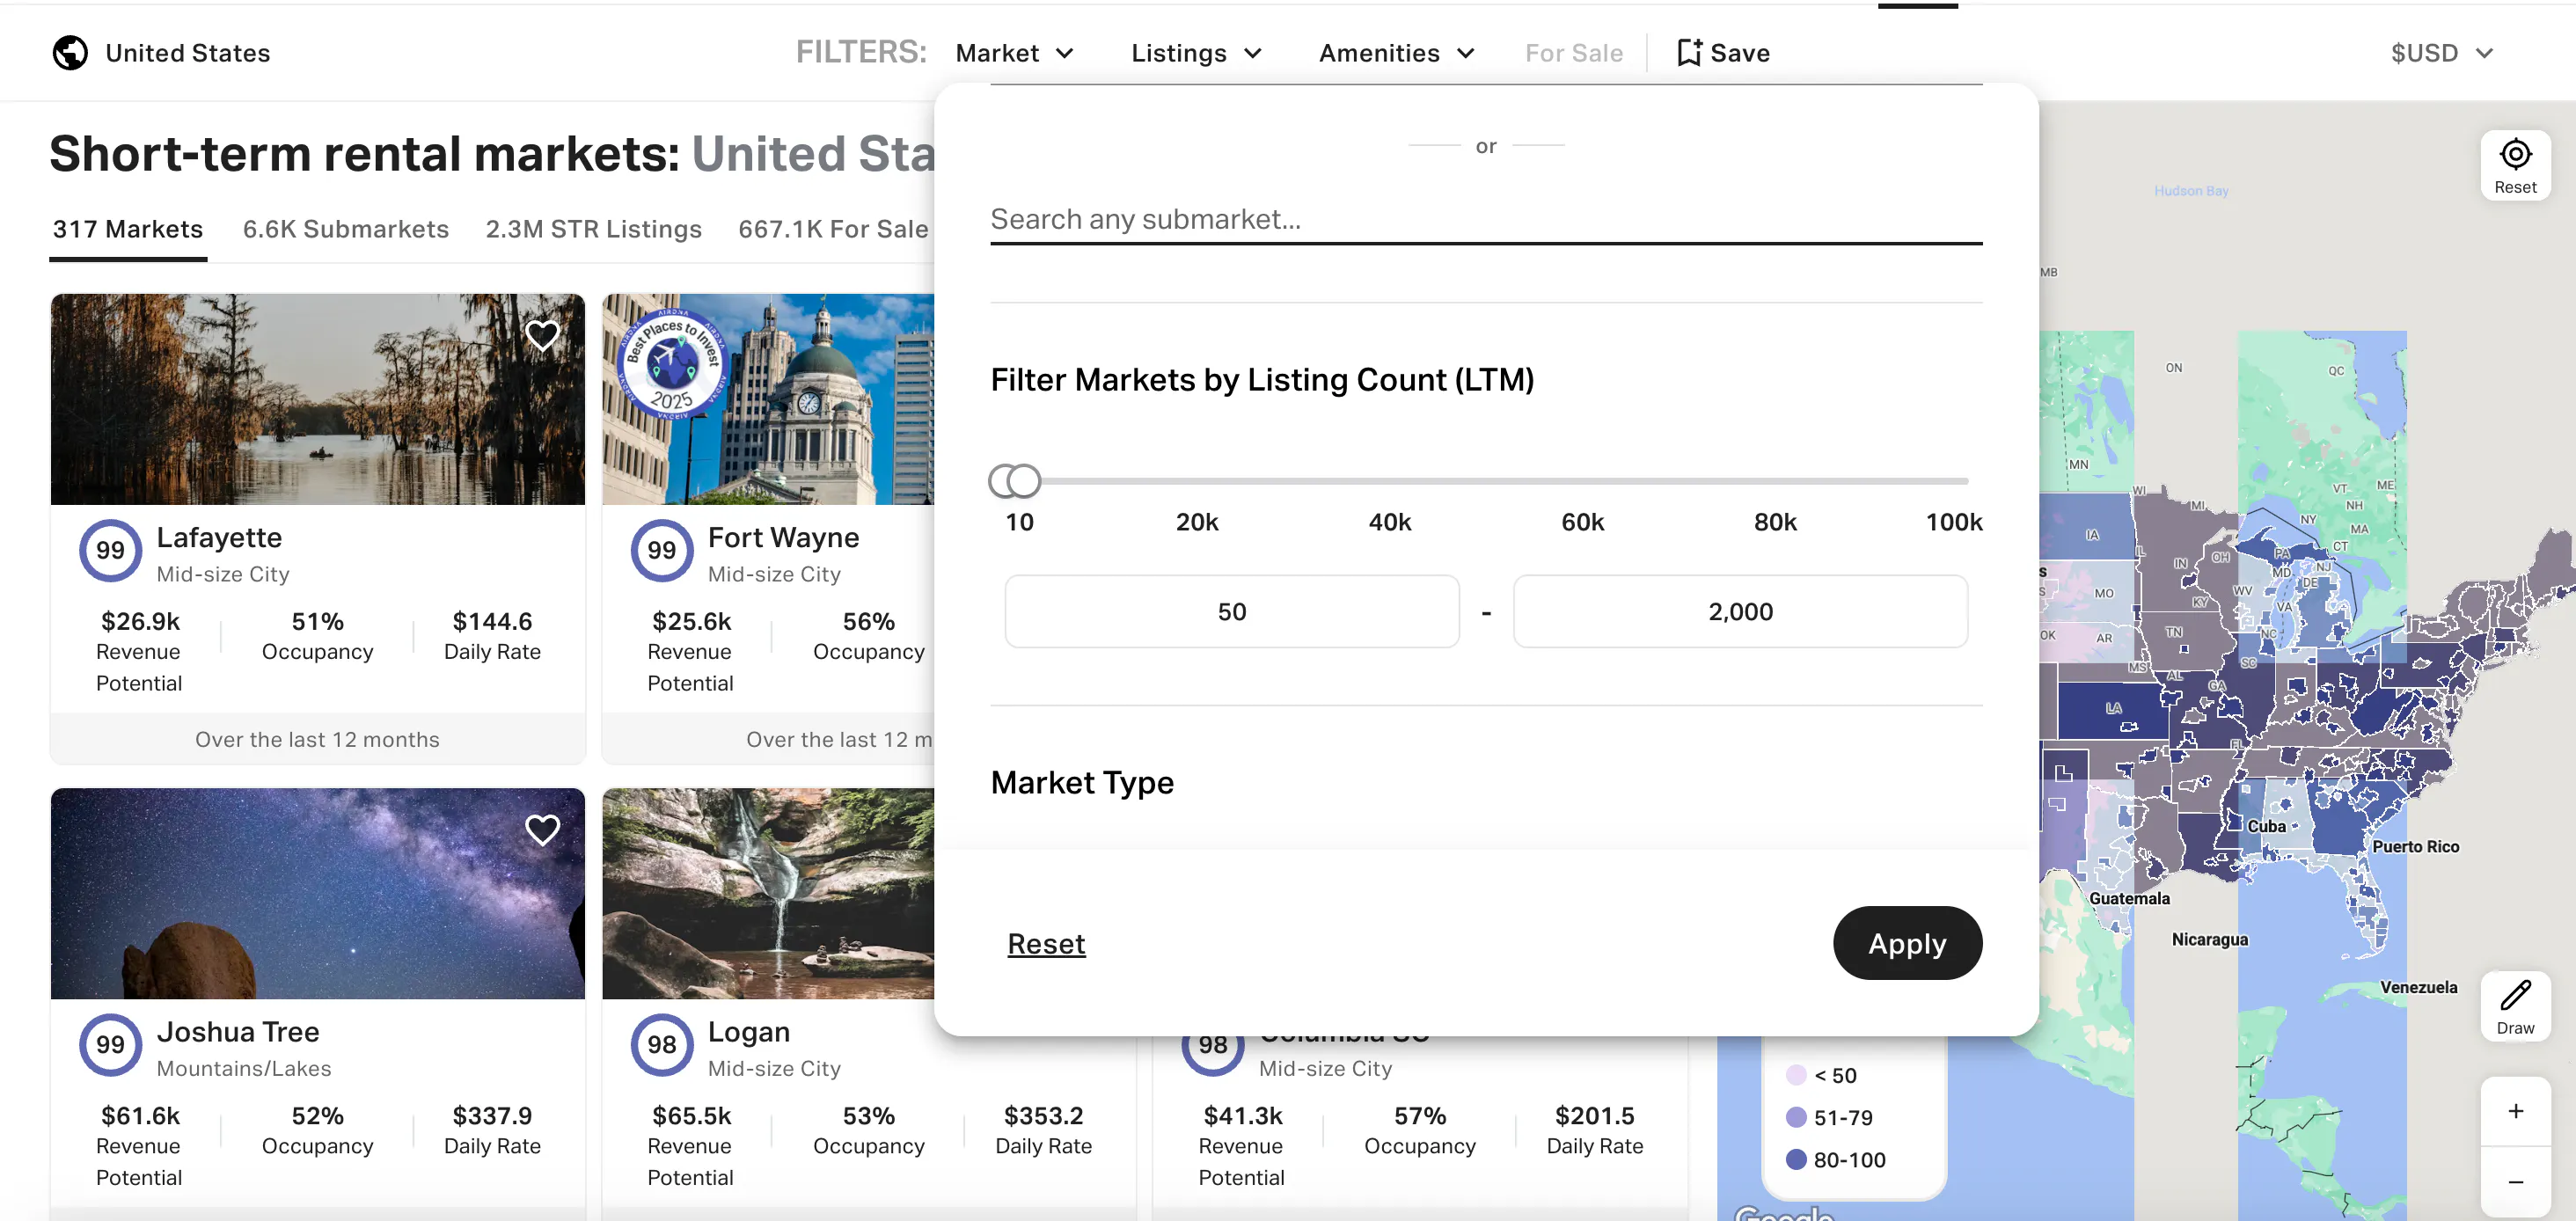
Filter for markets with between 50-2,000 active listings.
Why? Markets with fewer than 50 listings often lack sufficient infrastructure and demand, while those exceeding 2,000 listings have typically already seen their prime growth phase.
From the same Market filter tab, scroll to the Filter Markets by Listing Count (LTM) scale.
Step 3: Focus on proven revenue growth
The clearest signal of an emerging market is consistent revenue growth, so filter for markets with a Revenue Growth Score of 70 or higher in the Market Score metrics. This immediately narrows your focus to locations showing substantial upward momentum.
While Rental Demand is another crucial metric for emerging markets, we've found that applying both filters simultaneously can overly restrict your results. The Revenue Growth Score alone will give you a solid starting point without eliminating promising markets that might score moderately on Rental Demand.
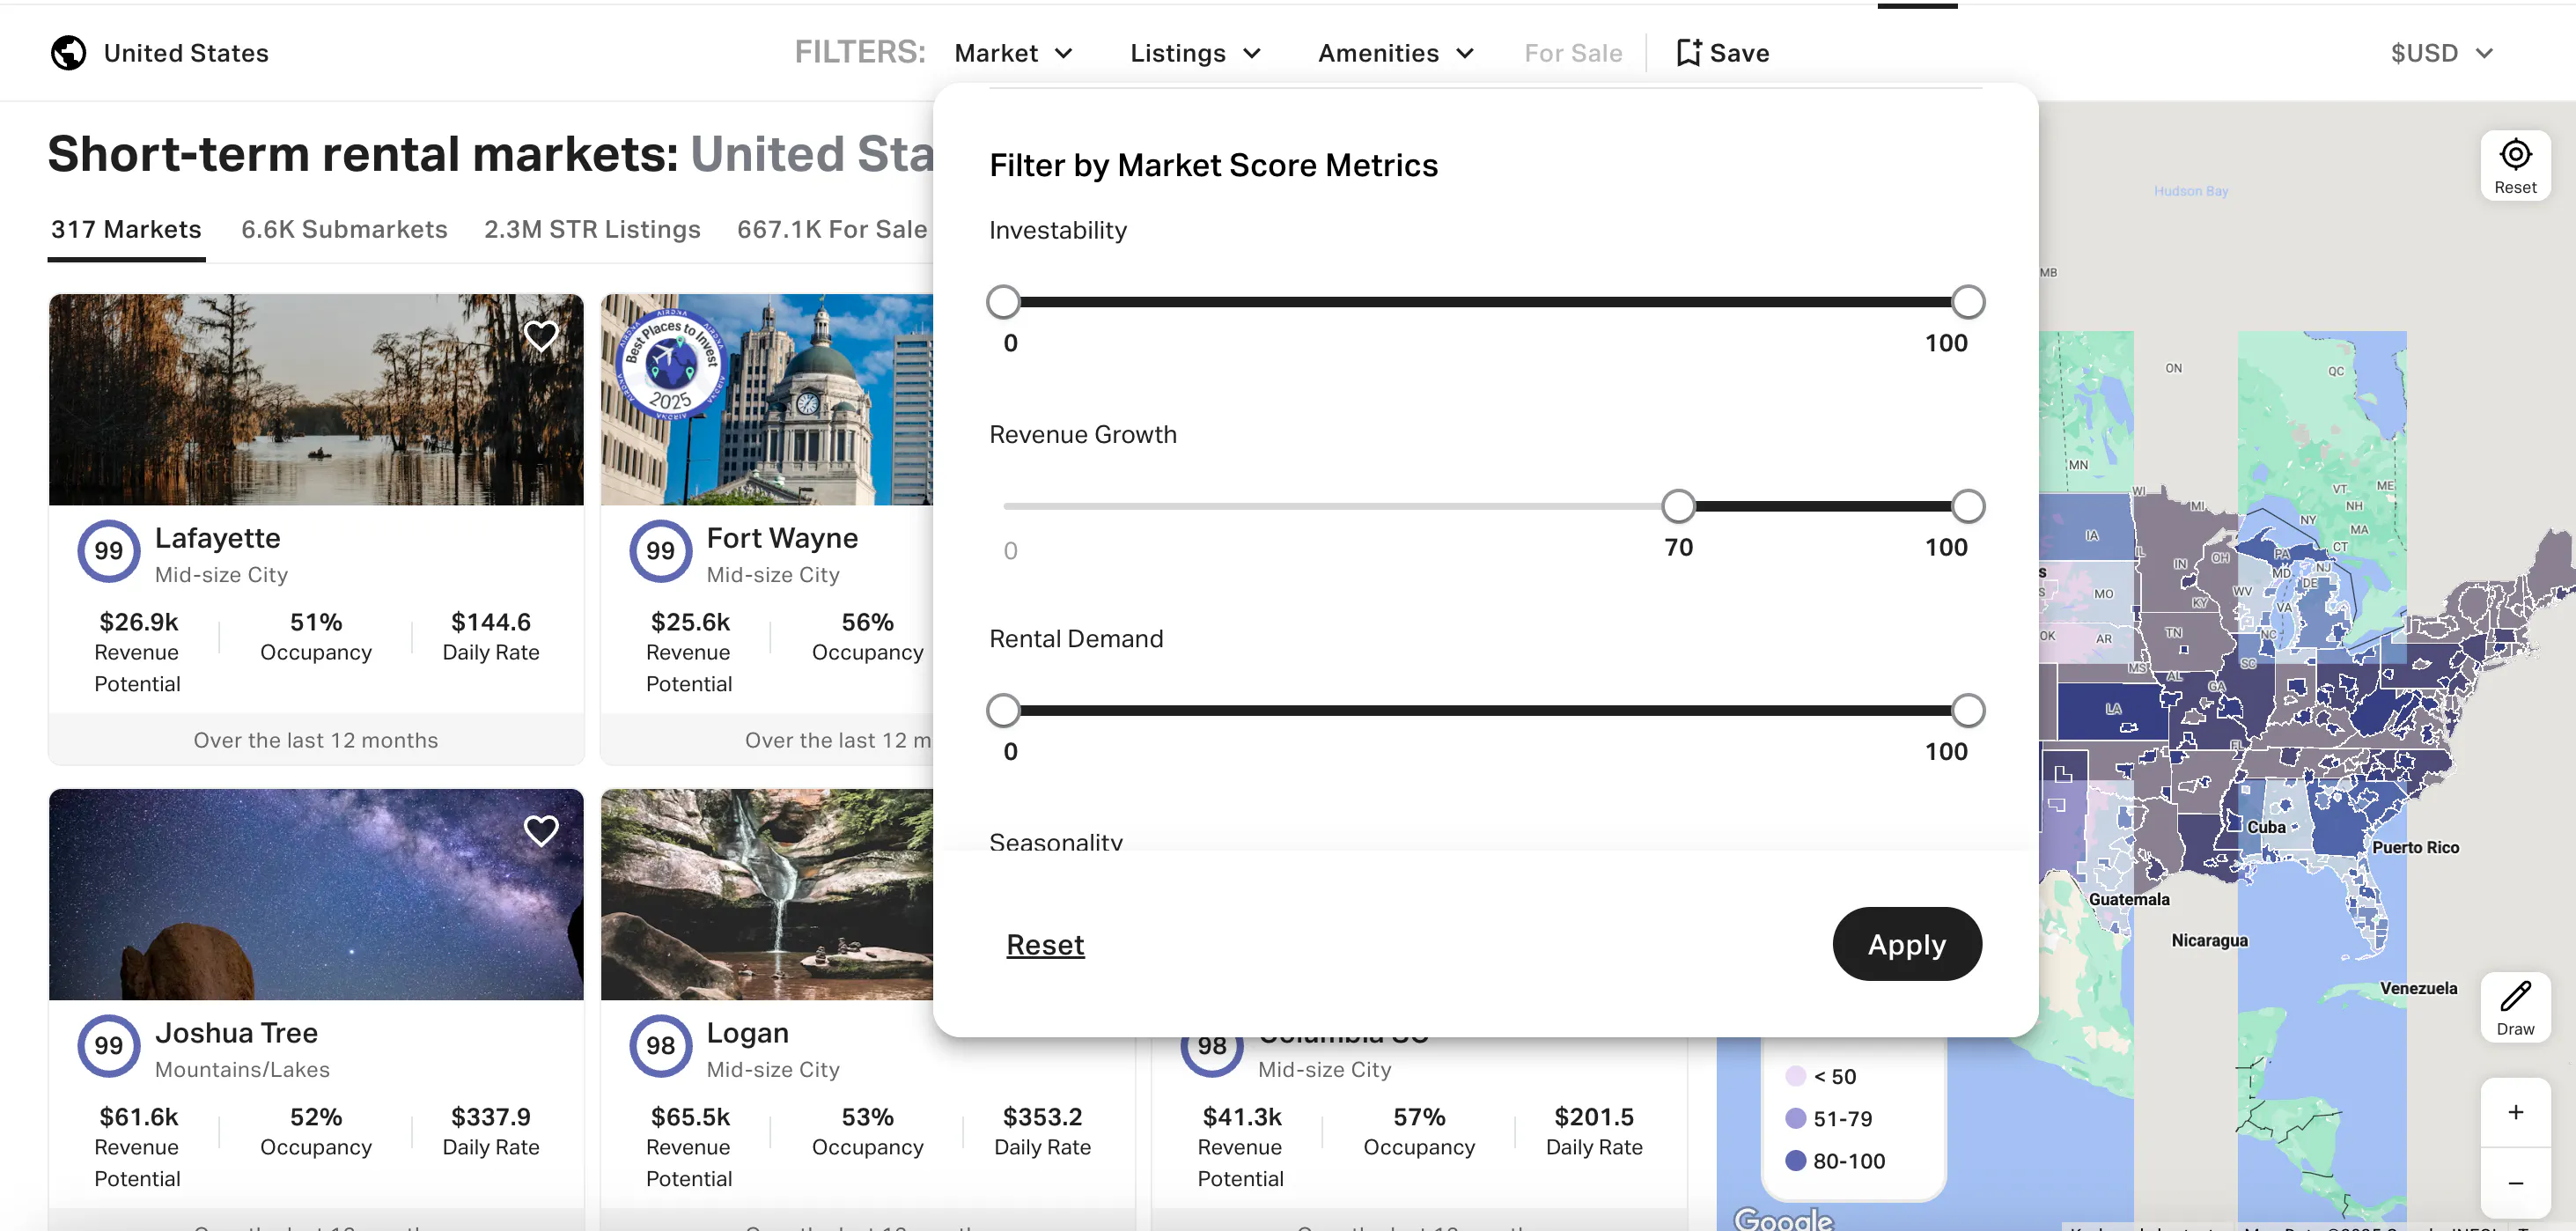
Note: These parameters aren't set in stone. If you're specifically looking for emerging opportunities in larger markets, feel free to adjust these filters.
Top 10 Emerging STR Markets
Below is the current lineup of markets that surfaced from our filtering process, showing the strongest signals of emerging growth potential.
Remember, this list isn't the end goal—it's a demonstration of what proper analysis can uncover. The real value lies in understanding how to identify these opportunities yourself as markets evolve.
- Johnstown, Fort Collins, Colorado
- Lynchburg, Virginia, particularly the Madison Heights and Forest submarkets
- Andover, Boston, Massachusetts
- Lancaster, Pennsylvania, particularly the Manheim, Narvon, New Holland, and Christiana submarkets
- Des Moines, Iowa, particularly the West Des Moines submarket
- Whitewater, Coachella Valley, California
- Downtown Hartford, Connecticut
- Saint Martinville, Lafayette, Louisiana
- Pacific Beach, Greys Harbor, Washington
- Irvine, Red River Gorge, Kentucky
Note: Several leading submarkets shared a parent market, including Lynchburg, Lancaster, and Des Moines. We mention those submarkets to display a more geographically diverse list.

How to Analyze an Emerging Market
Finding emerging STR markets is just the first step. The real skill lies in evaluating these candidates thoroughly before you commit your capital. Let's break down exactly how to analyze a market's true potential using AirDNA data.
Look for growing occupancy and revPAR
First, focus on two critical vital signs: Rising occupancy rates and growing revPAR (revenue per available room).
Increasing occupancy signals expanding demand—more travelers discovering the destination. This growth typically precedes rate increases as supply gets absorbed.
Meanwhile, growing revPAR indicates the market is becoming more profitable over time. This combined metric captures both occupancy improvements and rate increases, making it a comprehensive indicator of market health.
Look beyond single metrics
While Revenue Growth Score is an excellent starting point, relying on any single metric is a rookie mistake. Instead, look into all of those individual metrics that factor into that Revenue Growth Score.
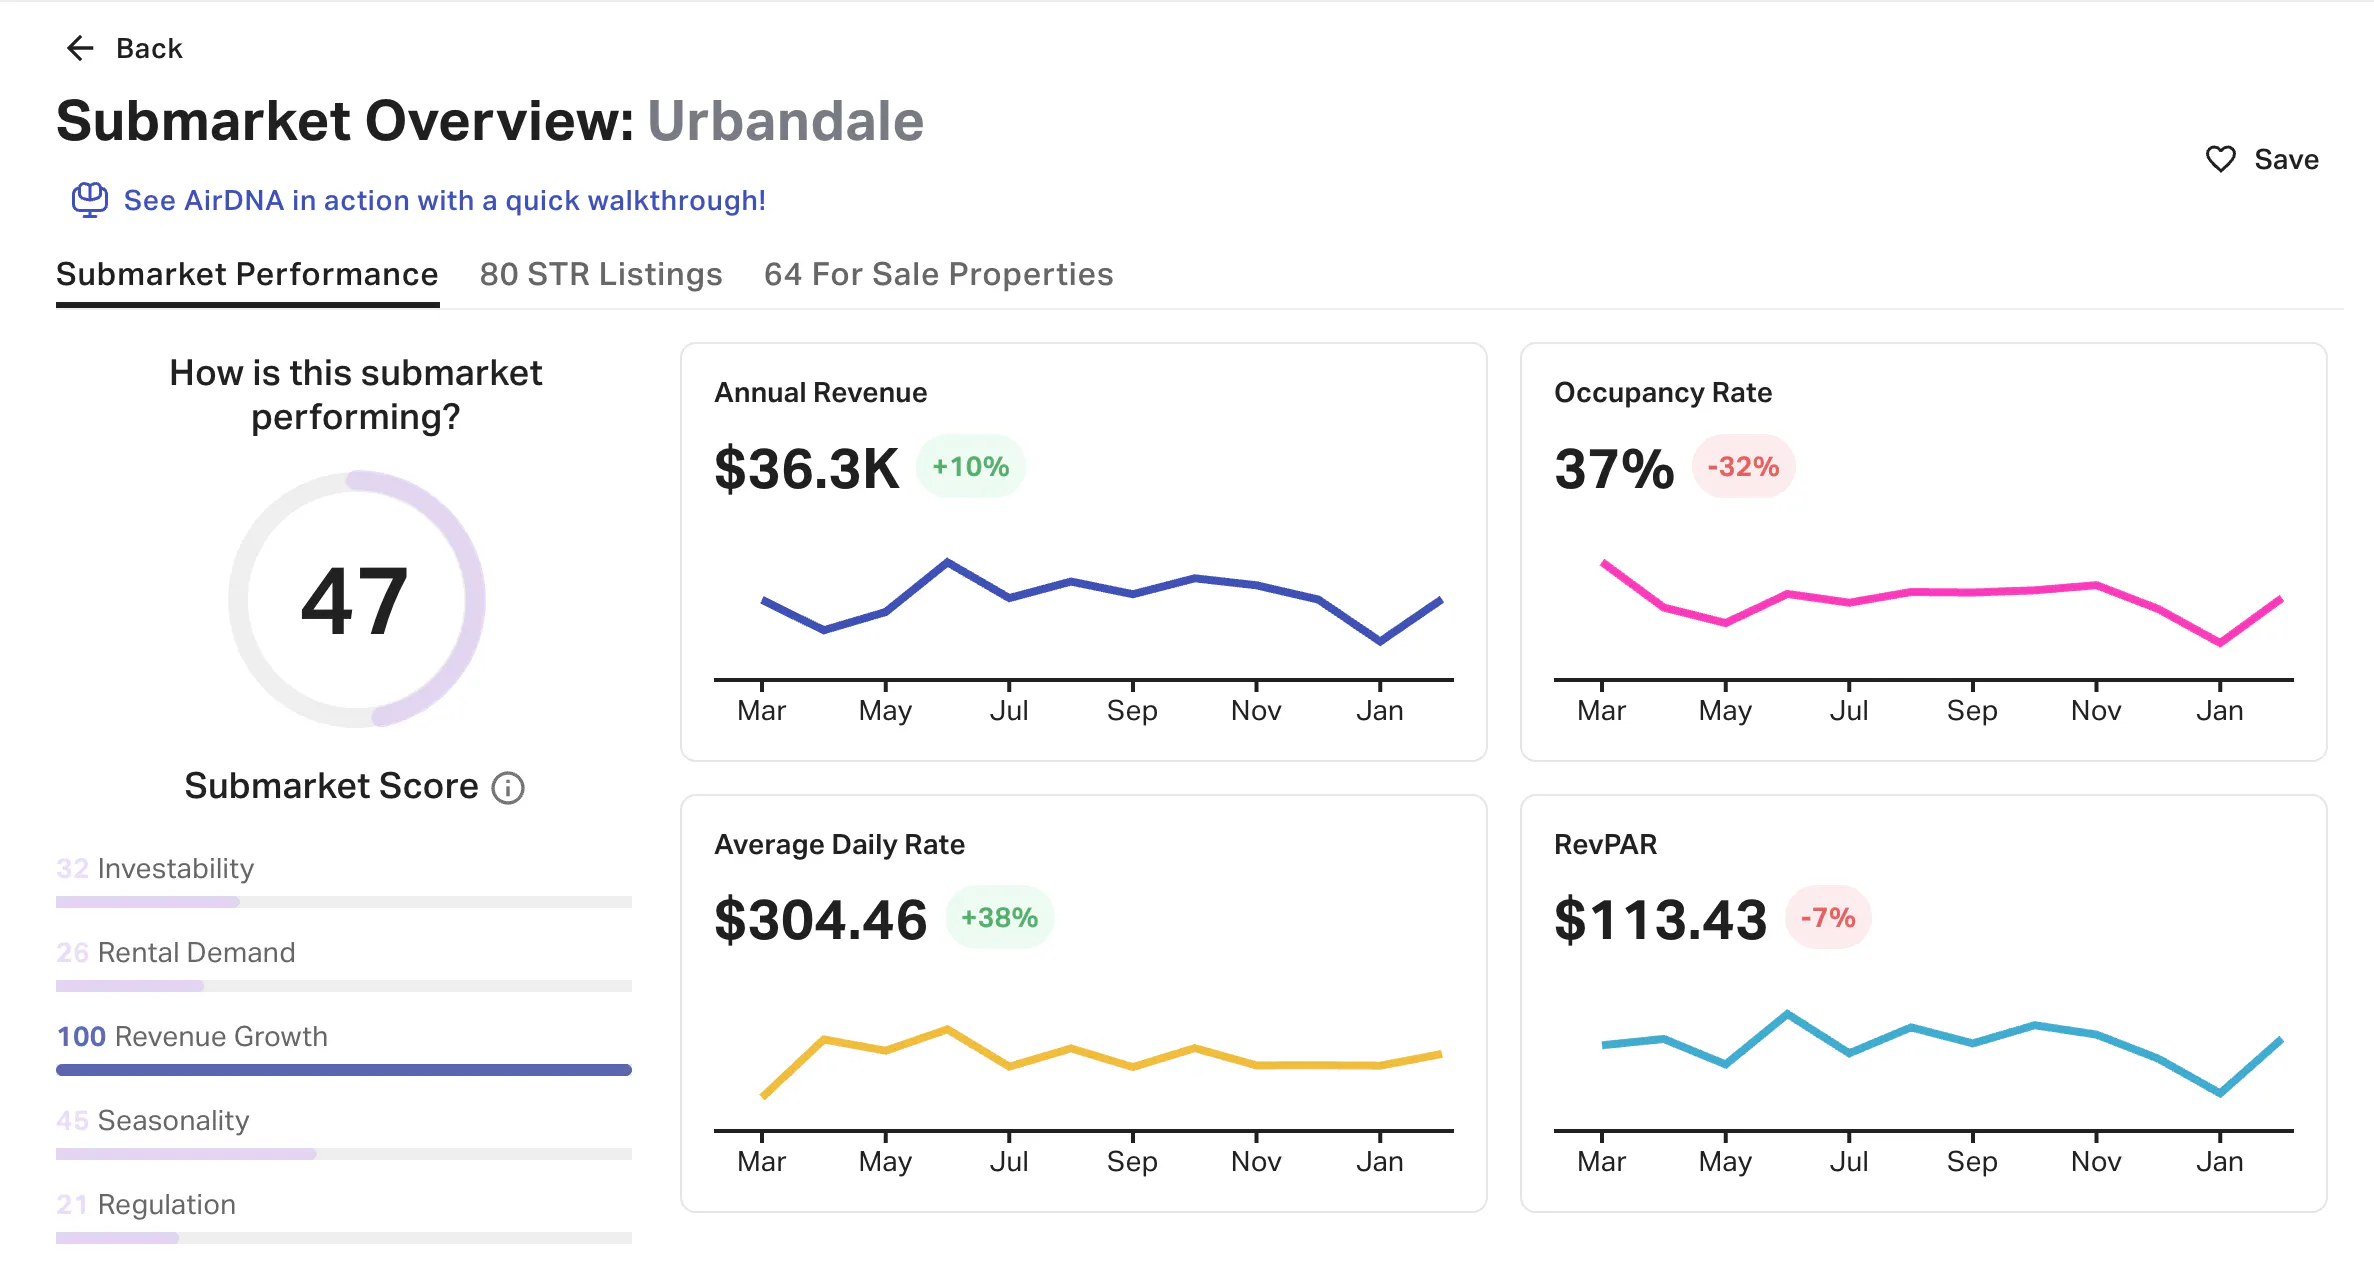
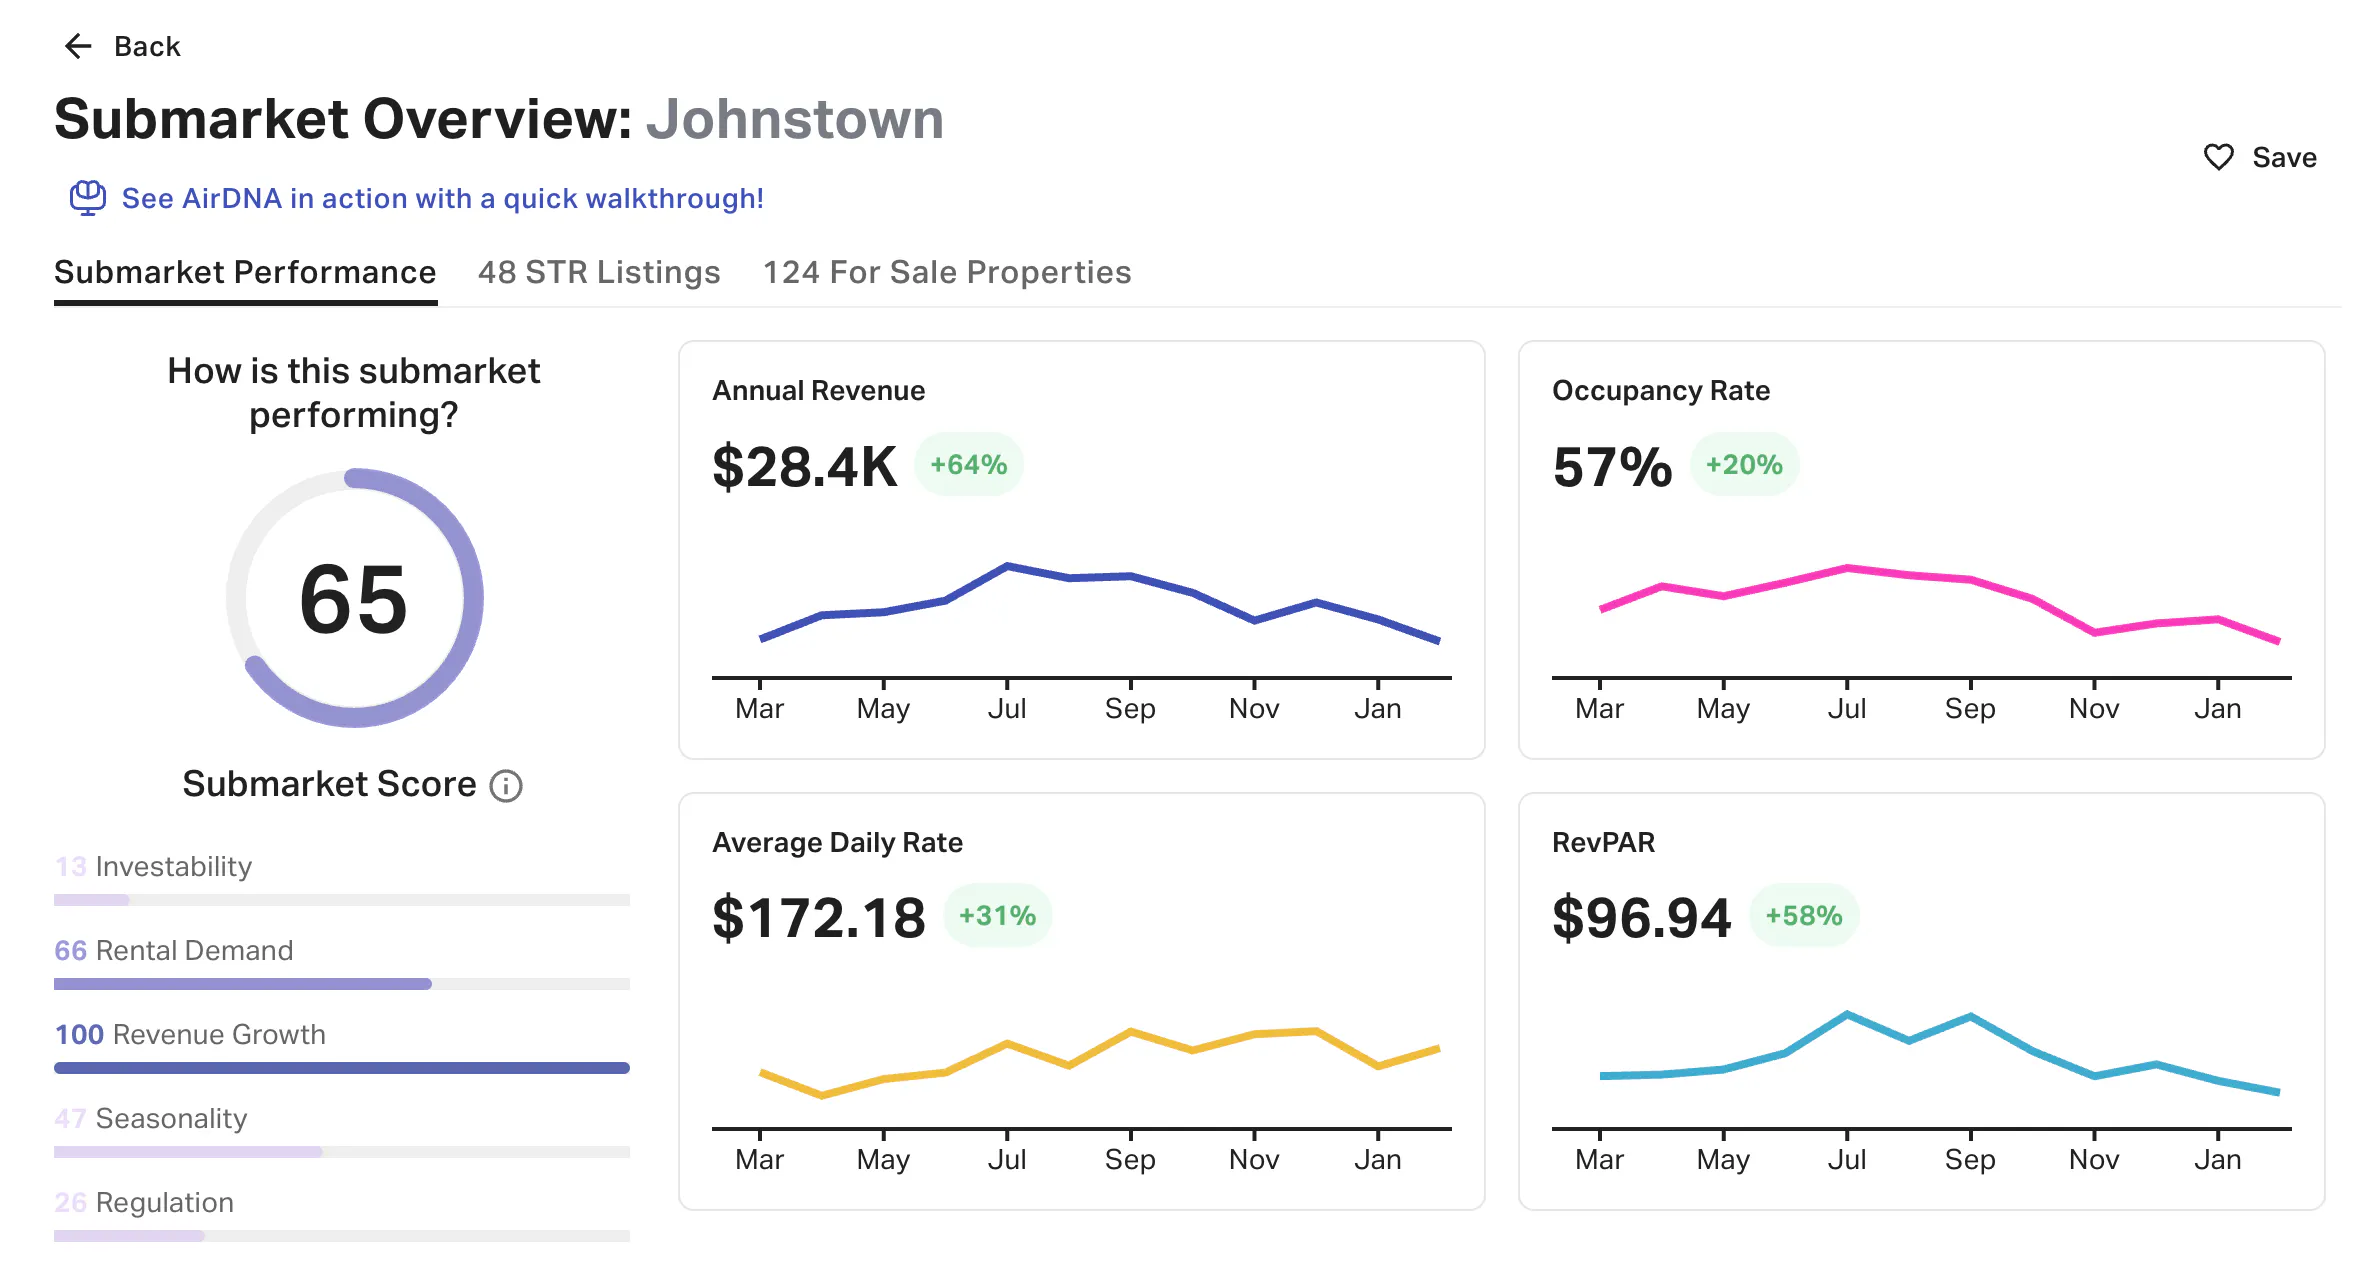
Let’s illustrate why by comparing Johnstown, Colorado with Urbandale, Iowa. Both markets boast a Revenue Growth Score of 100—so why didn’t Urbandale make our top 10 list?
Despite boasting a perfect Revenue Growth Score of 100, deeper analysis of Urbandale reveals concerning trends: A declining occupancy rate (-32%), falling revPAR (-7%), and an overall Market Score below 50. This classic trap—strong revenue growth masking deteriorating fundamentals—illustrates why multi-metric analysis is essential.
In contrast, Johnstown, Colorado exemplifies a well-rounded emerging market with growth across revenue, Average Daily Rate (ADR), occupancy rate, and supply, delivering a Market Score of 65.
Verify long-term trends
For any promising market, examine these critical datasets:
1. Rental growth trajectory
Look at the market’s 3-year supply trend in active listings, and look for steady upward movement. For example, Johnstown, Colorado’s 37% growth shown in the data demonstrates healthy expansion without oversaturation.
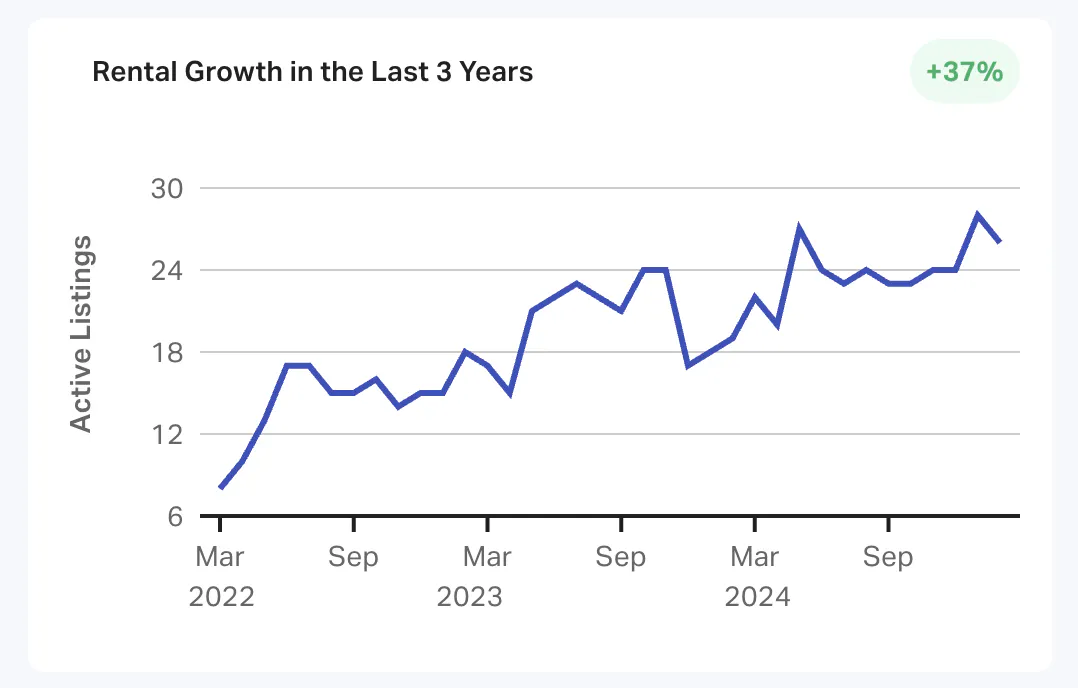
If you don't see an upward trend, dig deeper into why. Does supply fluctuate seasonally? This might indicate a seasonality rate issue rather than a fundamental market problem.
More concerning is when you spot a consistent downward trend beginning after a specific date—this often signals regulatory changes. Always investigate if vacation rental regulations have recently changed in markets showing sudden supply drops.
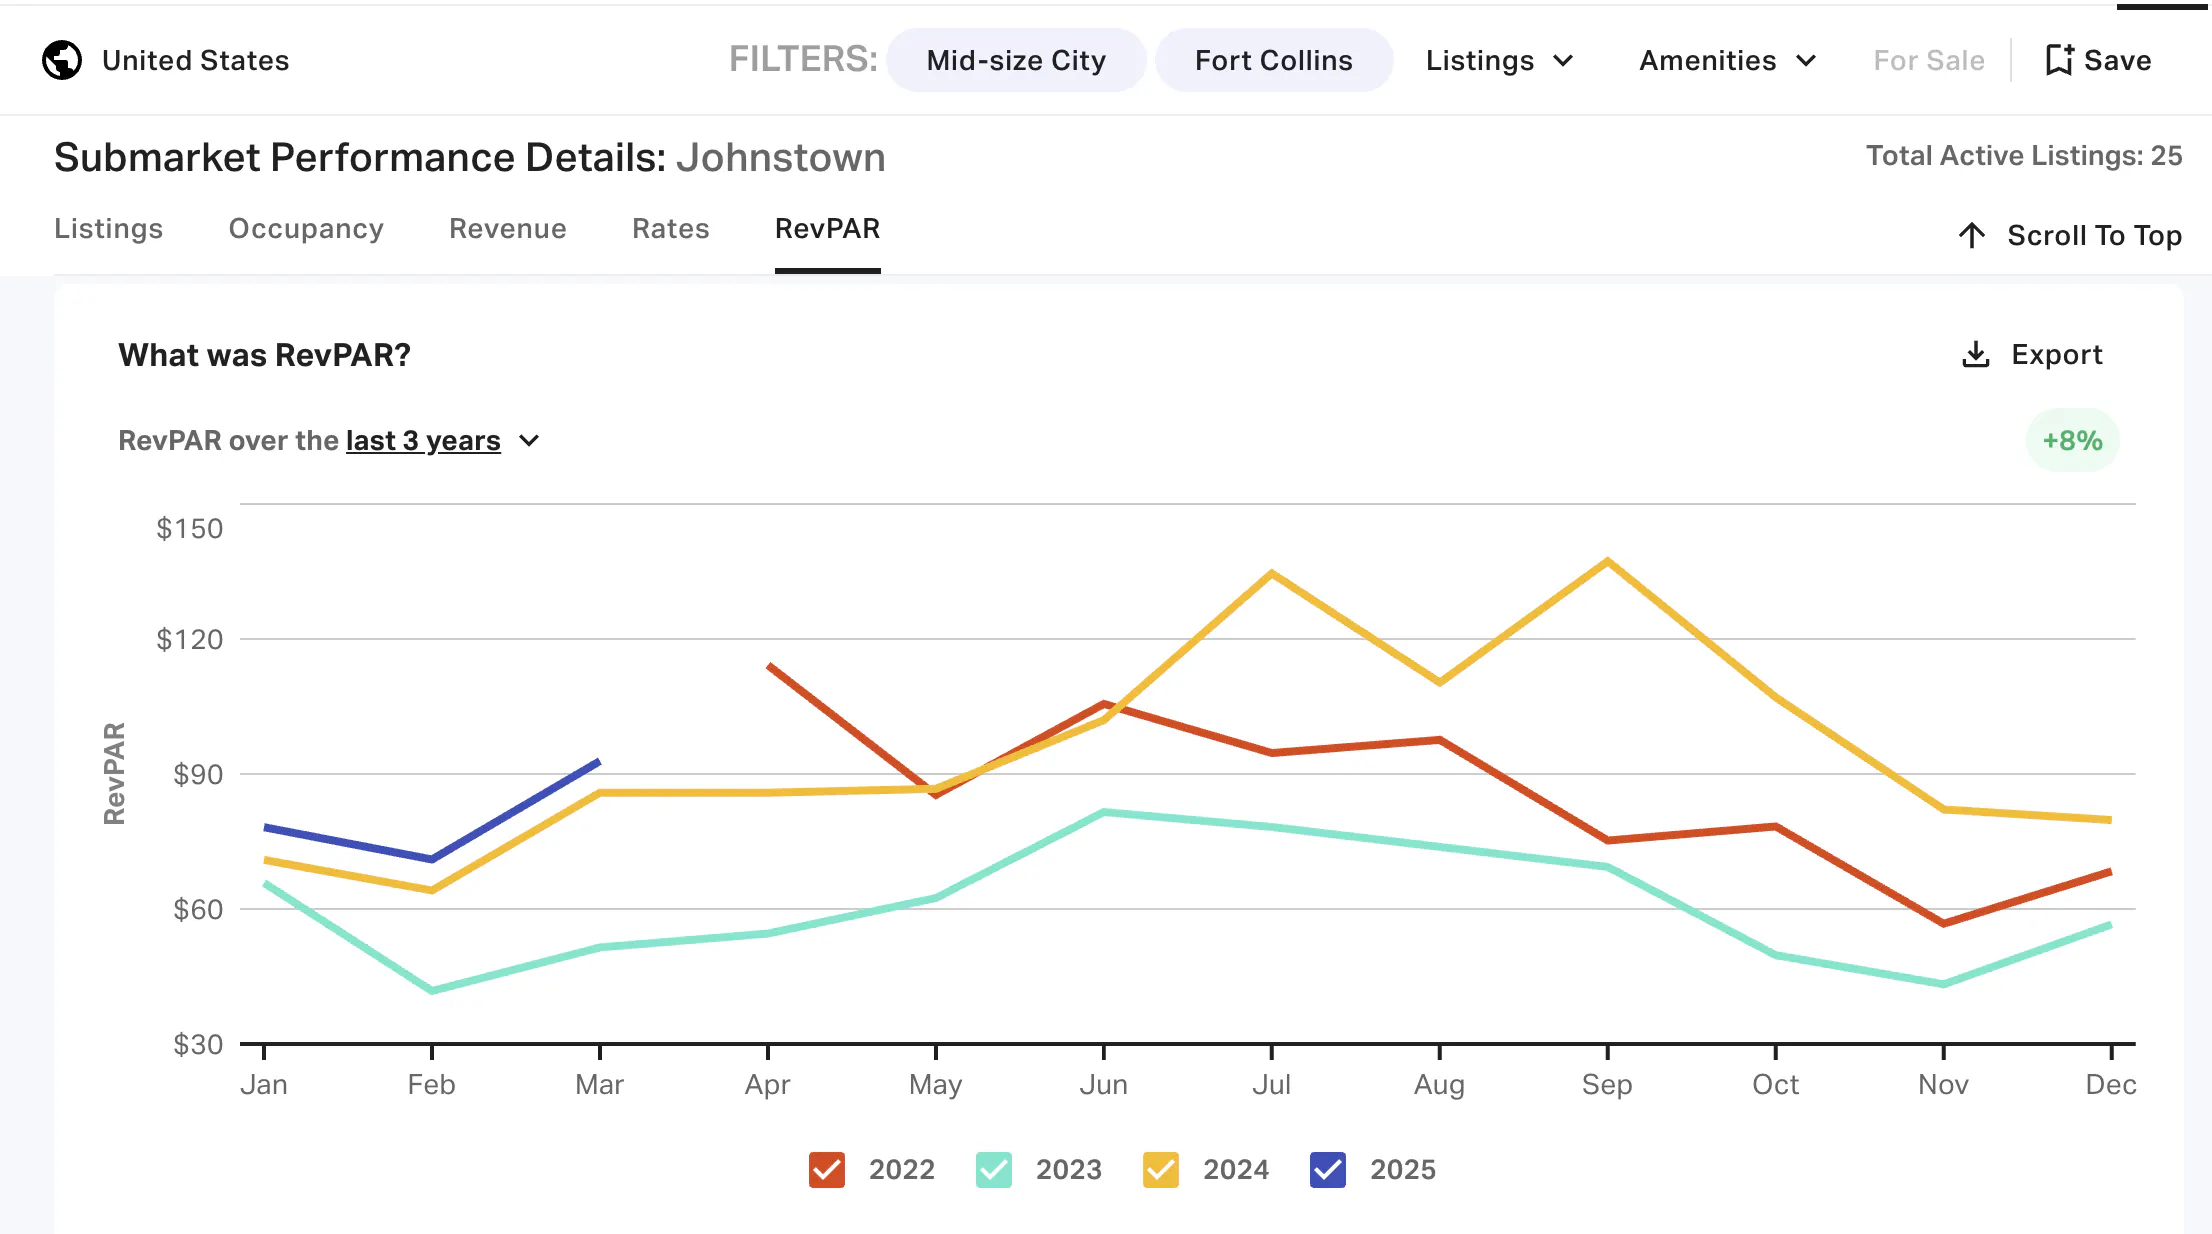
2. RevPAR development
Analyze the market’s 3-year revPAR trends by looking at AirDNA’s “What was RevPAR?” graph and changing the view to the last 3 years. Consistent growth here is the clearest signal of improving market economics and indicates increasing revenue efficiency per property.
3. Occupancy patterns
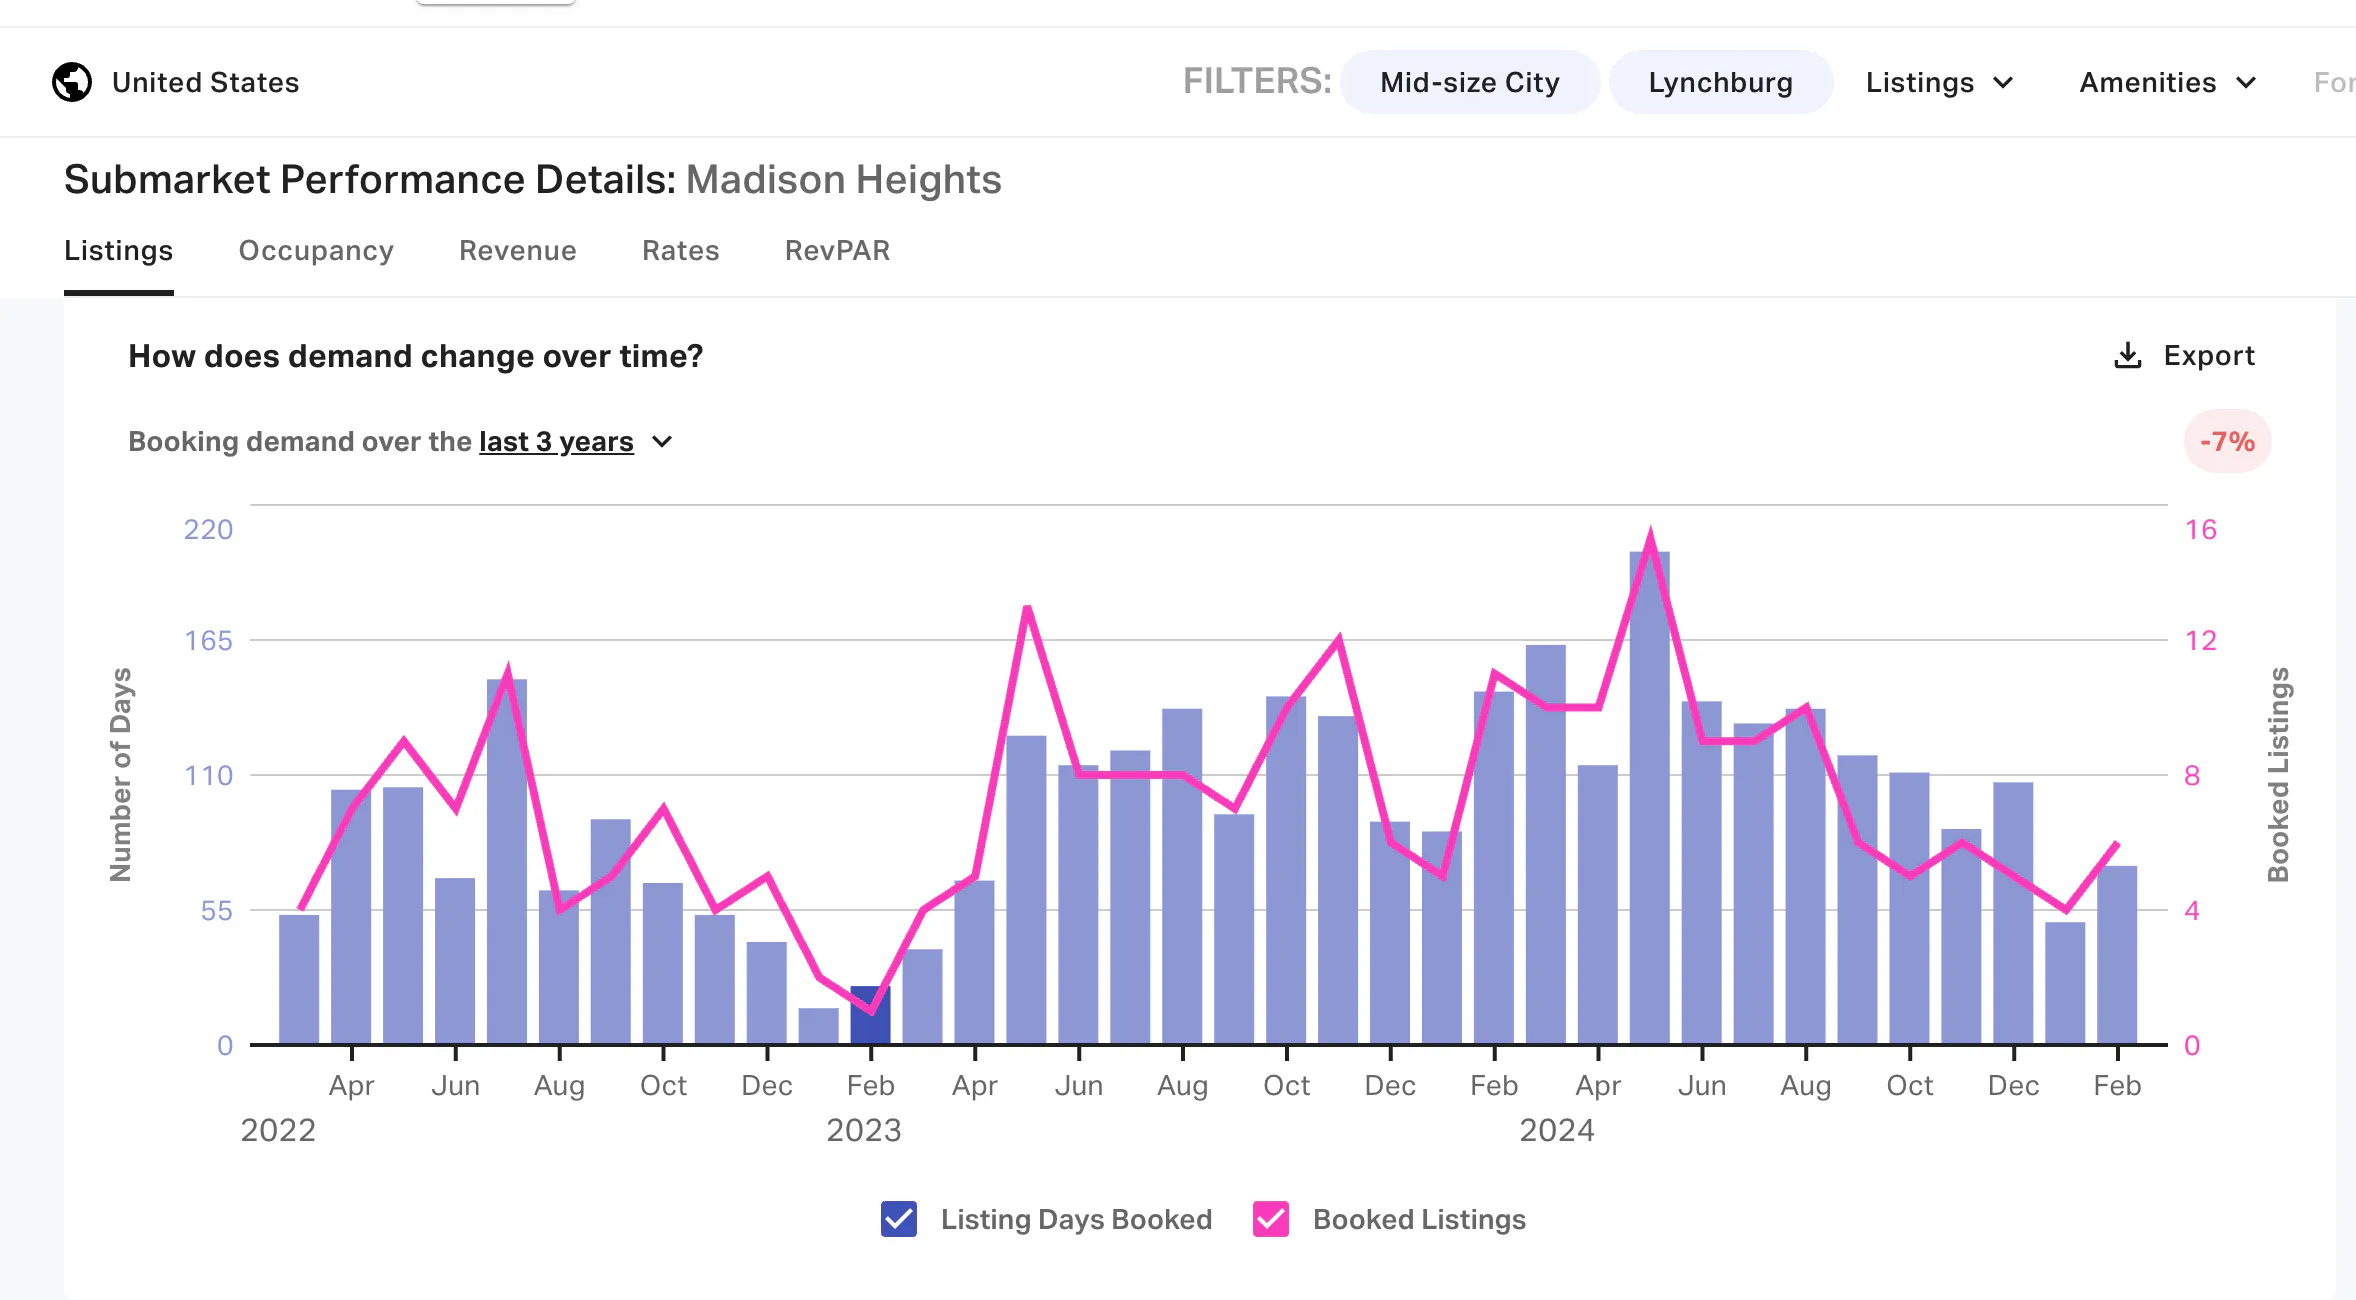
AirDNA’s "How does demand change over time?" graph reveals crucial seasonality rate insights. For seasonal markets, compare the same month across multiple years to identify true demand growth.
Madison Heights, Michigan demonstrates this perfectly: Booked listing days in May increased from 105 (2022) to 126 (2023) to 201 (2024), signaling robust year-over-year growth even as peak demand shifted from July to May.
4. Rate evolution
The "What percentage of the month was occupied?" graph is also worth a look to find emerging STR markets—though it’s best viewed in the context of rate changes.
Take Andover, Massachusetts as an example. Despite being an emerging market, Andover's occupancy rate actually decreased by a percentage point from 2023 - 2024.
Looking at the three-year data, we can see that occupancy rates were consistently higher between May and September in 2022 than they were during those same months in 2023 and 2024.
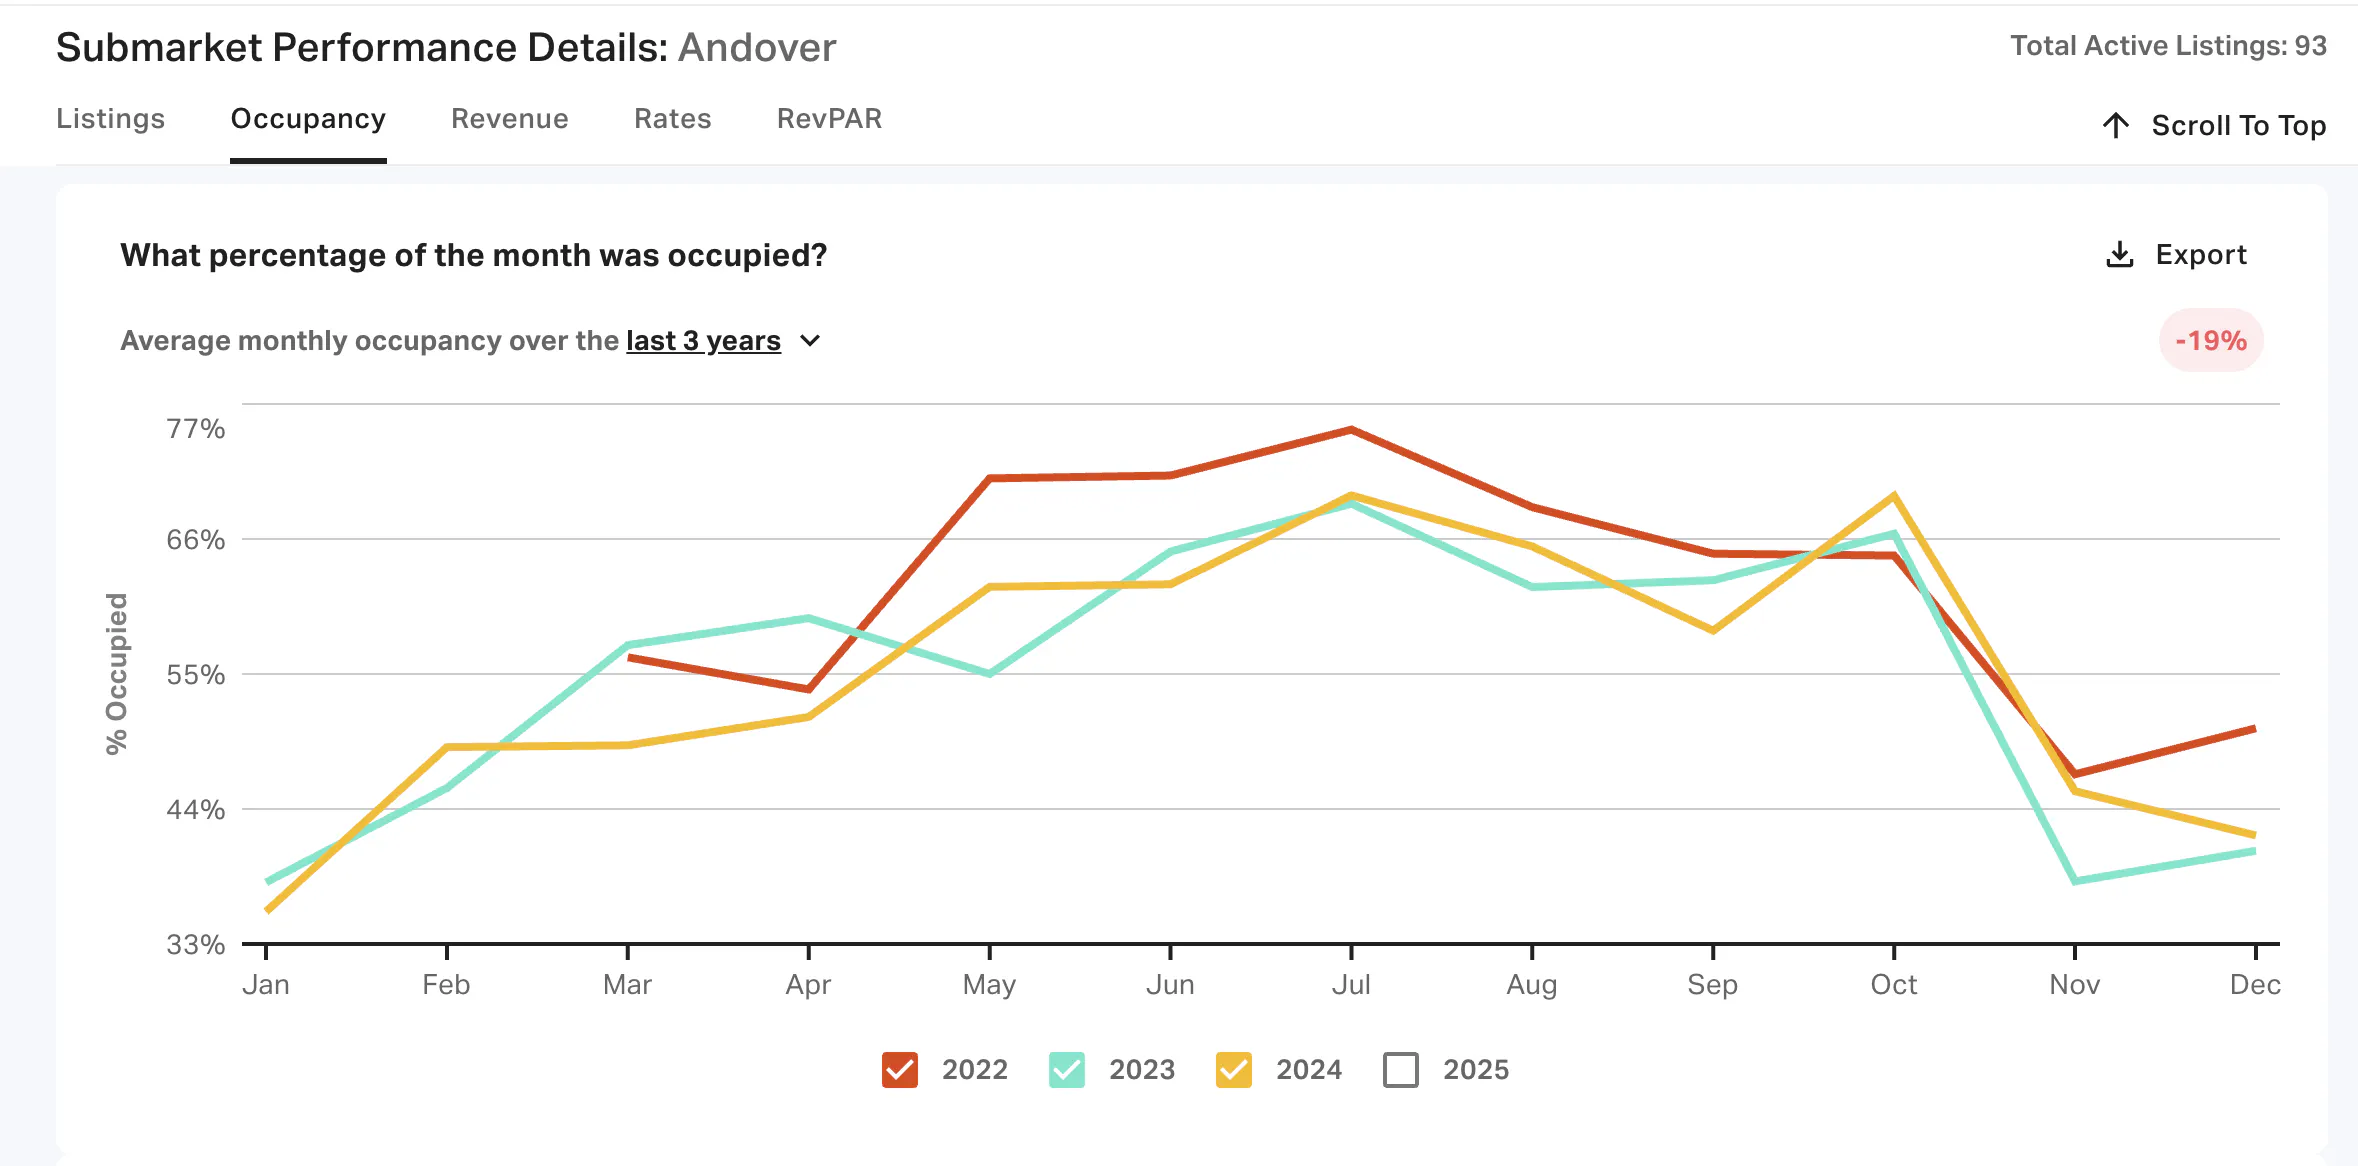
So what's driving Andover's impressive 98 Revenue Growth Score if occupancy is declining? The answer lies in the rate data. The market’s revPAR and ADR have increased by 18% and 20%, respectively over the last year.
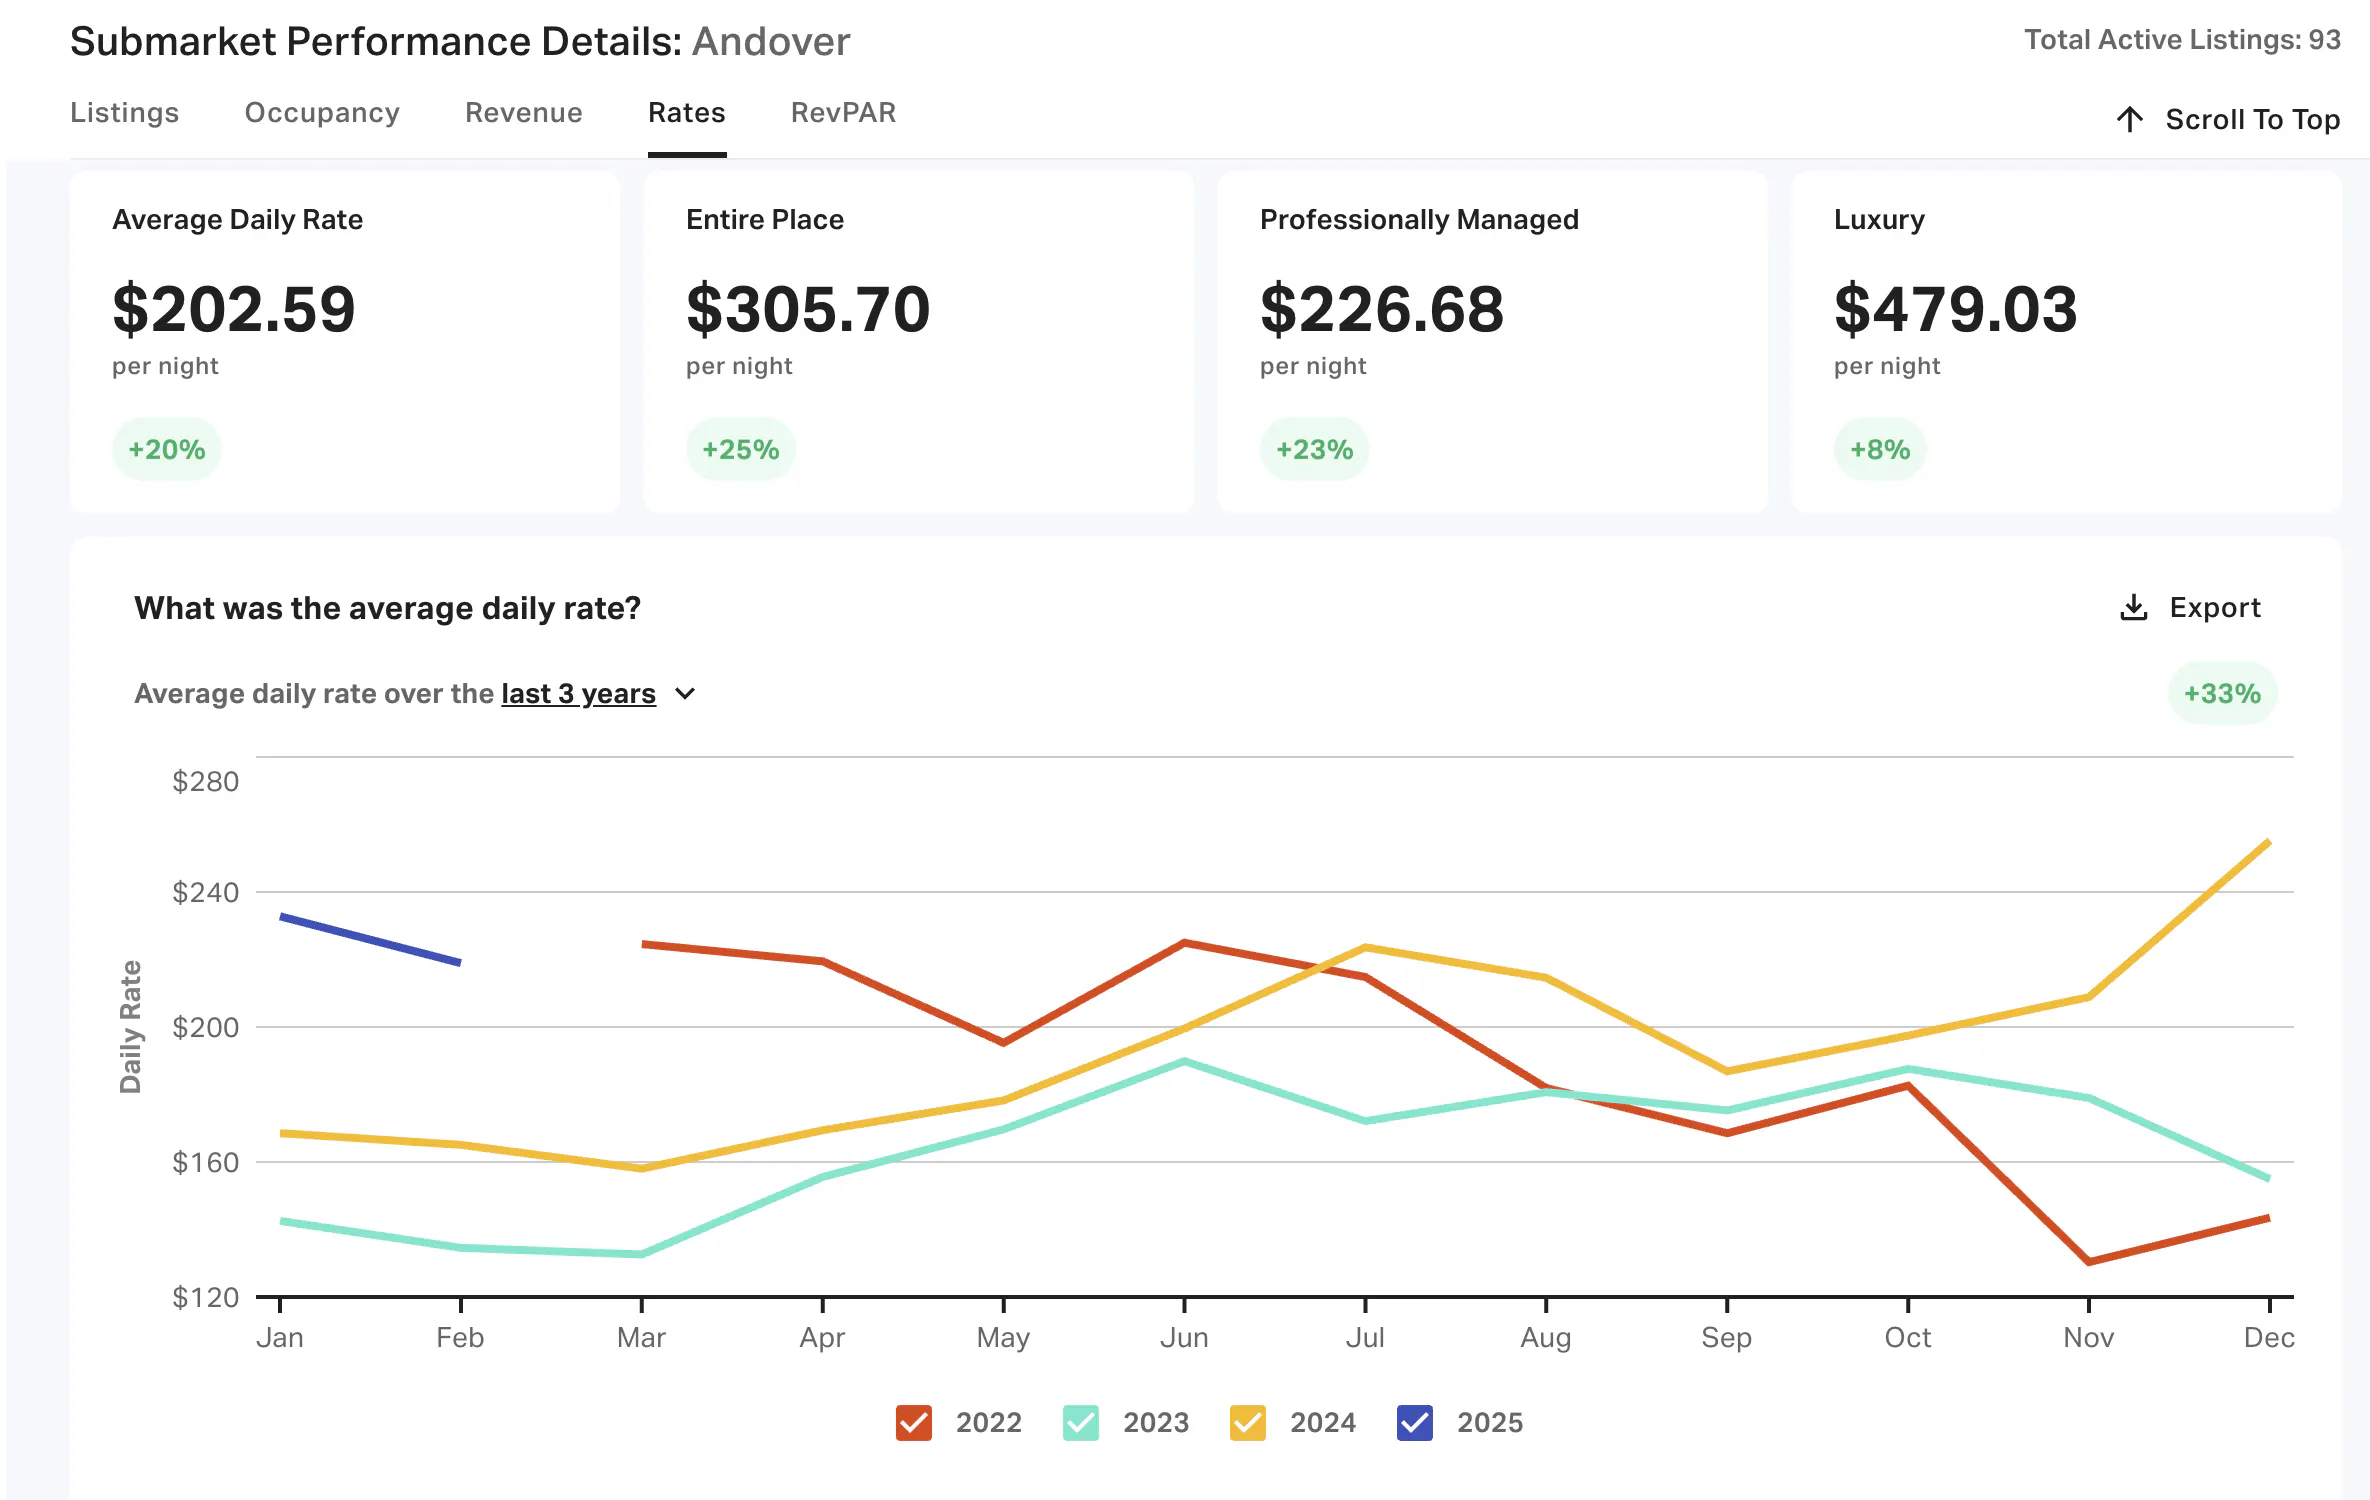
Examining the rate trends more closely, we can see that nightly rates for Andover properties have consistently surpassed 2022 averages for the months between July and December. The most dramatic example appears in December, where despite lower occupancy in 2024 compared to 2022, the nightly rate during the Christmas season has grown tremendously—from an average of $143.50 in 2022 to $255.20 in 2024.
Andover perfectly exemplifies a market where revenue growth is being driven primarily by rate increases rather than occupancy gains. This pattern often indicates a market transitioning from budget travelers to higher-spending visitors willing to pay premium rates, which can be more profitable for property owners despite fewer booked nights.
Calculate potential earnings
Understand the investment potential of any address in the world.
How to Find Emerging STR Markets That Are Right for You
All the examples we've analyzed demonstrate something crucial: Emerging markets don't follow a single pattern of growth. Revenue Growth Scores can be misleading if you don't understand what's actually driving that growth.
The data reveals different types of emerging markets:
- Occupancy-driven markets like Madison Heights, where booking days in May jumped from 105 (2022) to 201 (2024), showing growing visitor demand.
- Rate-driven markets like Andover, where December rates surged from $143.50 (2022) to $255.20 (2024) despite slightly declining occupancy.
- Balanced growth markets like Johnstown, with healthy increases across both metrics.
Understanding these distinctions is critical because the "right" emerging market depends entirely on your investment strategy and operational preferences.
If you're considering part-time short-term rental investing where you'll use the property yourself during certain periods, rate-driven markets might be ideal. You can block off your personal usage during low-demand months while capturing premium rates during peak periods.

For full-time rental operators seeking to maximize year-round STR markets, look for those showing occupancy improvements across traditionally slower months. These markets reduce the seasonal cash flow volatility that plagues many vacation town-only market investments.
Investors focused on affordability percentage and property appreciation should prioritize markets early in their growth cycle—typically those showing occupancy increases first, before rates have substantially risen. These markets often offer the best rent-to-price ratio and greatest long-term upside.
The key is aligning market characteristics with your specific investment goals, timeline, and management approach. There's no universally "best" emerging market—only the one that best fits your unique strategy.
How is your STR performing?
Your vacation rental may be amazing, but is it better than your competition? Connect your Airbnb listing to AirDNA to see its Booking Performance Score
Why You Should Invest in Emerging STR Markets
The hard truth about short-term rental investing is that the most famous destinations rarely offer the best returns anymore. Saturated markets have seen property values skyrocket while returns compress—a classic case of too many investors chasing too few deals.
Emerging markets flip this equation in your favor, offering:
Lower acquisition costs
The median property in established vacation destinations often cost more than comparable properties in emerging markets. This dramatically improves your rent-to-price ratio from day one, allowing you to enter the market with less capital and less debt.
Less competition
Emerging markets typically have fewer professional operators, meaning you're not competing against sophisticated property management companies with extensive resources. This creates opportunities to differentiate your property with relatively modest improvements and operational excellence.
Regulatory runway
Many emerging markets haven't yet implemented restrictive vacation rental regulations that plague established destinations. Getting established before potential regulatory changes gives you grandfather status in many jurisdictions—a significant competitive advantage if the market later restricts new entrants.
Growth potential
Unlike saturated markets where both occupancy rate and average daily rate have likely peaked, emerging markets offer genuine upside in both metrics. This creates the potential for double-growth: Improving operations can increase your cash flow while market development simultaneously enhances your property value.
Research Airbnb Markets
Gain insights into the revenue and occupancy trends in your market.
FAQs
How do seasonality rate and ADR impact overall profitability?
The relationship between seasonality rate and average daily rate fundamentally shapes your STR's cash flow pattern. Markets with high seasonality typically show dramatic peaks in both occupancy and rates during prime seasons, often allowing for 70-80% of annual revenue to be generated in just 3-4 months.
This can be profitable but requires disciplined cash management and often necessitates higher rates during peak periods to compensate for off-season vacancies. Nonseasonal markets with consistent occupancy rates might generate similar annual returns but with more predictable monthly cash flow.
The ideal balance depends on your financial situation—if you can weather inconsistent income, highly seasonal markets often offer higher peak rates and better personal usage opportunities during shoulder seasons.
What if vacation rental regulations change in my chosen market?
Regulatory risk is real in every market, which is why you need to understand local vacation rental regulations before investing. That said, a smart long-term investment strategy includes contingency planning.
Properties in emerging markets often have advantages if regulations change: They tend to have better rent-to-price ratio metrics, making them viable as mid-term rentals (1-6 month leases) or traditional long-term rentals if short-term rentals become restricted.
Additionally, properties purchased at lower price points in emerging STR markets provide more exit flexibility if you need to sell. The investment thesis doesn't rely solely on short-term rental performance, unlike properties purchased at premium prices in established vacation markets.
Which metrics are most important for a successful short-term rental investing approach?
While revenue potential naturally gets the most attention, you should also prioritize rent-to-price ratio and affordability percentage—measures of how efficiently your capital is deployed.
A market with slightly lower revenue but significantly lower acquisition costs often outperforms "hotter" markets with inflated property values. Additionally, metrics like AirDNA’s Market Score, which factor in multiple performance indicators, provide more reliable guidance than any single metric in isolation.
For sustainability, prioritize markets showing improving occupancy rate trends across multiple years rather than just rate growth, as occupancy increases typically indicate genuine market expansion rather than tactical pricing changes.
How do I pivot to a long-term investment strategy if STR demand drops?
The best STR investments work equally well as traditional rentals—this should be your baseline requirement before purchasing in any market, emerging or established.
Calculate the property's performance under a standard 12-month lease scenario as part of your due diligence. In emerging STR markets like those highlighted in this analysis, the numbers often work for both short and long-term strategies due to the favorable purchase prices relative to rental rates.
ARTICLE SUMMARY
Discover how to find emerging short-term rental markets with explosive growth potential using AirDNA’s data-driven filters and multi-metric analysis. Discover opportunities before other investors drive up acquisition costs.
Bram Gallagher
AirDNA Director of Economics and Forecasting
Bram Gallagher is an Economist at AirDNA, specializing in uncovering insights that drive smarter short-term rental decisions. He put his Ph.D. in Economics from the University of Georgia to work researching and forecasting hotel data with CBRE prior to joining AirDNA, as well as teaching economics at a number of universities. In his spare time, Bram enjoys making wooden furniture with hand tools.
