

 Calculate Revenue
 Research Markets
 Find For Sale Properties
 Compare My Listing
 STR Revenue Calculator
 Custom Comp Sets
 Submarket Insights
 Custom Search Filters
 Rate Recommendations
 Performance Benchmarking
 Competitor Comparison
 Owner Contact Details
 Property-level performance data
 Tourism Insights
 Real Estate Investment Analytics
 About Us
 Sales
Sales Support
 Press
PressU.S. Review April 2026: Supply Reawakens and the World Cup is Shaping Summer Demand
Published: May 20, 2026

Bram Gallagher
Key Takeaways
- Supply growth accelerated to its fastest pace since last summer, limiting occupancy gains even as demand growth improved through March and April.
- ADR and RRI remained strong in April, showing that established operators continue to maintain pricing power despite softer occupancy trends.
- The upcoming FIFA World Cup is already reshaping summer travel patterns, with demand growth spreading beyond host cities into nearby regional and secondary markets.
Supply growth accelerated again in April as the U.S. short-term rental market continued its gradual recovery from the softer demand environment seen through much of late 2025. While occupancy remained relatively flat, stronger ADR growth and improving booking trends point to resilient traveler demand heading into the summer season.
At the same time, the upcoming FIFA World Cup is already beginning to reshape travel patterns across the country. Demand growth is accelerating not only in host cities but also in surrounding regional markets, as travelers increasingly look beyond traditional urban destinations for more affordable accommodation options. Combined with steady spring travel demand and improving summer pacing, the data suggests a stronger seasonal outlook despite continued economic uncertainty.
At a Glance: Key U.S. STR Performance Metrics for April 2026
- Revenue per Available Rental Night (RevPAR) increased 4.1% year-over-year (YoY) to $138.83
- Available listings reached 1.72 million, a 3.5% increase YoY
- Demand nights were up 2.4% YoY
- Occupancy averaged 54.6%, down 0.3% YoY
- Average Daily Rate (ADR) climbed to $254.13, up 4.5% from last year
- The Repeat Rent Index (RRI) rose 6.4% YoY
- Total nights booked were up 7.7% from 2025
Together, the April data points to a market where improving demand and strong pricing continue to support revenue growth, even as accelerating supply keeps occupancy gains relatively muted heading into the summer season.
Economic Outlook
The U.S. economy remained in a precarious balance in April. With the war in Iran continuing through its second month, energy prices remained elevated. CPI inflation, as reported by the Bureau of Labor Statistics (BLS), jumped to 3.8%, up from 3.3% the month prior and the highest rate since May 2023. The increase reflected more than just gasoline prices, with food and shelter costs also rising meaningfully. Even excluding food and energy, core inflation rose to 2.8%, up from 2.6% in March.
On the other hand, employment increased by a stronger-than-expected 115,000 jobs in April. Those gains were tempered somewhat by a downward revision of 16,000 jobs in previous months and a significant increase in the number of people employed part-time for economic reasons. Still, the unemployment rate remained low at 4.3%.
The mixed data continues a broader pattern of conflicting economic signals. However, the resilience of the labor market combined with rising inflation concerns has weakened expectations for additional Fed rate cuts. As a result, interest rates, including mortgage rates, may remain elevated, discouraging new investment and limiting future STR supply growth.
How Is Your STR performing?
Your vacation rental may be amazing, but is it better than your competition? Connect your Airbnb listing to AirDNA to see its Booking Performance Score.
Supply Growth Rebounds as New Listings Rise
Available listing growth jumped to 3.5% YoY in April, the largest annual increase since June of last year. After a tepid stretch through most of 2025, the uptick over the past two months suggests that last year’s monetary easing is finally working its way through to STR supply.
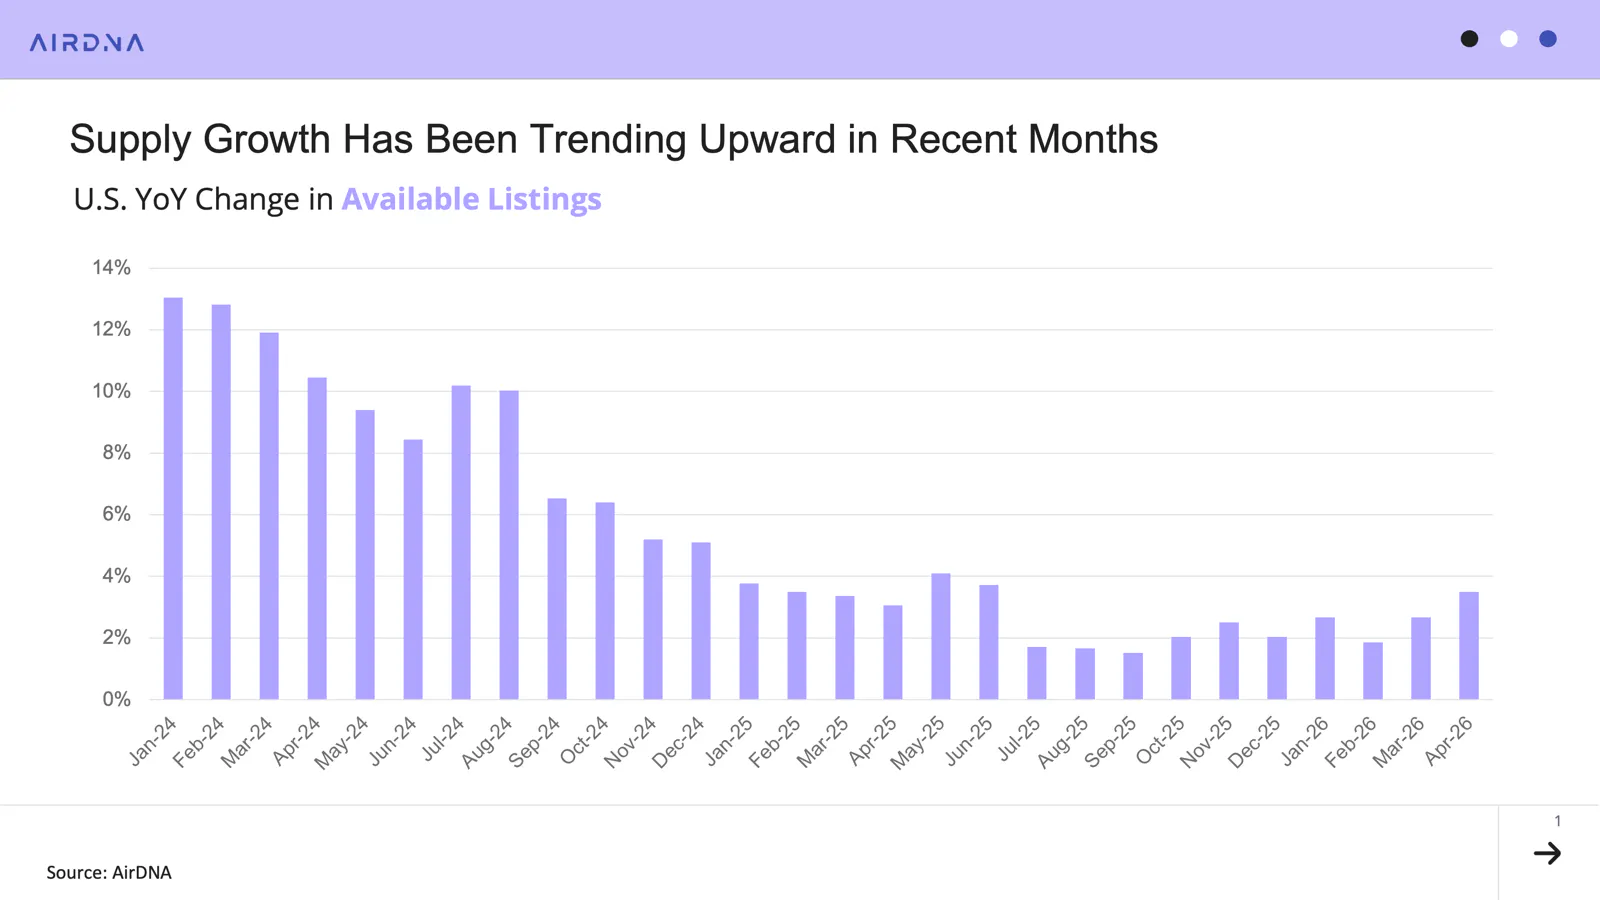
Following several Federal Reserve rate cuts in 2025, mortgage rates fell by nearly a full percentage point through the start of 2026, improving investment prospects and stimulating marginal new supply. Rates climbed again in March as the war in Iran renewed inflation concerns. However, given the lag between acquiring and launching a short-term rental, recent supply gains likely reflect investors who entered the market earlier in the cycle when mortgage rates were lower. Rates have since risen by roughly 40 basis points but remain below levels seen through much of 2025.
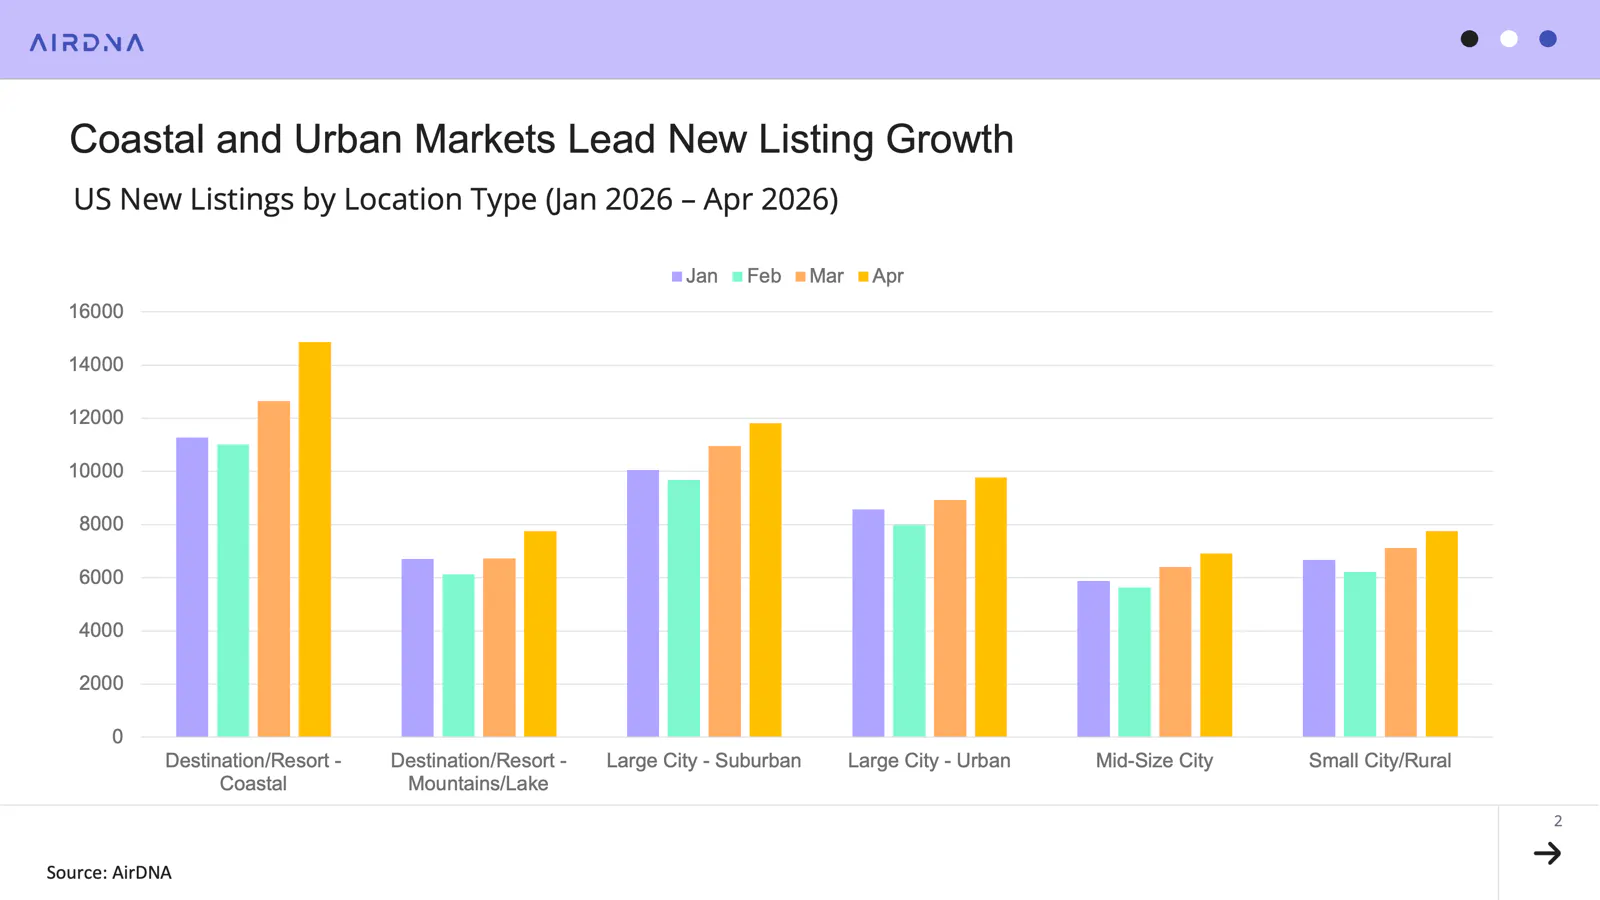
Last year’s easing also appears to be contributing to new listing growth. April marked the strongest month for new listings so far this year. Coastal markets continue to lead recent supply growth, while urban and suburban markets are also gaining momentum as hosts enter ahead of expected summer World Cup demand.
Demand Picks Up Across Smaller Markets
Demand growth in the U.S. has slowed significantly since last fall, though the past two months have shown signs of reacceleration. March recorded 1.6% YoY demand growth, followed by 2.4% YoY growth in April, the strongest reading since last summer.
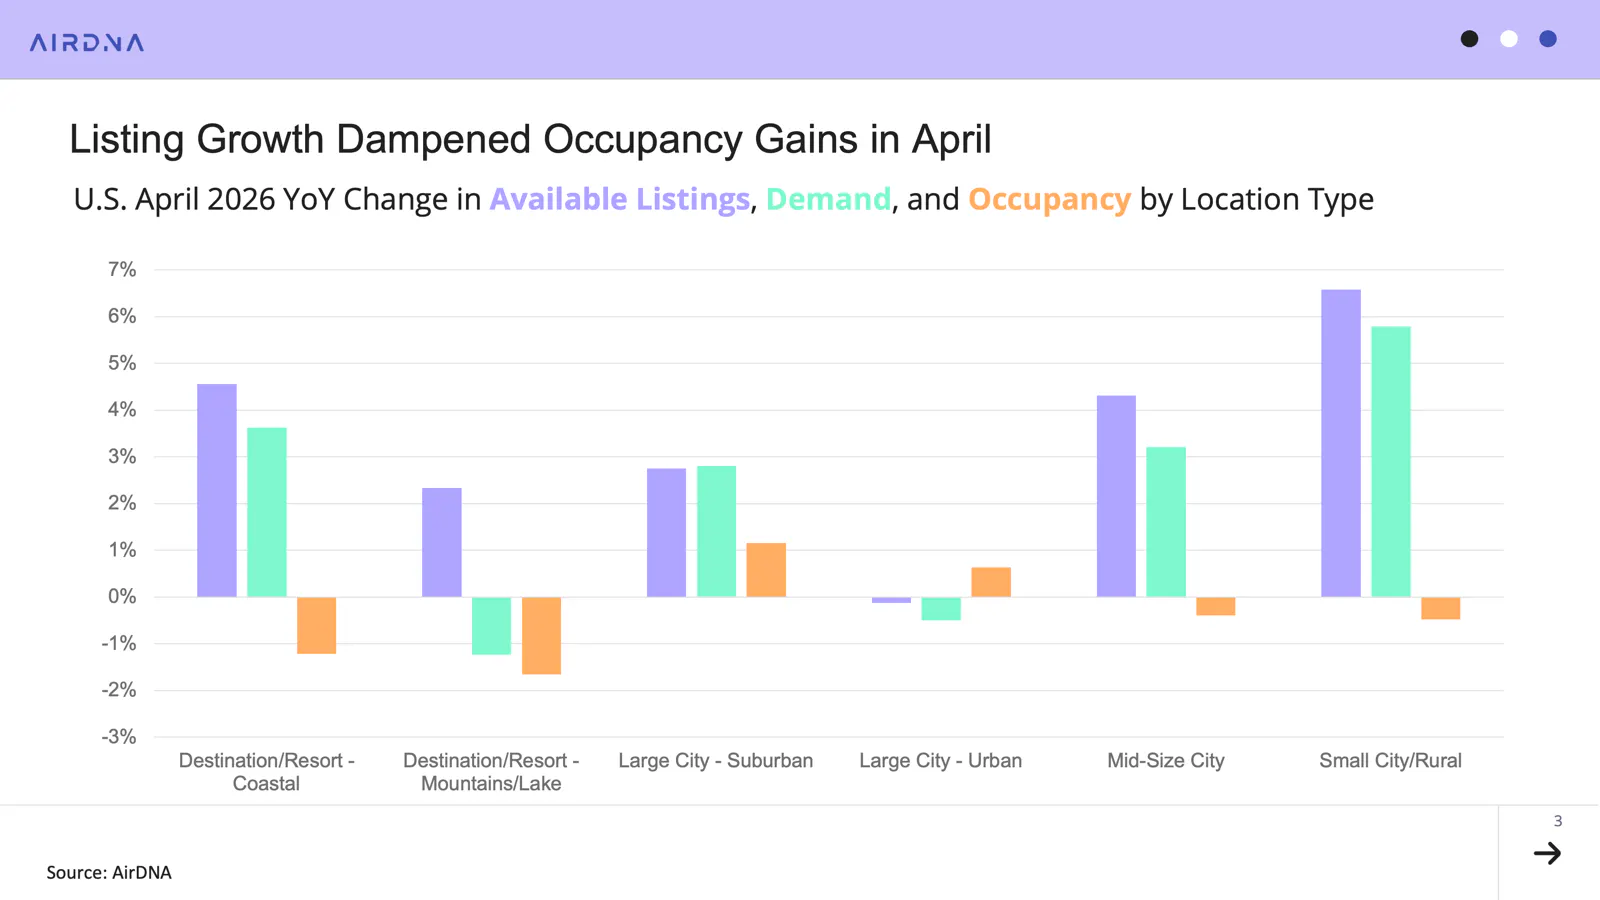
Small city and rural markets posted the strongest gains in April, with demand nights up 5.8% YoY. Coastal markets followed at +3.6%, supported by spring break travel. Mountain markets lagged behind, with demand falling 1.2% YoY as many U.S. ski resorts closed early due to below-average snowfall.
Stronger supply growth, however, limited what would otherwise have been a more meaningful lift in occupancy. Small and mid-sized markets each recorded slight occupancy declines as listing growth outpaced demand gains. Coastal and mountain markets posted the steepest occupancy declines, where supply expanded well ahead of demand. Urban and suburban markets were the exception, with demand growth narrowly outpacing supply growth and lifting occupancy by 0.6% and 1.2% YoY, respectively.
ADR & RRI Growth
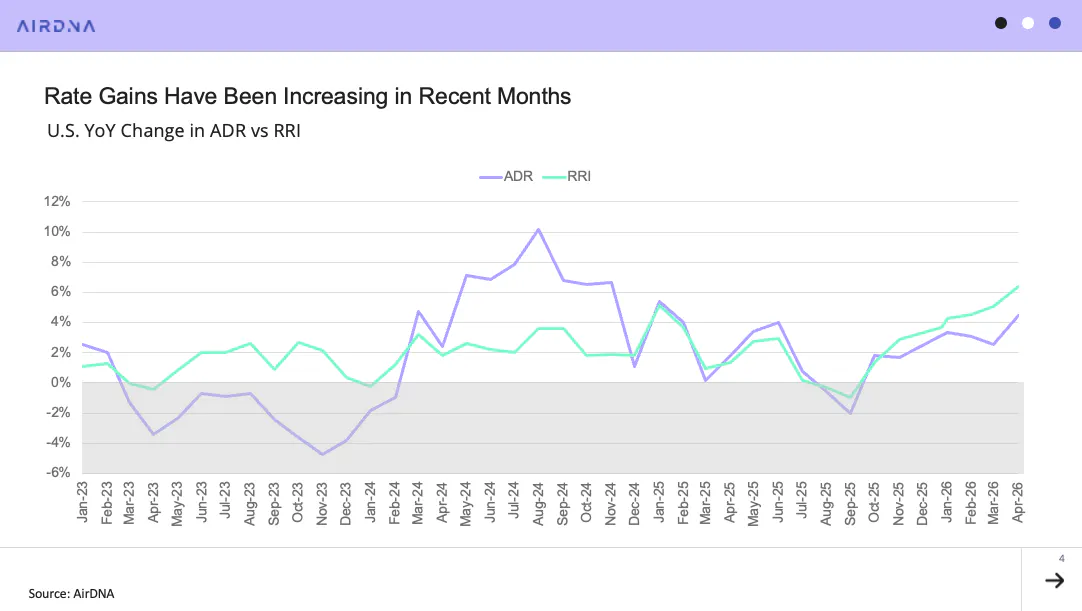
While occupancy gains have been hard to come by, rate growth has been the bright spot for operators. ADRs climbed 4.5% YoY in April, the strongest gain since January 2025.
Rate growth among established properties was even stronger. AirDNA’s Repeat Rent Index (RRI), which isolates the performance of existing properties by removing the effect of new listings, rose 6.4% YoY, nearly two percentage points above headline ADR growth. The gap suggests that newer, lower-priced listings are pulling down overall averages even as established operators continue to push rates higher.
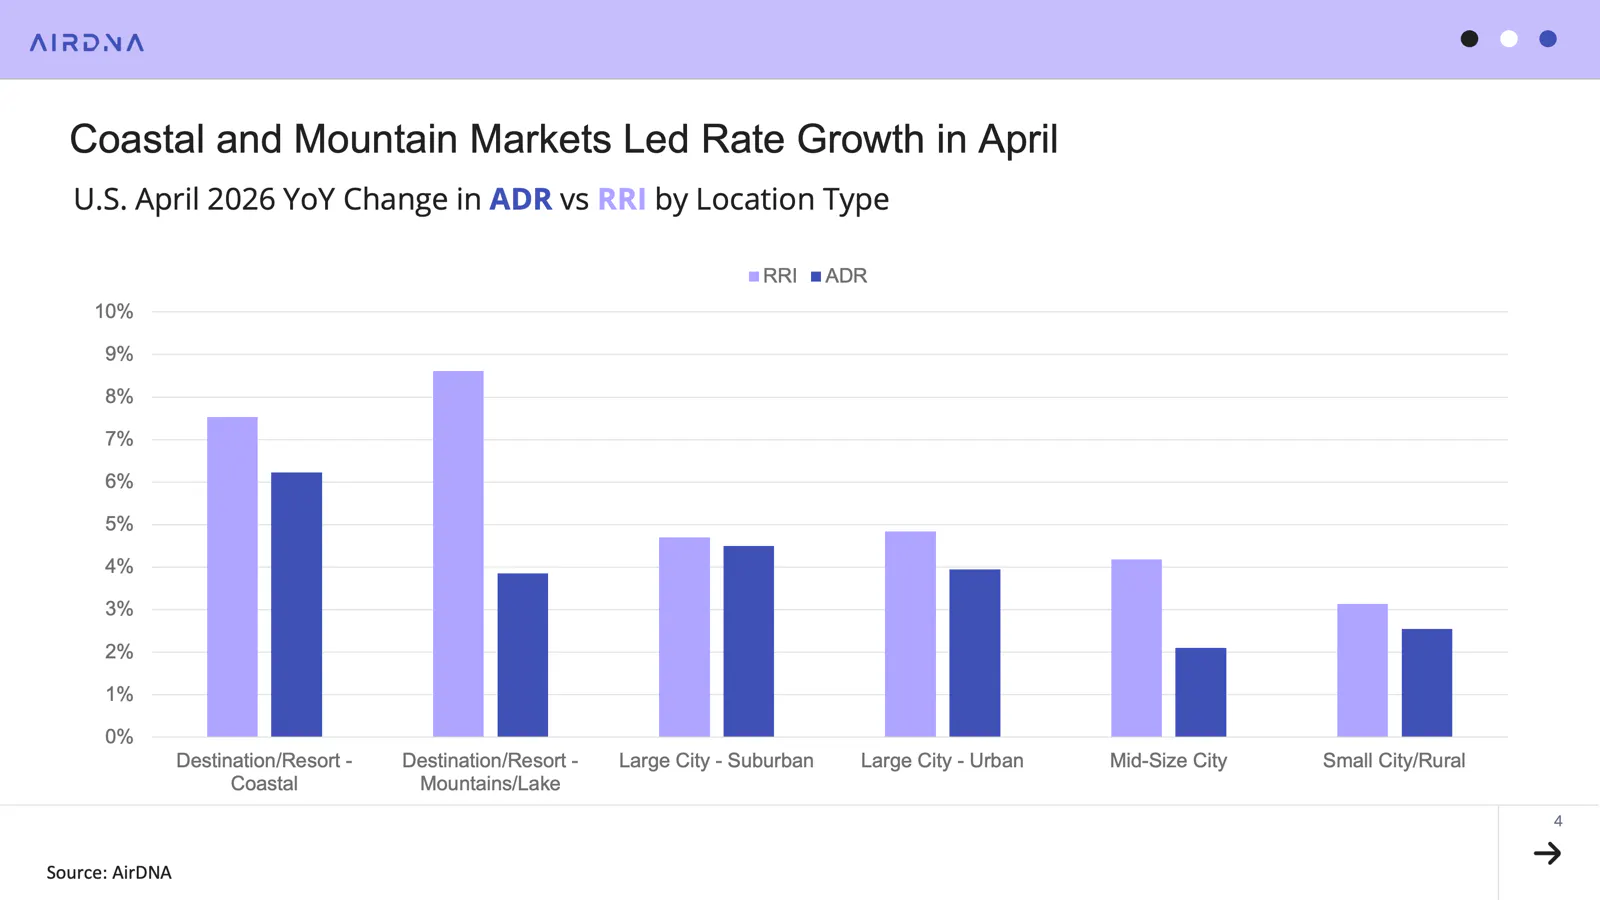
By location type, RRI growth was strongest in Coastal and Mountain markets (7–8% YoY), while Urban and Suburban markets posted more modest 4–5% gains. RRI outpaced ADR across every location type, with the widest gap appearing in mountain markets, where weak demand and expanding supply likely forced newer hosts to underprice.
Looking Ahead: Memorial Day and the World Cup Effect
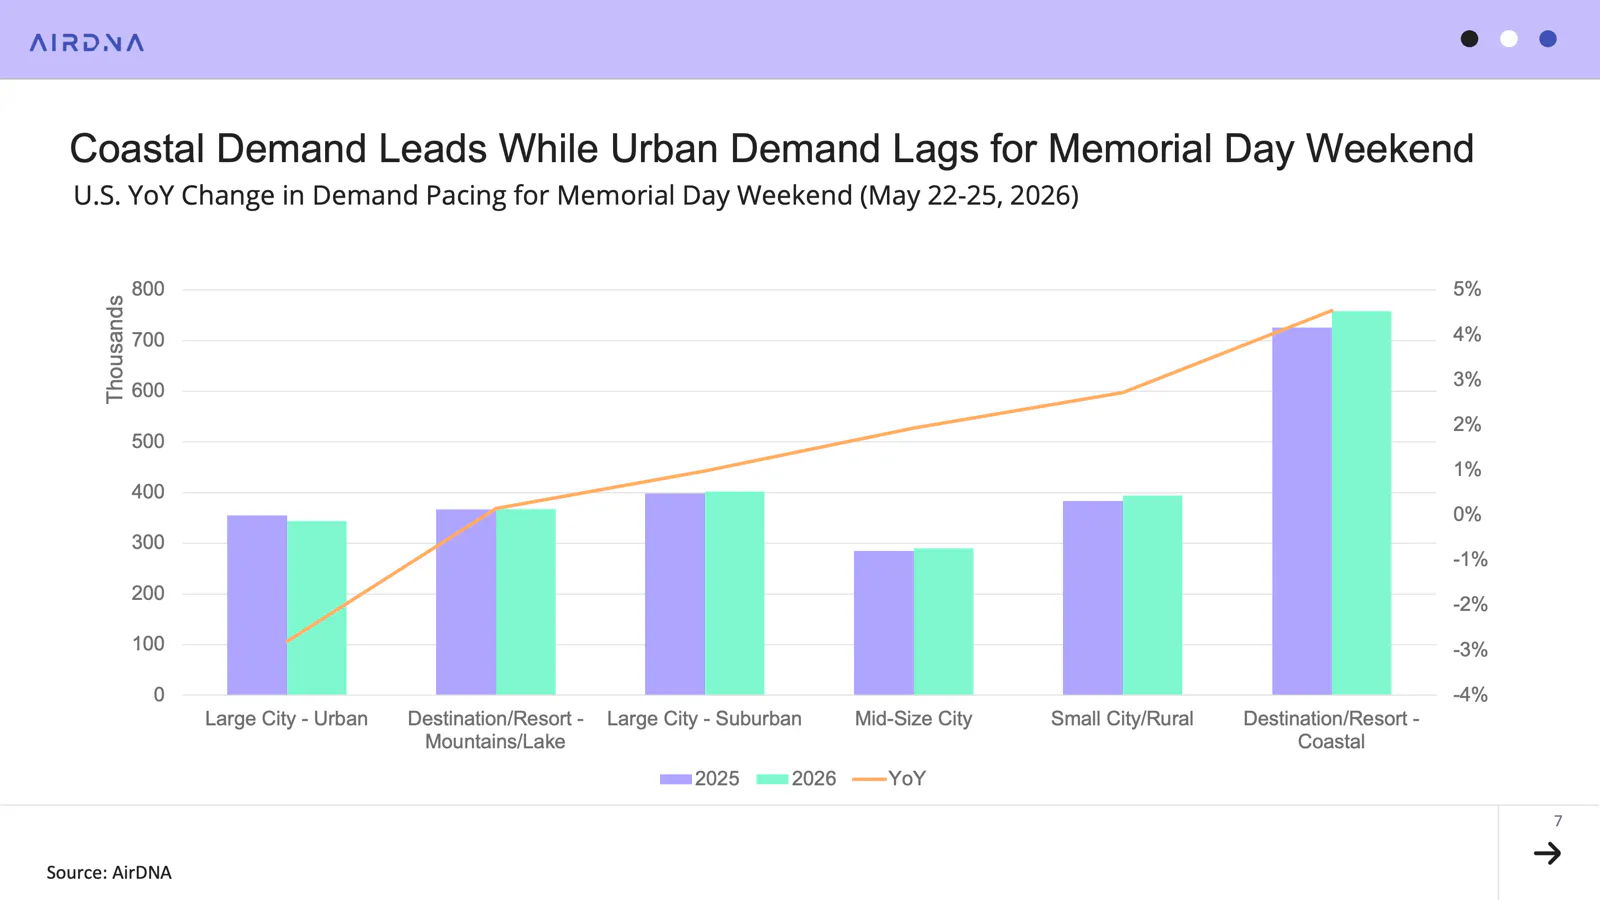
As attention turns toward summer, Memorial Day weekend is opening the season on a modest but positive note. Bookings for Friday, May 22 through Monday, May 25 are up 2% YoY nationally. Coastal destinations are leading growth, with demand up 5% YoY, while urban destinations are seeing a 3% decline, a pattern that appears closely tied to the upcoming World Cup.
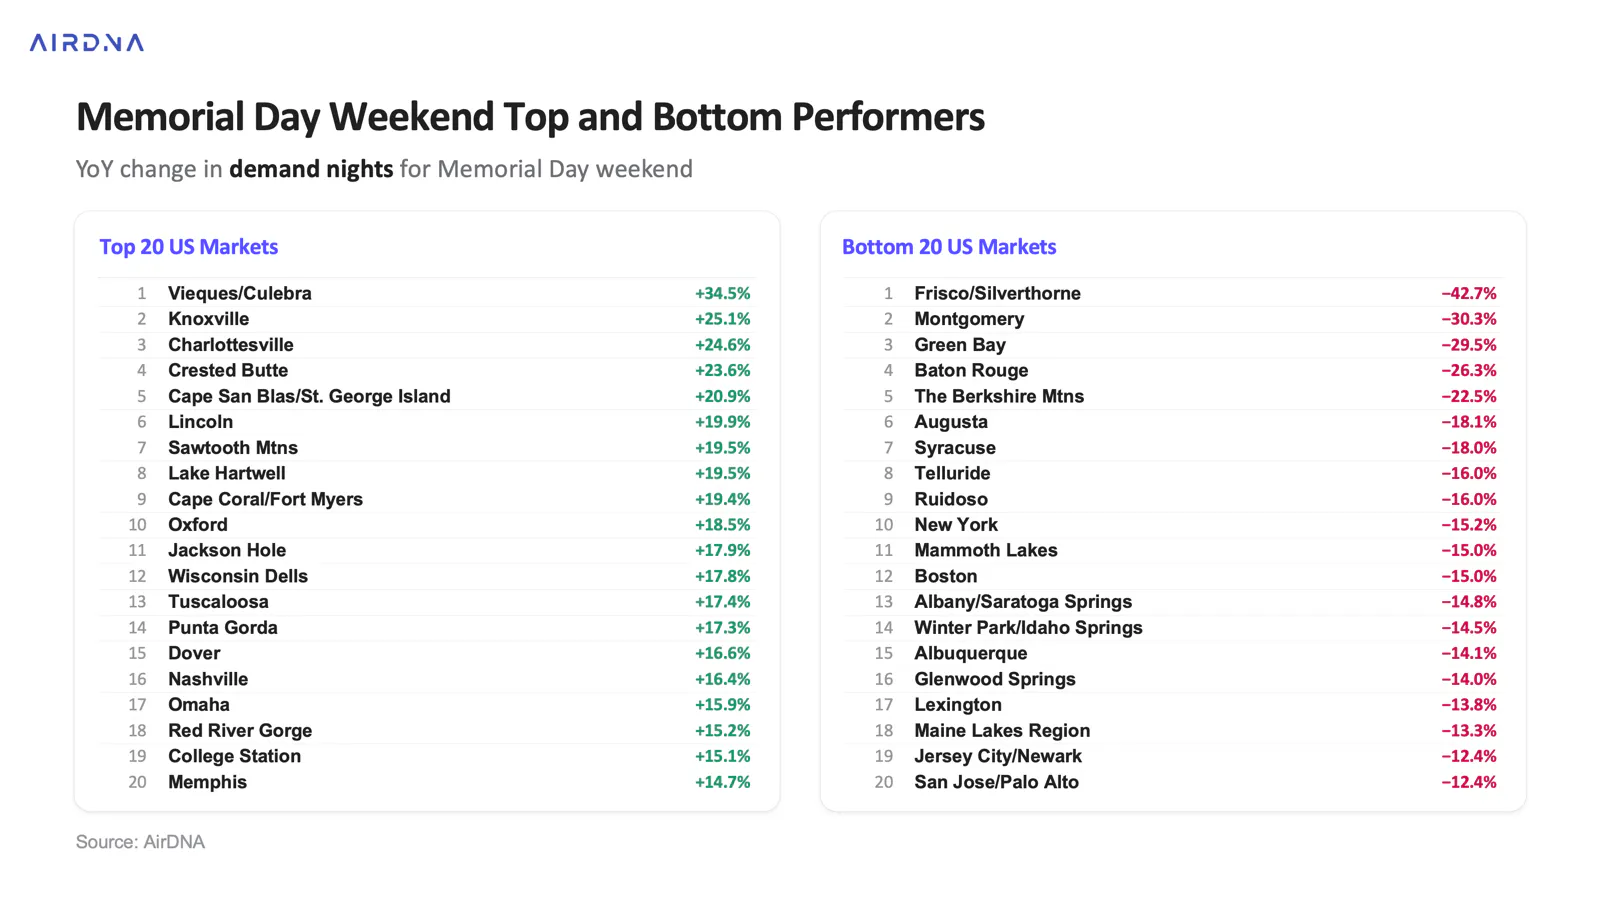
World Cup host cities such as Boston, New York, and San Jose are among the weakest-performing urban markets for Memorial Day demand, suggesting that some travelers are delaying city trips until later in the summer to coincide with matches. Meanwhile, beach, mountain, and lake destinations such as Vieques, Puerto Rico; Knoxville, Tennessee; and Crested Butte, Colorado are seeing Memorial Day demand nights rise more than 20% YoY.
After Memorial Day, summer travel demand is expected to accelerate further as the U.S. hosts the FIFA World Cup from June 11 through July 19. June demand in host cities is currently pacing 15% above last year, while markets outside host cities are pacing 9% higher. The trend continues into July, with host city demand pacing up 18% YoY and non-host markets up 15% YoY.
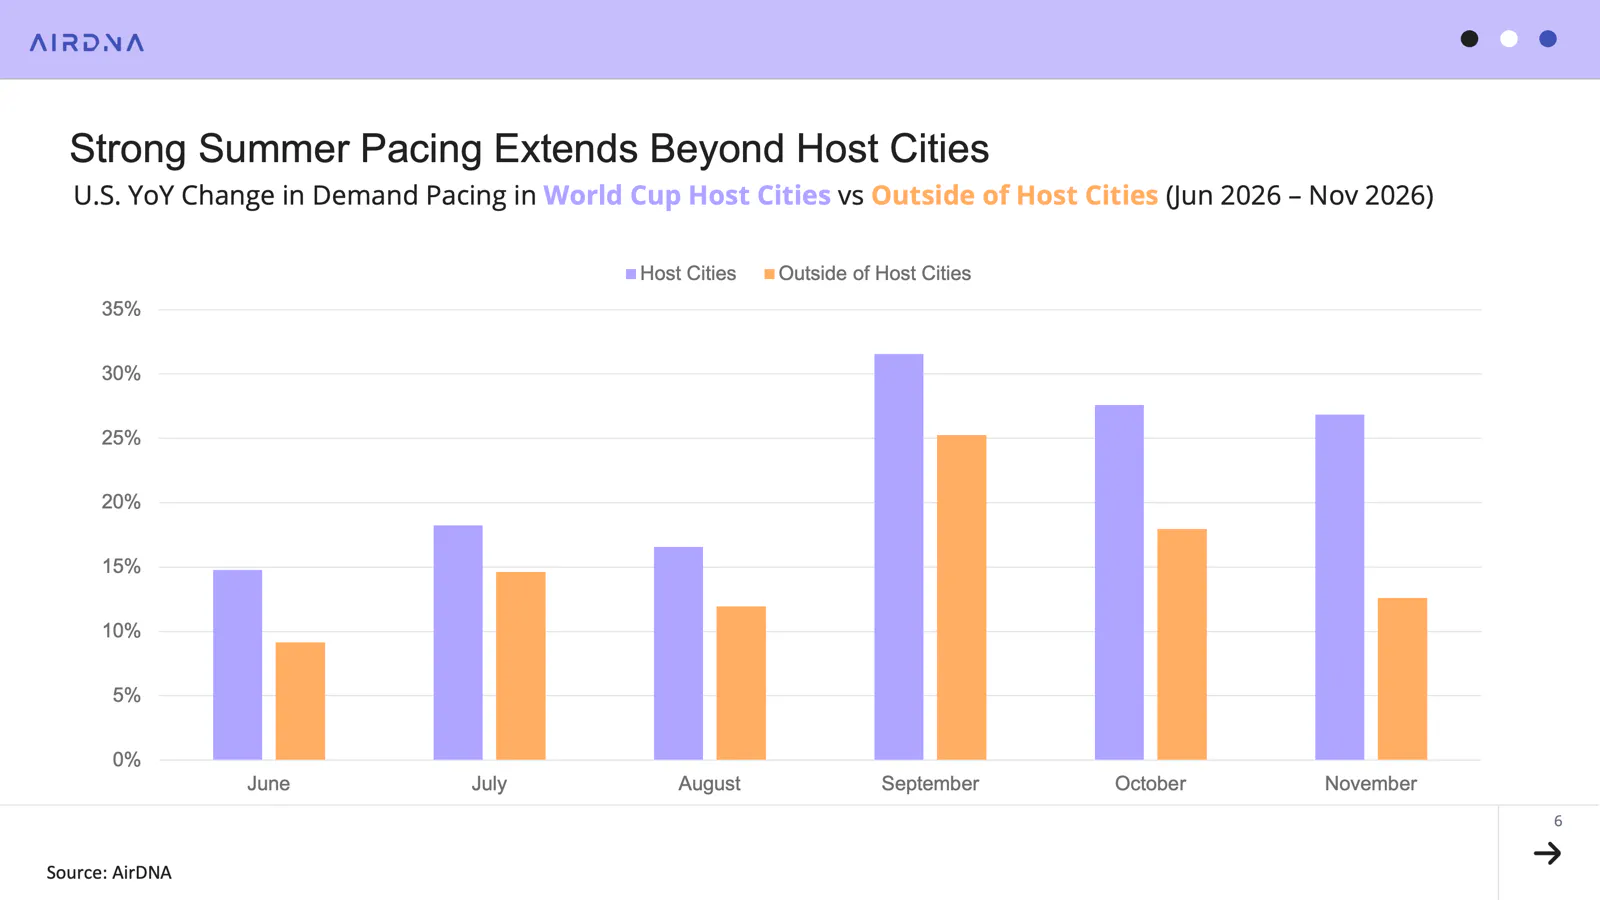
A key takeaway from the pacing data is that World Cup demand is not concentrating solely within host cities but spilling into surrounding regions. Markets such as Providence, Rhode Island; Columbia, Missouri; and Broken Bow Lake, Oklahoma are all seeing significant June demand spikes tied to nearby matches, as travelers look for more affordable alternatives outside major host markets. With lodging, dining, flights, and transportation costs rising sharply in host cities, spillover markets may see meaningful demand gains throughout the tournament period.
Research Airbnb Markets
Gain insights into the revenue and occupancy trends in your market.
ARTICLE SUMMARY
In April 2026, the U.S. STR market saw supply growth accelerate to its fastest pace since last summer, limiting occupancy gains even as demand growth improved. ADR and RRI remained strong, while World Cup-related travel is already driving demand growth across both host cities and surrounding regional markets.
Bram Gallagher
AirDNA Director of Economics and Forecasting
Bram Gallagher is an Economist at AirDNA, specializing in uncovering insights that drive smarter short-term rental decisions. He put his Ph.D. in Economics from the University of Georgia to work researching and forecasting hotel data with CBRE prior to joining AirDNA, as well as teaching economics at a number of universities. In his spare time, Bram enjoys making wooden furniture with hand tools.
