U.S. 2026 Short-Term Rental Outlook Report

2026 is shaping up to be the most compelling year to invest in short-term rentals (STRs) since 2021.
After several years of market recalibration, the U.S. STR industry is entering a new phase that is marked by improving returns, stabilizing mortgage rates, and demand recovery that accelerates into 2027. While economic and policy uncertainty created headwinds in 2025, the outlook for the next 24 months shows a rare convergence of factors that favor investors: cooling inflation, steady ADR growth, and softening home prices in key markets.
This report outlines why now is the time to act before rising occupancy, investor interest, and competition begin to reshape the opportunity landscape. Whether you're looking to expand your portfolio or re-enter the market with confidence, this outlook gives you the insights you need to invest strategically and ahead of the curve. We start with a summary of the key takeaways before moving into a detailed analysis.
Key Takeaways
Sustained growth, softened momentum: After a strong rebound in 2024, demand growth continued into early 2025. Momentum softened considerably over the summer travel months as economic worries rose to the top of consumer minds. Stronger holiday performance and demand growth from the first half the year will bring average occupancy in 2025 to slightly higher than in 2024.
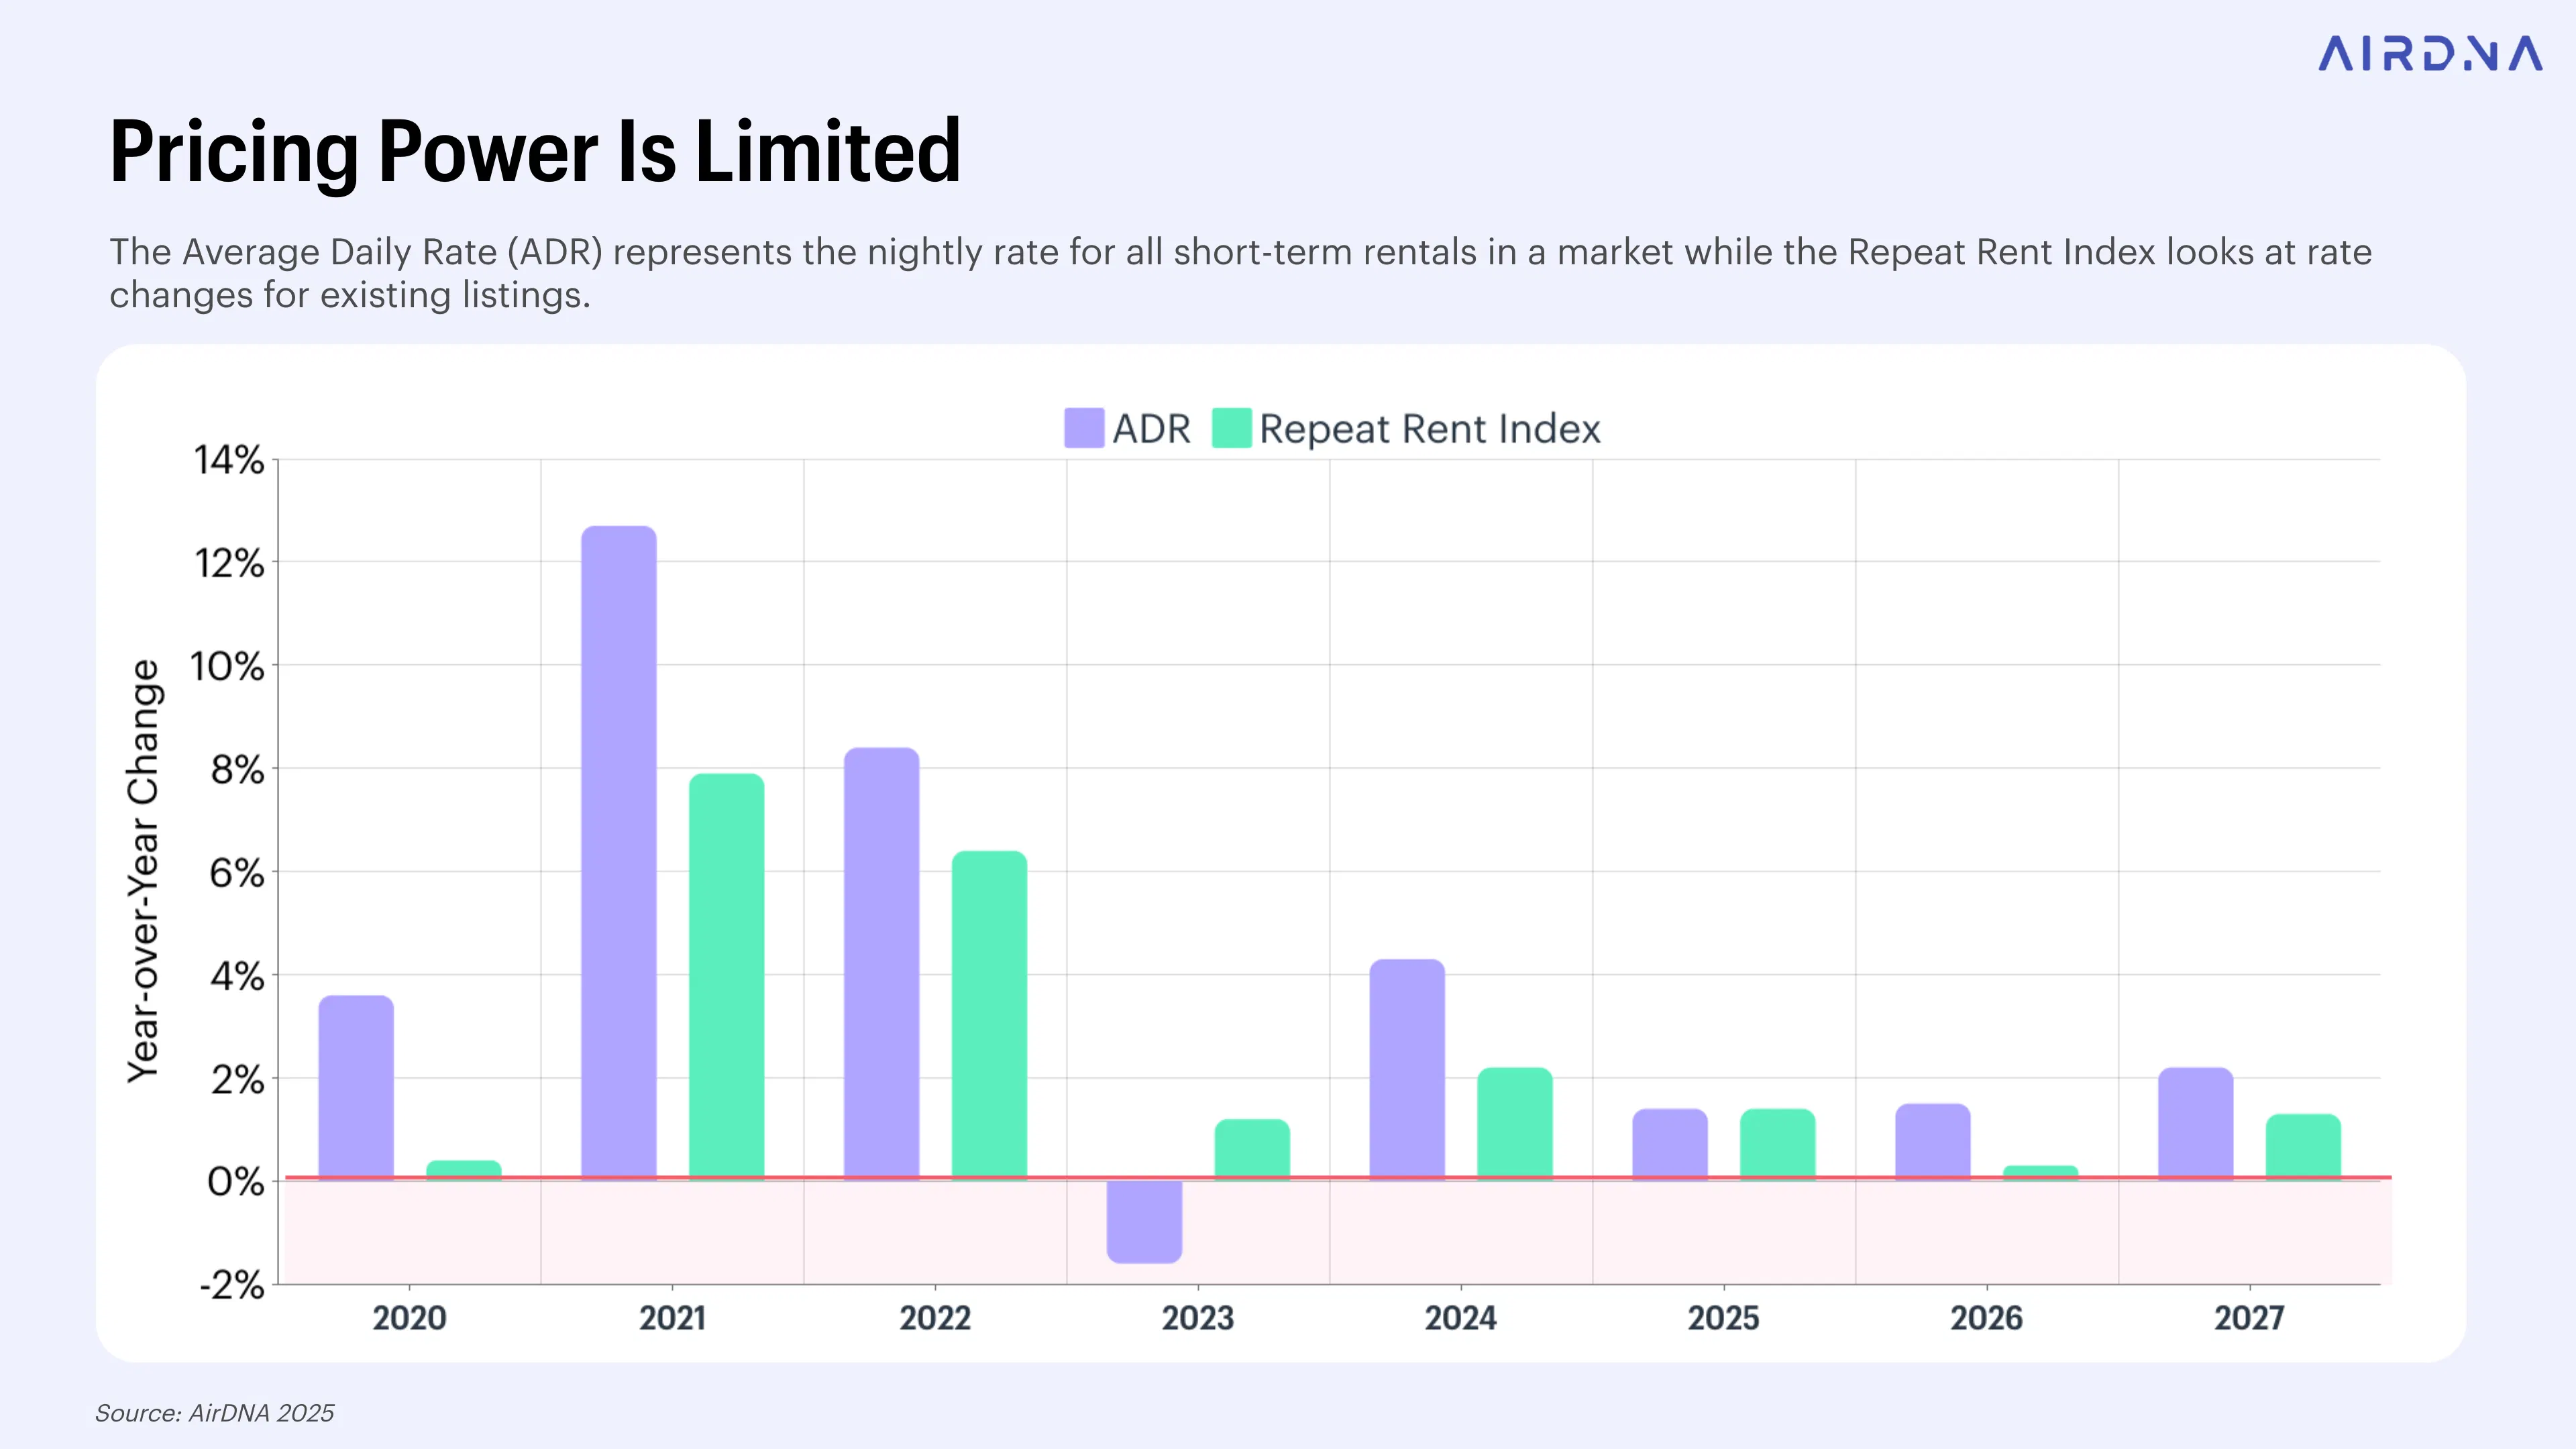
ADR rebounds after Q3 with less volatility: Average daily rates (ADR) have seen continued growth since stagnating in 2023. Although ADR declined slightly in Q3 of 2025, better holiday performance will restart growth. The gap between ADR and the AirDNA Repeat Rent Index (RRI) narrowed as the impact of new listings on host pricing power diminished.
Housing market begins to loosen: Growing inventories and longer time to sell is motivating sellers to start cutting prices. Mortgage rates will fall through the second half of 2025, although they should stabilize afterwards.
Supply is set to reaccelerate: Falling interest rates are expected to revive short-term rental (STR) supply growth in late 2025 and into 2026, especially in Coastal and Mountain/Lake resort markets. However, the transmission of lower rates to mortgage markets and STR listings comes with a lag. Listing growth rates are converging across market types as the market matures.
Demand decelerates in 2026 and recovers in 2027: Nationally and across market types, demand growth will slow in 2026 compared to 2025, with the exception of Mountain/Lake and Large City Suburban markets. As economic conditions improve through late 2026 and into 2027, demand growth will completely recover to its 2025 level.
Occupancy dips then lifts in 2027: Occupancy is projected to decline slightly through 2026 on slightly weaker demand and quicker supply growth. In 2027, occupancy begins moving up again, supported by healthy job and income growth, improving affordability, and relatively balanced supply and demand dynamics.
Moderate inflation risks ahead: Recent tariffs and geopolitical instability are expected to create a one-time inflation spike in the second half of 2025, with a milder effect on ADR growth than in previous inflation cycles. ADR growth will remain slow but positive in 2026 and will accelerate in 2027.
The World Cup will boost in-bound international travel: Domestic leisure markets, especially Coastal and Mountain/Lake destinations, are benefiting from a weaker dollar and continued consumer appetite for leisure travel, but political friction with Canada is driving international travel down. Global attention to the World Cup in 2026 could rejuvenate interest in travel to the U.S.
Rising uncertainty dampened demand in 2025: Trade policy shocks, the longest government shutdown in U.S. history, and a divided Fed have weighed on business and consumer confidence, contributing to softer STR demand in the second half of 2025.
Slowing growth gives way to a stronger 2027 outlook: Oxford Economics forecasts softer economic growth in 2026 and then a rebound in late 2026 and into 2027 as fiscal stimulus supports consumption and interest rate cuts begin to take effect.
Mortgage rates are down but will hold around 6%: Falling interest rates have created the most favorable investment environment since 2022. Even as the Fed cuts short-term rates, mortgage rates are expected to remain around 6%, so there’s little reason to delay entering the market.
How We Forecast STR Market Performance
AirDNA uses a robust econometric model that incorporates a wide range of economic inputs to power short-term rental market forecasts. These include income trends, GDP, employment, the STR premium, housing permits and starts, inflation, calendar effects, and special events. The mathematical model relates these economic variables to STR supply, demand and pricing. The quantitative outputs are then reviewed and refined by our research team to account for harder-to-measure factors, such as regulatory changes or shifts in investor sentiment. The result is our best estimate of STR performance in the coming years.
While actual performance may deviate slightly from the model, we believe this approach offers the most reliable view of the underlying dynamics that will shape the STR market in the years ahead.
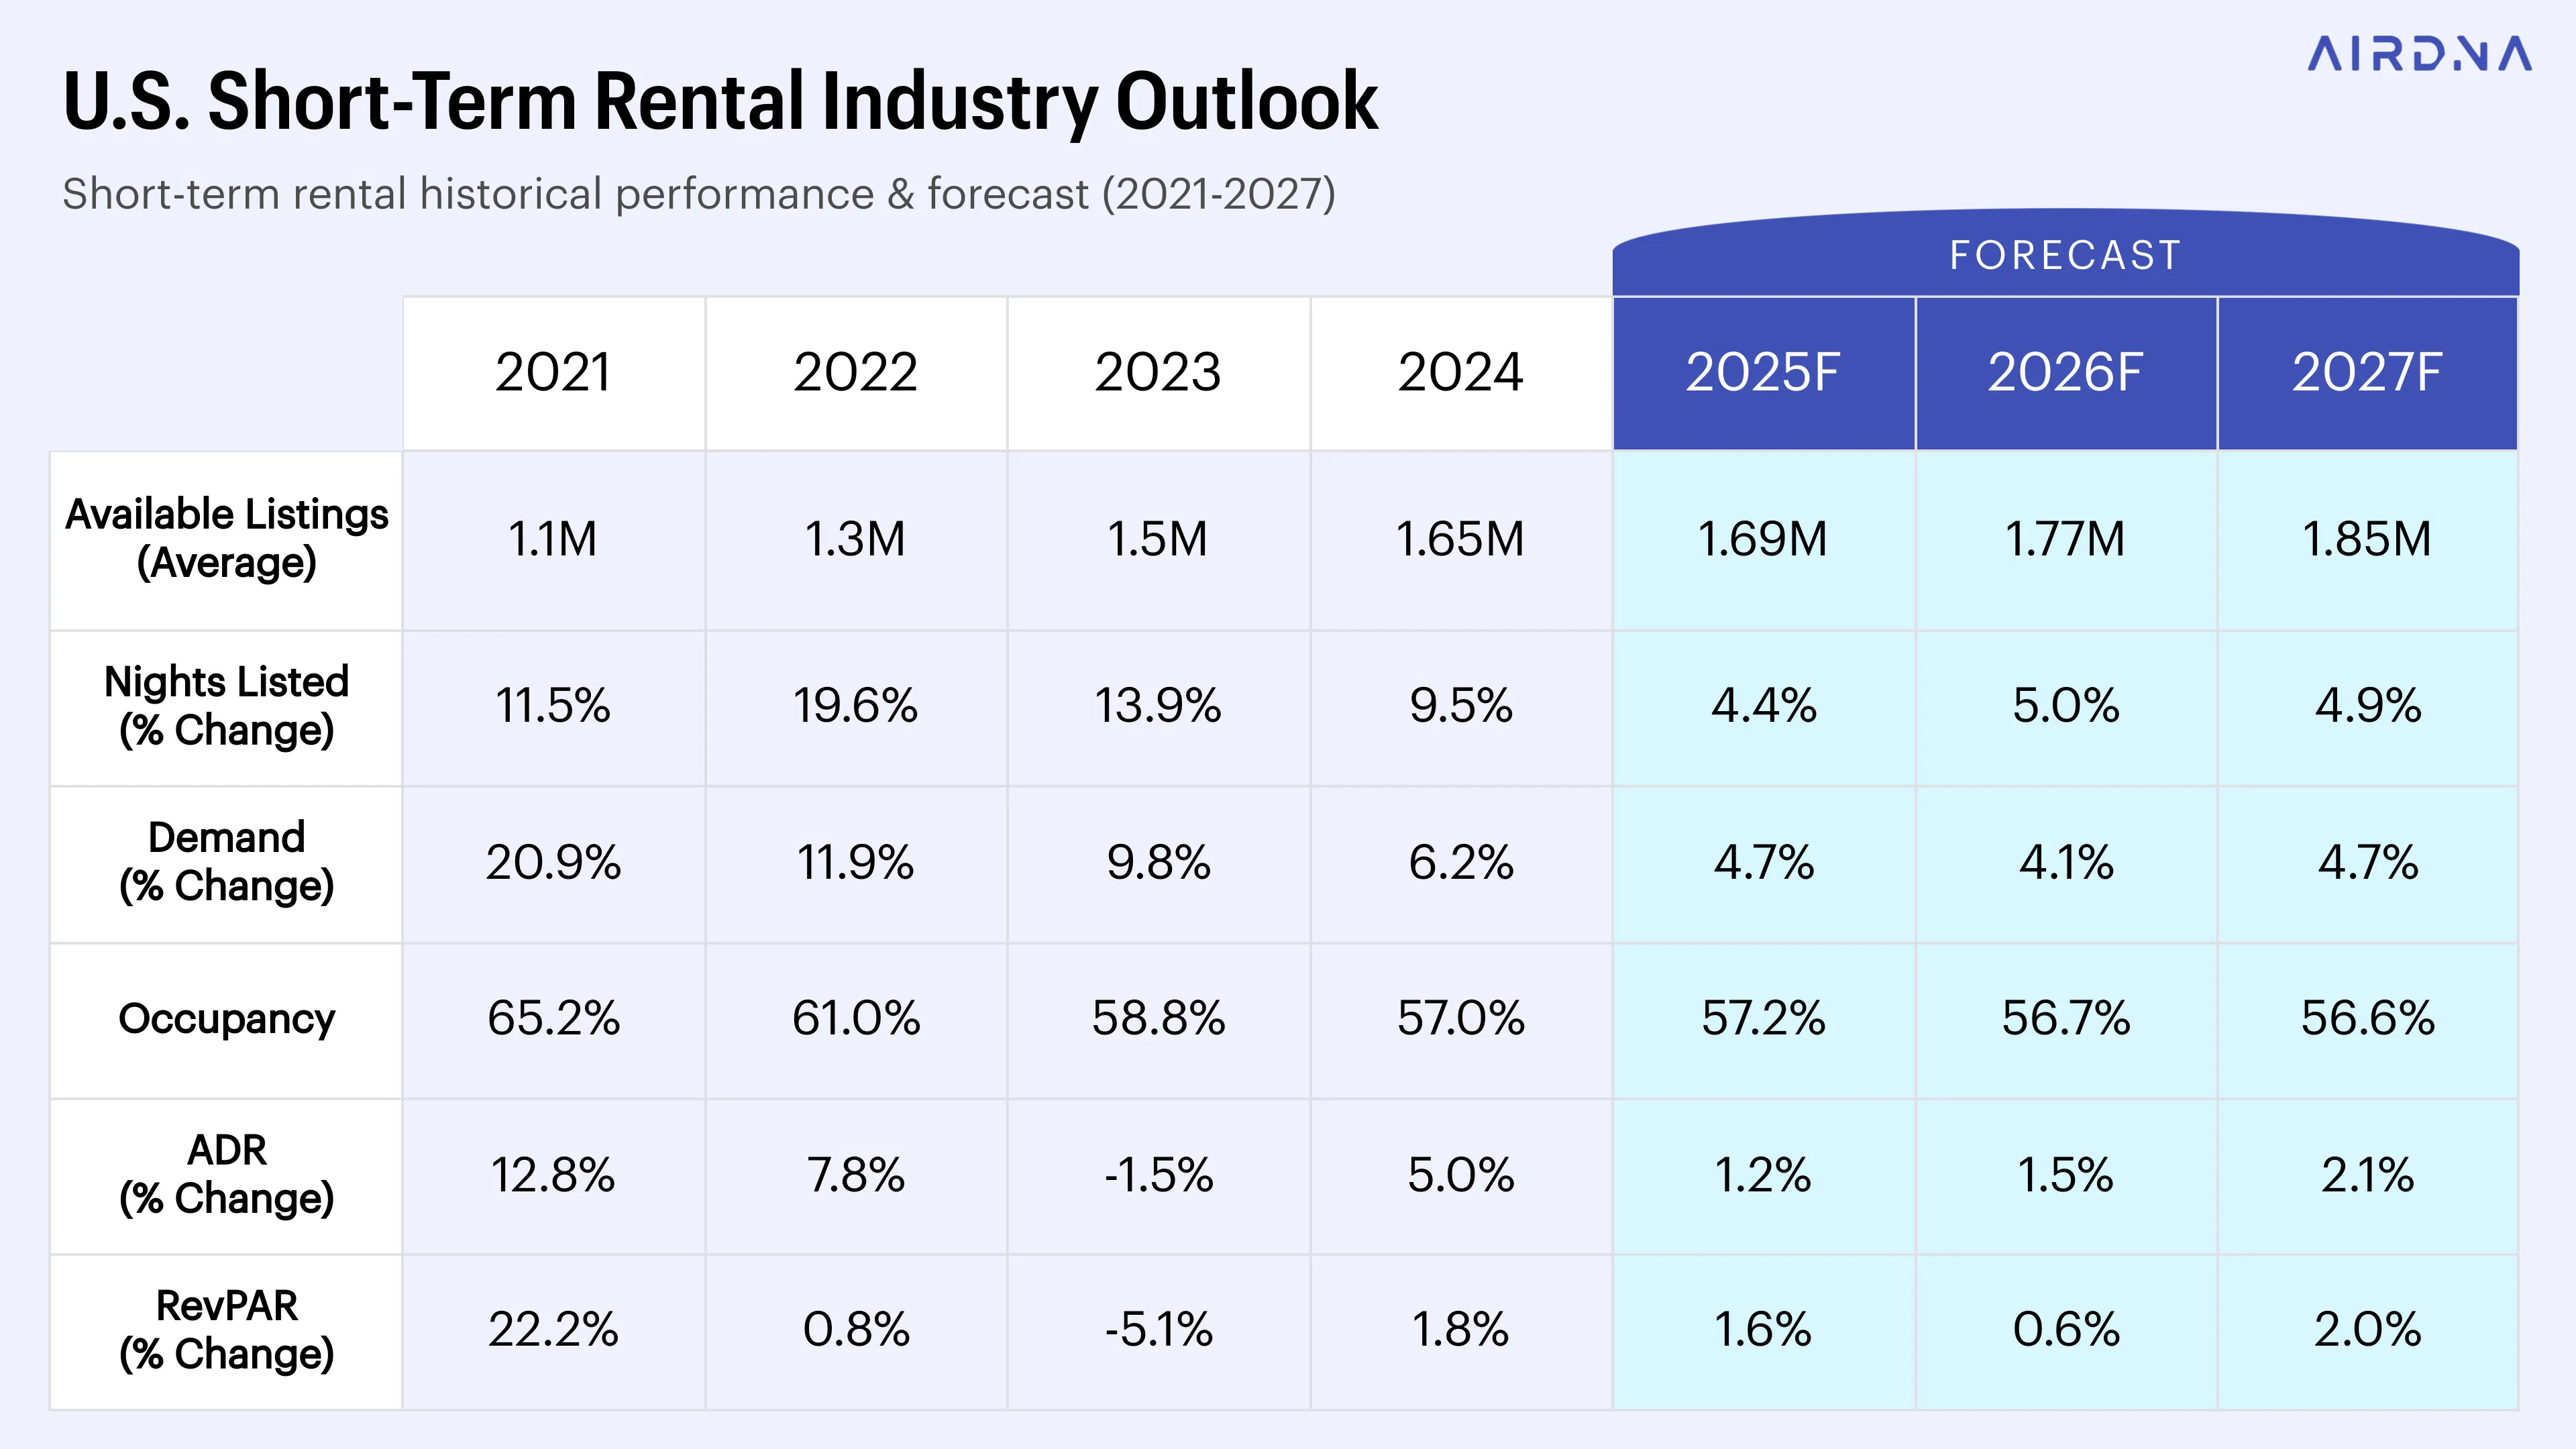
At the close of 2024, AirDNA forecasted a steady rebalancing of the U.S. STR market. Supply growth and guest demand would gradually come into better alignment, a shift that would drive modest improvements in occupancy rates and slight upward movement in average daily rates (ADR). AirDNA’s updated forecasts for 2026 and 2027 are summarized in the table below.

Economic Backdrop & Market Expectations
The year began with a remarkably healthy-looking economy. Unemployment was at a historically low 4.0% and GDP growth for 2024 landed at a solid 2.8%, suggesting a stable environment for consumer spending and travel. However, as the year wore on, economic conditions became increasingly uncertain.
In April, a sweeping tariff announcement from the Trump administration sent shockwaves through the global economy, forcing companies, governments, and households to quickly reassess their plans amid shifting trade policies and higher taxes. Inflation, which had dipped to 2.3% year-over-year in April, began climbing in the aftermath of the announcement.
Throughout most of 2025, the Federal Reserve held off on further interest rate cuts following a huge 50-basis-point reduction in September 2024, followed by smaller 25-basis-point cuts in November and December. Concerned about the risk of resurgent inflation—or even the possibility of stagflation (a combination of rising inflation and unemployment)—the Fed kept its target rate steady for much of the year. It wasn’t until September and October of 2025 that the Fed made two additional 25-basis-point cuts. A final 25-basis point cut was made in December.
Interest rates play a critical role in economic activity by either encouraging or slowing down investment and borrowing. However, the relationship between short- and long-term rates can be complex. When short-term rates are cut too aggressively, inflation expectations can rise. This paradoxically causes long-term rates to increase instead of fall.

The end of the year brought the longest government shutdown in U.S. history. Beyond the immediate economic impact of lost services and furloughed federal workers, the shutdown also suspended the release of key economic data, including the closely watched jobs and inflation reports from the Bureau of Labor Statistics. With critical data missing, the Federal Reserve is increasingly divided between protecting employment or taming inflation. The result is growing uncertainty around the pace and direction of future interest rate cuts, adding another layer of complexity for short-term rental (STR) investors trying to plan ahead.
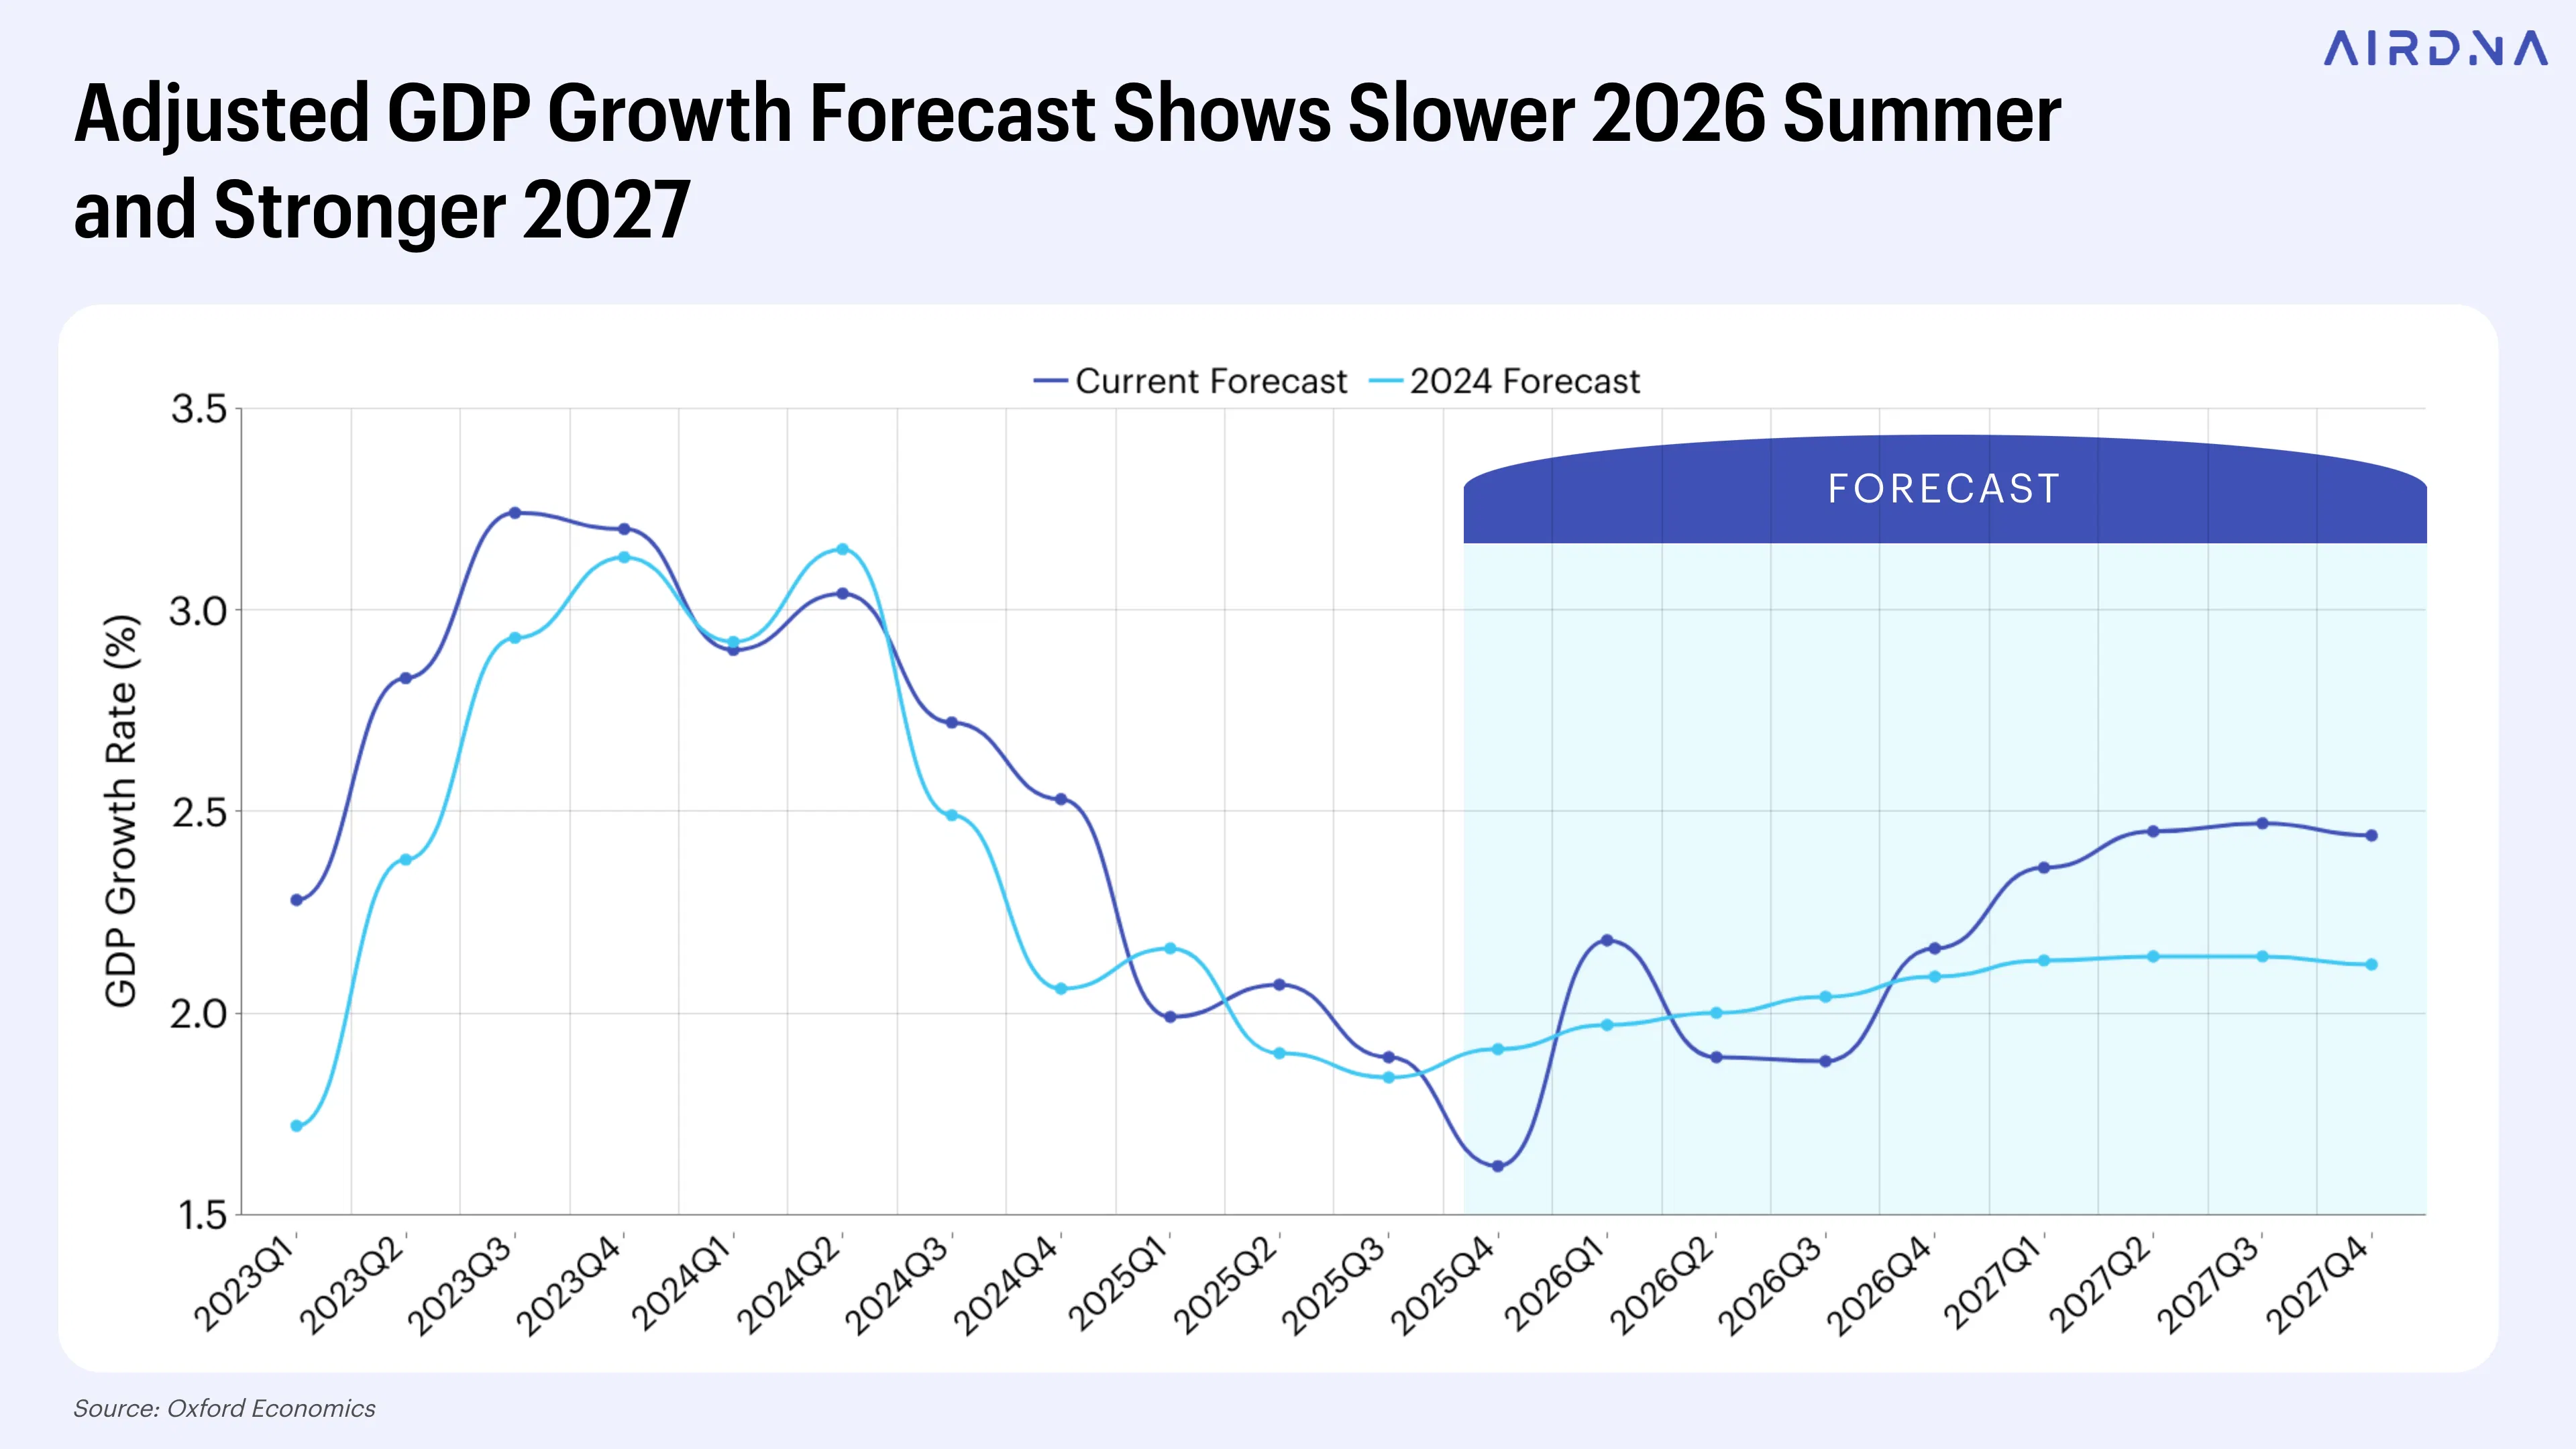
Compared to the forecasts used in last year’s outlook, Oxford Economics has revised its projections to reflect both the recent policy shifts and stronger-than-expected GDP growth in 2023 and 2024. Their outlook for late 2025 and beyond now points to slower growth than previously anticipated.
That said, the economy’s strong start in 2025 could set the stage for a rebound. GDP growth is expected to accelerate again by late 2026, driven by delayed effects of the administration’s tax plan, a gradual cycle of interest rate cuts by the Fed, and the potential easing of trade restrictions. In other words, the current slowdown may be temporary, with brighter conditions on the horizon.
Income and employment slowdowns will delay demand
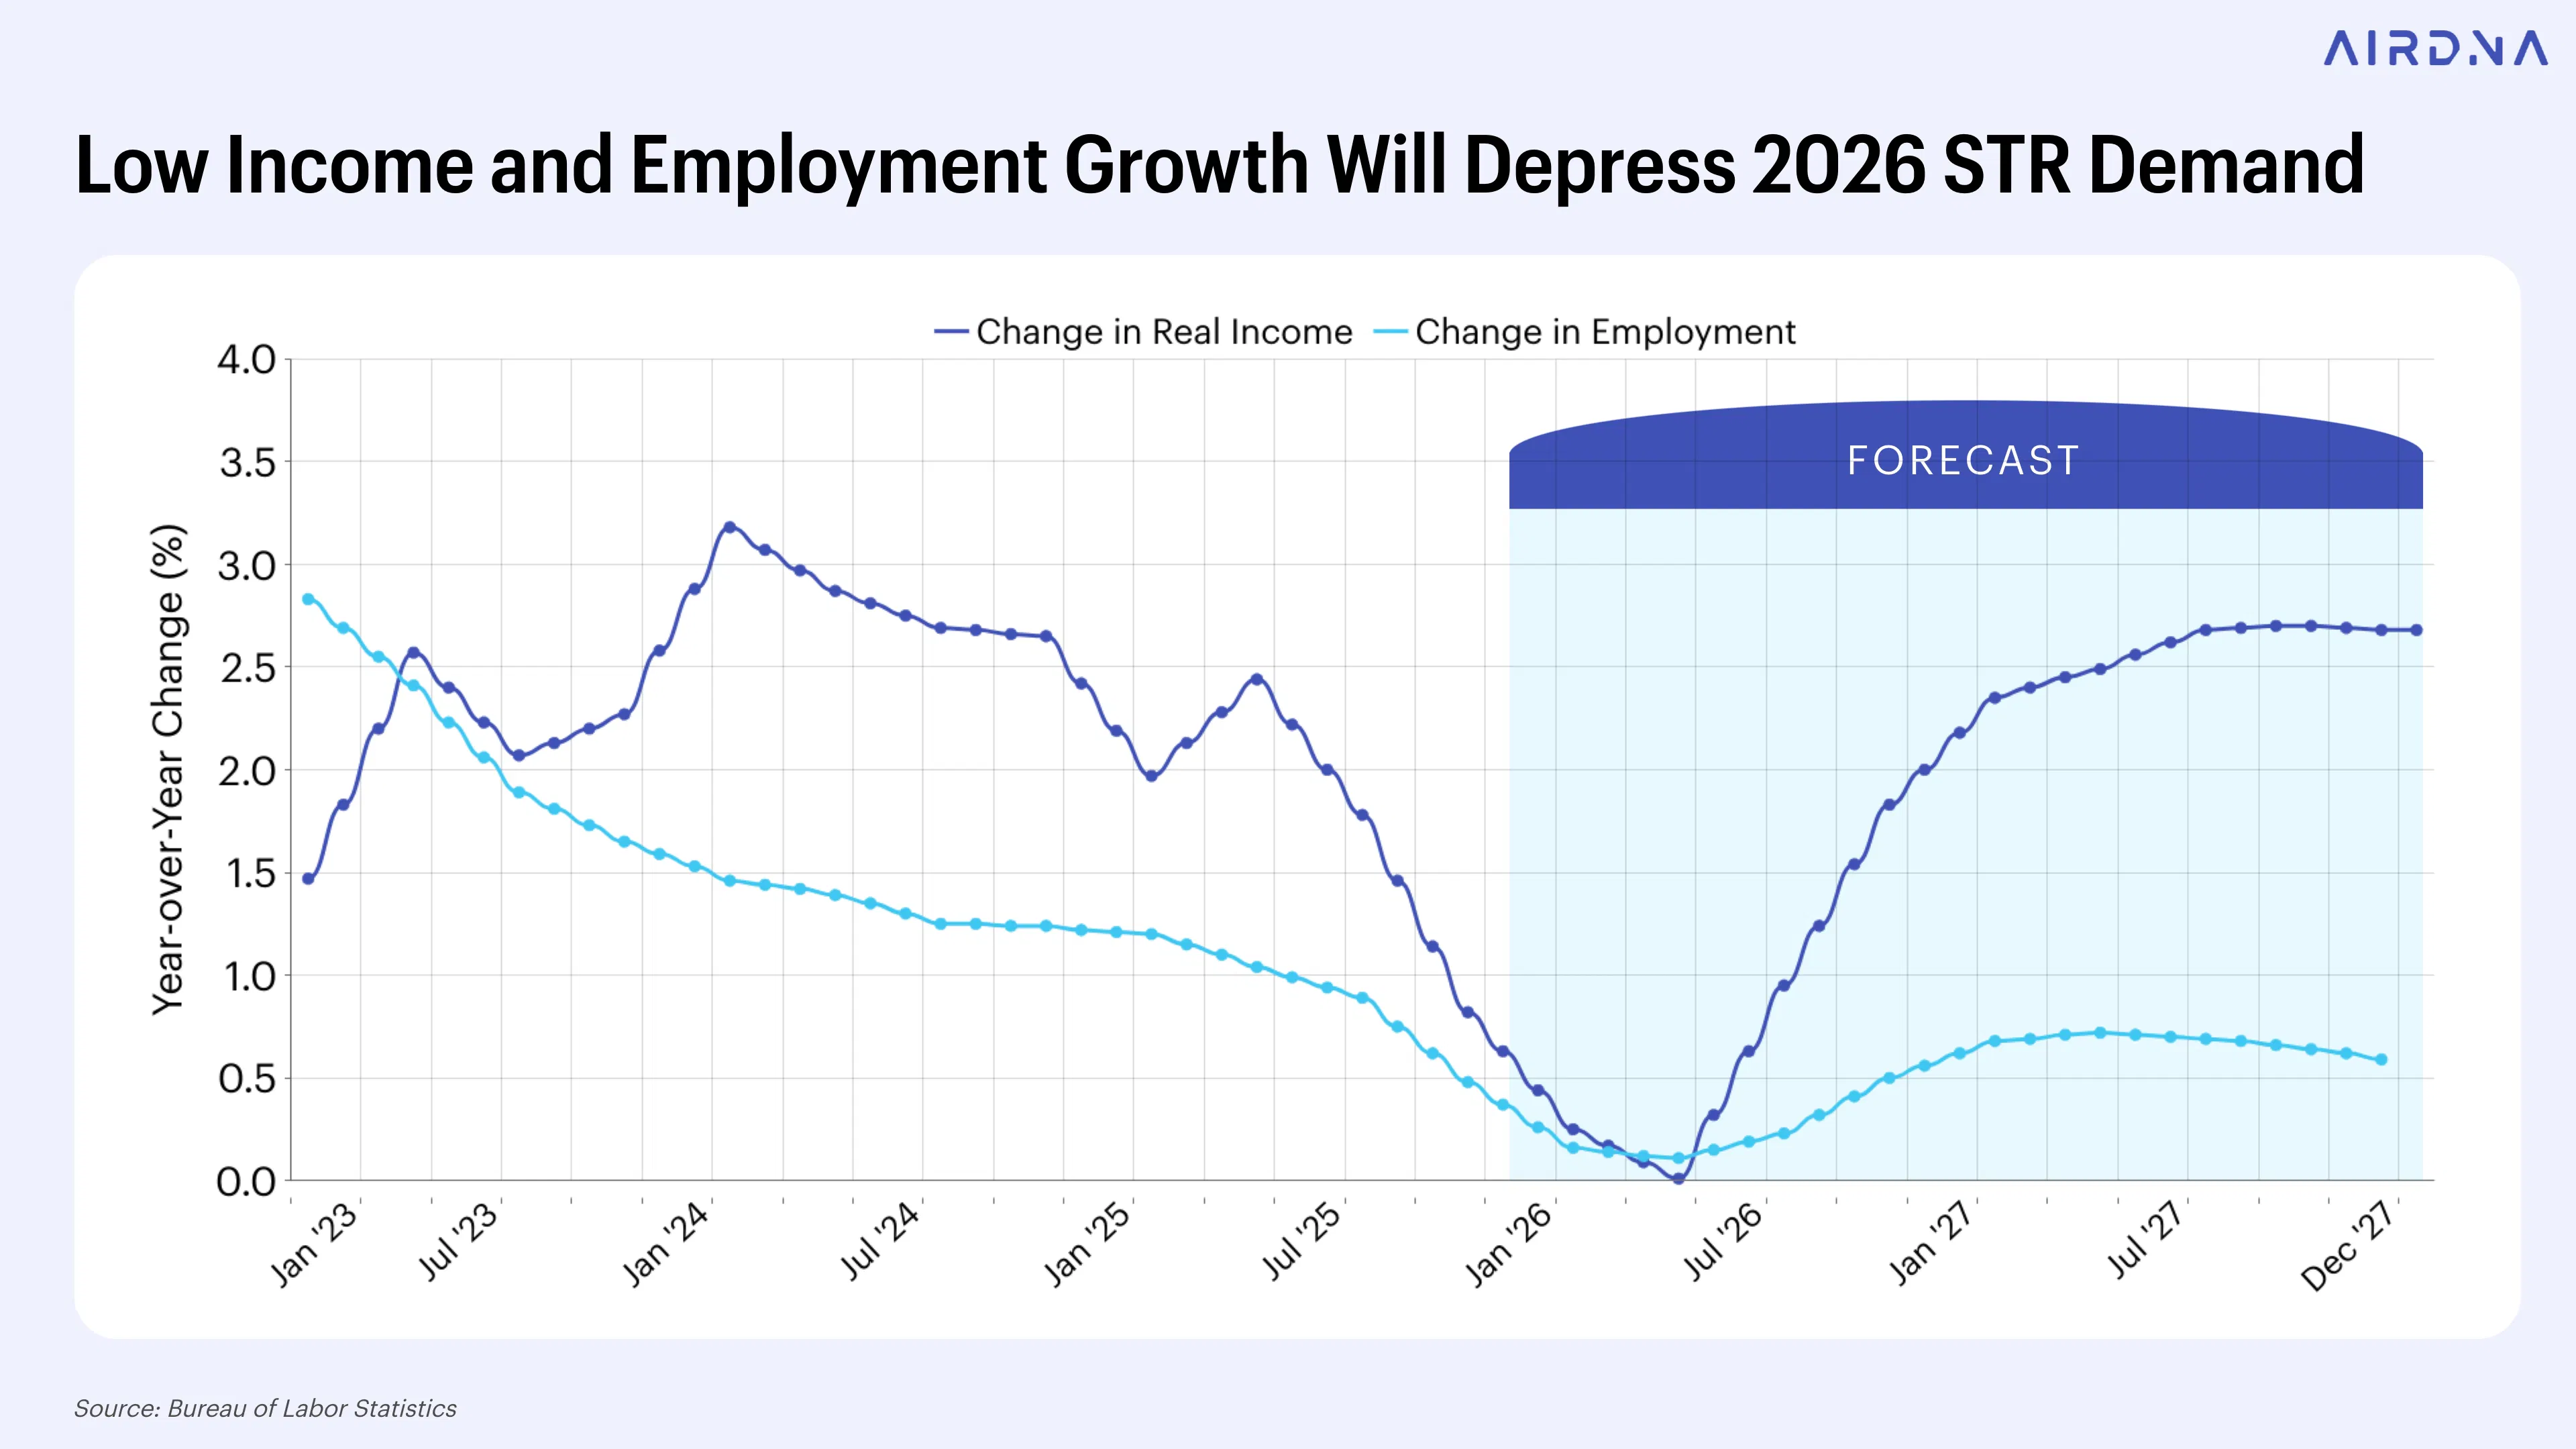
Beyond GDP, two economic indicators that are more directly tied to short-term rental demand—household income and employment—are showing signs of slowing growth. Both are expected to bottom out around the second quarter of 2026.
From there, growth should reaccelerate. Income will recover more quickly than employment because the unemployment rate remains low despite softer job growth, helping maintain overall labor market stability.
Historically, there’s a lag between income trends and STR demand. Leisure travel is often planned in advance and influenced by consumer sentiment. As a result, the effects of this slowdown may continue into early 2026. However, income growth is forecasted to pick up speed in May of next year and will exceed 2025 growth rates by early 2027. STR demand is expected to rebound quickly afterwards.
Housing Affordability: A Special Investigation
A key challenge in the STR market since the Federal Reserve began aggressively raising rates in 2022 is the unaffordability of residential housing.
In the early months of the COVID-19 pandemic, housing prices surged to a nearly unprecedented level. This was fueled by a shift away from other real estate sectors like hotels, retail, and office spaces, many of which were forced to suspend operations. At the same time, the Fed’s stimulatory cuts to short-term interest rates drove already-low mortgage rates even lower, keeping marked-up properties affordable for buyers—at least temporarily.
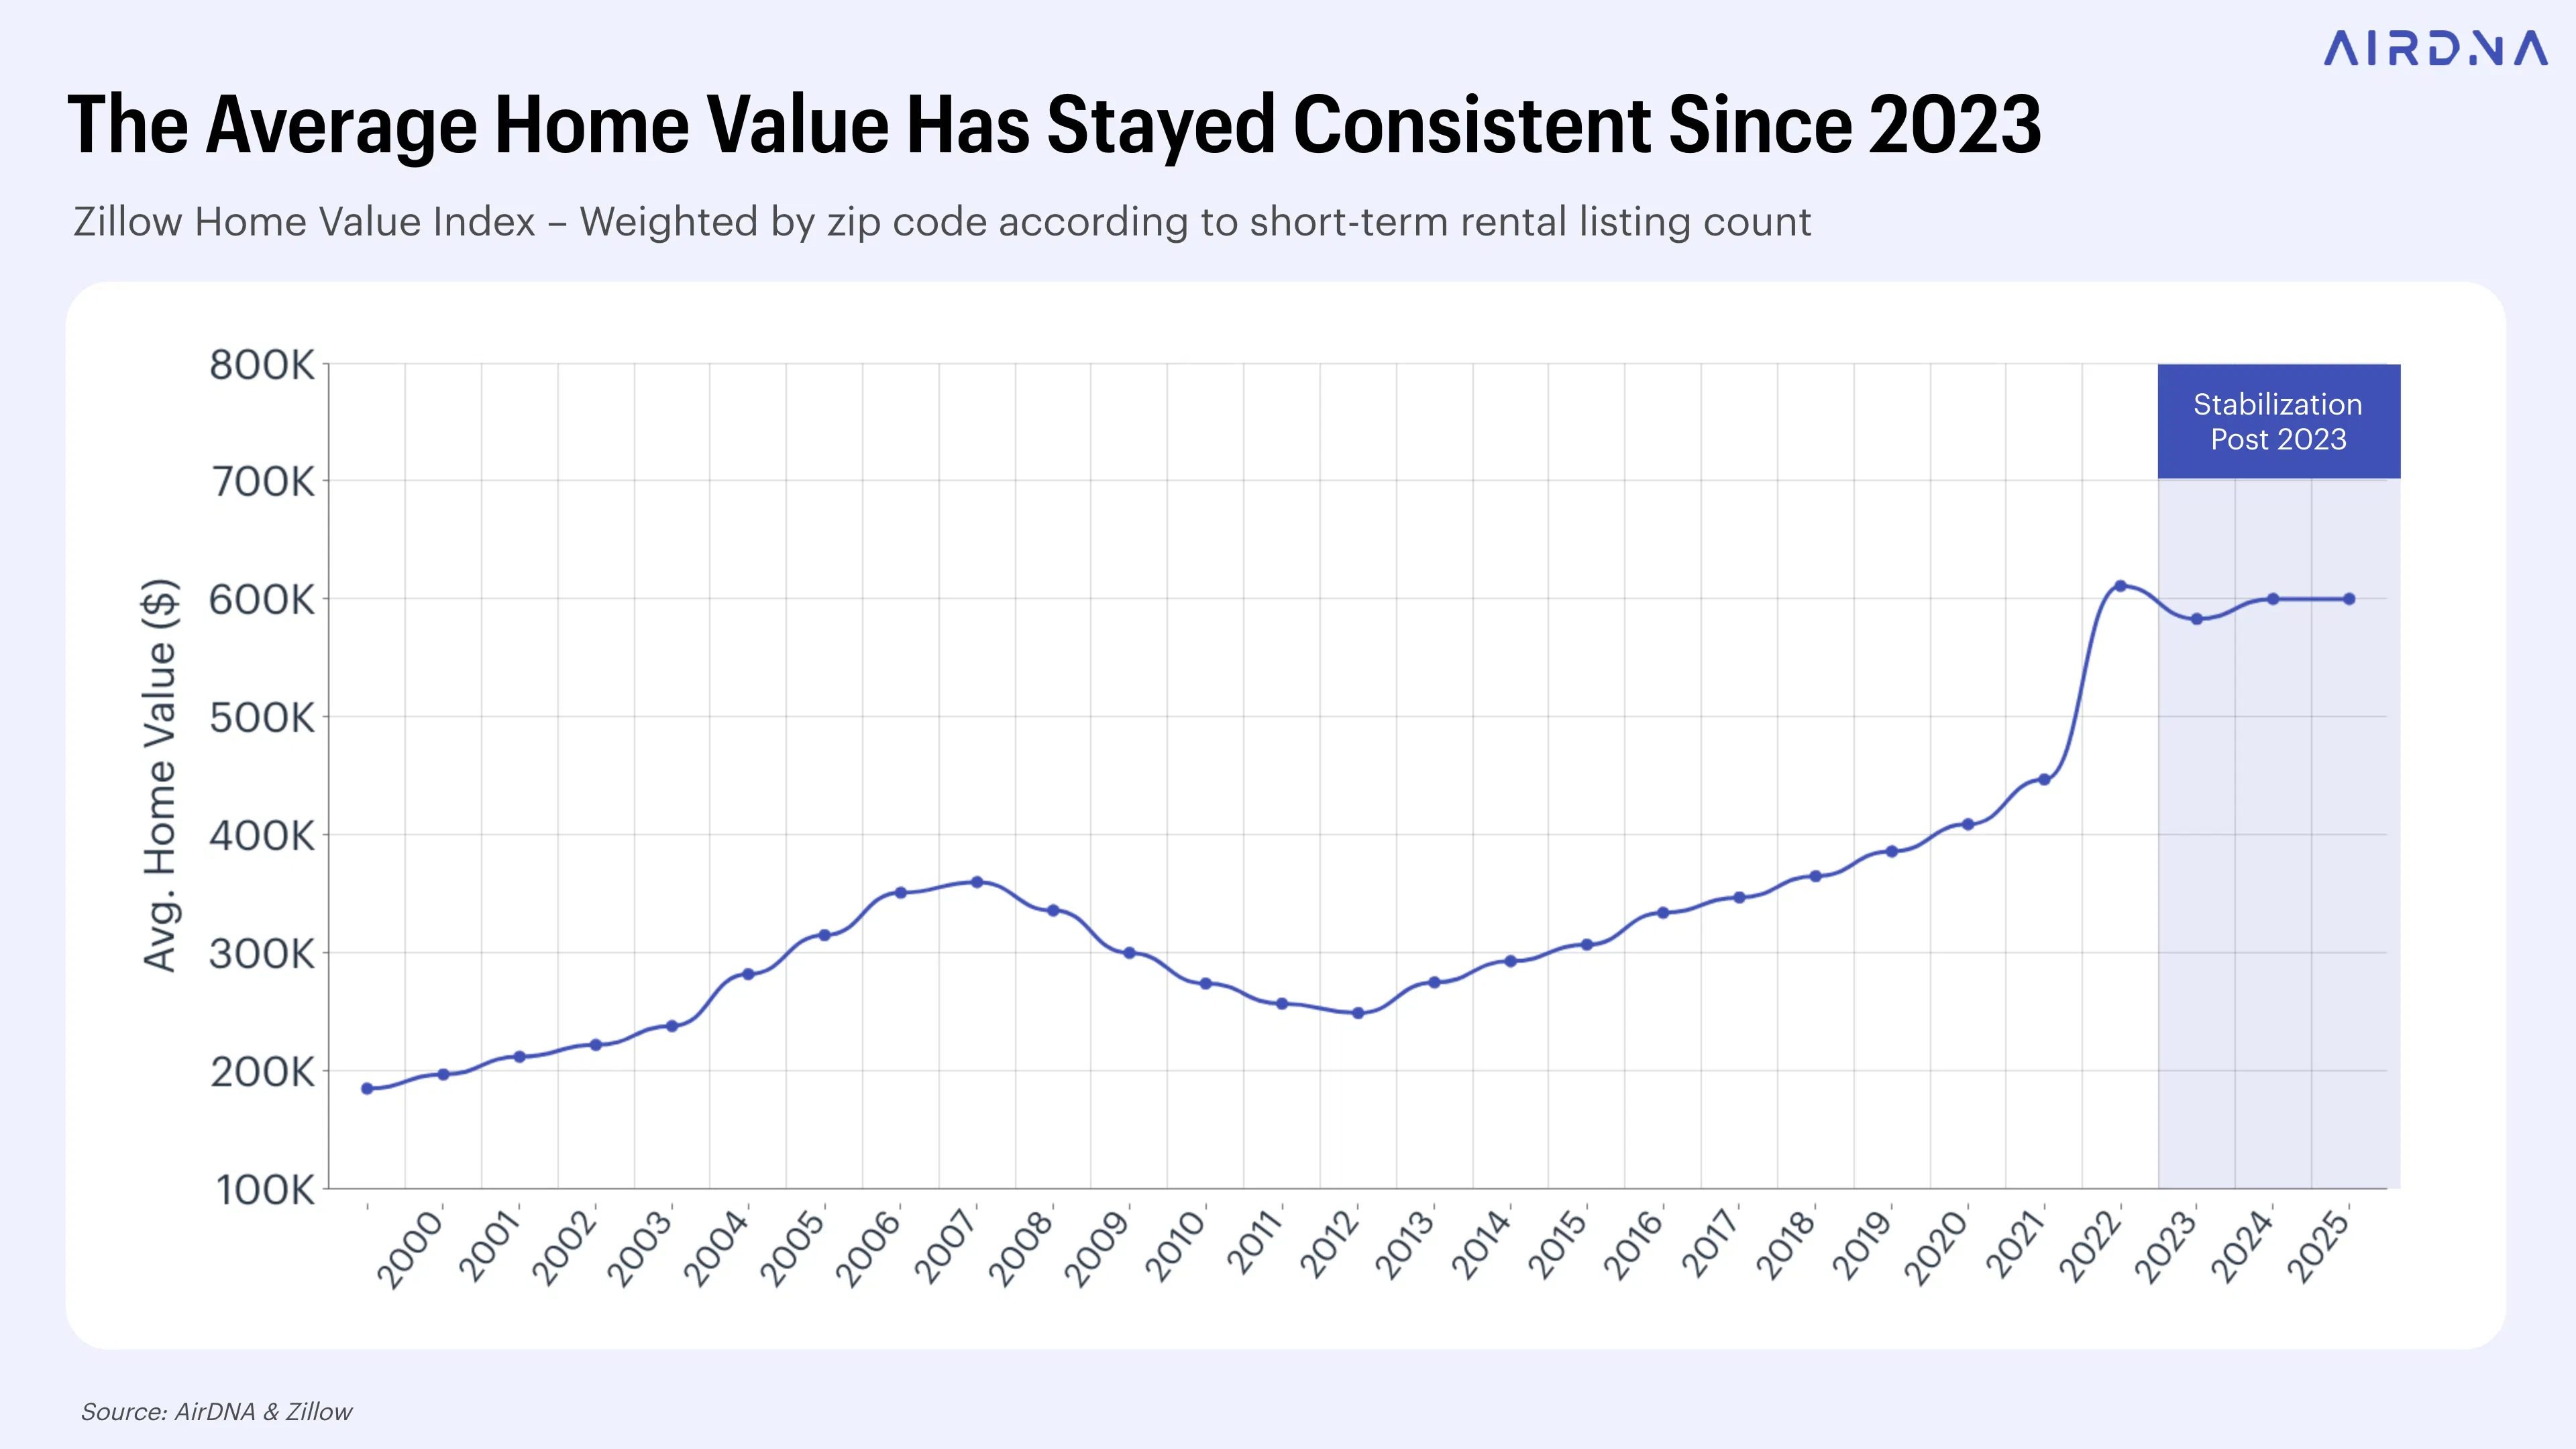
The post-pandemic housing boom was short-lived. As interest rates began climbing, home sales slowed sharply as prices stayed stubbornly high. This dynamic was especially pronounced in the types of homes and locations that are most popular for STR investments. Home prices dipped slightly in mid-2023, but they remained roughly 50% higher than pre-pandemic levels in 2019 and 2020. Entry costs remain elevated for new investors and they limit expansion opportunities for existing operators.
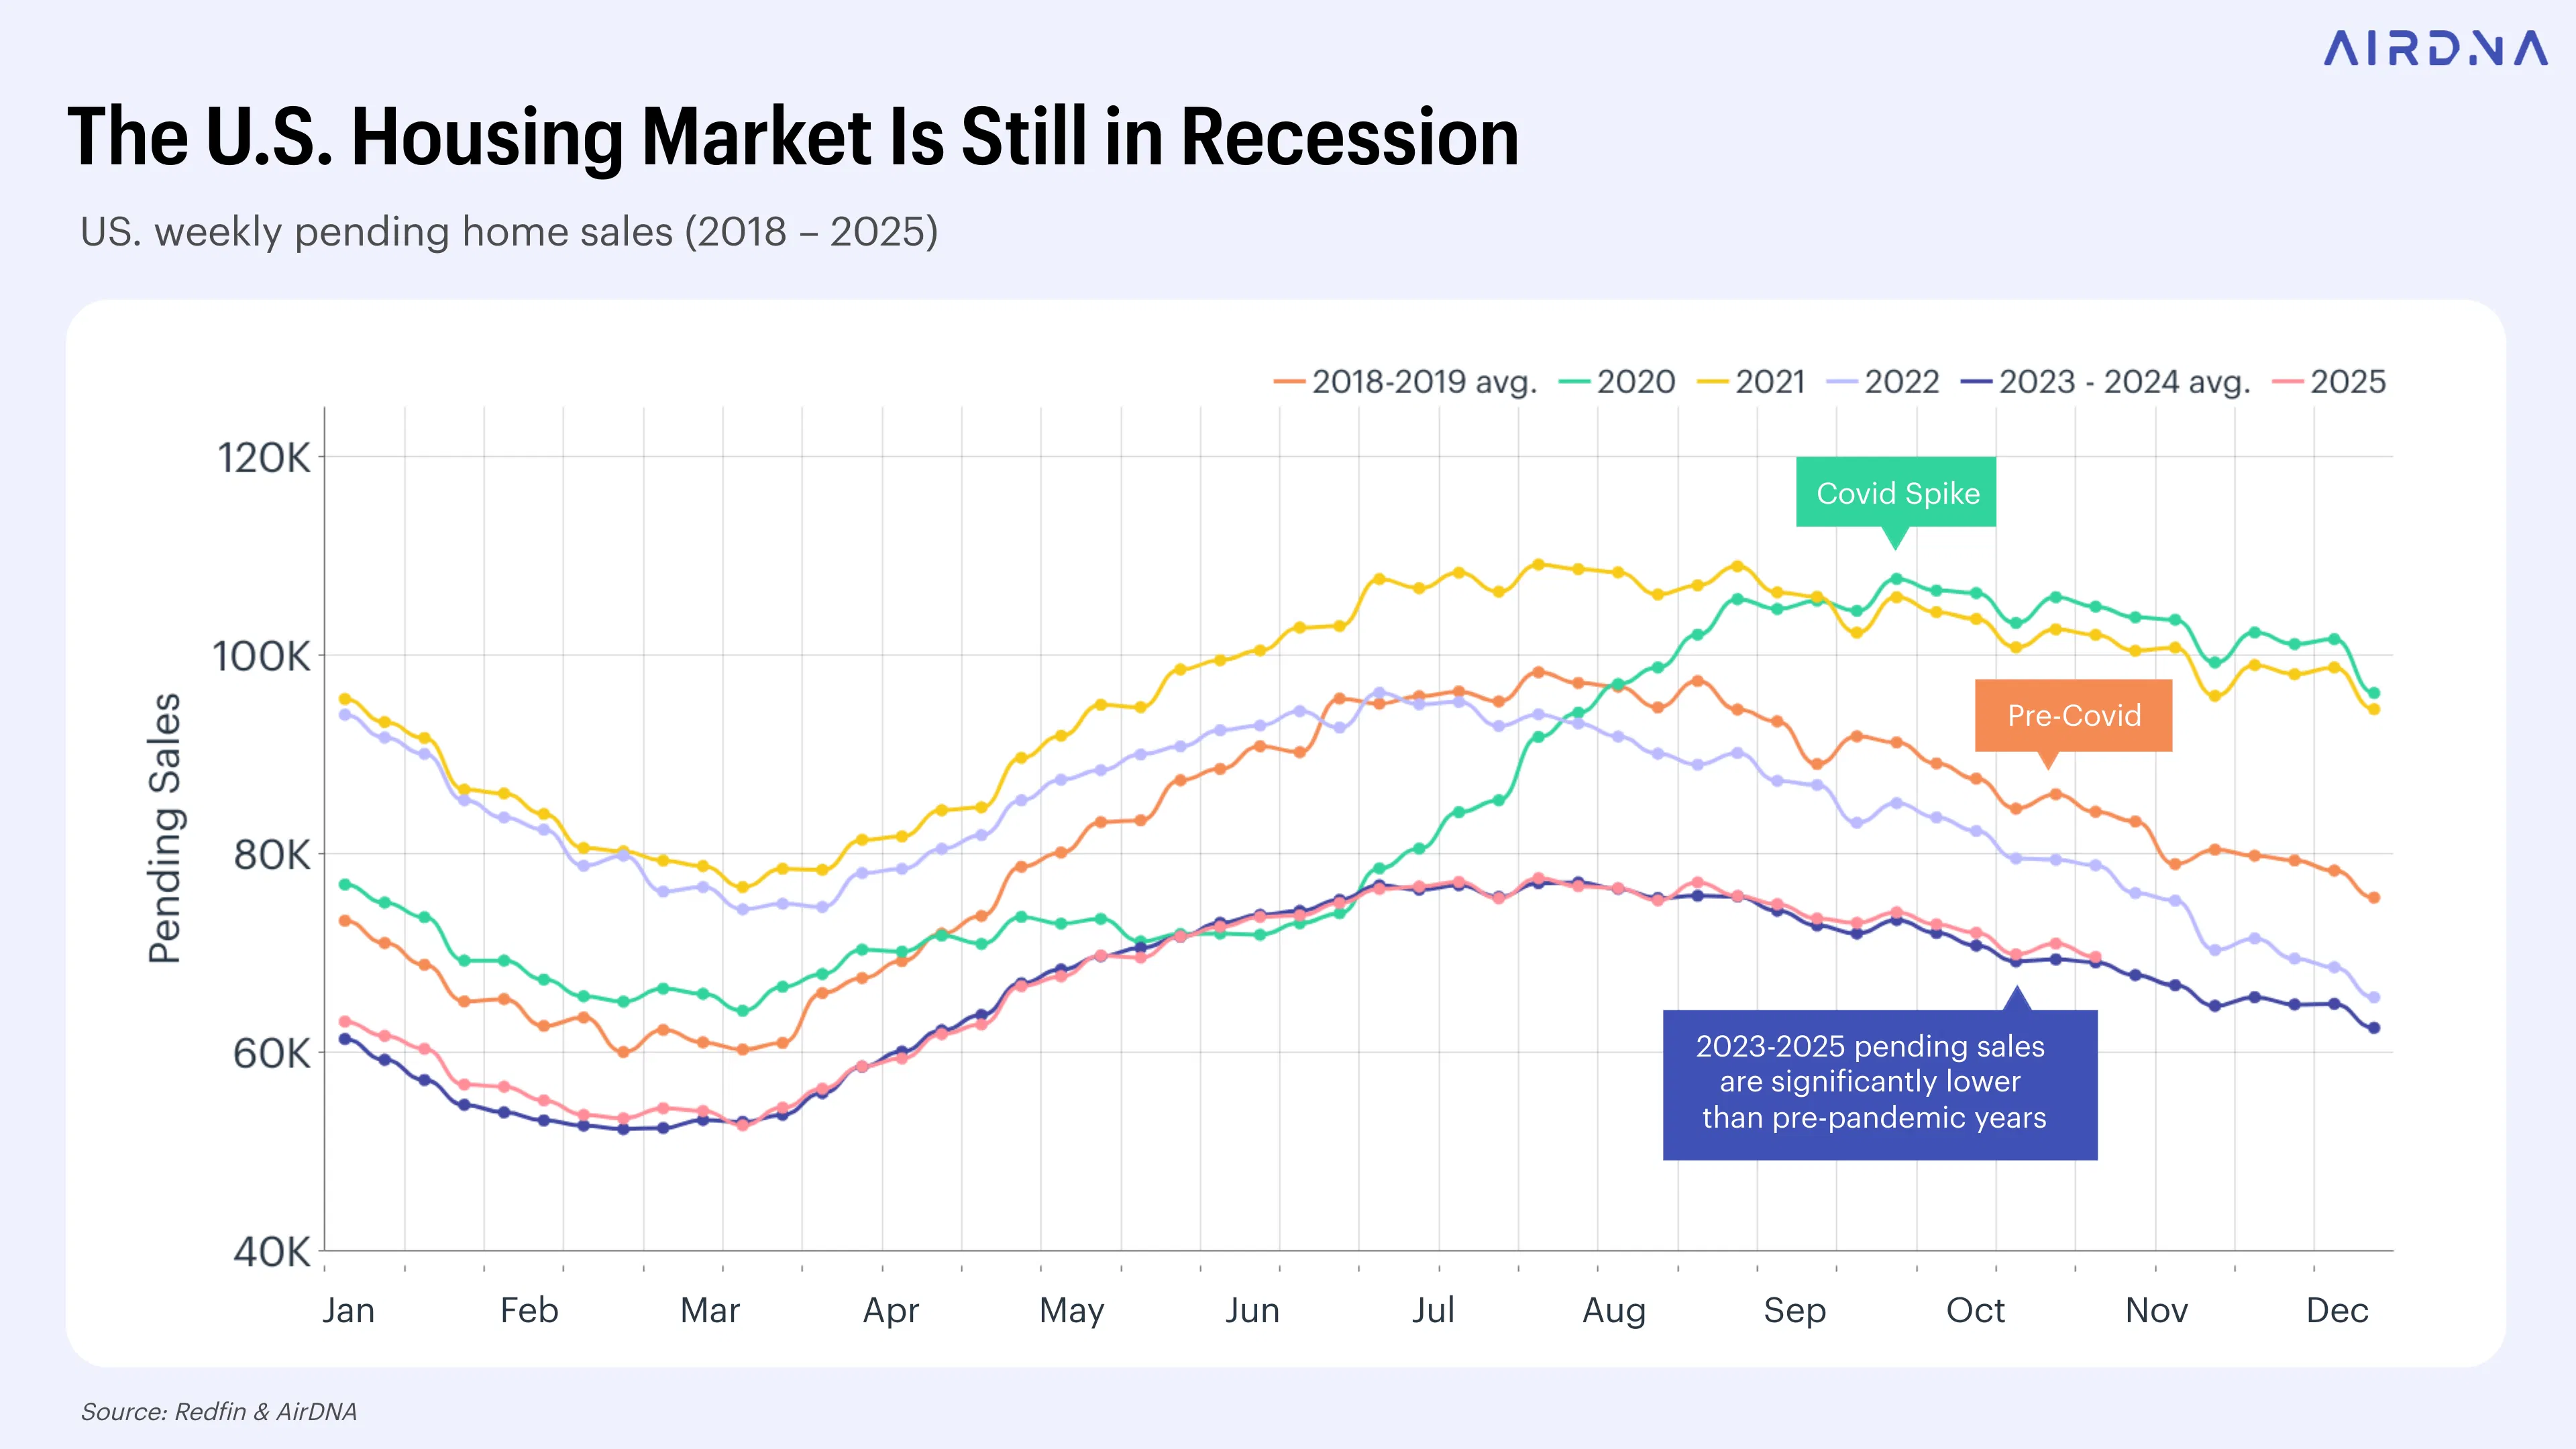
Fueled by low interest rates and shifting demand, home sales surged well above pre-pandemic levels in 2020 and 2021. As borrowing costs rose in 2022, however, sales steadily declined and ultimately fell to today’s multi-year lows, according to Redfin data. This “housing market recession” has directly impacted STRs by slowing the pace of new supply entering the market.
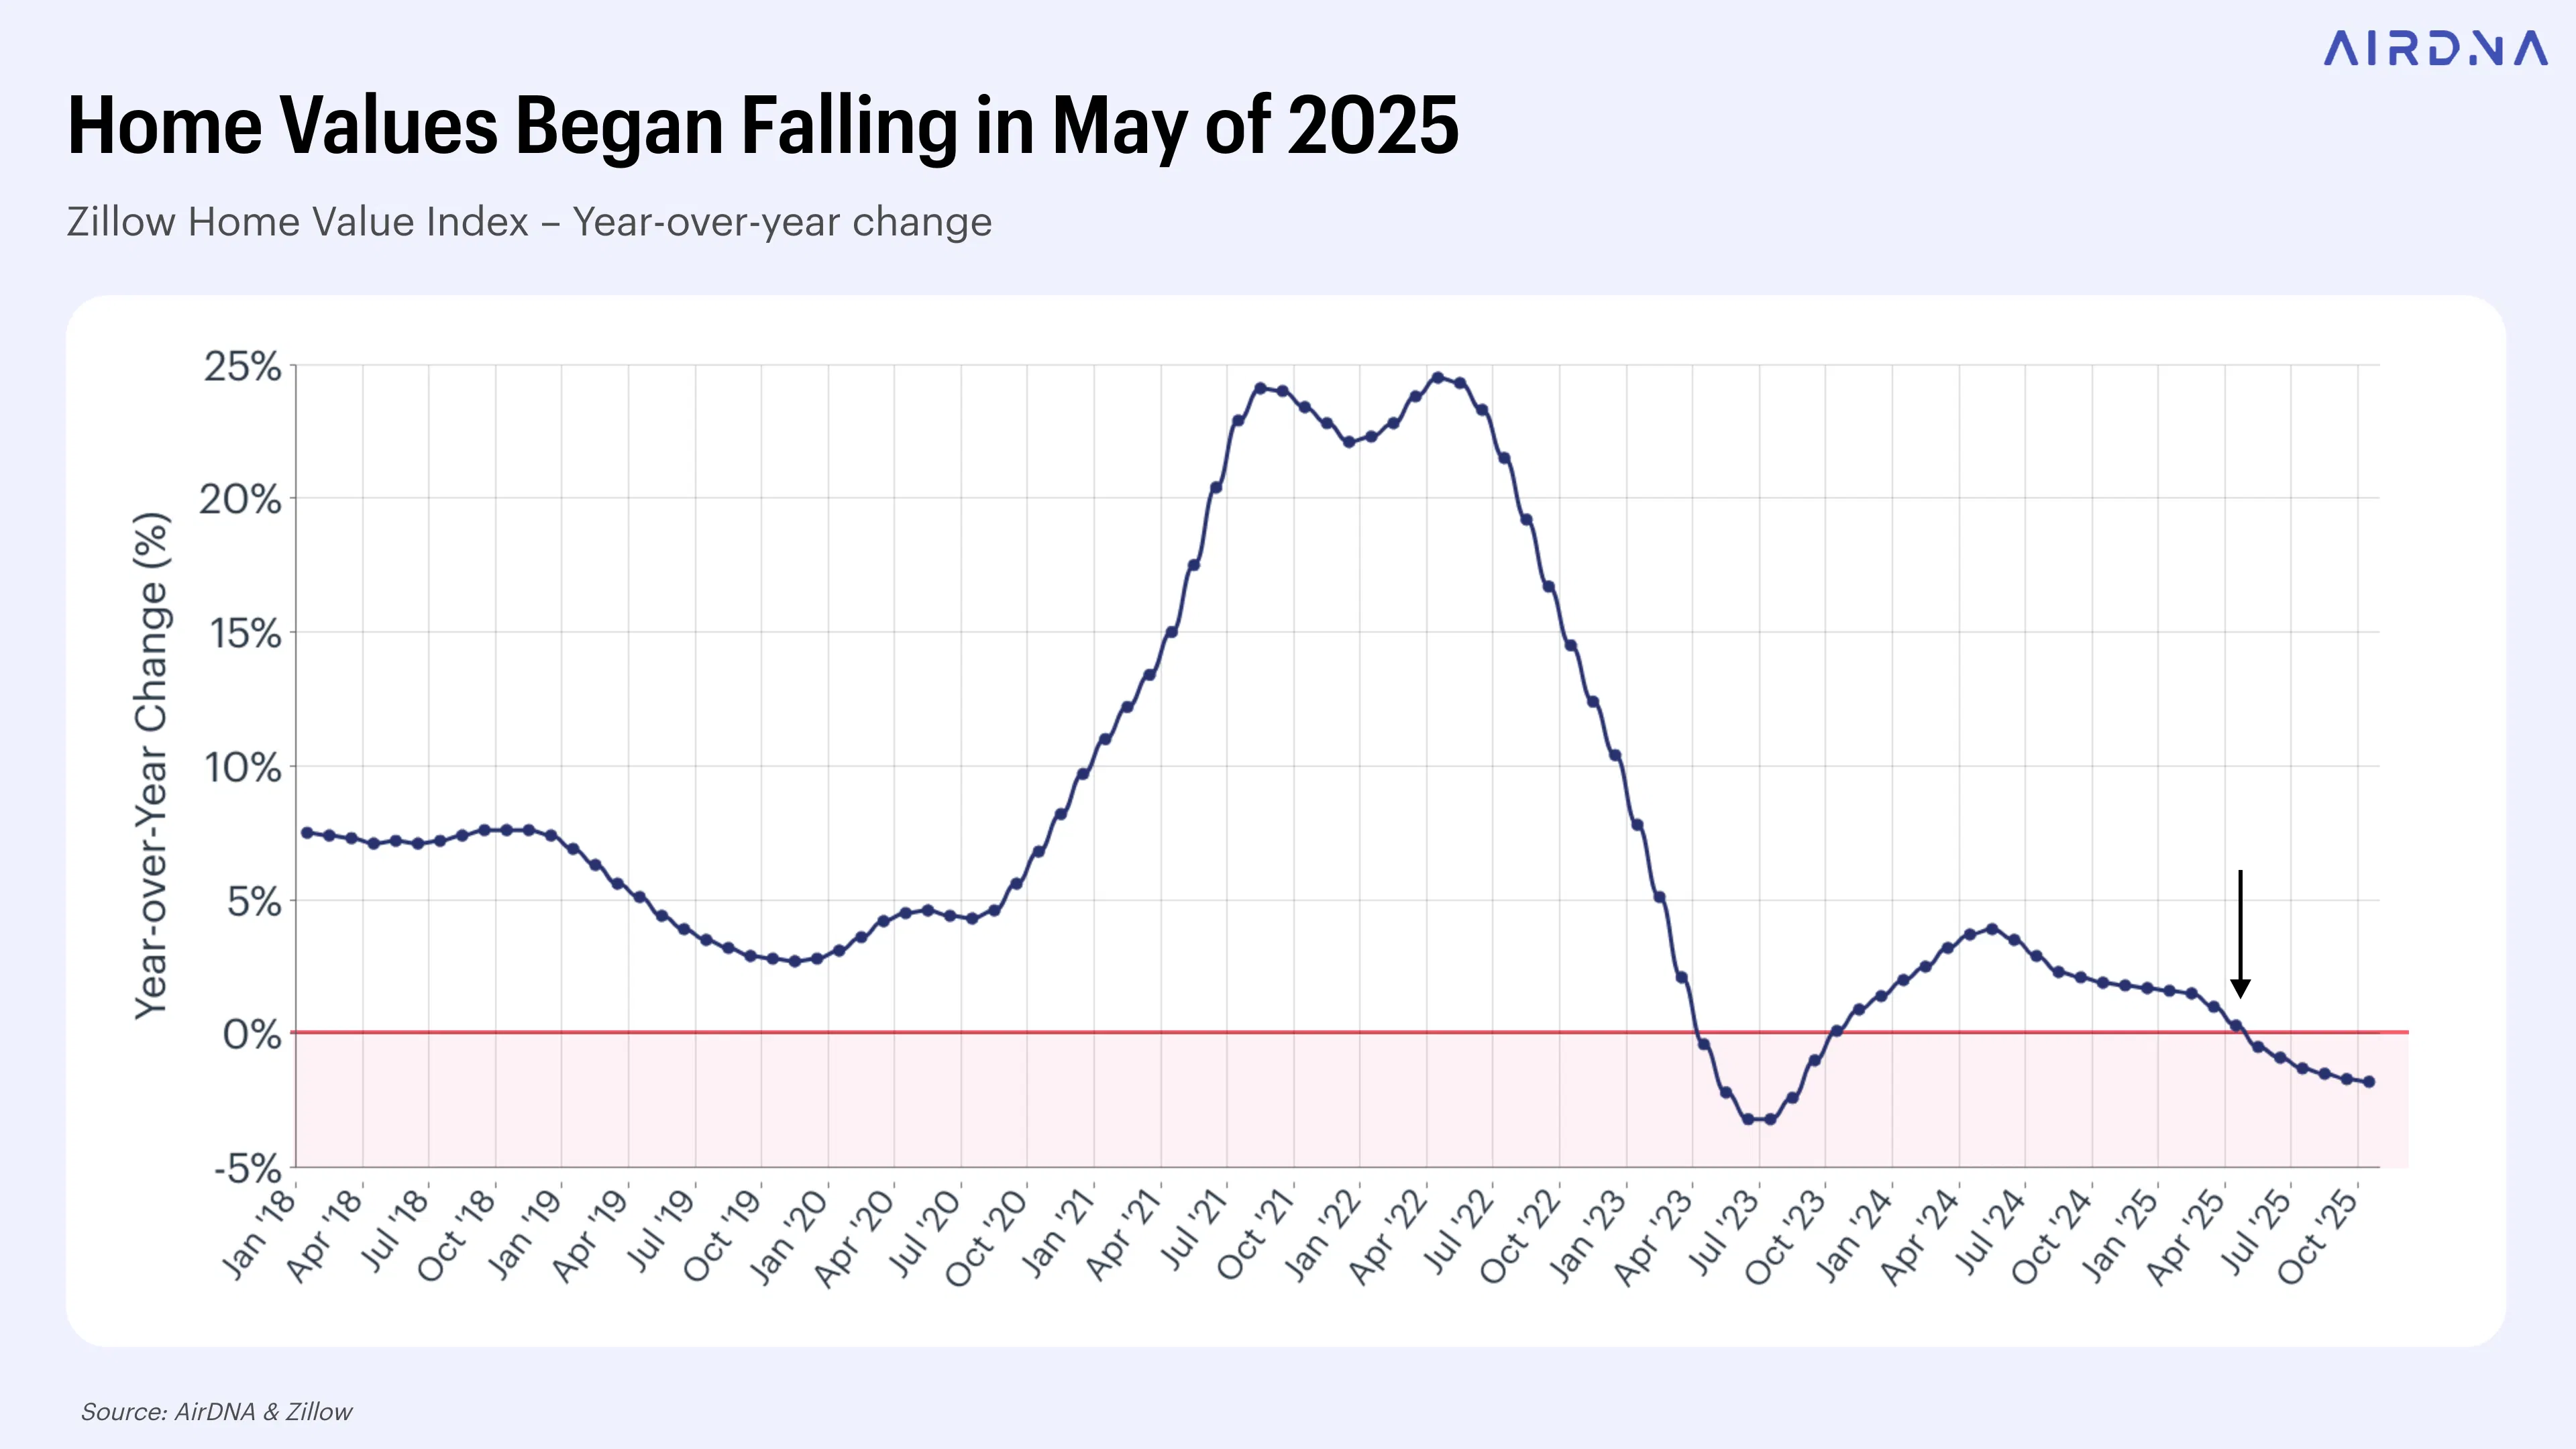
More recently, though, signs of change are emerging. Rising for-sale inventory and longer listing times are beginning to soften home prices, potentially opening new opportunities for buyers eyeing STR investments.
If high interest rates caused the housing market freeze, it’s natural to assume that falling interest rates would quickly revive the housing market. The Fed began cutting rates again in September 2024, but uncertainty about inflation has made mortgage rates slow to respond.
When lenders expect higher inflation in the future, they increase mortgage rates to protect the long-term value of their loan payments, effectively baking inflation risk into borrowing costs. That’s why mortgage rates didn’t initially respond to the Fed’s actions.
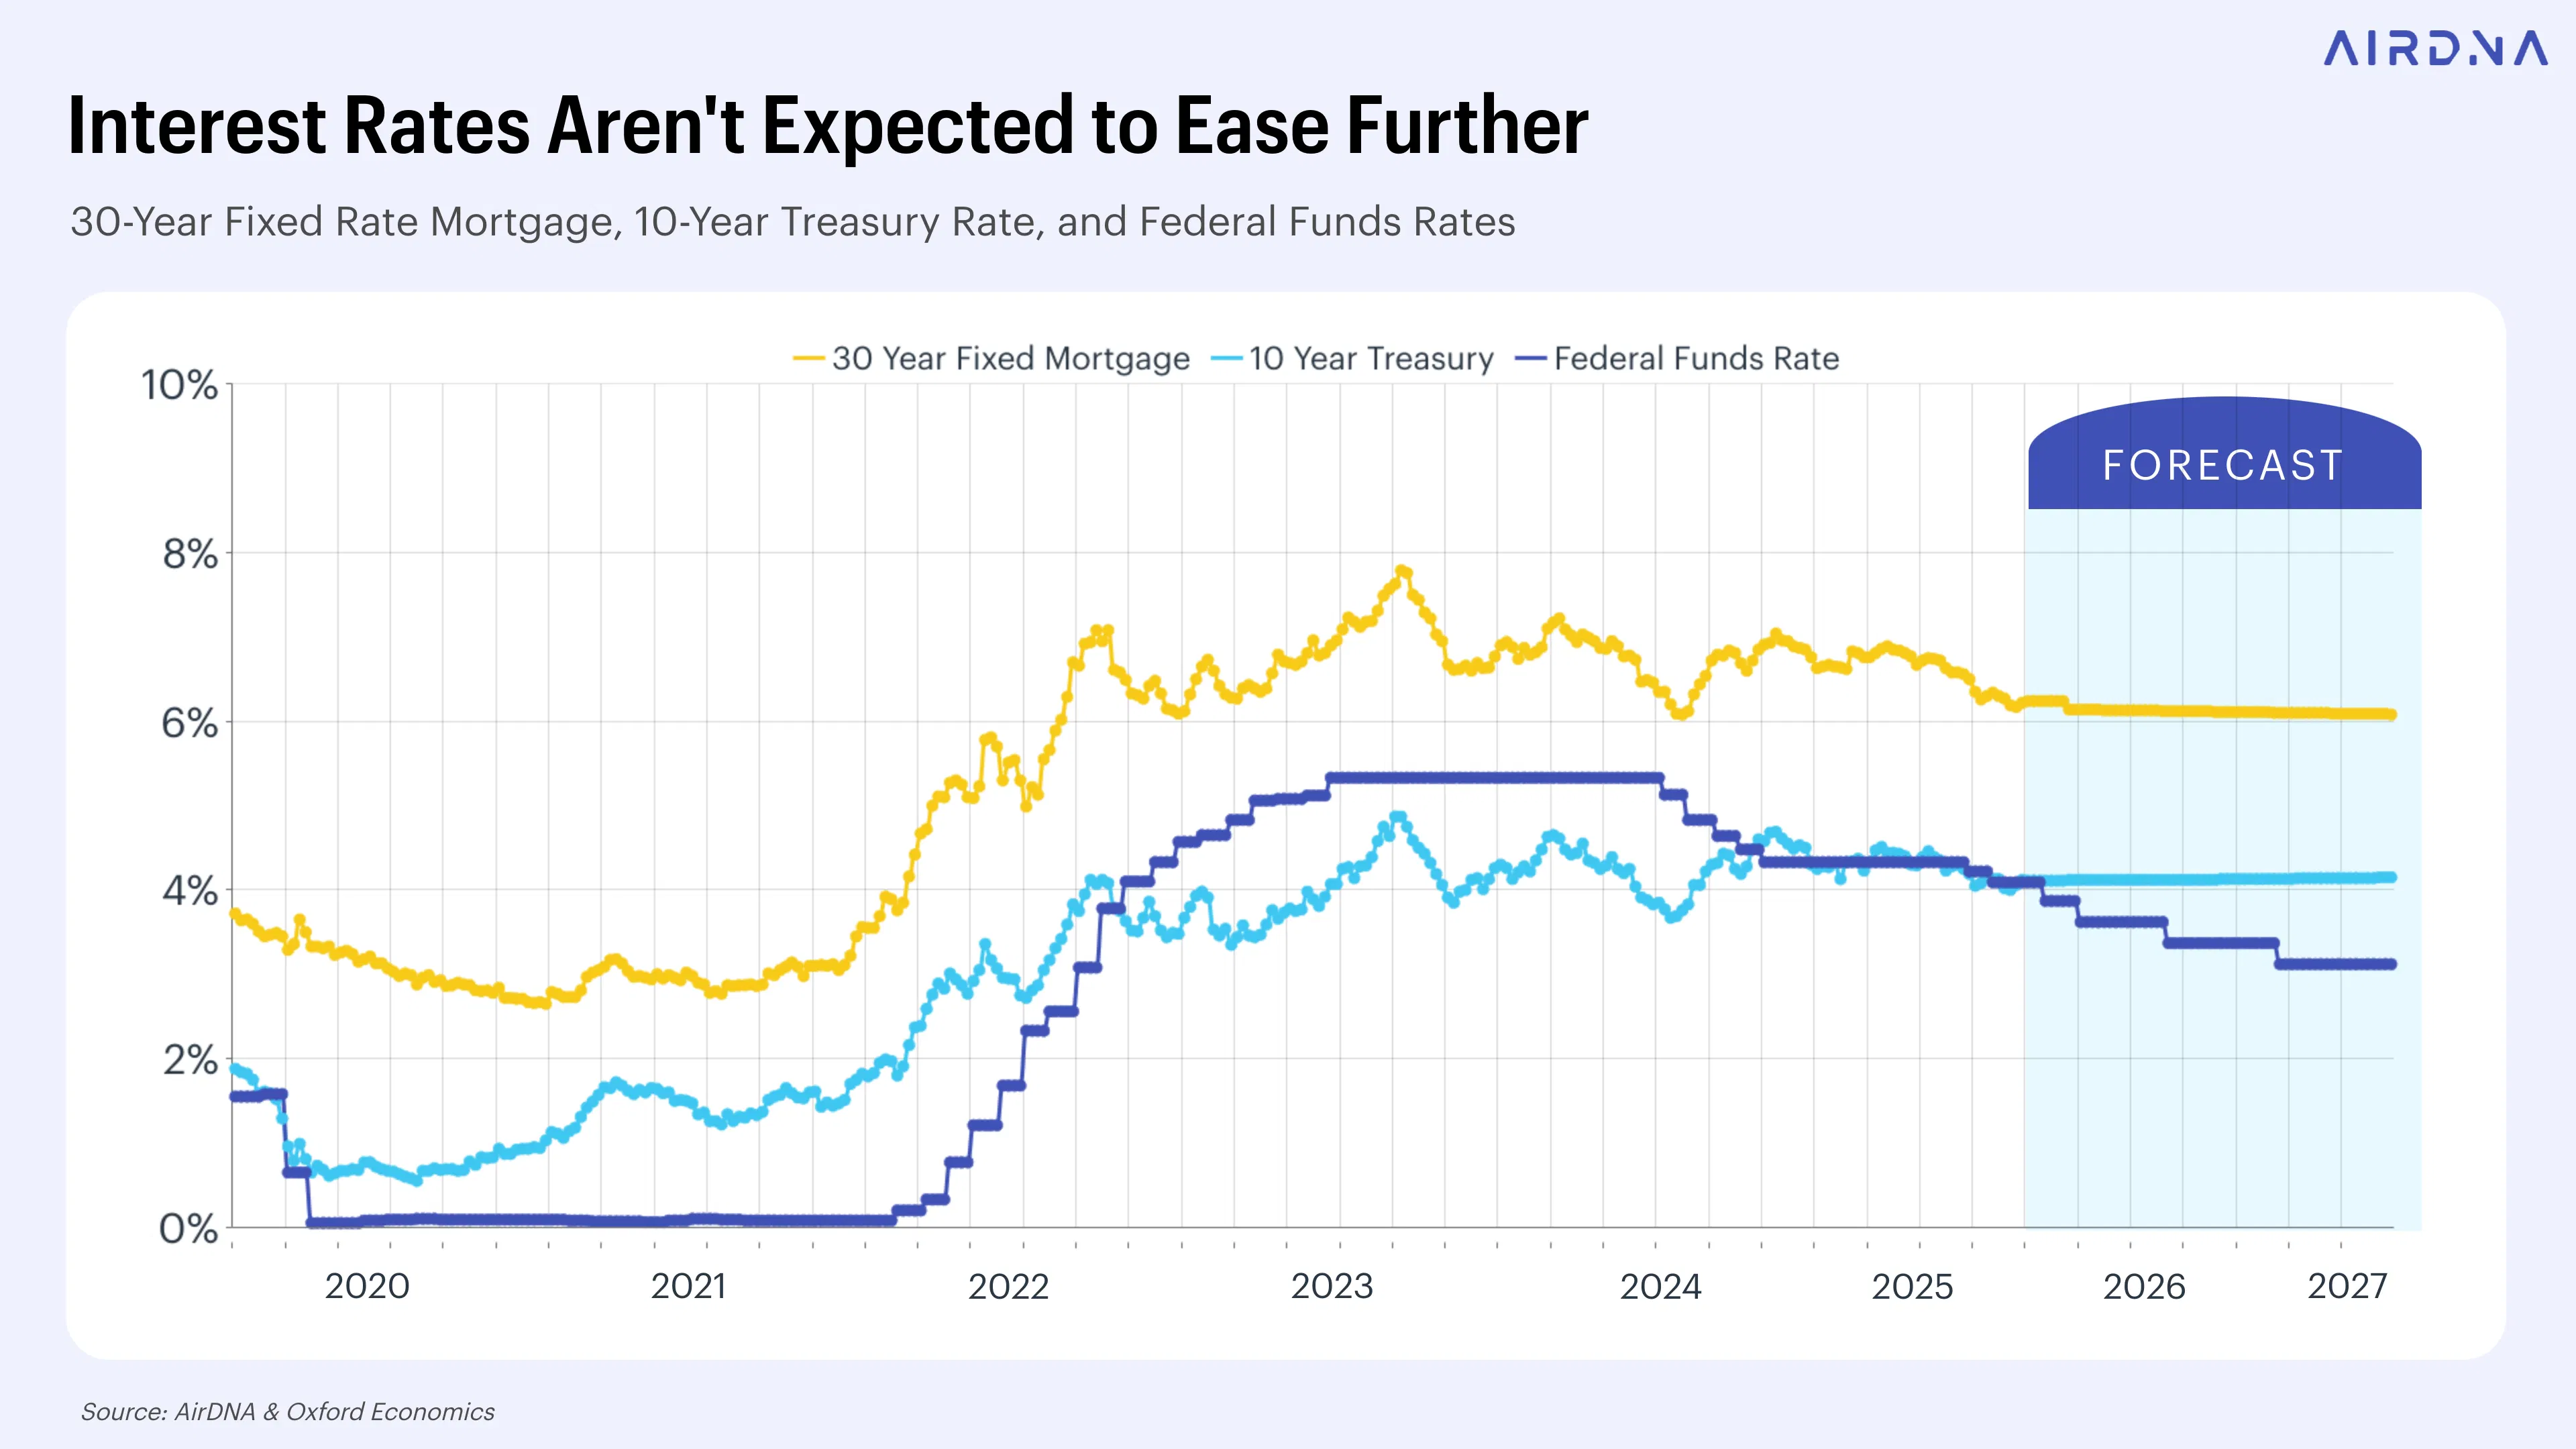
Recently, after a nine-month pause, the Fed resumed rate cuts in response to weakening labor market conditions that took precedence over additional inflation. This second round of easing had a clearer impact on mortgage rates, which fell by roughly 75-basis-points from around 7% in January to 6.25% by November 2025.
The STR premium is rebounding
Looking ahead, Oxford Economics expects mortgage rates to remain just above 6%, barring some unanticipated financial shock. This forecast is based on the assumption that lenders have already “priced in” future Fed rate cuts. That means mortgage rates may not fall much further even as the Fed continues easing.
While a 75-basis-point drop in mortgage rates and a slight softening in home prices might seem small, these shifts have meaningfully improved the STR investment equation. One useful metric that is predictive of supply change is the “STR premium,” which captures the difference between expected monthly revenue from an STR and the monthly mortgage payment on a newly purchased home.
This premium hit extraordinary highs—up to $2,618—in the immediate aftermath of the pandemic, as strong demand boosted earnings and low interest rates kept ownership costs down. As more investors entered the market and climbing mortgage rates made homes less affordable, the premium shrank.
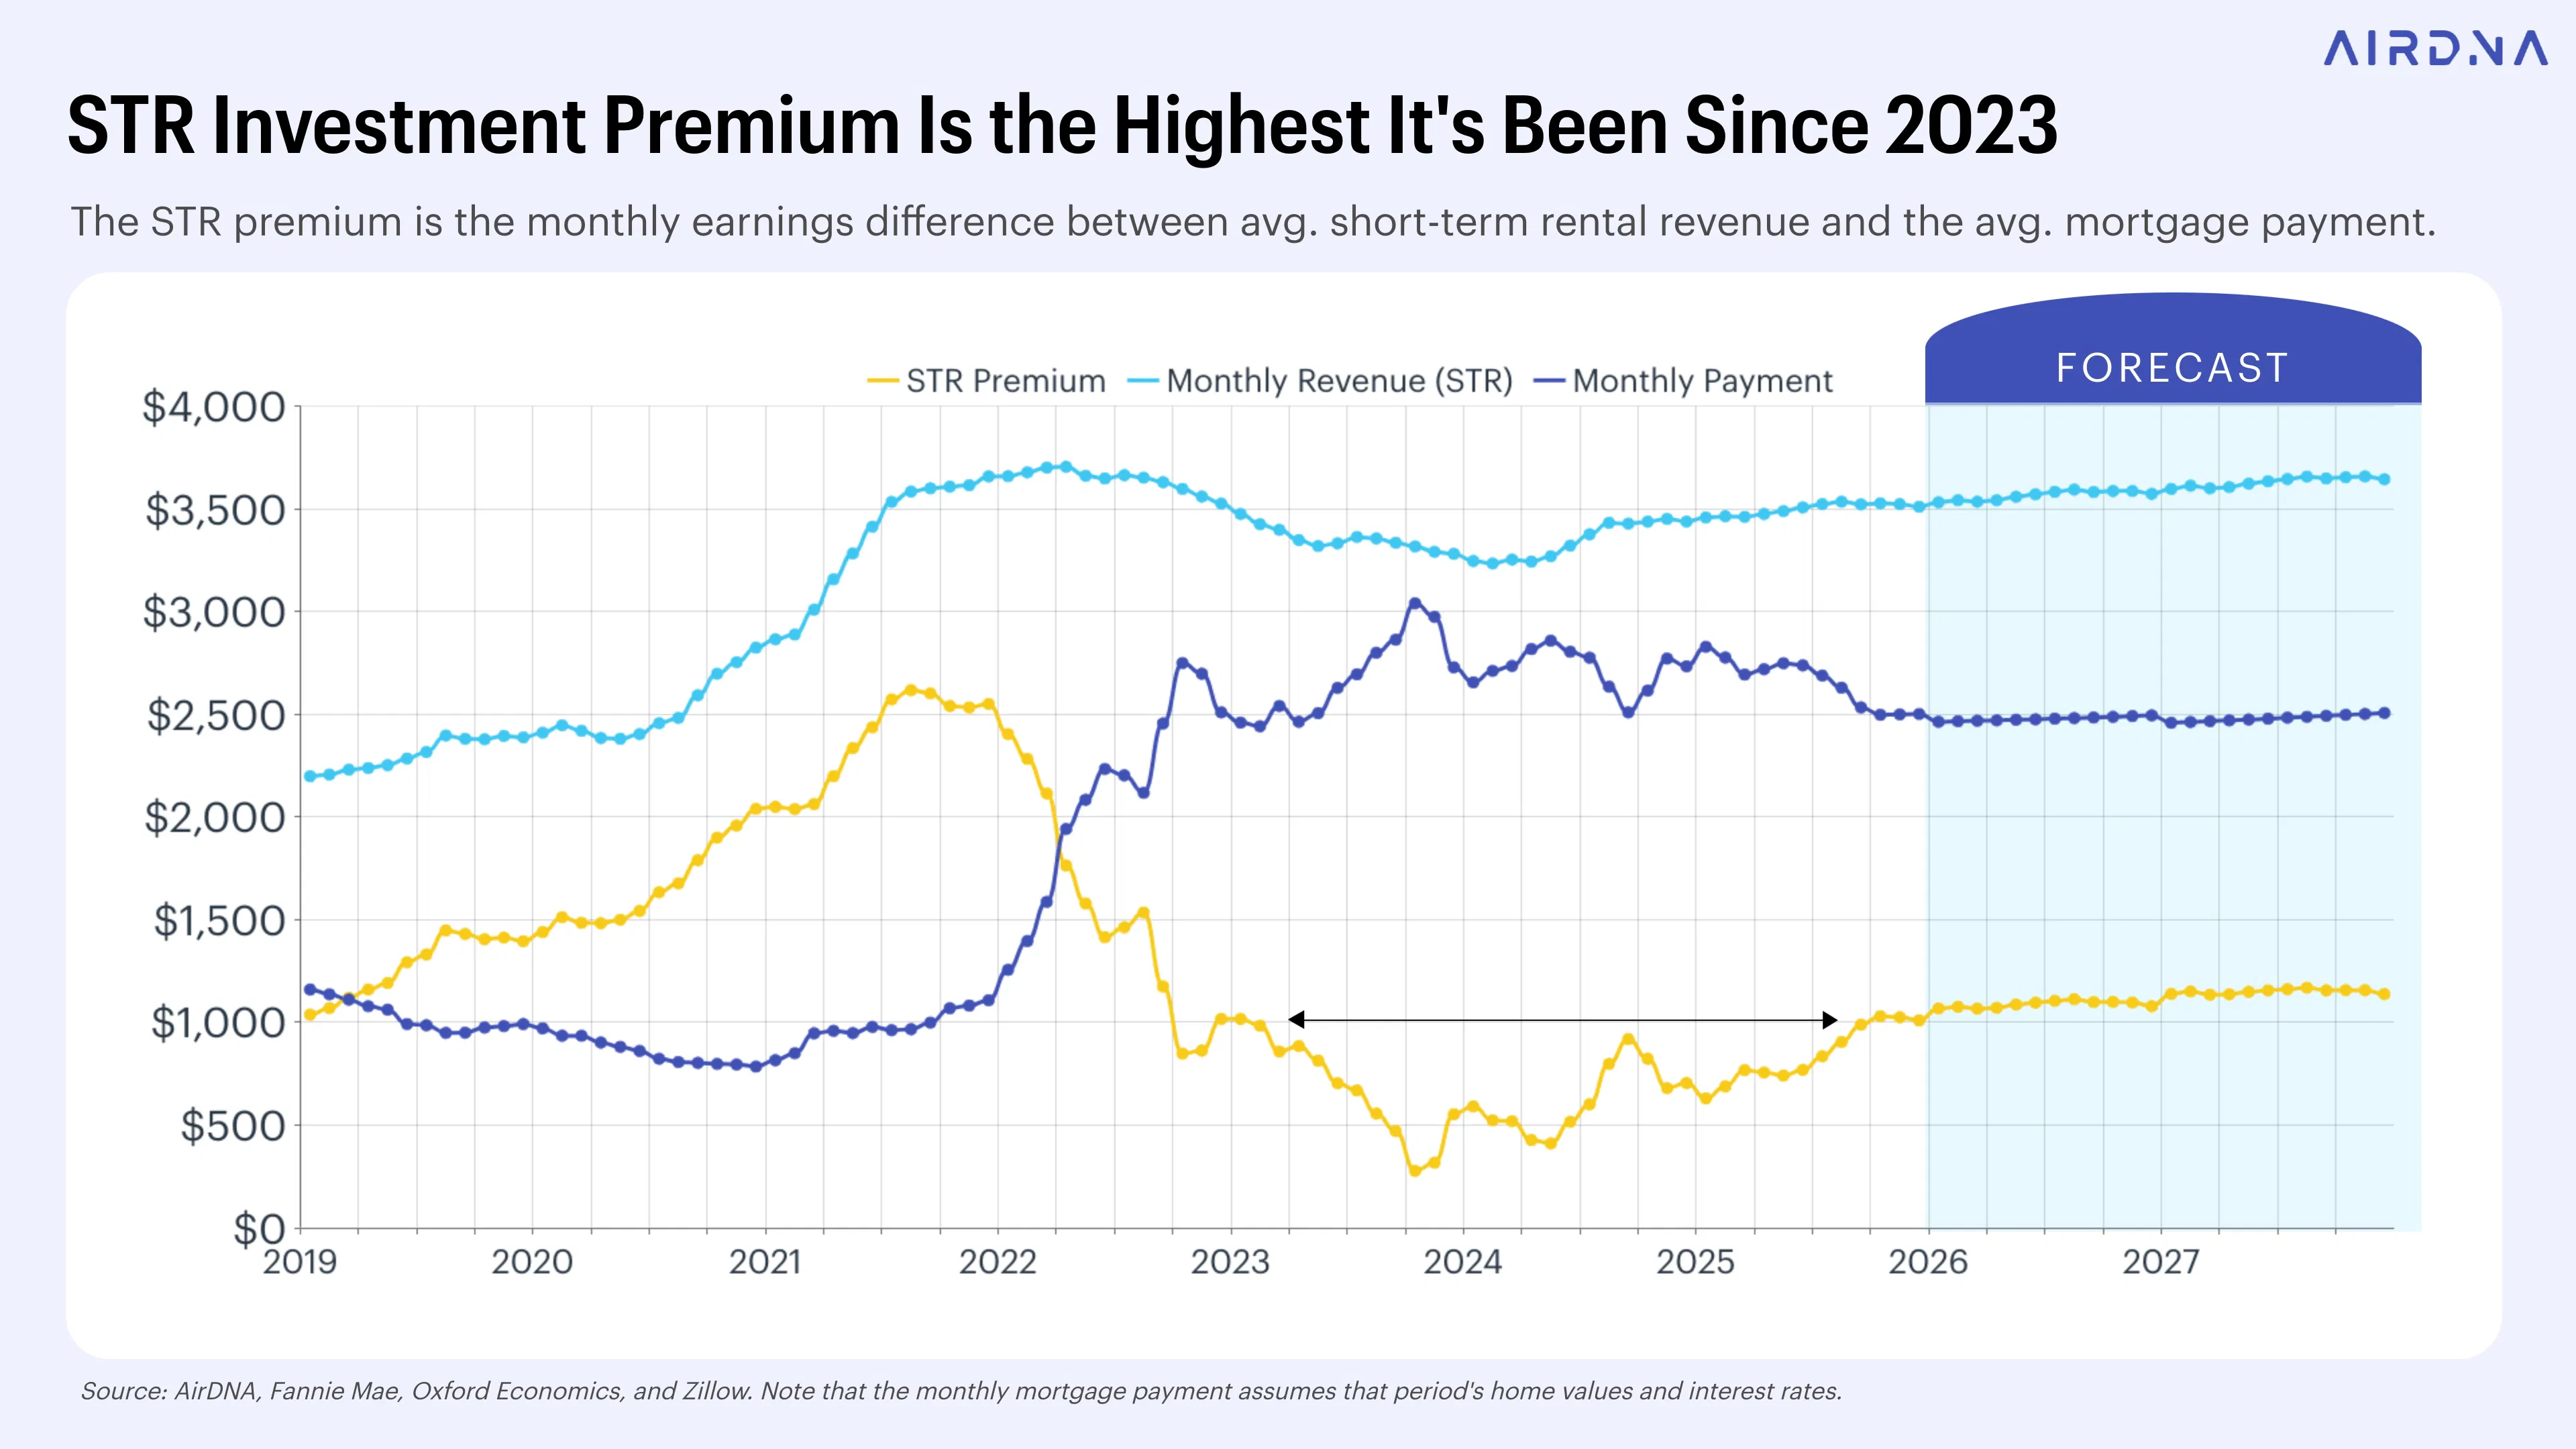
As of late 2025, the STR premium has rebounded to $989. That’s the highest level seen since late 2022 and early 2023. While still below 2019 norms and post-pandemic peaks, it’s still more than three times the low of $277 seen in October 2023. In addition, the STR premium is expected to continue growing modestly through 2027 thanks to steady mortgage rates, flat home prices, and improving STR performance.
Expressing the STR premium as a return on investment (ROI) percentage helps reveal the lagged effect between investment returns and new supply. Even when returns improve, it takes time for investors to react due to the steps involved in buying a property, furnishing it, and bringing it to market.
For example, when STR investment returns peaked around August 2021, listing growth didn’t reach its high point until nearly a year later. Similarly, after returns hit a low in October 2023, supply continued to decline for another two years. It wasn’t until August 2025 that supply began growing again, roughly a year after average returns rebounded from 5.9% to 7.9% in August 2024.
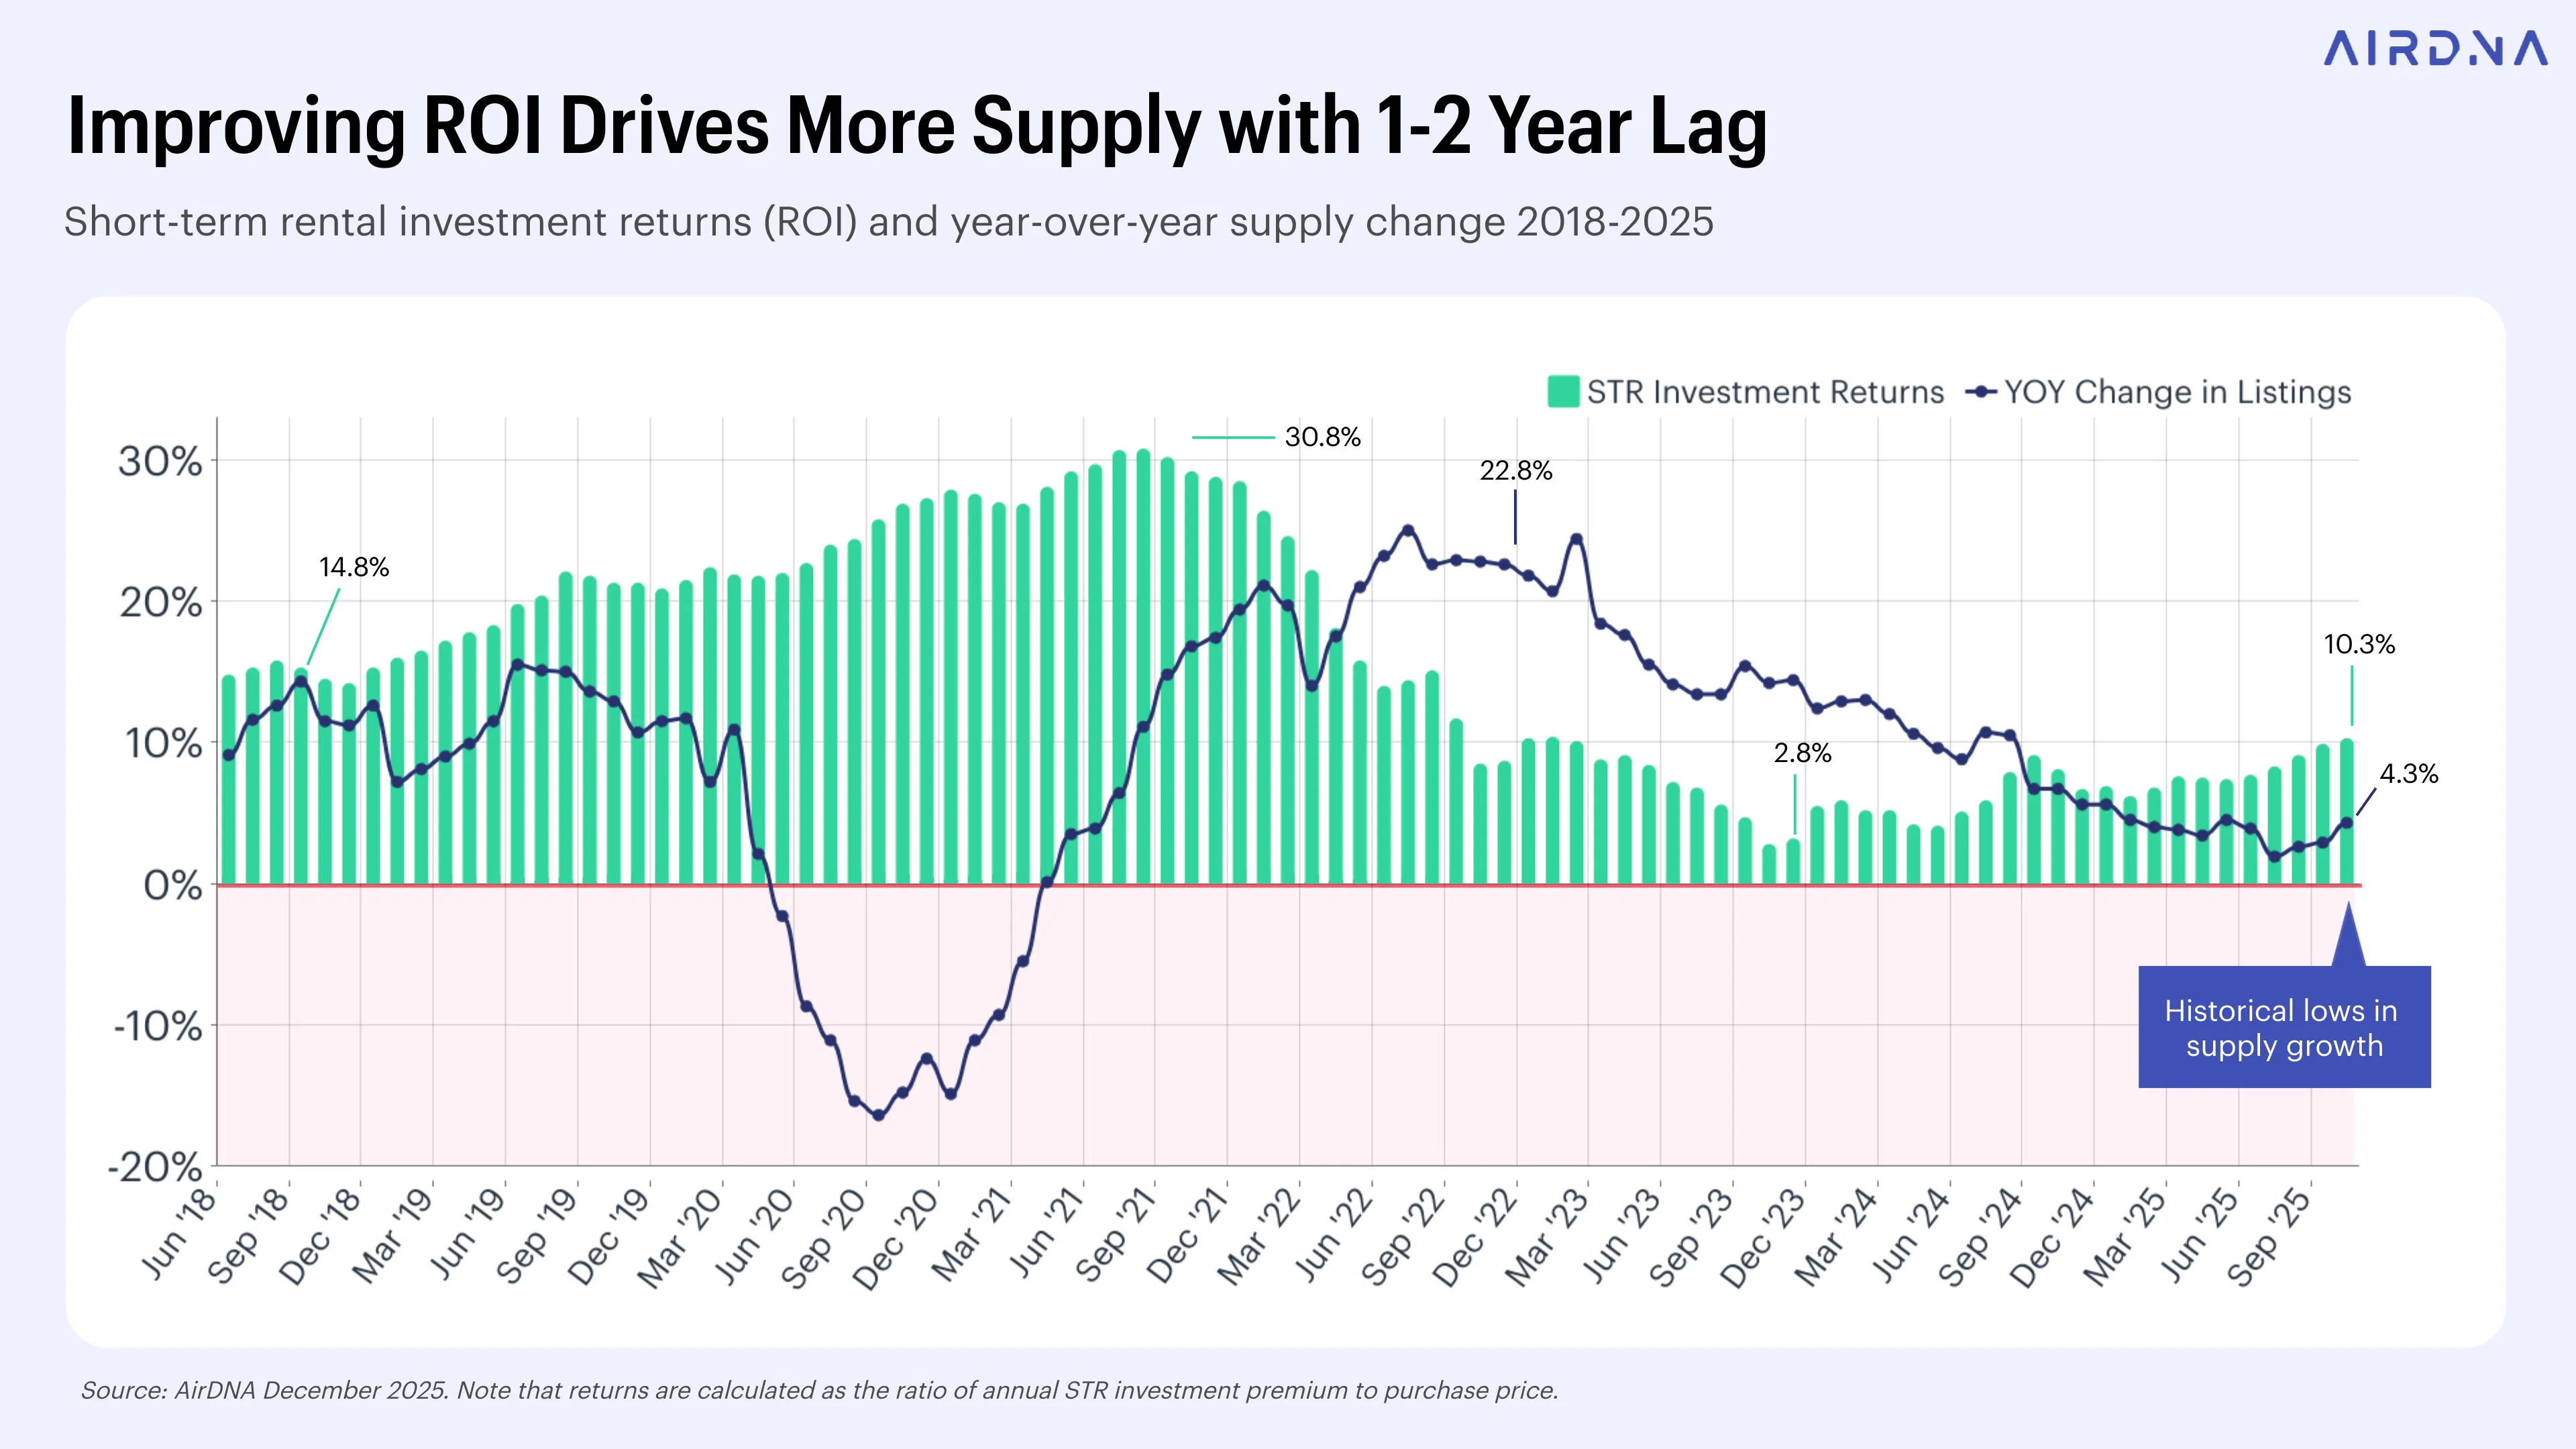
Although the STR premium—measured as the monthly difference between revenue and mortgage cost—has returned to pre-pandemic levels, overall investment returns remain lower than they were in earlier years. That’s because returns are calculated as a ratio of annual STR premium to the property’s purchase price.
In other words, while the dollar value of the premium today may look similar to what investors earned in 2017 or 2019, the cost to access that income is much higher. Home prices have risen sharply over the past several years, which means the monthly mortgage payment is also higher. Even though investors are earning a $1,000 monthly premium, they’re doing so on a much larger upfront investment, which leads to lower percentage returns overall.

Falling home prices in key STR markets spell opportunity
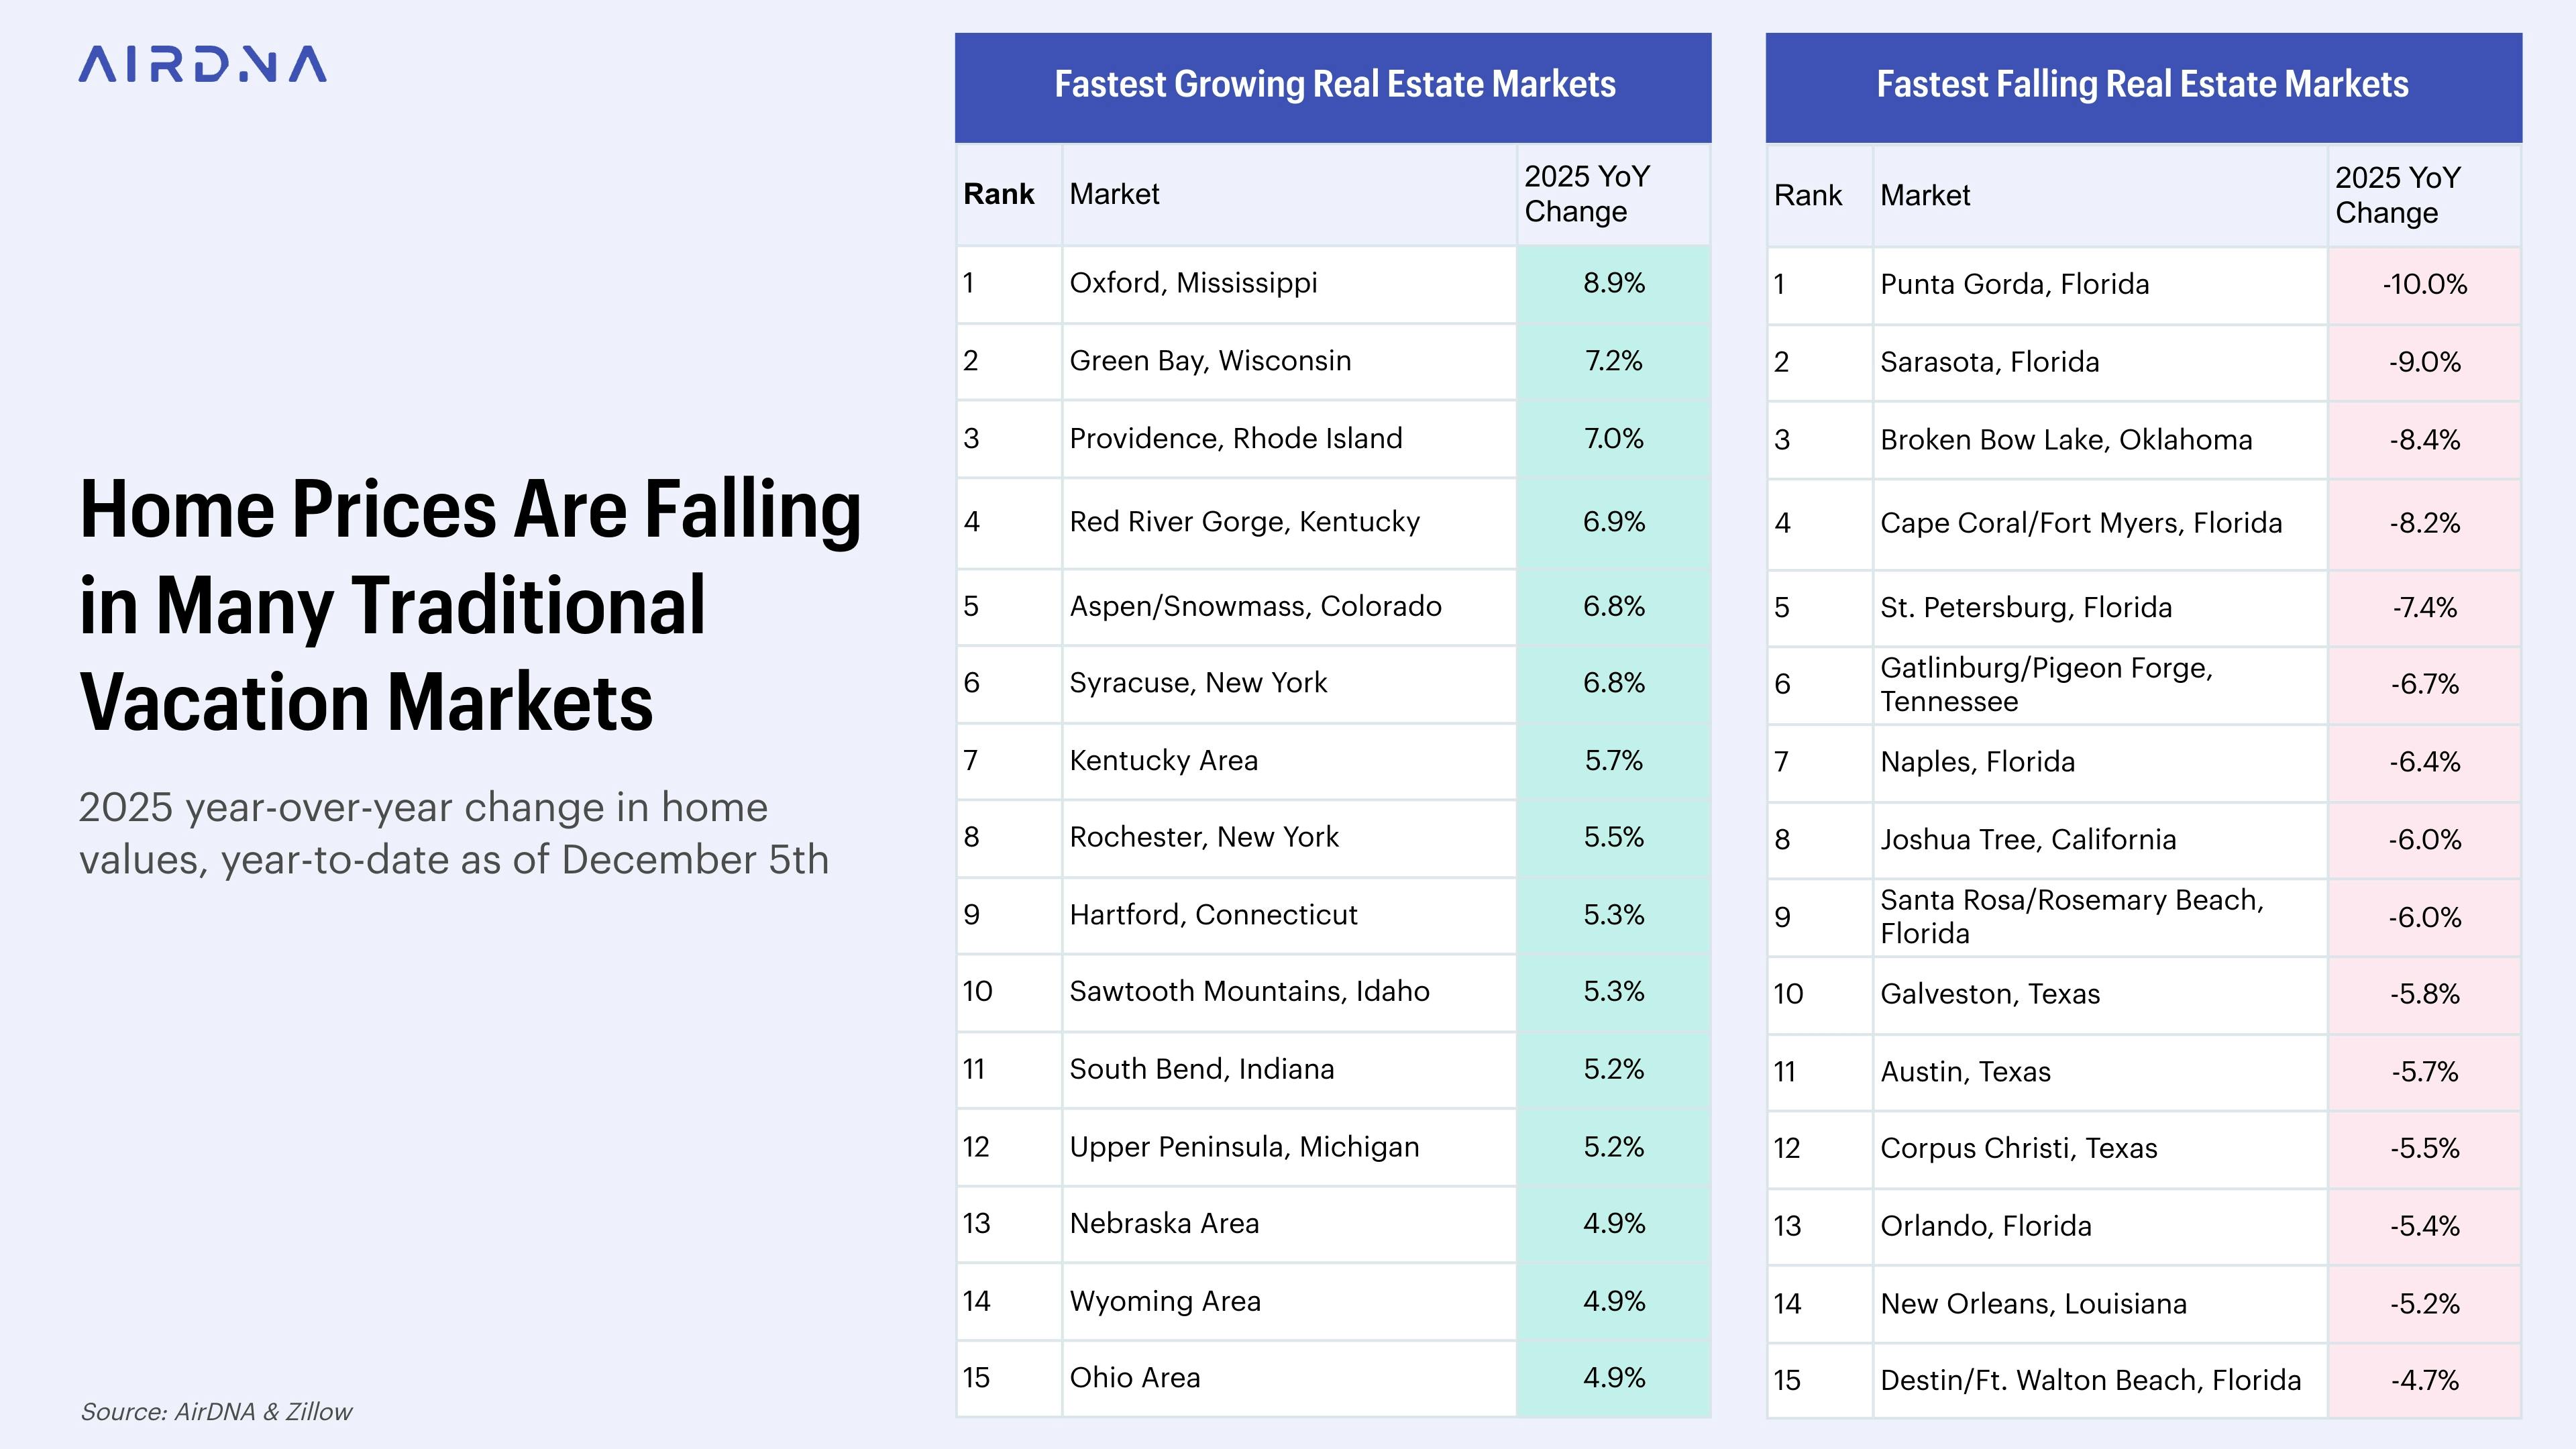
Looking ahead, both home prices and returns are expected to rise together. With home values flattening or falling in some markets, though, improving returns could soon begin to close the gap with pre-pandemic benchmarks.
In fact, many of the markets seeing the largest home price declines are traditional vacation rental hotspots. At the same time, prices are rising most in Small City/Rural areas. These are the markets where supply growth is expected to continue slowing. These shifts in affordability and returns will likely play a key role in shaping where new STR investments emerge in the coming years.
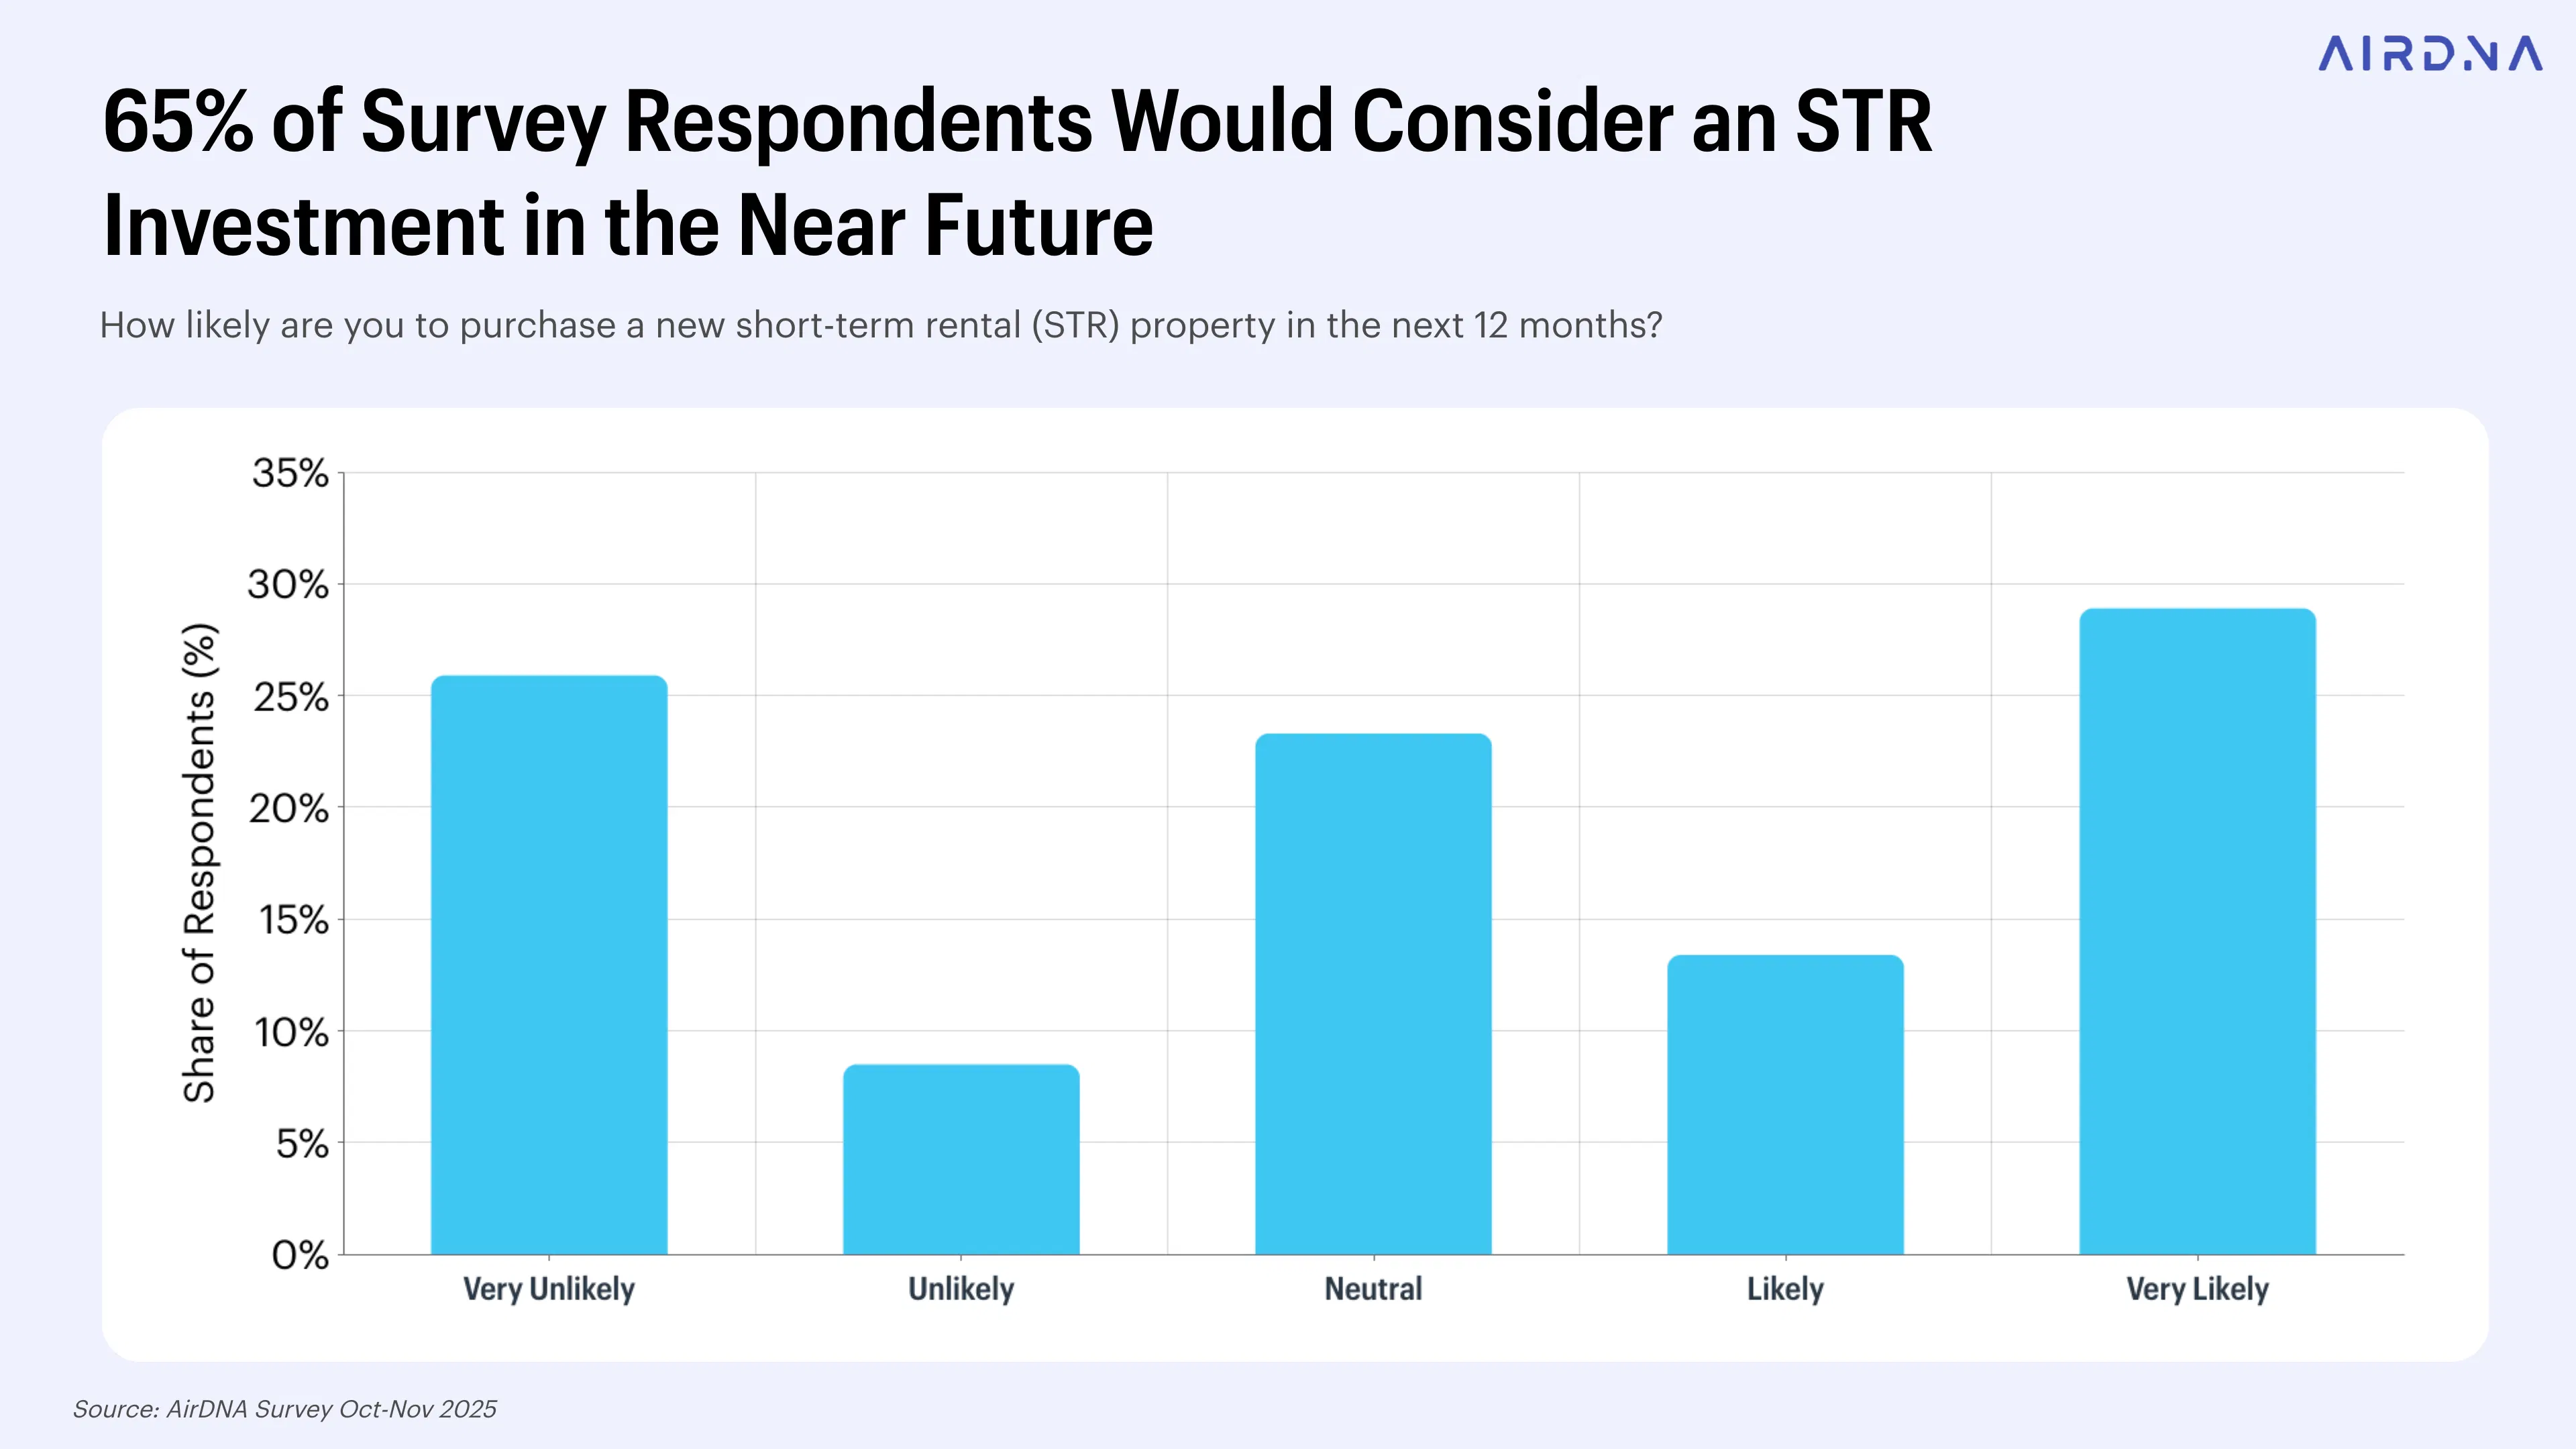
Investor sentiment appears to align with the positive outlook around STR premiums. In October 2025, AirDNA surveyed its client base, and the results were clear: two-thirds of respondents said they are likely or very likely to invest in the next 12 months—a strong signal that many see 2026 as a window of opportunity.
Supply Growth Returns After Hitting Bottom
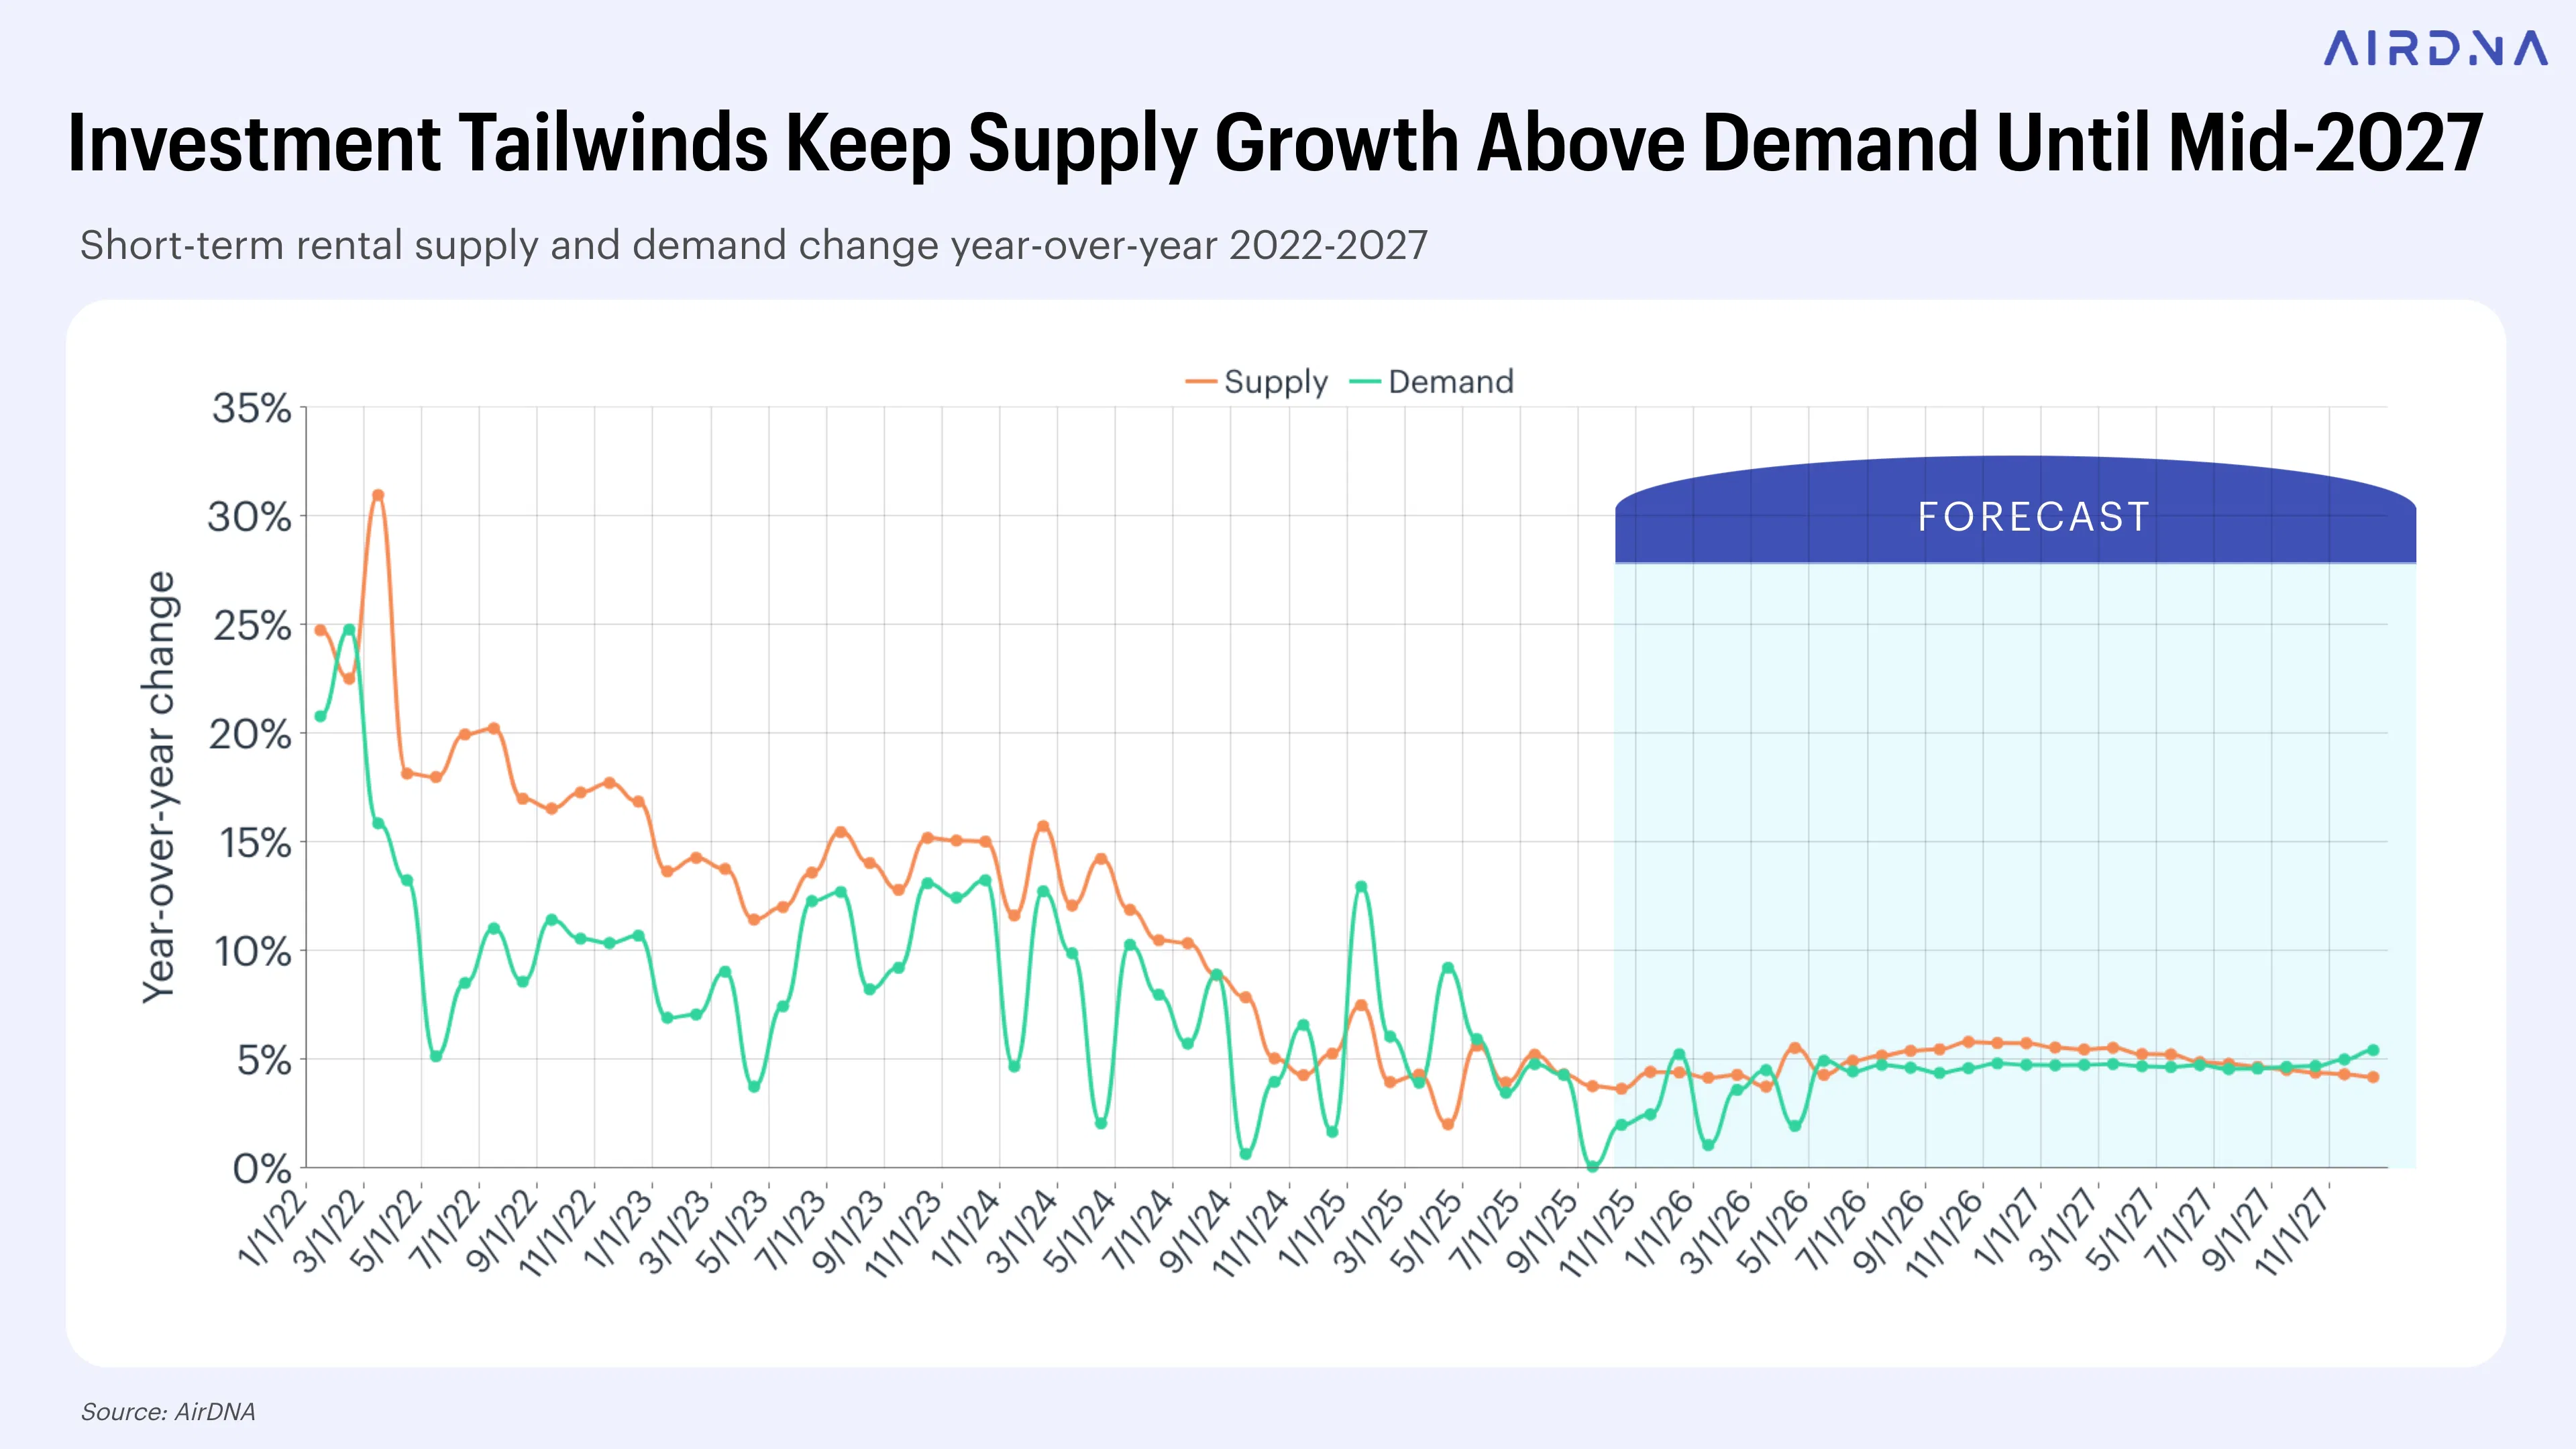
Following the extraordinary STR premiums seen in 2021, supply growth began to outpace demand, pushing occupancy down from record highs to more sustainable levels. That trend reversed in early 2025, when occupancy appeared to bottom out and demand briefly outpaced new supply.
Recent economic turbulence marked by policy shifts and rising uncertainty has started to cool demand once again. Occupancy declined through the summer and into October 2025.
Looking ahead, AirDNA expects this pattern to continue. As mortgage rates fall and the STR premium rises, new supply is likely to pick up modestly in 2026. Additional tailwinds, such as new tax incentives for commercial real estate introduced in the Trump administration’s latest budget bill, are also expected to support new listing growth.
On the demand side, AirDNA expects a gradual recovery as the labor market stabilizes and short-term interest rate cuts begin to stimulate business investment. Fiscal benefits from the new federal budget plan, particularly consumer-facing tax relief, will also begin to materialize in 2026. As a result, demand growth is projected to reverse its slowdown by October.
Occupancy nears a trough before turning upward
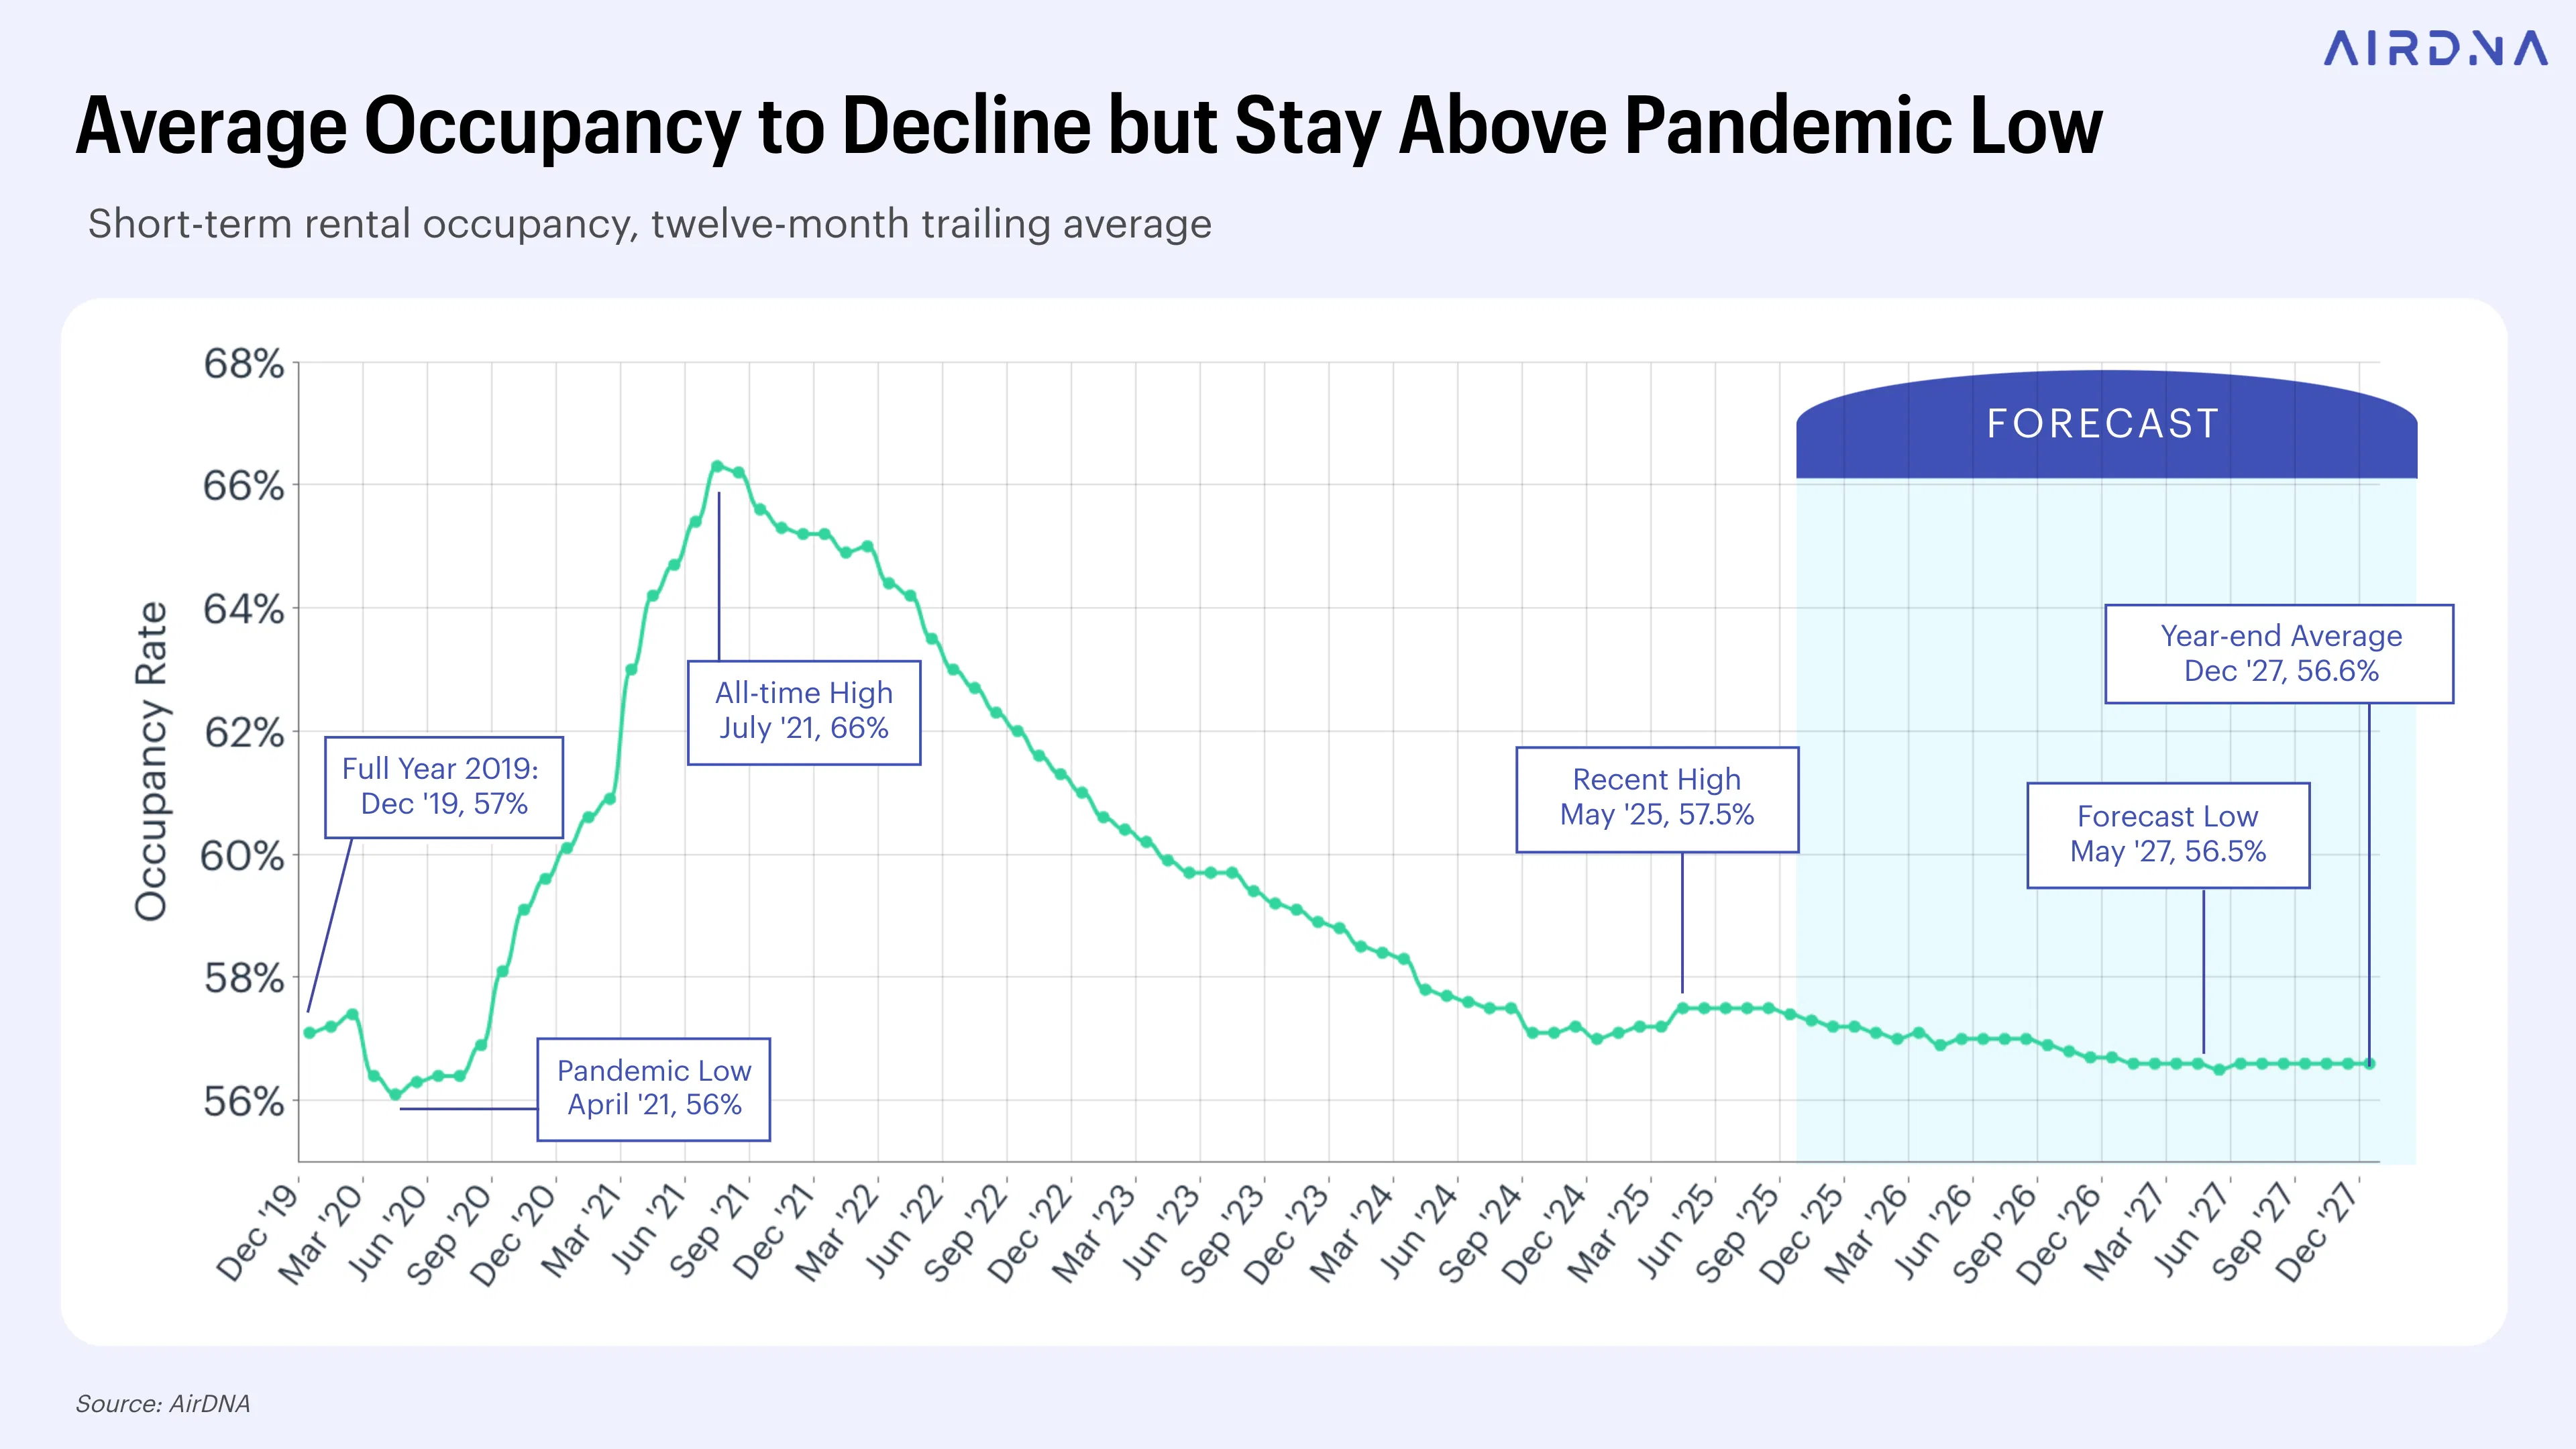
Looking at the longer trend, occupancy has been on a steady decline since peaking in July 2021, when it hit an all-time high. In the last twelve months, occupancy improved in the first half of the year before stalling during the summer travel season.
Taken together, supply and demand dynamics are expected to push 12-month trailing occupancy down further, reaching a projected low of 56.5% in May 2027 before increasing again. That figure sits below 2019 levels but still above the pandemic-era low of 56.1%, indicating a more stabilized, if subdued, market environment.
Coastal & Urban Markets Offer Investment Opportunity
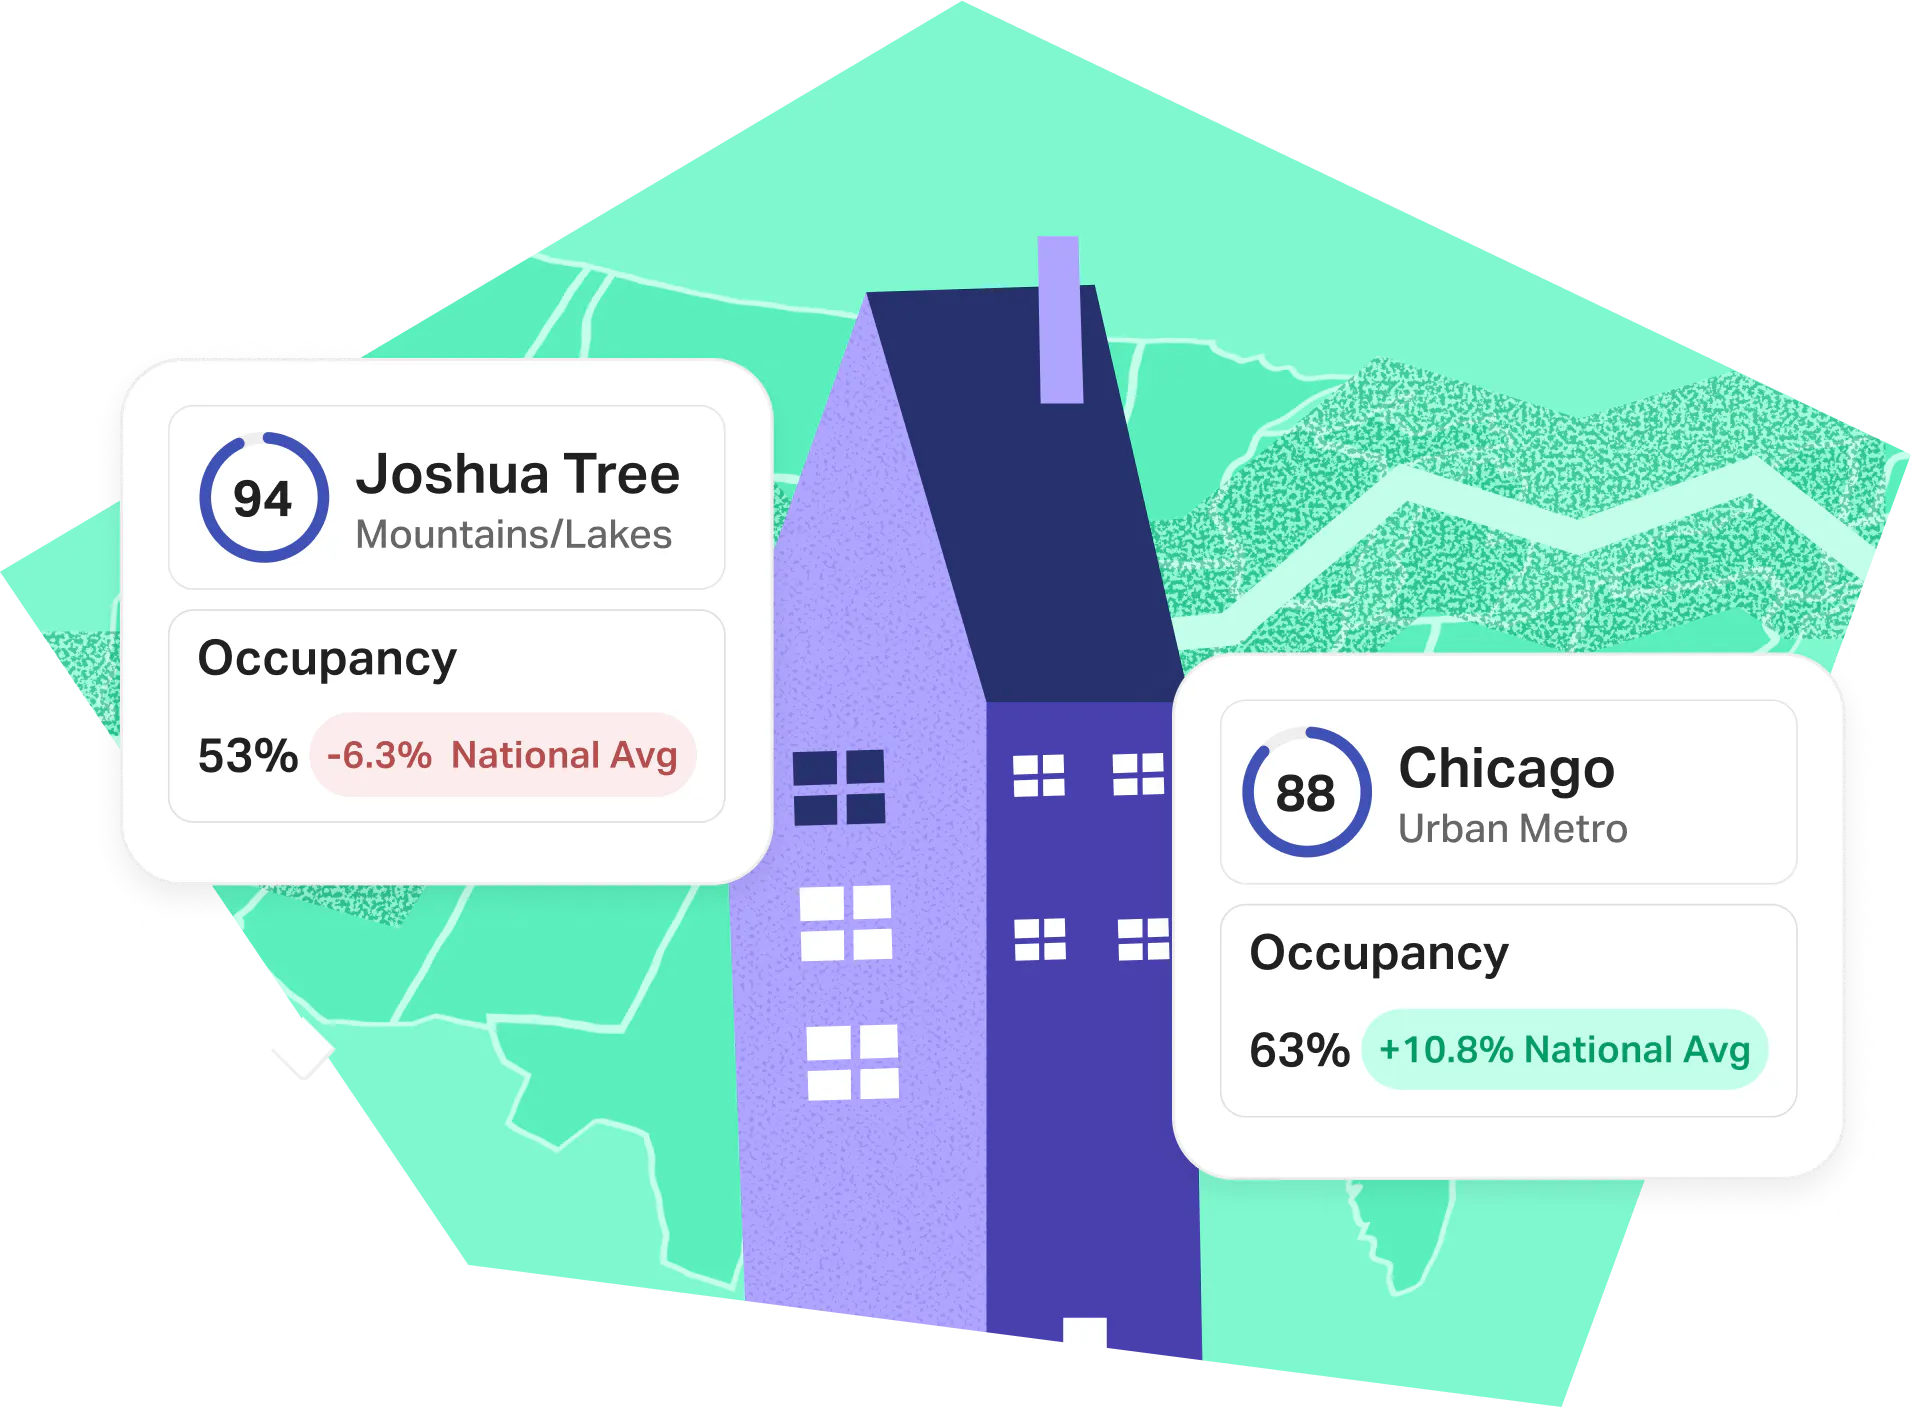
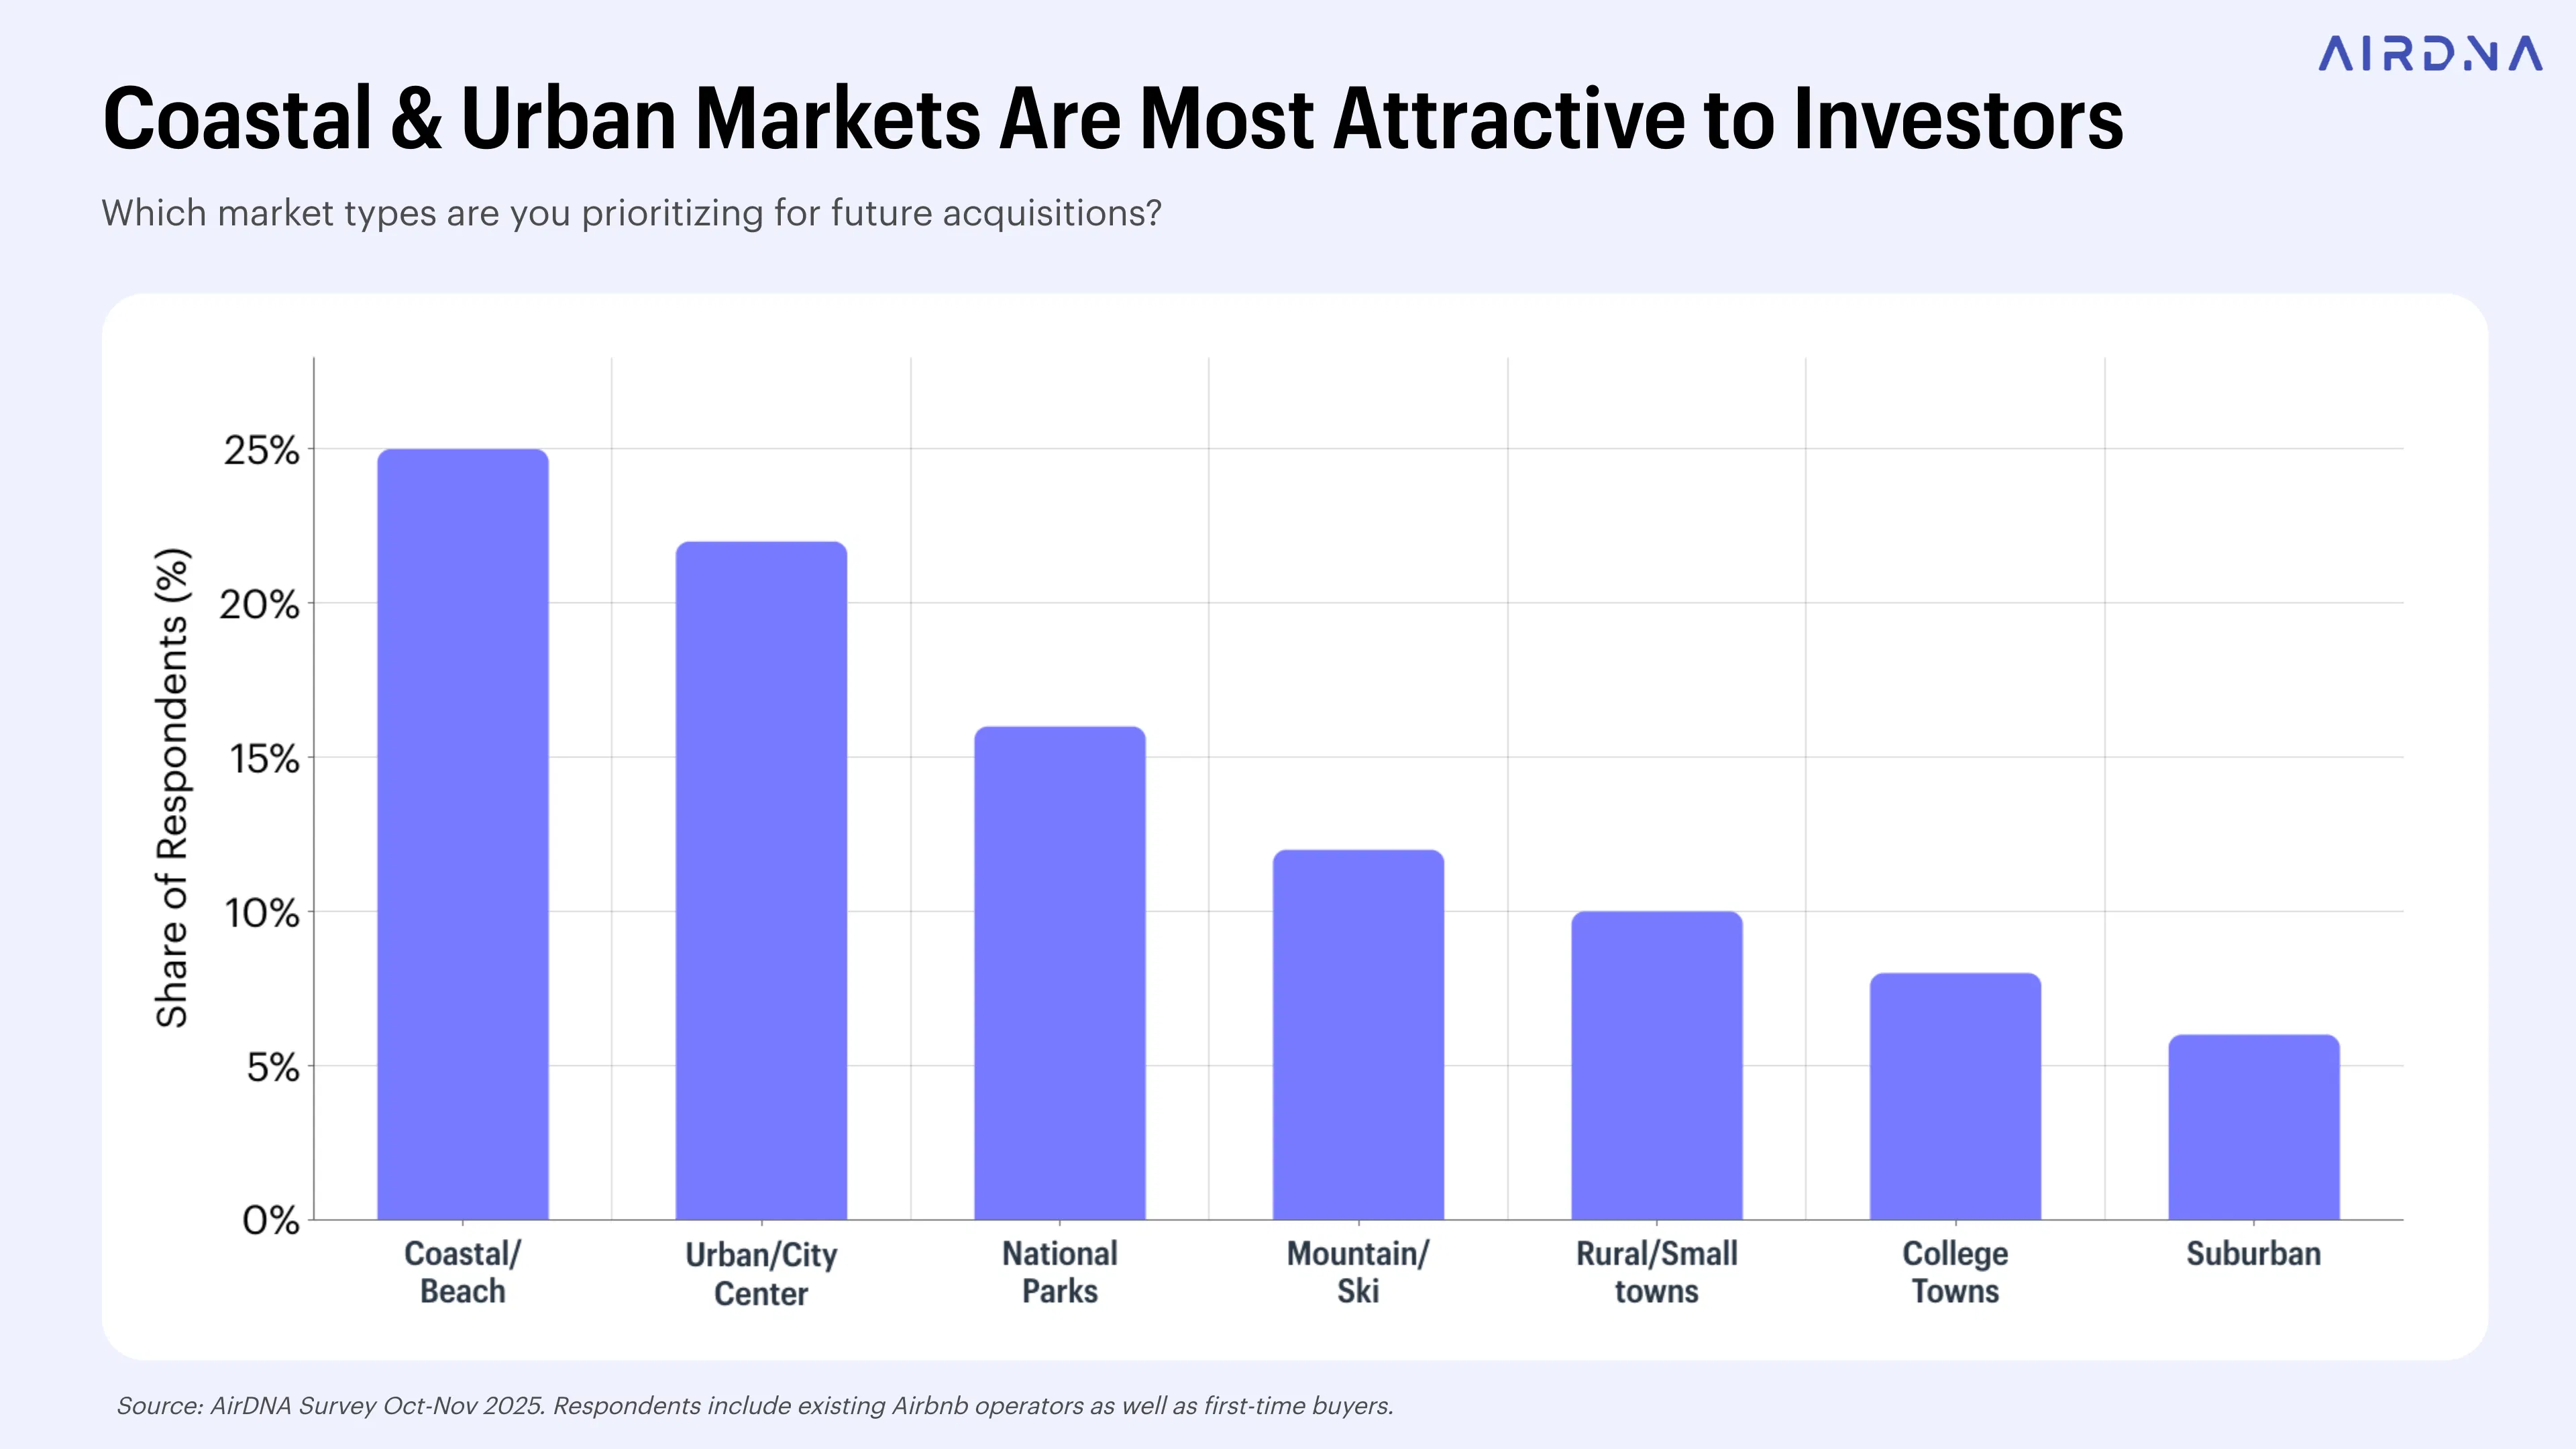
Falling interest rates tend to drive investment activity across the board, but some location types may benefit more than others. According to AirDNA’s investor survey, both first-time buyers and experienced hosts identified coastal markets as the most attractive investment targets, with about a quarter of respondents in each group prioritizing these areas.
Urban markets ranked second overall, and were especially appealing to new entrants: more than a quarter of first-time buyers said they were focused on urban locations, making them nearly as popular as coastal destinations.
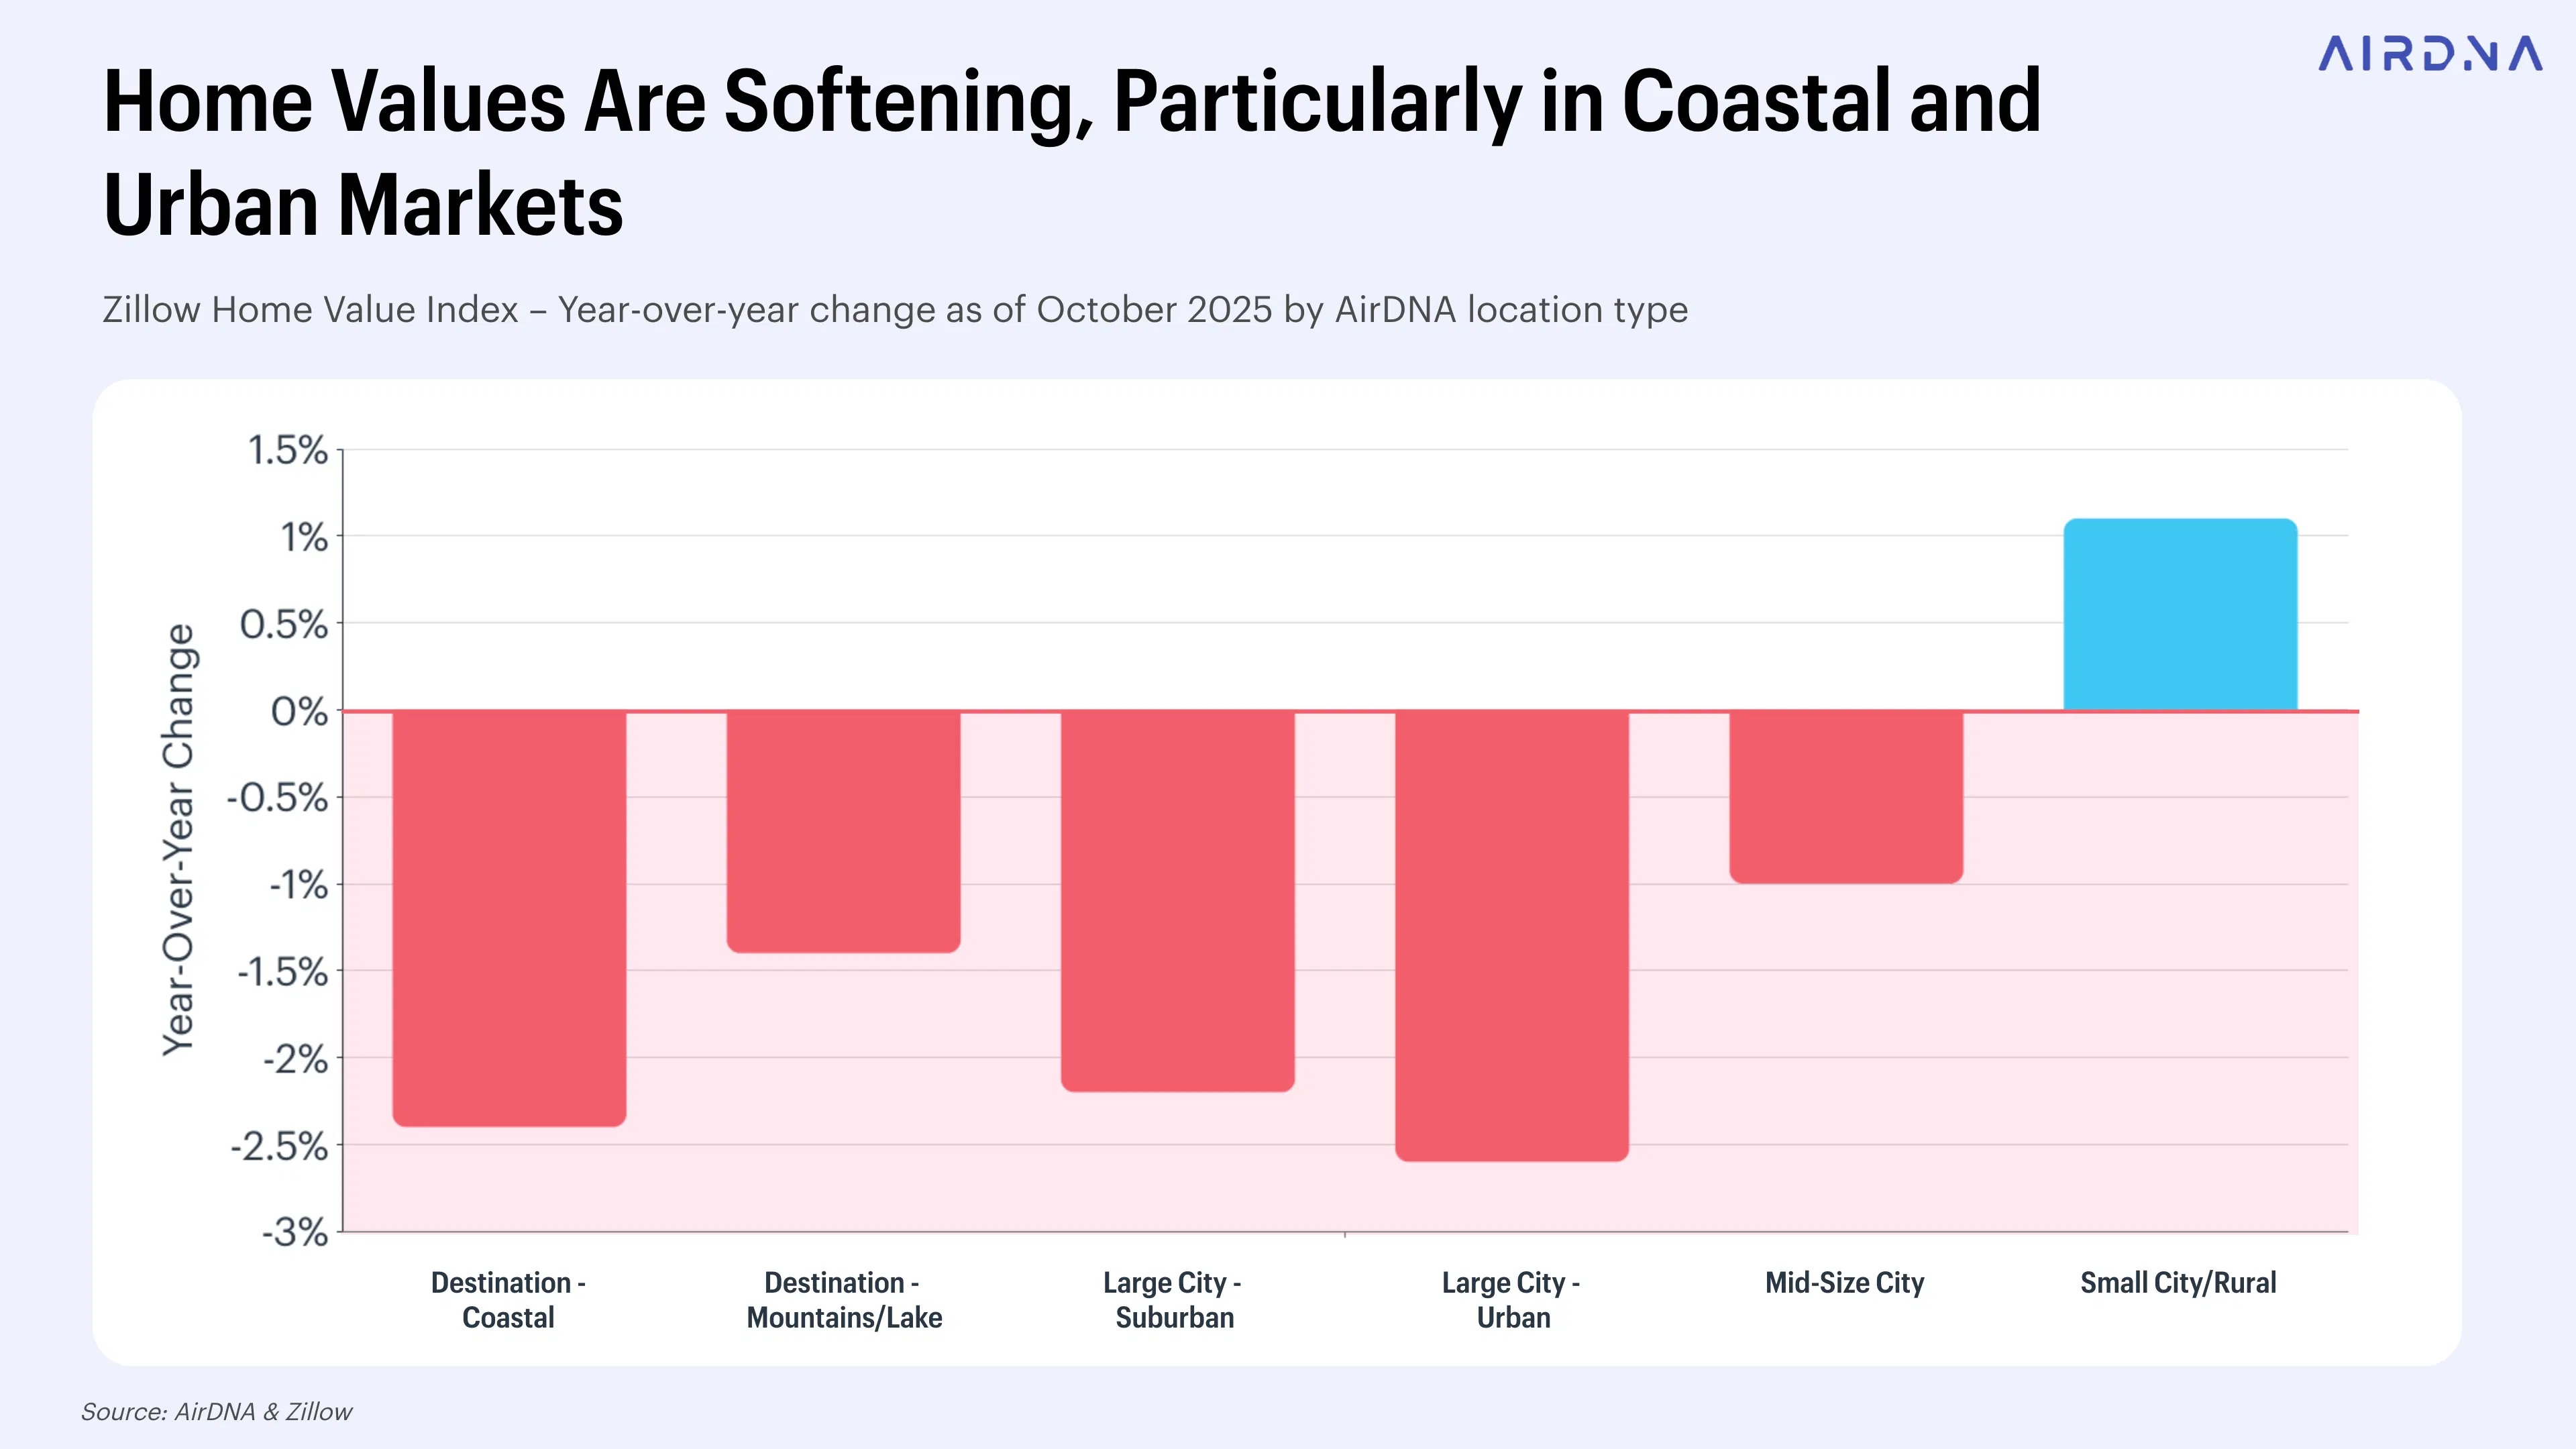
Recent Zillow data shows that home values are softening most in the market types currently favored by STR investors, potentially making entry or expansion more feasible in the months ahead.
Here's how prices have shifted across market types since October 2024:
- Large City Urban markets: - 2.6%
- Coastal markets: -2.4%
- Large City Suburban areas: - 2.1%
- Mountain/Lake resort areas: -1.4%
- Mid-Size Cities: -1.0%
- Small City/Rural areas: +1.1%
While most market types are seeing price declines, Small City/Rural home values are strengthening. Historically, homes in these areas have been significantly cheaper than those in coastal or resort markets. This upward movement may indicate early signs of price convergence across market types.
Supply and Demand Trends by Market Type
AirDNA segments markets into six types based on factors like geography, population size, and population density:
- Large City Urban markets are central city cores in major metropolitan areas. They represent the 50 cities with the largest population count, according to the Metropolitan Statistical Analysis in the U.S.
- Large City Suburban markets are the surrounding suburban neighborhoods within those large metro areas, differentiated from the urban core by population density.
- Mid-Size City markets represent the next 100 locations according to population density that aren’t already included in the Coastal and Mountain Lake market types.
- Small City/Rural markets encompass all other areas in the country that aren’t included in the Coastal and Mountain Lake market types.
The Coastal and Mountain/Lake market types are considered part of a larger destination/resort category. This category represents locations that primarily attract leisure travelers. In many of these markets, short-term rentals serve as the primary form of lodging.
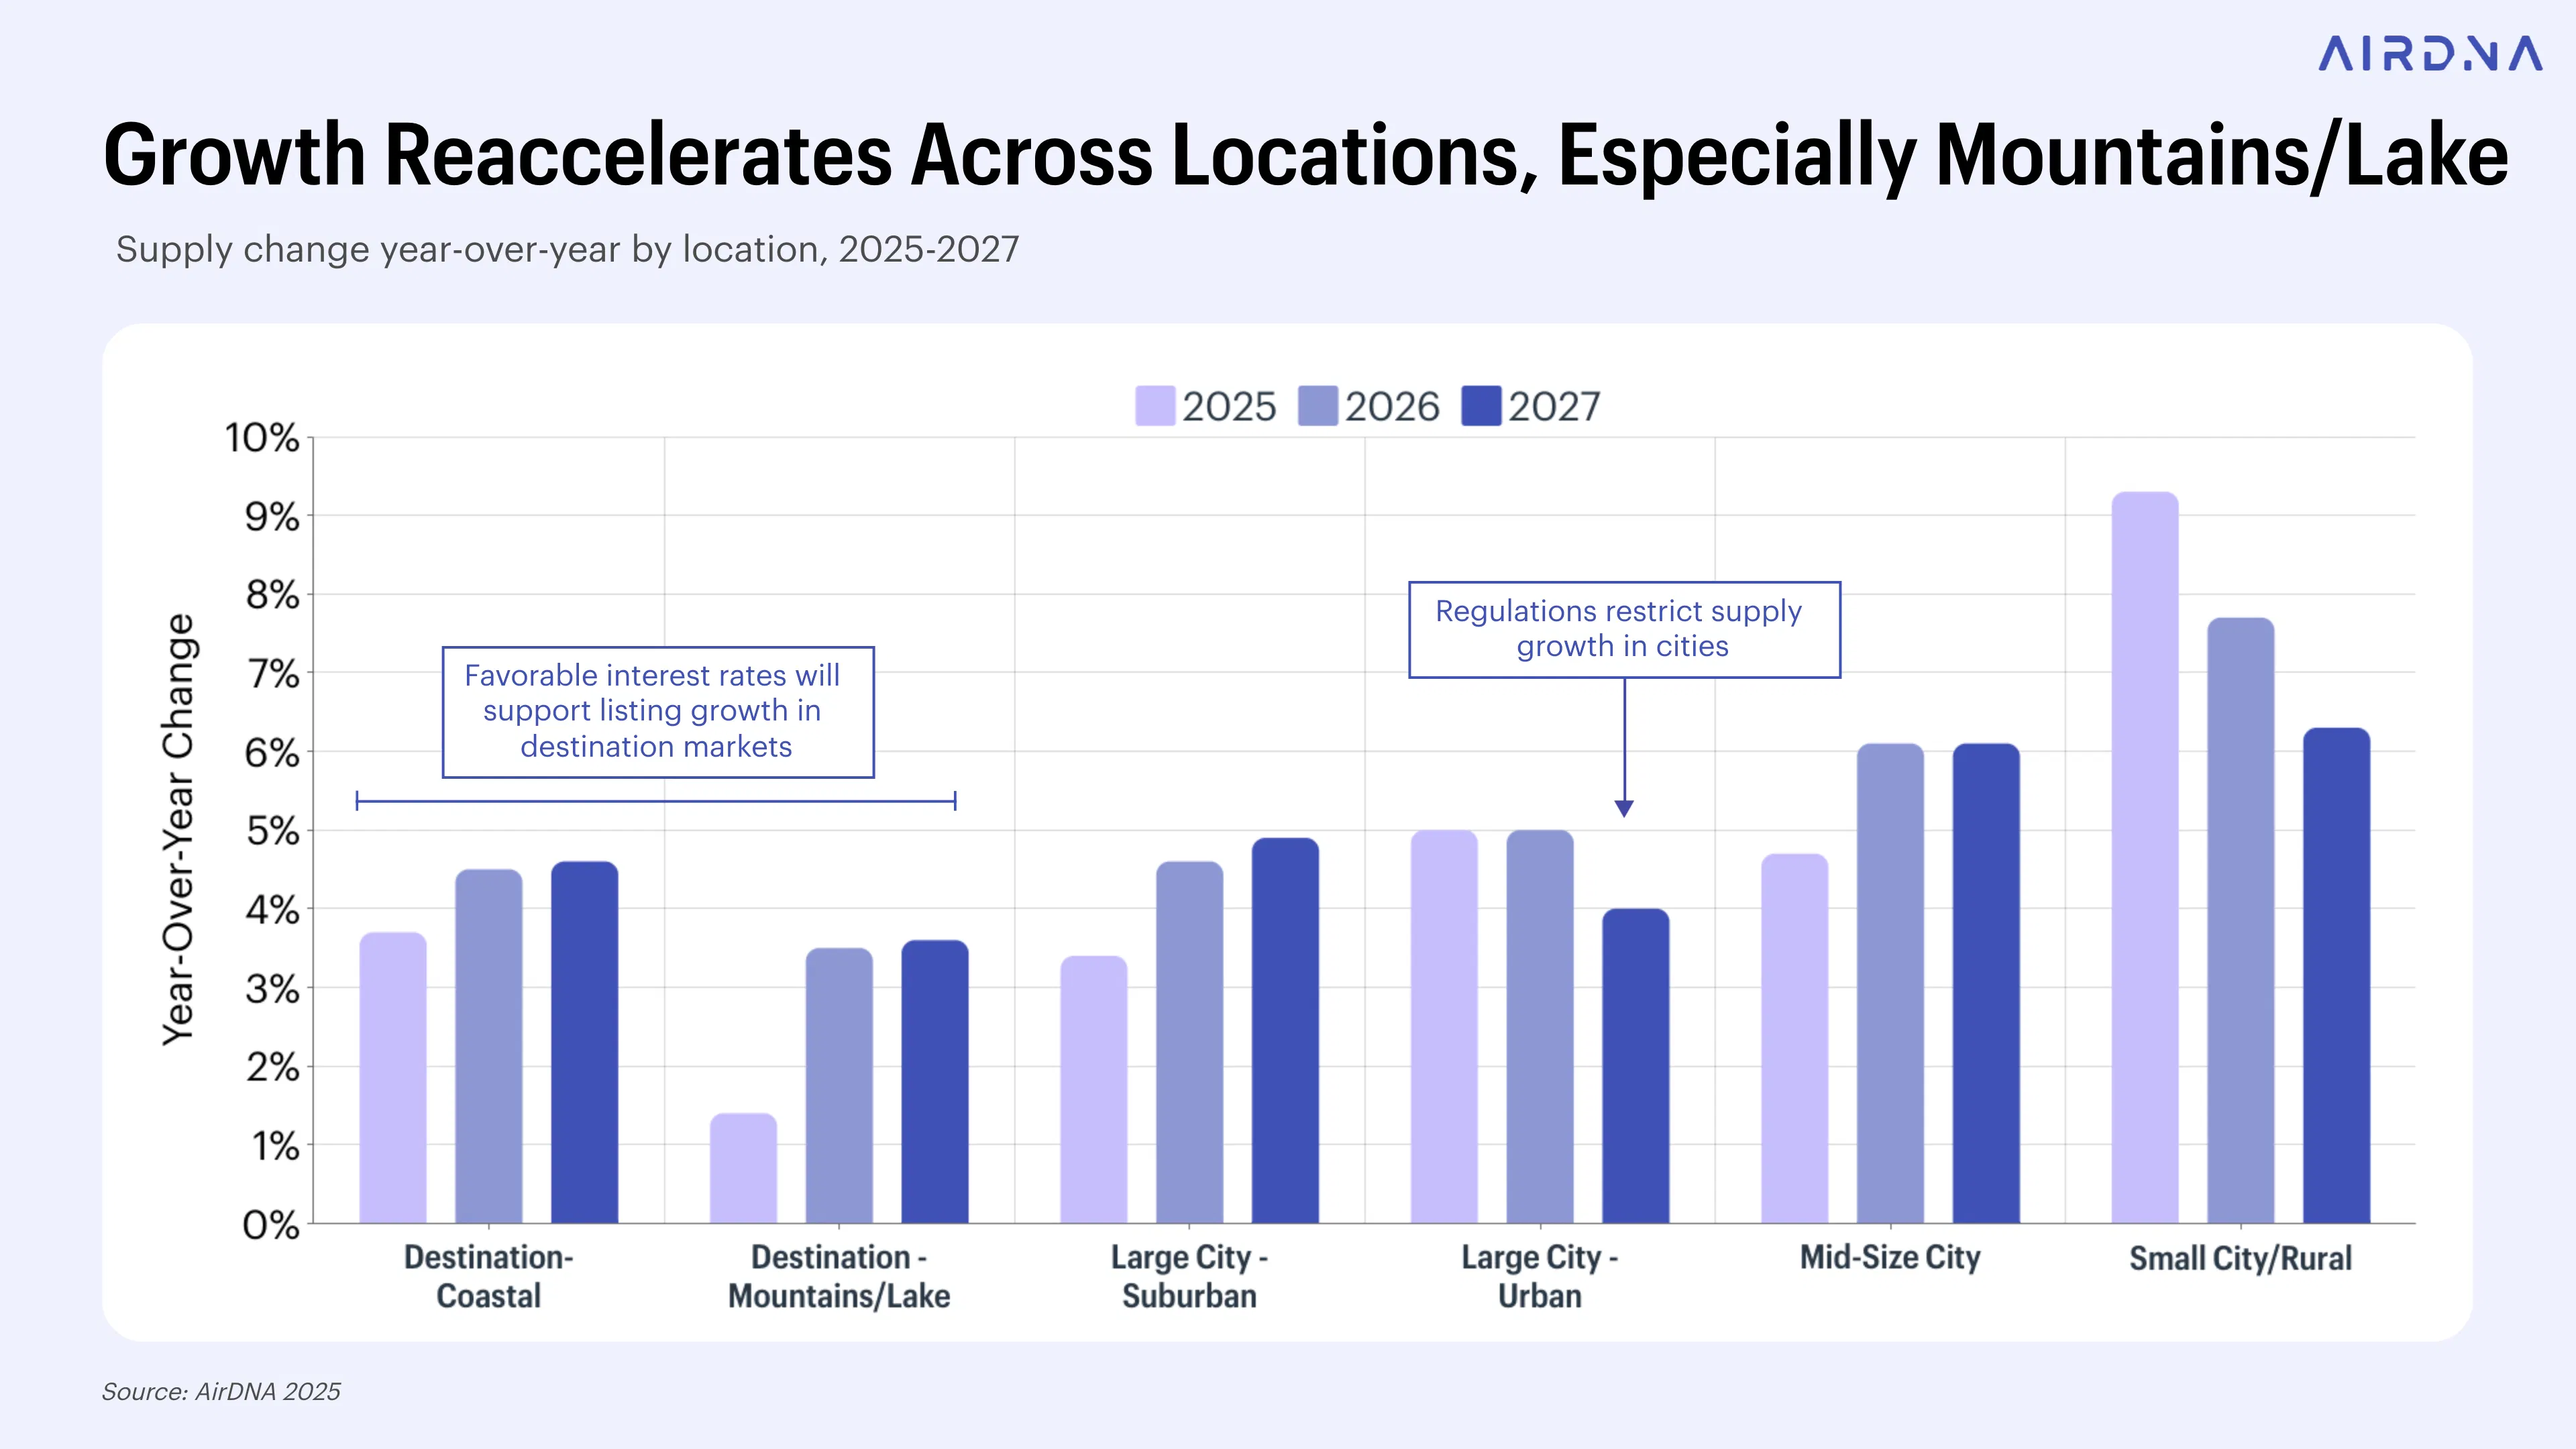
Looking ahead to 2026, STR supply is expected to accelerate in nearly all market types, with the exception of Small City/Rural areas. Supply growth in Coastal markets will increase from +3.7% in 2025 to +4.5% in 2026. In Large City Urban markets, growth ticks up slightly from +4.96% in 2025 to +4.99% in 2026. Urban markets are seeing only marginal supply growth despite declining home prices because of stricter regulations, which tend to limit new listings.
Small City/Rural locations will continue their sharp supply deceleration through 2026 and 2027. These markets led the nation in supply growth shortly after the pandemic began, as affordability and flexible travel preferences drove investor interest. While demand in these areas has also grown rapidly, it hasn’t kept pace with supply. As a result, occupancy rates have been declining since 2022. The runaway growth in Small City/Rural supply will ease to be on par with Mid-Cize Cities by 2027, closing what was once a wide gap.
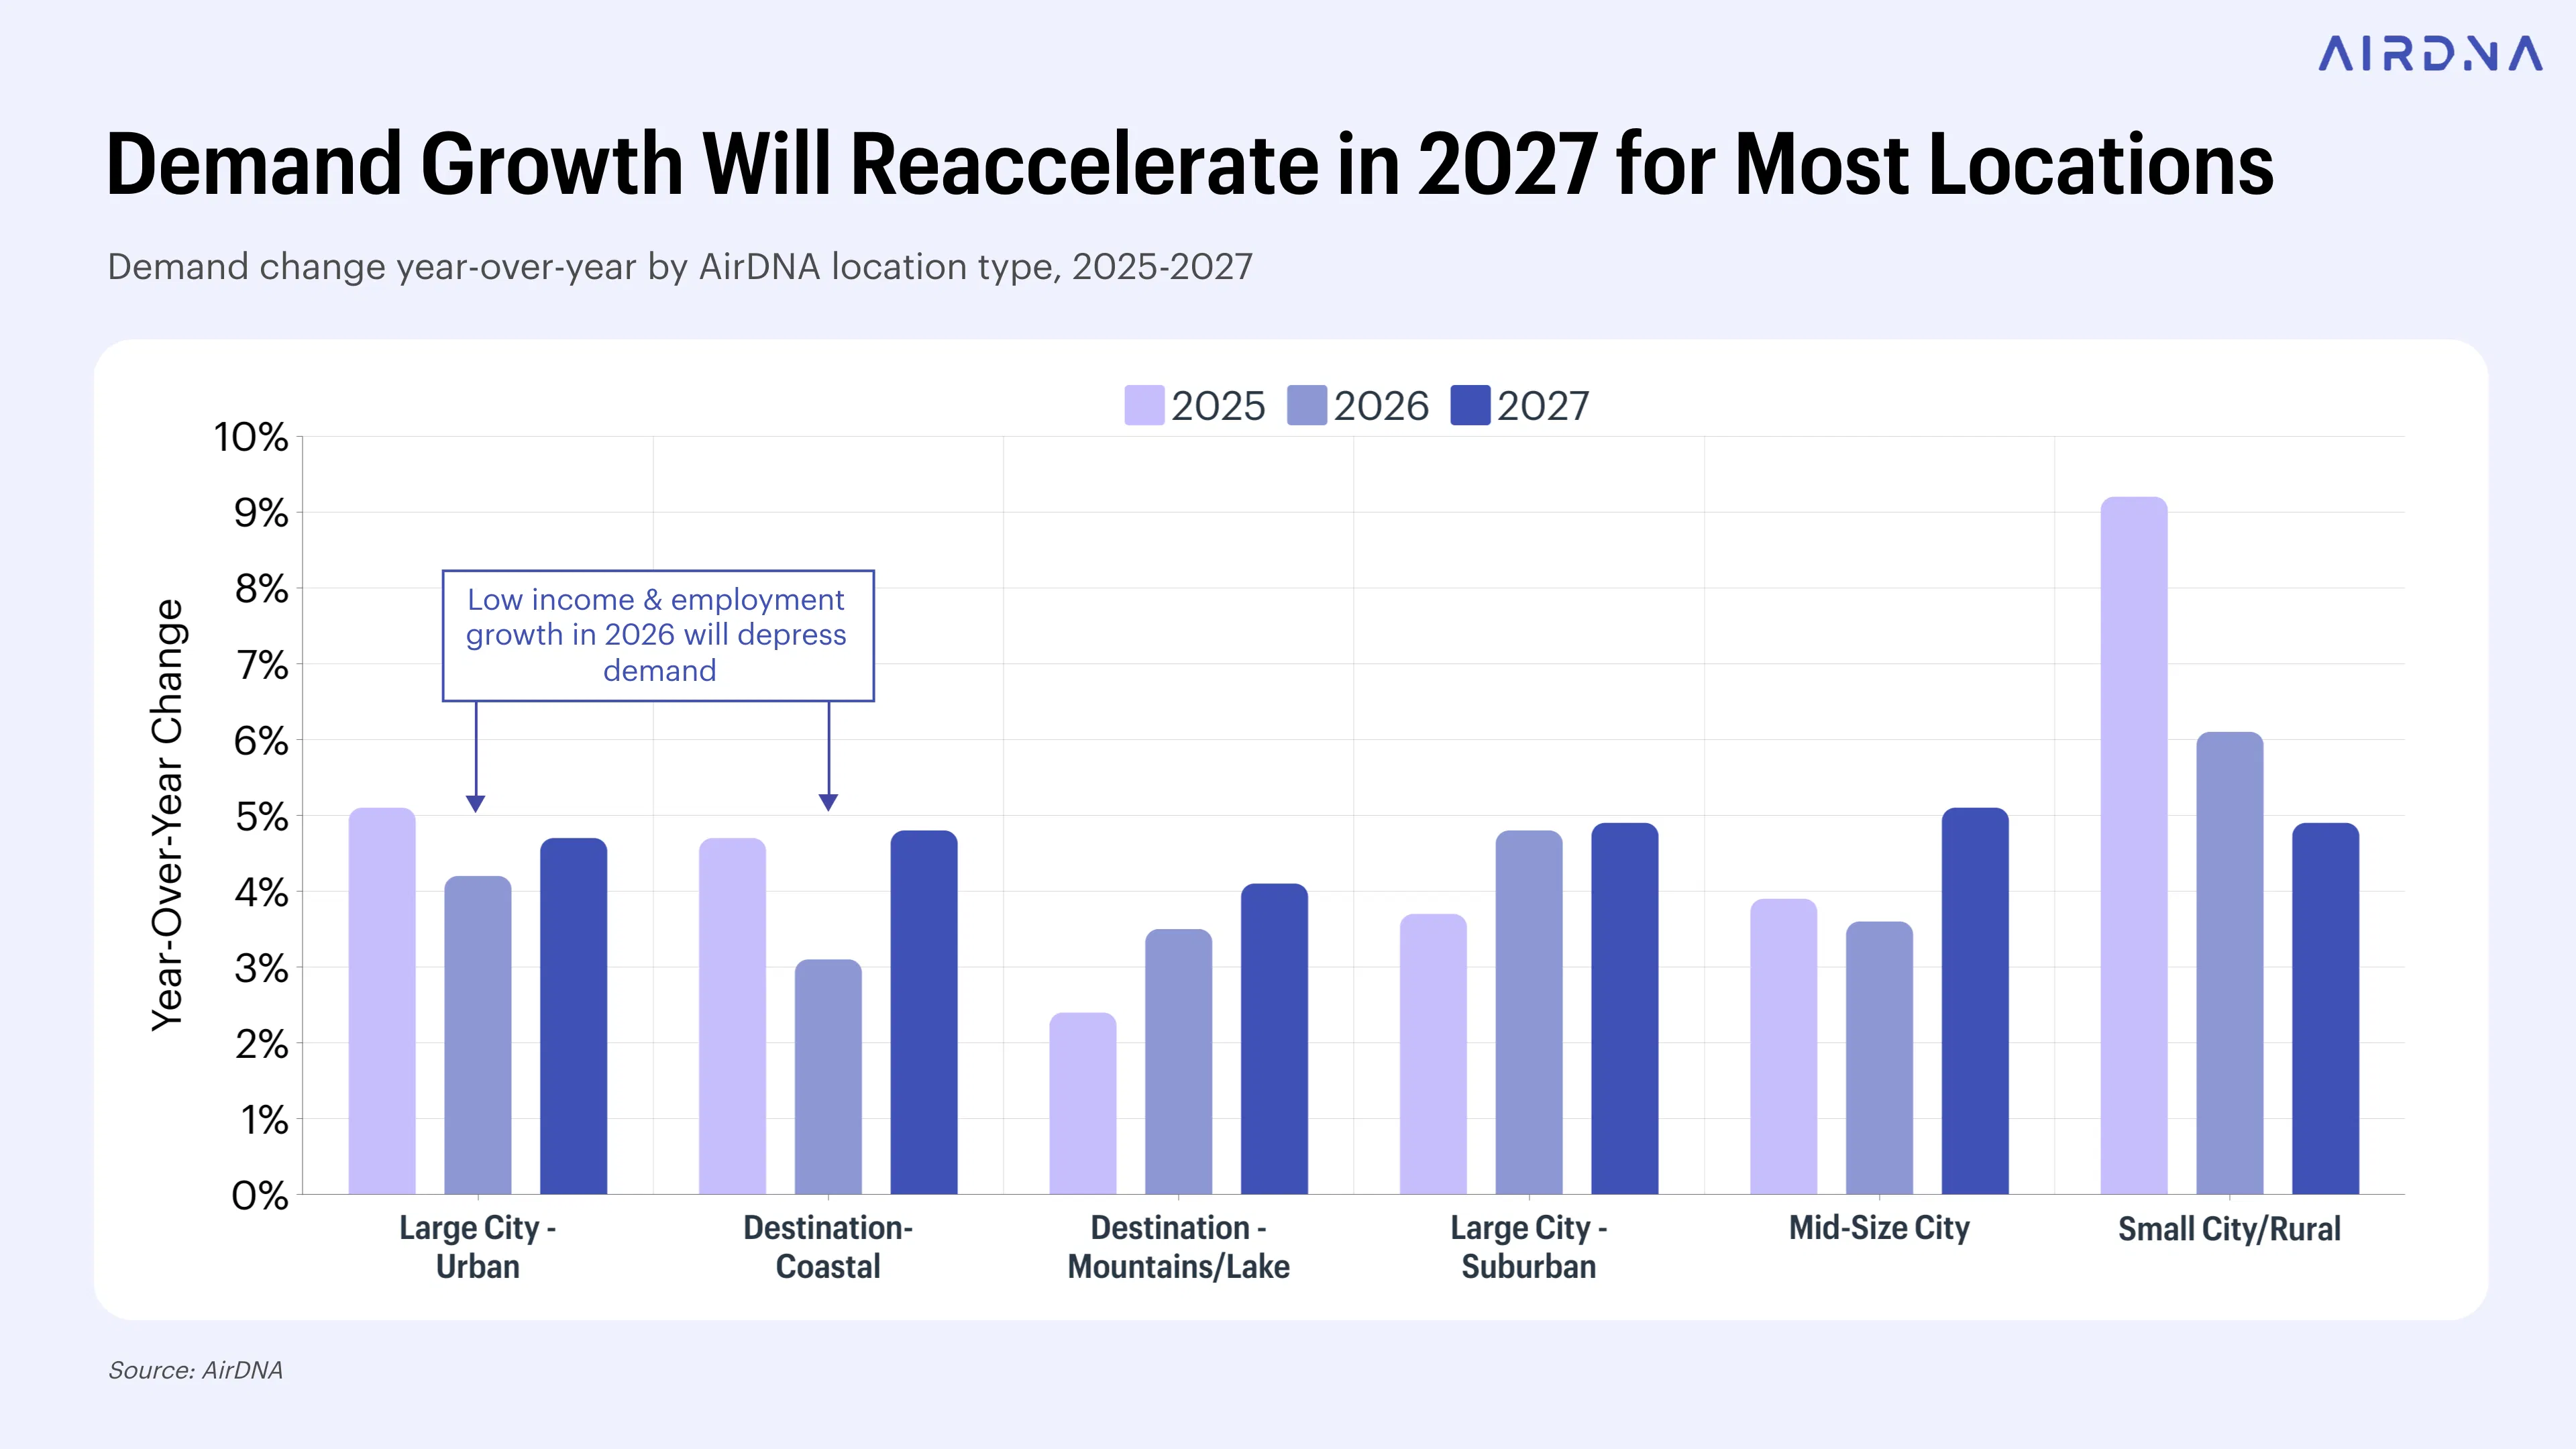
In contrast to supply growth trends that see new listings increase across most locations in 2026 and 2027, demand growth in the coming year is a mixed bag across market types. Slowing income and employment growth will weigh on travel demand in Coastal and Large City Urban locations, creating a further dip in occupancy. Only Large City Suburban markets are projected to see even modest demand growth in 2026, rising to 0.7% from 0.3% in 2025.
Pricing and Revenue Performance
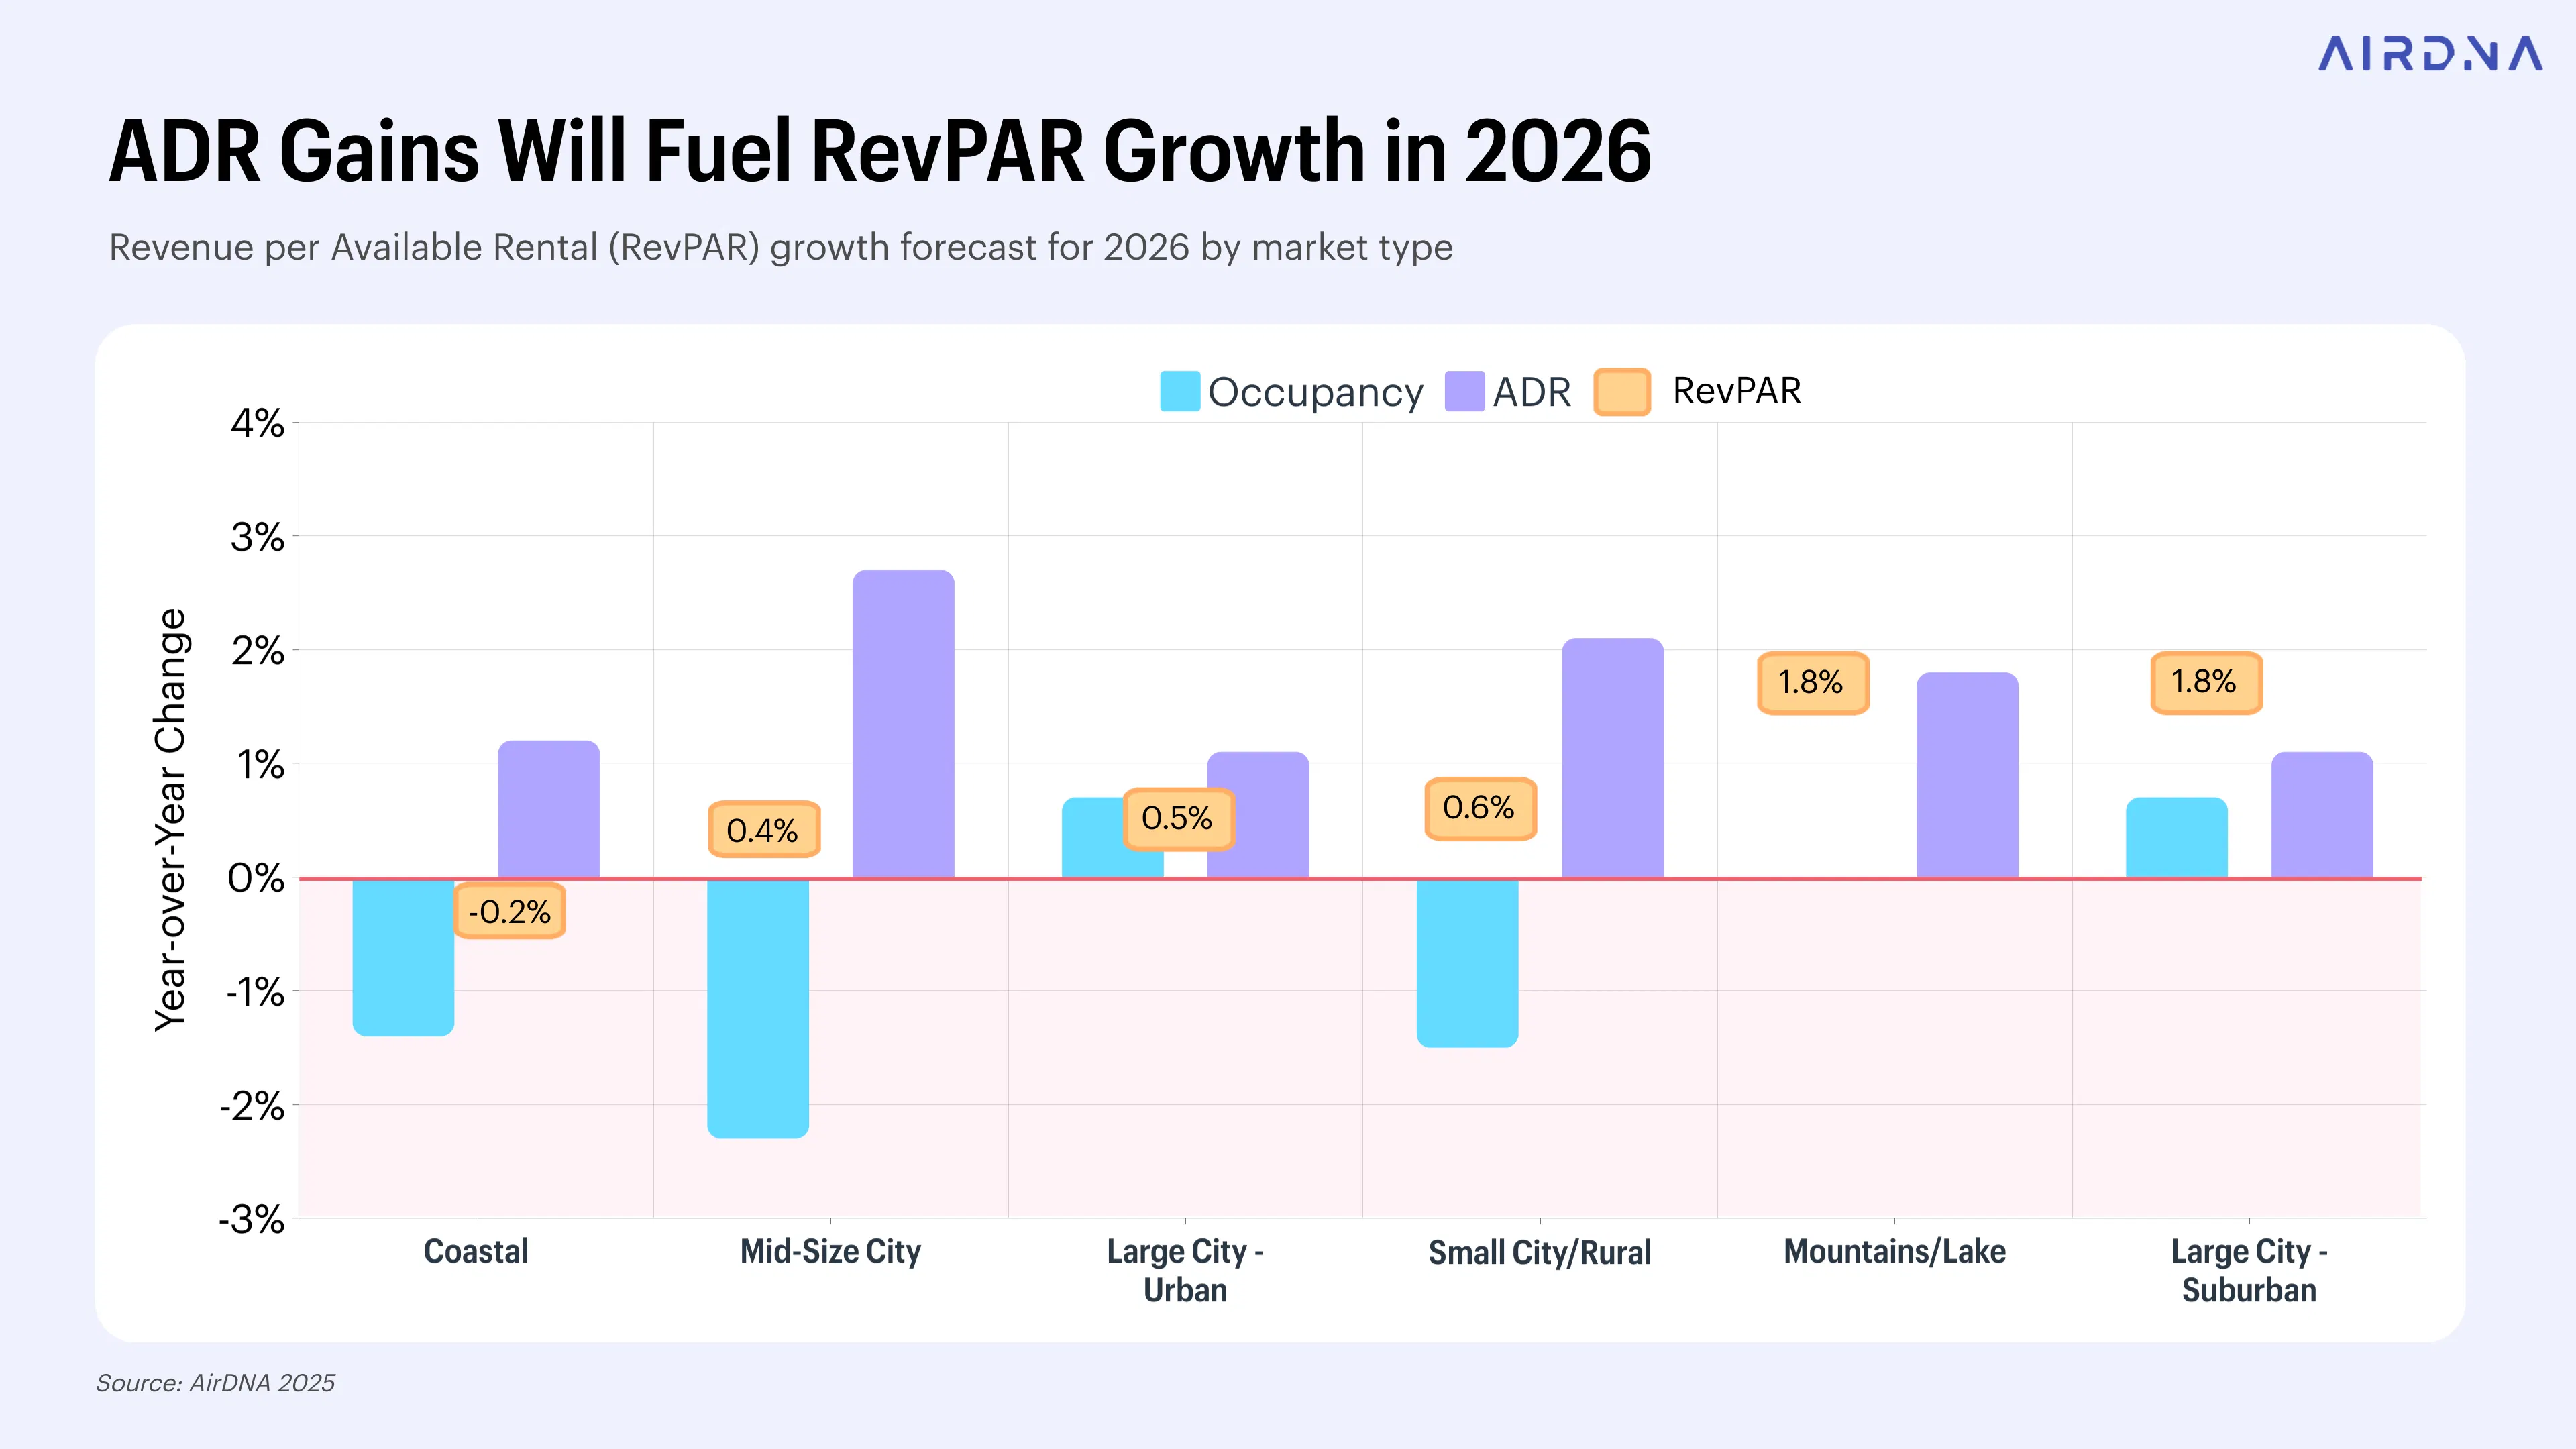
Slowing occupancy will create a small headwind for ADR in 2026, but operators aren’t expected to lose pricing power entirely.
One key factor in the pricing outlook is inflation, which has played an outsized role in STR performance in recent years. Inflation is forecasted to ease from around 3.0% today to 2.5% by the end of 2026, thanks in part to the Federal Reserve’s consistent monetary policy in 2025. The Fed’s steadfastness in the face of political pressure has helped anchor inflation expectations and may cool consumer price growth across the country.
That being said, inflation’s relationship with STR pricing isn’t always straightforward. While rising inflation tends to lift nightly rates over the long term, in the short term, it can suppress ADR. That’s because inflation often weakens consumer confidence and reduces discretionary spending, forcing hosts to lower their rates to get bookings. As inflation falls, households may feel more financial breathing room, creating renewed confidence in travel spending and leaving more room in the budget for short-term rentals.
ADR growth is set to reaccelerate through 2027
While the last few months have seen nightly rates fall, pricing momentum appears to be recovering. Current pacing suggests ADR will end 2025 on a strong note, with +2.9% year-over-year (YOY) growth in December. Rate growth is then expected to slow to just +0.5% in early 2026, but will likely reaccelerate throughout the year as inflation cools and consumer confidence improves—reaching +2.8% YOY by the end of 2027.
ADR growth is also expected to stay slightly ahead of the AirDNA Repeat Rent Index (RRI), a proprietary measure that tracks repeat rent performance for comparable STR listings over time. In other words, while the RRI reflects underlying rent stability for consistent properties, ADR growth will benefit from new listings entering the market at a premium.
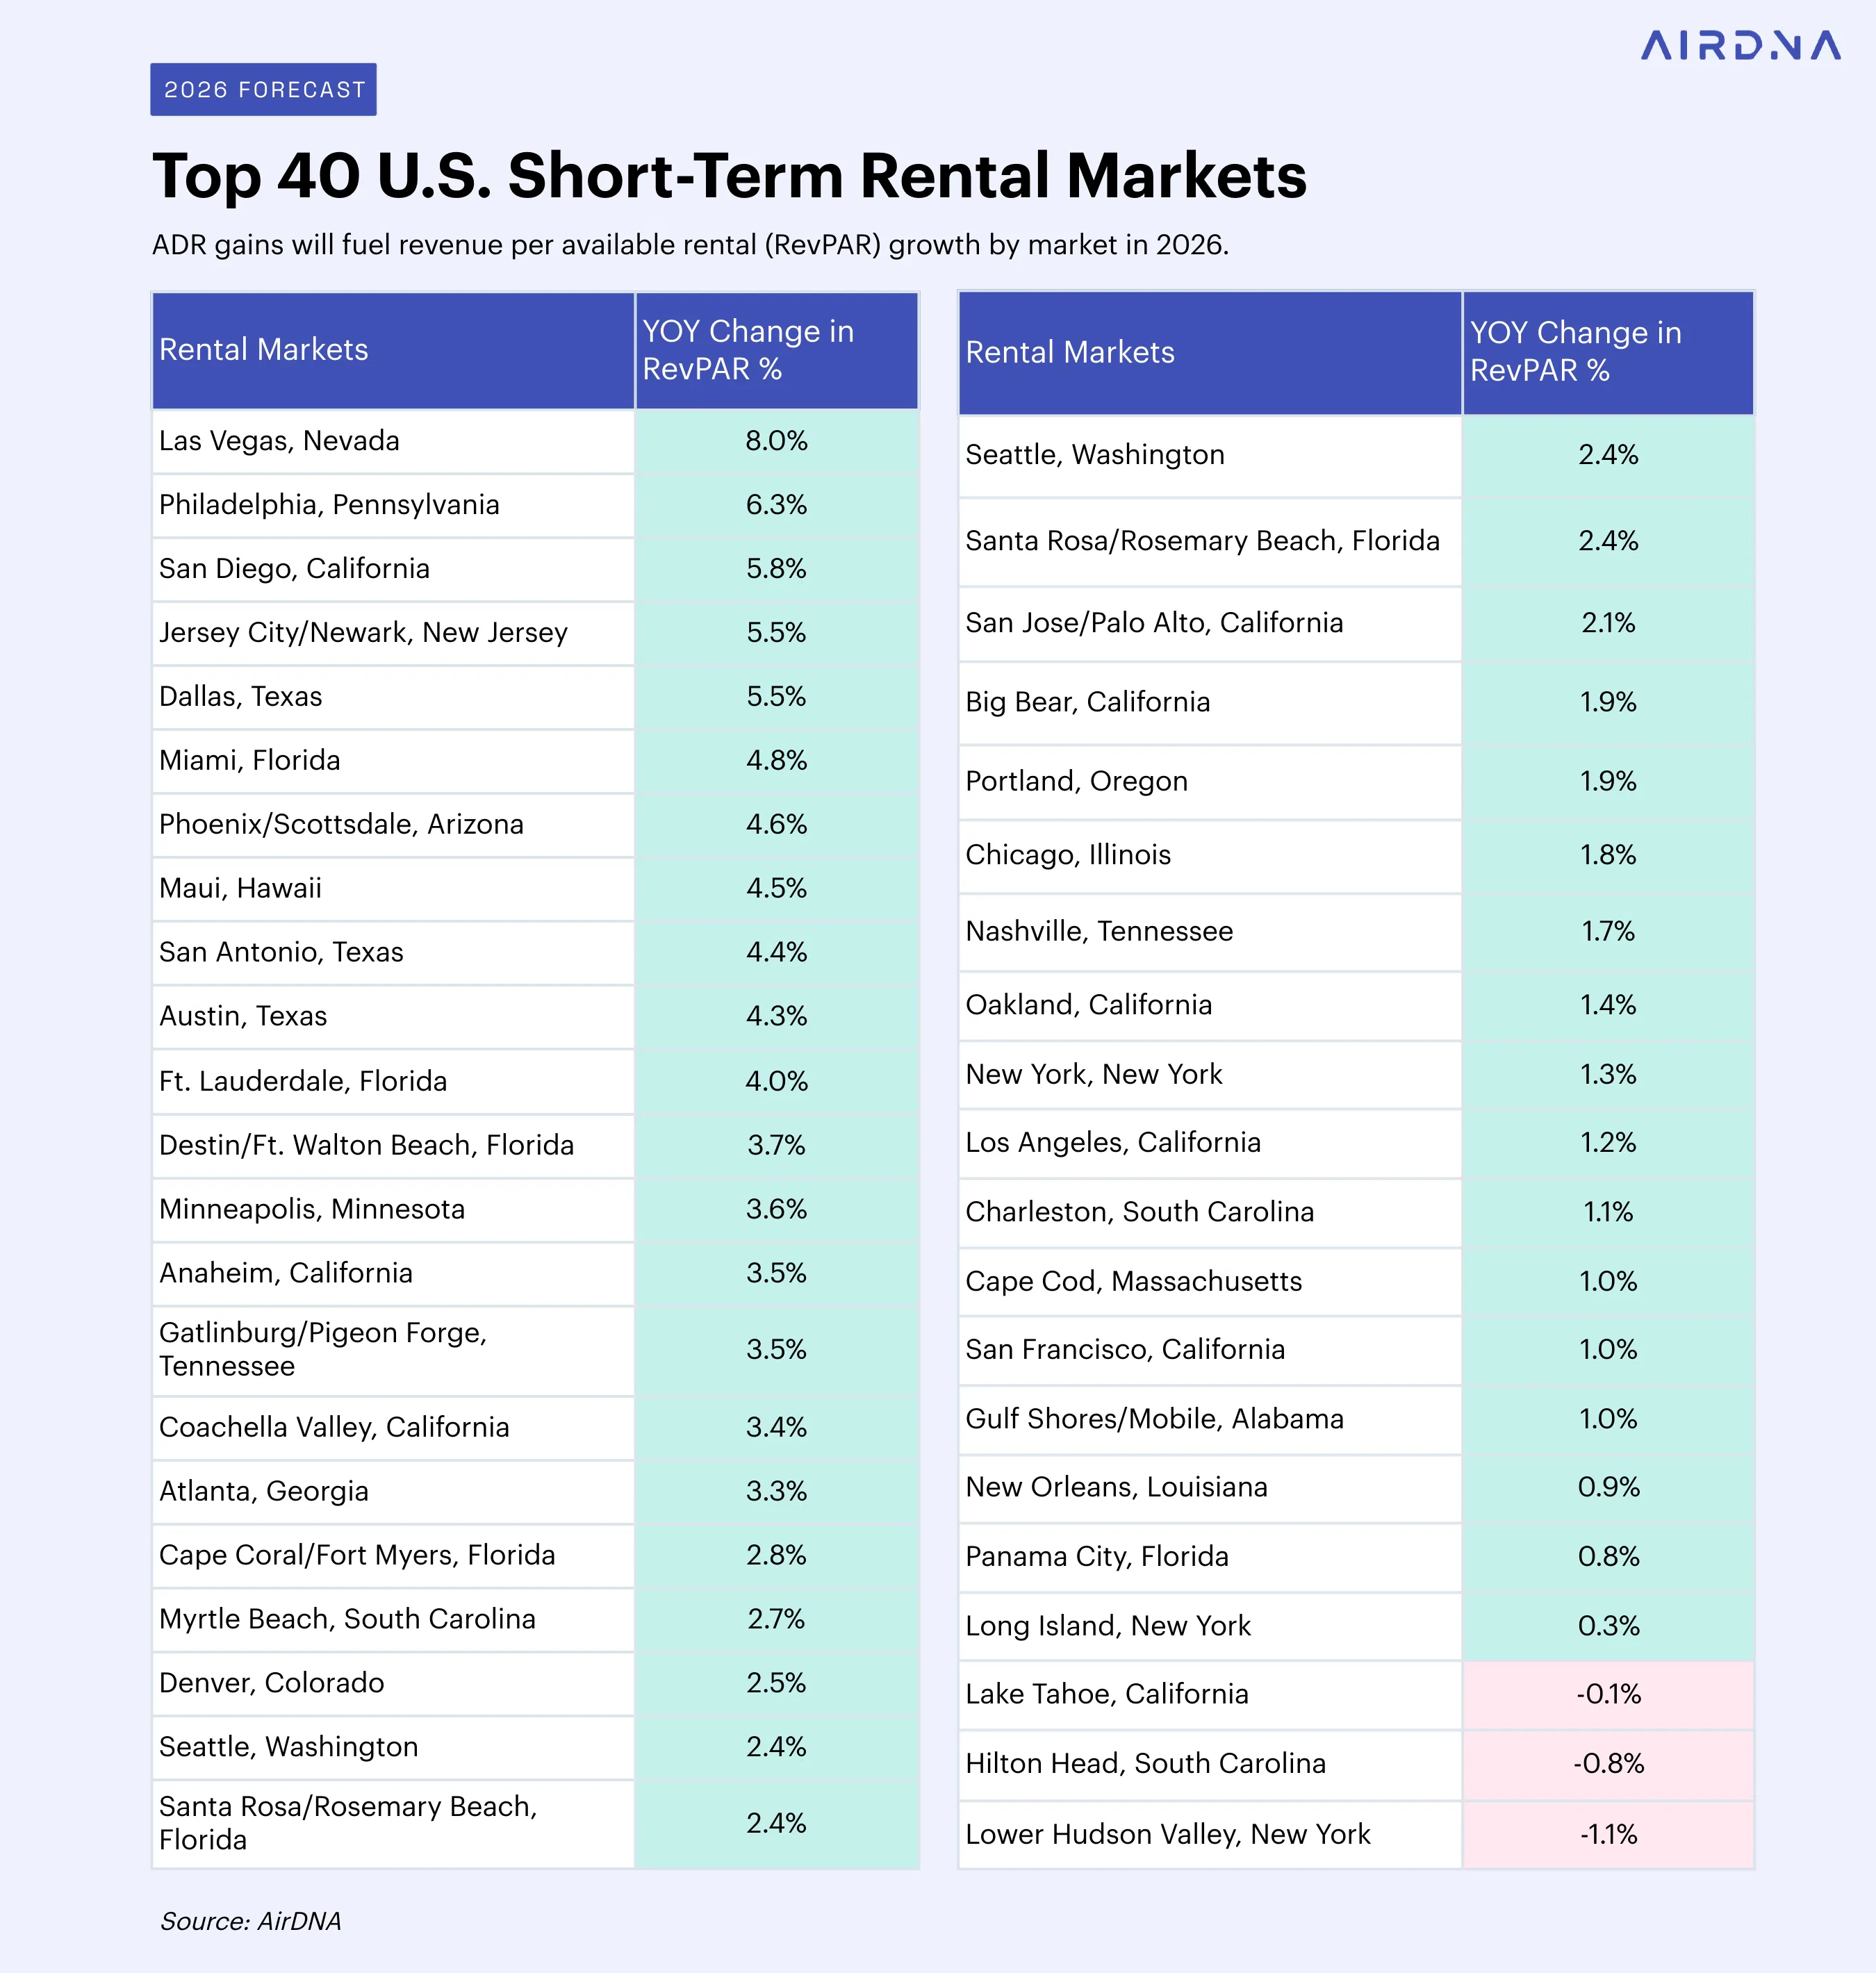
At the market level, 2026 RevPAR growth will depend more on pricing power than occupancy, which is projected to decline in 38 of the top 50 U.S. markets. One key exception is Las Vegas, which is expected to lead the nation with +8.1% RevPAR growth. There, supply growth has slowed sharply following oversaturation in 2024 and 2025, which led to shrinking occupancy.
Demand is also rebounding in Las Vegas, helped by price cuts in 2025 and spillover potential from World Cup travel to Los Angeles. Together, slowing supply and rebounding demand should drive a +2.6% YOY increase in occupancy and +5.4% in ADR recovery to reach $242, just shy of 2024’s $245 average.

Several other FIFA World Cup host cities are also expected to post strong RevPAR growth in 2026:
- Philadelphia: +6.3%
- Jersey City/Newark (World Cup Final host): +5.6%
- Dallas: +5.5%
- Miami: +4.8%
While the World Cup is likely to provide a significant boost to these markets, it’s worth noting that many were already performing well before the event.
Houston, another host city, is expected to reverse its current demand shrinkage, but oversupply will likely constrain occupancy and pricing gains. For more complete and up-to-date information about World Cup pacing and activity, be sure to visit AirDNA’s World Cup Dashboard.