

 Calculate Revenue
 Research Markets
 Find For Sale Properties
 Compare My Listing
 STR Revenue Calculator
 Custom Comp Sets
 Submarket Insights
 Custom Search Filters
 Rate Recommendations
 Performance Benchmarking
 Competitor Comparison
 Owner Contact Details
 Property-level performance data
 Tourism Insights
 Real Estate Investment Analytics
 About Us
 Sales
Sales Support
 Press
PressViewing the 2024 Solar Eclipse Through a STR Lens: Trends and Takeaways
Published: April 4, 2024
Last updated: February 24, 2025

Jamie Lane
Key Takeaways:
- Cities in the 2024 solar eclipse path saw occupancy rates surge to 88%, demonstrating the significant impact of unique events on STR demand.
- ADR modestly increased outside the eclipse path but significantly by 18.4% within it, showing the potential for dynamic pricing during special events.
- The eclipse underscores the need for STR hosts to adopt predictive positioning, dynamic pricing, and tailored marketing for future unique events.
Short-term rental hosts are gearing up for a day when the sun's absence is their brightest moment.
On Monday, North America will witness a total solar eclipse, an event surpassing the scale and duration of its 2017 predecessor. Starting on Mexico’s Pacific coast, it will traverse through Texas, sweep across 14 other U.S. states, and exit over Canada.
With the moon cloaking the sun for up to 4 minutes and 28 seconds, cities such as Dallas, Indianapolis, and Cleveland will be directly under the path of totality. The path of totality is the stretch where the moon appears between the earth and the sun and blocks the sun completely.
An unprecedented number of spectators are expected, with approximately 44 million people living within the path and hundreds of millions more within driving distance. This potentially makes it the continent’s most extensive eclipse viewership.
When nature puts on a headline act, travelers are more than willing to come from far and wide.
This rare astronomical event has significantly impacted the short-term rental (STR) market. Cities and towns located within and near the path of the eclipse have experienced a surge in demand as millions seek the perfect vantage point to view the event.
Although the opportunity to capitalize on this specific eclipse has passed (everyone’s pretty much locked and loaded!), it’s crucial to understand the emerging patterns. Short-term rental owners can use this knowledge to prepare for future events, develop pricing strategies, and leverage local attractions or events to enhance occupancy and revenue.
The Magnitude of Eclipse Demand
While AirDNA’s initial investigations into the pace of eclipse demand focused on a few locations— Dallas and Austin, for instance—interest in viewing the eclipse from the path of totality has increased and spilled over into a broad swath of potential viewing spots.
AirDNA has identified 2,332 cities in Mexico, the U.S., and Canada in the path that have active STR listings in an effort to quantify this event's effect. Collectively, these cities host more than 110,000 active listings during the week of the eclipse.
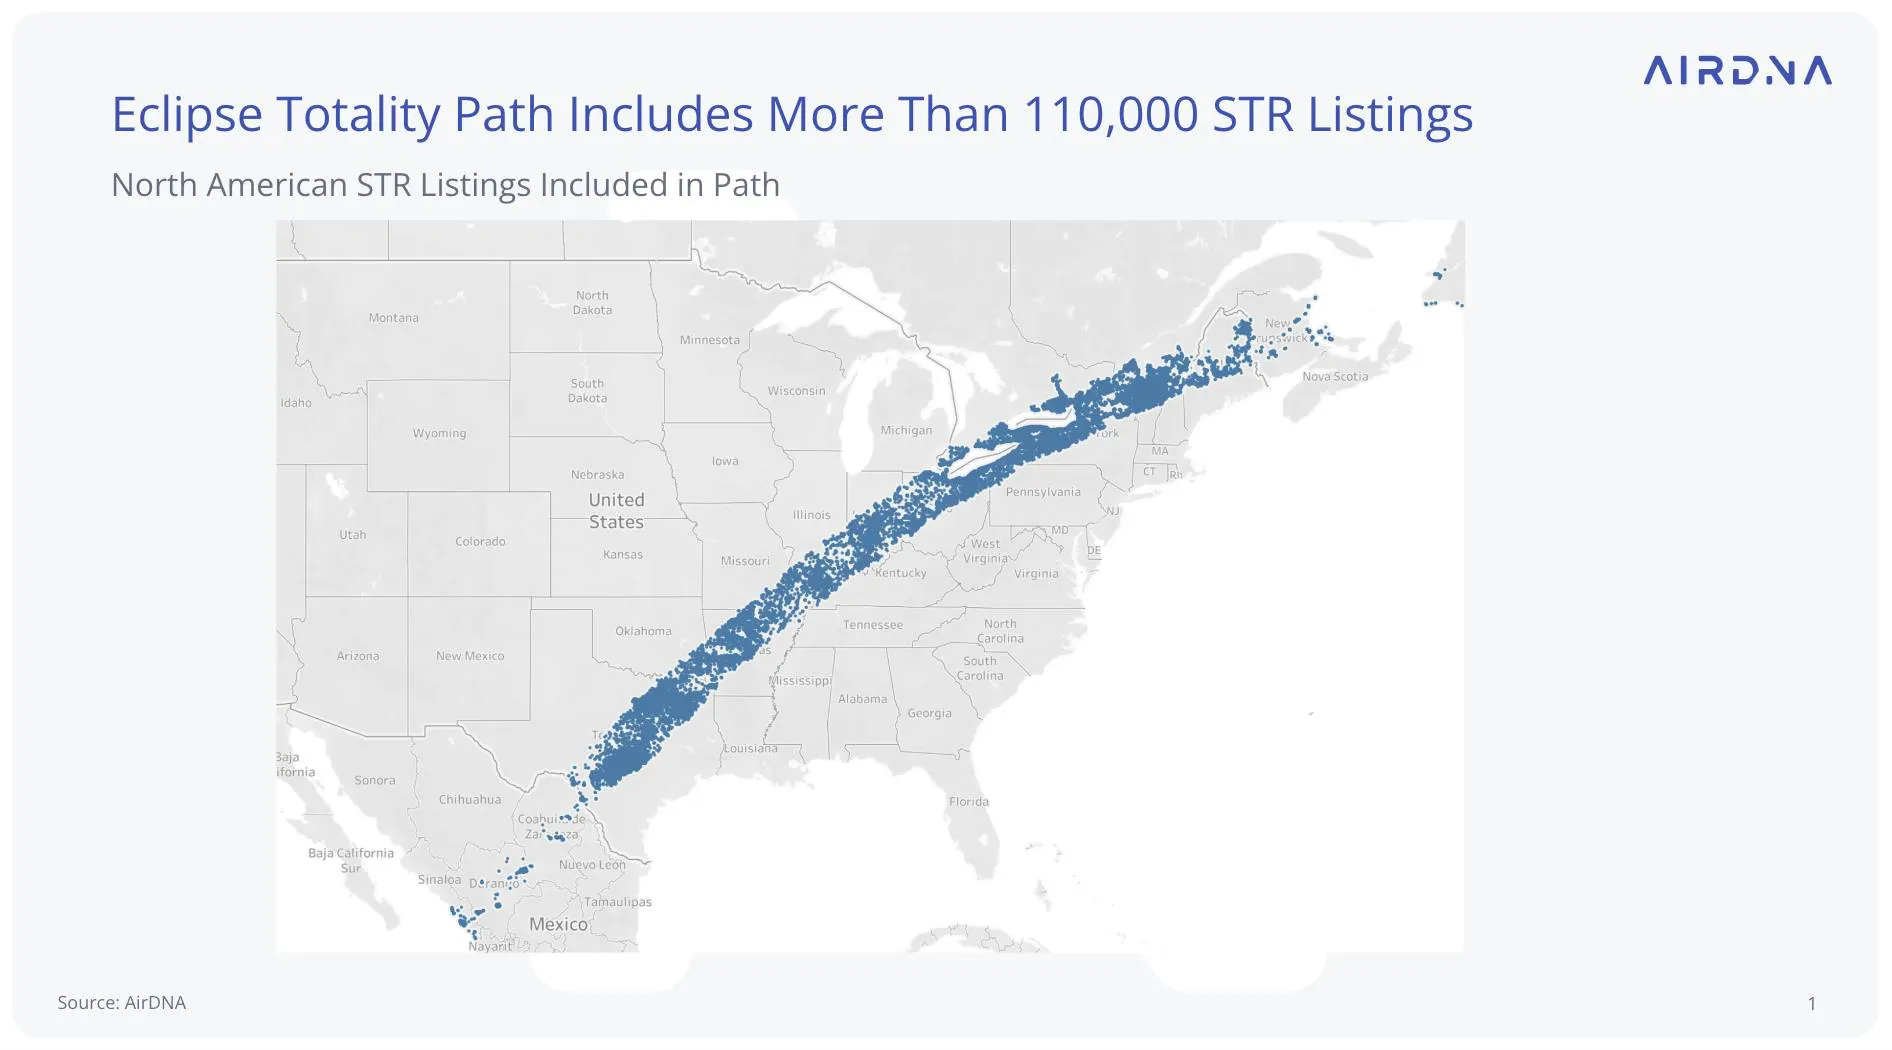
Unprecedented Occupancy Rates in the Path of Totality
The anticipation of the solar eclipse has transformed an otherwise ordinary Monday into a lucrative opportunity for STR hosts located within the path of totality. As of March 25th, occupancy rates for April 7th have soared to an impressive 88% across all listings. This represents a massive surge in demand for accommodations on the night before the big celestial event.
The data visualization below clearly captures this surge—you can trace the path of totality by the swath of bright red across the map.
This kind of data offers hosts a clear signal: when nature puts on a headline act, travelers are more than willing to come from far and wide, seeking the perfect spot to witness the spectacle.

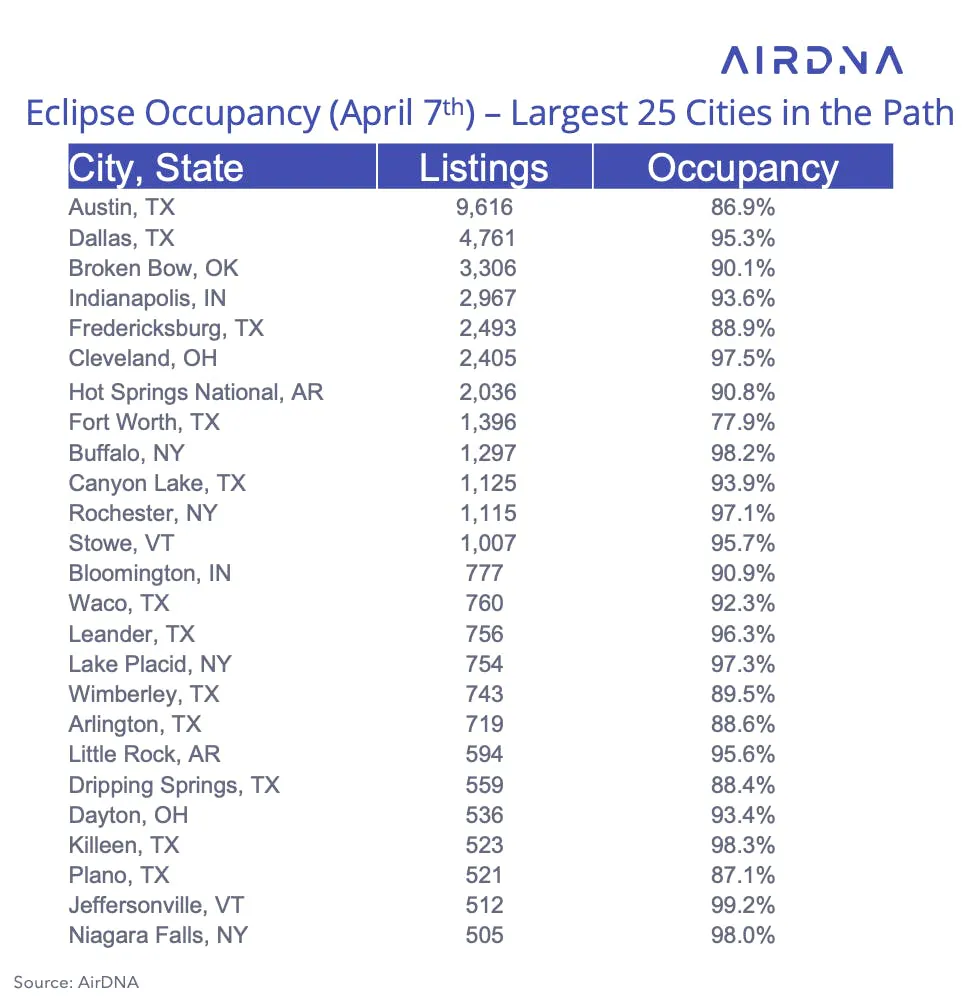
Top 25 Cities in the Eclipse Path
The top 25 cities with highest occupancy for the eve of the eclipse on April 7th include cities from Texas, Oklahoma, New York, Ohio, Arkansas, Indiana, and Vermont. Austin, Texas has the most listings at approximately 9,600, almost double the second largest STR market on this list, Dallas. They boast an 86.9% and 95.3% occupancy for April 7th, respectively.
Perhaps unsurprisingly, some of the highest occupancy rates are in smaller towns with fewer listings. Buffalo, New York, is experiencing a 98.2% occupancy rate among its 1,297 STR listings. Jefferson, Vermont, with 512 listings, has the highest occupancy rate at 99.2%.
How Far Eclipse Tourists Are Willing to Travel
Astrotourism is getting a big boost thanks to the eclipse as people journey from all corners of the country to witness it firsthand. A state of emergency has been declared in major cities along the path of totality due to the expected large crowds.
At AirDNA, we got curious. Where is everyone coming from? Which cities are getting a larger market share compared to others? Is there a specific region that was popular among long-distance eclipse chasers?
To answer these questions, we traced the journeys of eclipse watchers from remote areas of the country to the popular urban destinations along the path of the eclipse.
Using data from Arrivalist, we analyzed the travel patterns of tourists in 14 cities along the path of totality, mapping their origins from the top 50 cities. The visualization below illustrates how popular each location was among both local and distant travelers.

As the eclipse draws near, cities like Austin, TX, and Dallas, TX have emerged as prime destinations, attracting travelers from both coasts and beyond.
Yet, the allure of totality extends far beyond the Lone Star State. Indianapolis was a tourist hotspot, drawing visitors from Chicago, Detroit, New York, Seattle, and Los Angeles. Even cities like Buffalo, NY, and Syracuse, NY were popular spots for eclipse chasers as visitors converged to witness the spectacle against the backdrop of Niagara Falls.
In conclusion, the total solar eclipse brought people from all over the country to cities along its path due to their proximity and accessibility, resulting in a diverse crowd gathering to witness the event.
Demand Pacing for Locations Outside the Path
While the path of totality is the center of attention, what about locations near the path that still offer decent views?
Not all views are created equal—and the booking data reflects this. The graph below breaks down demand pacing into three categories based on proximity to the eclipse’s path of totality. This approach allows us to control for external factors and isolate the true impact of the eclipse.
We look at three sample groups with varying proximity to the path:
- Listings Outside Eclipse States: This group includes all the listings in the U.S. that are not in states traversed by the path of totality, providing a baseline for places with no direct eclipse effect.
- Listings in Eclipse States but Outside the Path: These listings are in the states the path of totality moves through but are not directly in the path themselves, offering insights into the partial eclipse effect.
- Listings Directly in the Path of Totality: This final group consists of listings located directly within the path of totality, measuring the full impact of the eclipse.
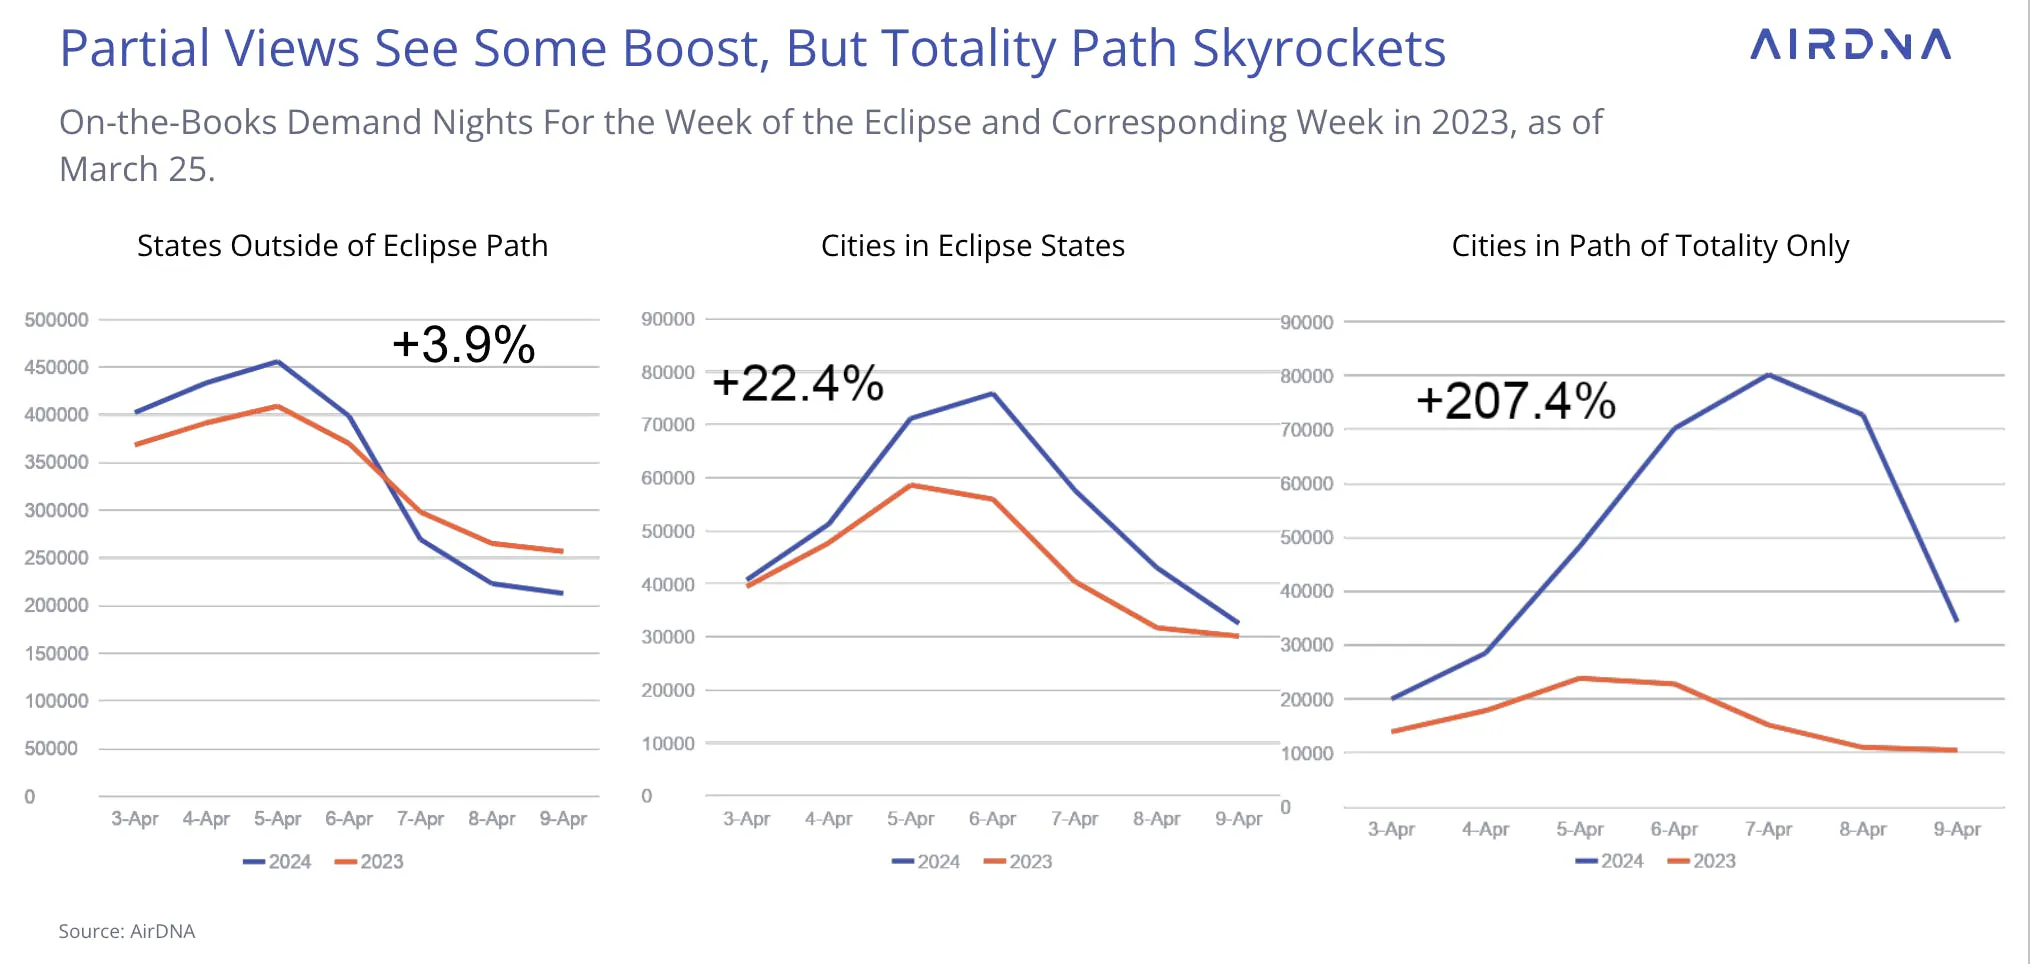
Here’s what we found:
Listings Outside Eclipse States
- Exhibit a modest growth in demand pacing at 3.9% YOY.
- This pacing is slightly lower than in 2023, likely due to the early Easter calendar shift. The shift changed many Spring Break dates from the second week of April to earlier weeks.
Listings in Eclipse States but Outside the Path:
- See a significant uplift in interest, with demand pacing 22.4% higher than the same week in 2023.
- A substantial rise indicates the strong appeal of partial eclipse views.
Listings Directly in the Path of Totality:
- Experience a skyrocketing demand, with a pacing increase of 207.4% YOY for the eclipse week.
- The data shows the high-value that guests place on the total eclipse experience.

ADR Pacing and the Path of Totality
The solar eclipse's impact on pricing within the STR market is distinct and varies by location. Here's a clearer breakdown of what this means:
- In the U.S., the average daily rate (ADR) for states outside of the eclipse path has not changed significantly and remains flat. This means that even with the eclipse, it hasn’t affected what hosts can charge per night in these areas.
- There has been a very slight increase in ADR for states that the path of totality passes through. For listings that are not directly in that path, though, the increase is less than one percent. This indicates that hosts near the eclipse's path are not charging much more than usual.
- However, for listings directly in the path of totality, the ADR has increased by 18.4% compared to the previous year. When there's high demand for a certain location (in this case, because of the eclipse) and the occupancy rate goes up, hosts in these areas have more power to raise their prices.
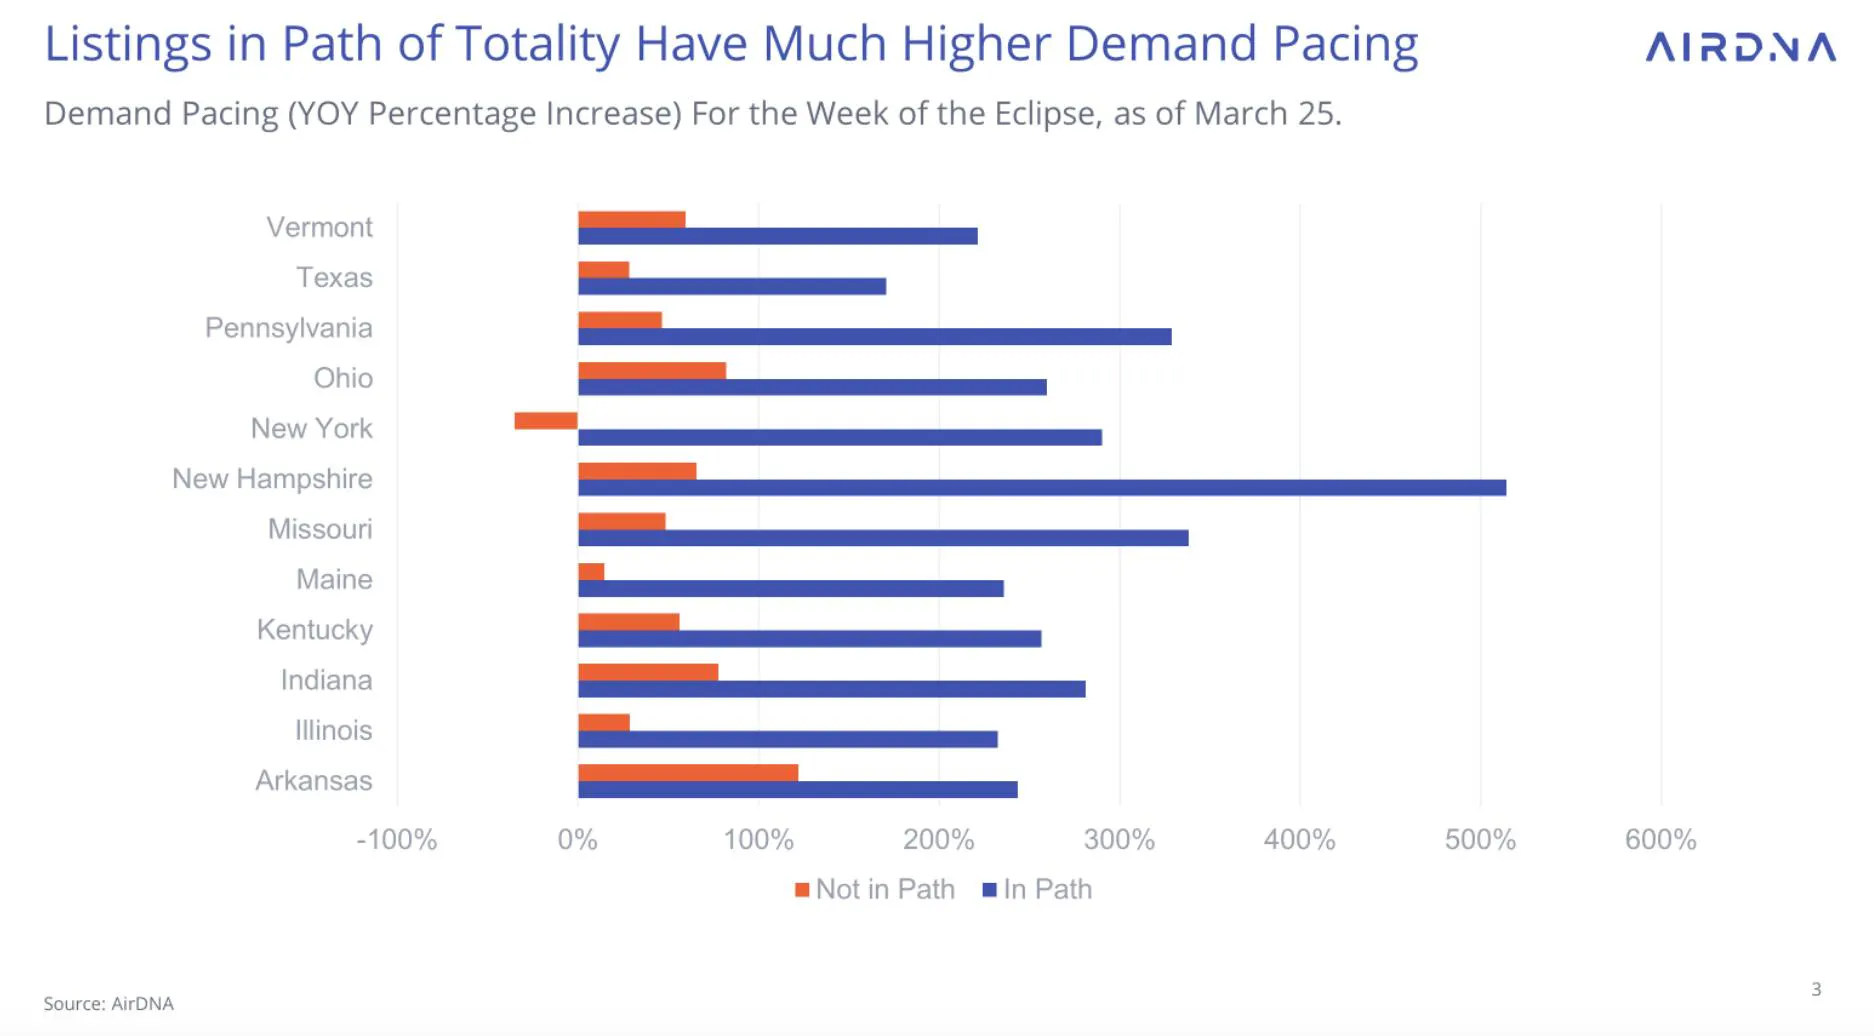
Demand pacing is the rate at which reservations are made for a particular date in the future. As you’ll see in the chart below, listings within the path of totality exhibit demand pacing that eclipses (no pun intended) those outside of it.
New Hampshire and Missouri are seeing the highest year-over-year (YOY) increases at 514% and 338%, respectively. Significant events can create a ripple effect, increasing pricing power for STR listings positioned within the epicenter of traveler interest.
An Eclipse Pricing Paradox: How ADR and Occupancy Interact Along the Eclipse Path
A somewhat puzzling story unfolds as we sift through the ADR figures against the backdrop of occupancy rates. In an unexpected twist, New Hampshire, Missouri, and Maine—all positioned within the path of totality—are recording some of the smallest increases in ADR. Maine is even seeing a downturn. Contrary to what one might expect, it’s as if guests are haggling for a bargain in the very spots where the eclipse can be seen in its full splendor.
The occupancy data, however, sheds light on this conundrum.
The graph below contrasts ADR growth with occupancy levels across various states, revealing a paradox where some regions in the path of totality see unexpectedly lower ADR growth despite high demand for the solar eclipse. Those states have yet to reach the 50% occupancy threshold within the path of totality, pointing to a marketplace where options abound and competitive pricing reigns supreme.
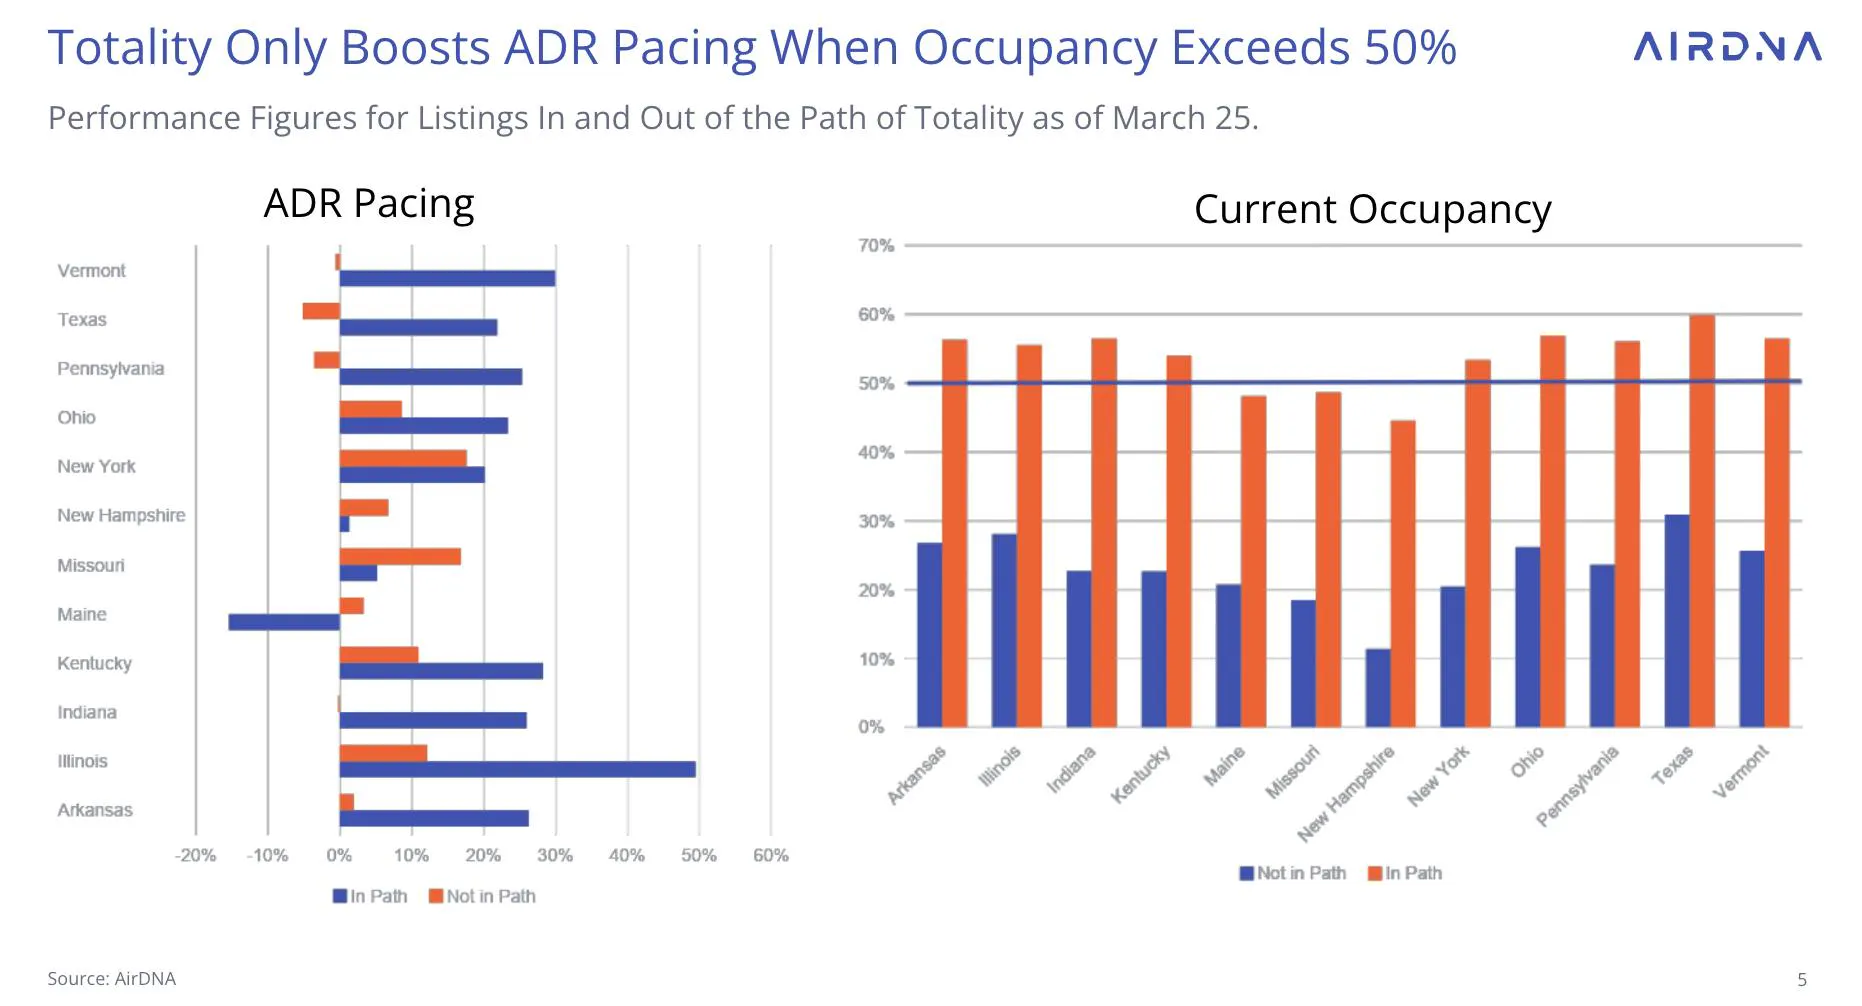
Where occupancy is tighter, and choices are few (such as in Texas, Vermont, and Pennsylvania), hosts are more likely to notch up their rates. This is different for Maine and New Hampshire, where an April eclipse does little to dispel the usual seasonal quiet. In these cooler climates, even a significant uptick in year-over-year demand does little to tighten the market, leaving guests in a sweet spot to secure a stellar view without a price that shoots for the stars.
Mapping the Eclipse's Influence on North American STR Markets
U.S. Takes the Lead in Demand Growth
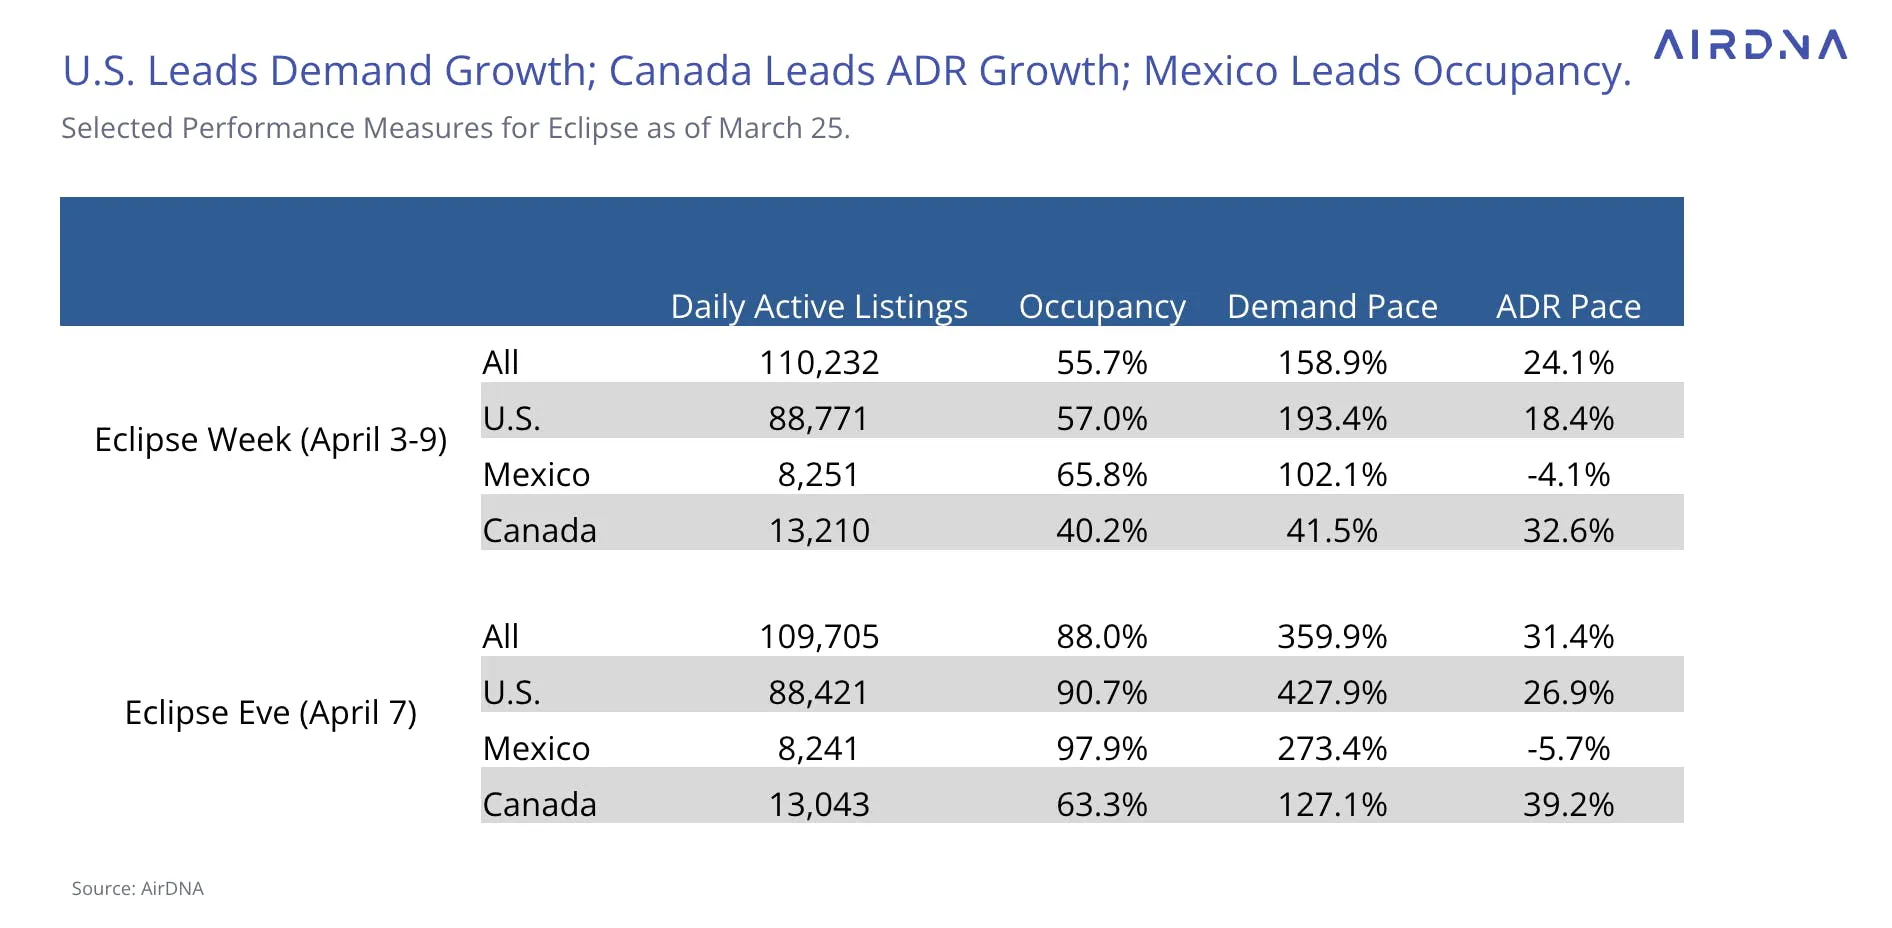
In terms of total demand growth YOY, it’s the U.S. that runs away with the top spot. The U.S. is nearly tripling visitation for the week of the Eclipse and hosting well more than five times the usual number of guests on April 7 for places in the path of totality. Although the U.S. occupancy rate isn’t quite as high as Mexico’s, 90.7% on April 7 as of March 25 is still an incredible achievement. The U.S. represents about 80% of the total available North American STR listings in the path of totality, at 88,421.
Canada's ADR Growth Outshines Occupancy
Canada, meanwhile, has much lower occupancy but substantial ADR growth. The usual April downturn in STR demand, as travelers and locals seek warmer climates, is offset by eclipse watchers seeking premium accommodations typically reserved for the summer. This is allowing for notable increases in ADR.
Mexico Leads with Highest Occupancy
Mexico has the highest occupancy rate but shows the least change in ADR. April is considered a peak season due to Spring Break, resulting in high ADR. The additional demand from the eclipse does not significantly alter the existing high prices. This means that visitors coming for the eclipse may find that the most luxurious accommodations are already booked. Hosts are weighing the current demand against a busy and high-priced comparison period in the previous year.

5 Strategic Implications for Short-Term Rental Hosts and Investors
The 2024 total solar eclipse has provided an insightful case study into how unique events can affect the dynamics of the STR market. Here are several implications for hosts and investors to consider for future events:
1. Predictive Positioning
Use market data to predict which locations may experience surges in demand due to unique events. Being ahead of the curve can position hosts to optimize their pricing and availability. Using an Airbnb calculator based on up-to-date data can help determine a property's potential revenue.
2. Dynamic Pricing Strategies
Implement dynamic pricing models that respond to increased demand, particularly for properties in prime locations during special events. This could mean adjusting prices as occupancy rates climb, leveraging the principle of compression to maximize revenue.
3. Market Based on Occupancy Trends
Tailor marketing strategies to highlight the advantages of properties based on their occupancy trends. For areas with lower occupancy, focus on value and unique experiences. For high-demand locations, emphasize exclusivity and premium features.
4. The Impact of Seasonality
Recognize the influence of seasonality patterns on rental returns. It’s important to strategize on how to prepare for peak season and make the most of the low season.
5. Long-Term Investment Planning
Consider the long-term impact of recurring or predictable events when making investment decisions. Properties in areas that regularly host major events may offer greater potential for high yield, especially during those peak times. Keep abreast of market trends and be sure to check out our Best Places to Invest Outlook Report.
With the total solar eclipse nearly upon us, you're likely preparing to gaze upward (just don't forget those viewing glasses!). It's also a great time to contemplate how significant events can affect trends and markets in the STR industry. While the next major event may not be a solar eclipse (it could be anything from a Taylor Swift concert to the Superbowl), one thing is sure - you won't be able to ignore its impact on your STR business and how you manage it.
ARTICLE SUMMARY
Learn from AirDNA’s data how the April 2024 total solar eclipse is influencing STR demand across North America, and what it means for your vacation rental business.
Jamie Lane
AirDNA Chief Economist
He is responsible for data analysis, thought leadership, and leveraging advanced analytical techniques to provide new insights into short-term rental market trends. Native to Atlanta and an Airbnb host himself, Jamie enjoys cycling, mountain biking, backpacking, running, and playing in a dart league in his free time.
