U.S. Market Review: February Thaws the STR Market
Published: March 18, 2024
Last updated: February 21, 2025

Bram Gallagher
Demand for short-term rental (STR) accommodations in the U.S. grew at a brisk rate of 15.6% year-over-year (YOY) in February. While this high growth rate reflects how weak demand was in February 2023 and comes at a seasonal low point, hosts appreciated the abrupt change of pace after dismal weather nearly screeched January’s growth to a halt.
February’s surge in traveler demand was enough to push occupancy higher than it was during the same month last year. Since September 2023, occupancy had been tracking very close to 2019 levels before dropping to record lows in January. The return of 2019-like occupancy was a welcome relief, suggesting that January’s performance wasn’t the start of a downward trend. On the other hand, the occupancy bump didn’t seem to give hosts much pricing power. Average daily rates (ADR) remained essentially unchanged in February, declining about 0.1% YOY.
Employment and Inflation
February economic data was mostly benign. Macroeconomists and market participants have paid close attention to the balance of labor market tightness and inflation in anticipation of interest rate cuts from the Federal Reserve. Interest rates are of note because they strongly influence mortgage rates and overall economic activity. The jobs report for February added 275,000 jobs and noted a slight increase in unemployment, boosting the likelihood that interest rate cuts are on the way. Wage pressure also eased, with hourly earnings rising about a nickel in February. This is down from an 18-cent uptick in January.
On the other hand, the Consumer Price Index (CPI) inflation rate—which measures price changes in consumer goods and services—edged up slightly in February, reaching 3.2% from 3.1% in January. Higher inflation may mean that rates may also remain high for longer. The need to moderate high inflation motivated the historic Federal Funds Rate increases since March of 2022. Still, core inflation, which ignores fluctuations in volatile food and energy sectors, changed at the same rate in February as in January. The ambiguous signals likely mean that June rate cuts are equally likely to happen or not.

At a Glance: Key U.S. STR Performance Metrics for January 2024
- RevPAR increased 0.8% YOY to $173.33
- Available listings were 1.54 million, up 12.3% YOY
- Total demand (nights) rose 15.6% YOY
- Occupancy was 0.9% higher YOY at 54.6%
- ADRs decreased 0.1% YOY to $317.26
- Repeat Rent Index (RRI) increased by 3.7% YOY
- Nights booked increased by 18.9% YOY
Available Listings Slow Decline In February
Available listings dropped after a surprising number of properties left the market in January. Typically, available listings reach a low in February as hosts take their properties off the market to refresh them for the summer travel season.
This year, a large drop of about 75,000 listings occurred in January, and February listings were lower by about 38,000 still. Combined, this represents a reduction of about 7.0% since December 2023. When taken as a percentage, that decline is less than in 2019 (-9.1%), 2021 (-8.4%), and 2022 (-8.0%). This appears to support the theory that early-to-close listings due to miserable January weather were behind the large drop.
Overall, available listings are down 146,000 since the most recent high in September. While a large difference, it also reflects an unexpected increase in listings in September—perhaps to take advantage of the extended travel season following a brutally hot August.

Demand and Bookings Solid in February
Demand and bookings were both solid in February, even though the comparison to last February somewhat exaggerates the growth figures. Demand neared 14 million nights—about a million higher than in January—although January was also a weak month in comparison. Total demand in the U.S. tends to fall from January to February, so the uptick indicates that January’s lukewarm growth wasn’t the beginning of a new trend. Bookings also had a good month; the faster pace of bookings may foreshadow a busy spring and summer.

As demand rebounded, many operators were pleased to see that occupancy rebounded in turn. Occupancies in the first half of 2023 were lower than pre-pandemic levels but went on to regain 2019 occupancy levels after June—except for August. January 2024 occupancy was significantly lower than any previous recorded January in the U.S., but February’s occupancy of 54.6% was 50 basis points higher than in 2023 and just 50 basis points shy of 2019, pre-pandemic levels.

ADR Nearly Unchanged but Hosts Gain Pricing Power
February ADR was essentially unchanged at $317.26, which was 36 cents lower, or -0.1%, than the same month a year before. The near-zero growth rate is a welcome sign that lower inflation rates and higher wages this year have helped budget-conscious travelers at least maintain spending.
The ADR picture improves when examining AirDNA’s Repeat Rent Index (RRI). February’s stagnant rates were a symptom of a mix shift during the past year, meaning that properties that entered the market in 2023 generally offered lower-than-average ADRs, dragging down the aggregate rate. That mix shift is when ADR and RRI began to markedly diverge. February RRI—which excludes the effect of mix shift by examining only ADR changes in existing listings—grew by 3.7%, the highest RRI growth rate since November 2022. That rate suggests that stabilizing occupancy may be delivering some pricing power to hosts even though ADR says otherwise.

The growth in RRI is also widespread across location types. While only half of location types in the U.S. increased ADR, RRI saw positive growth in all markets. Large City/Urban locations enjoyed the highest ADR and RRI growth.
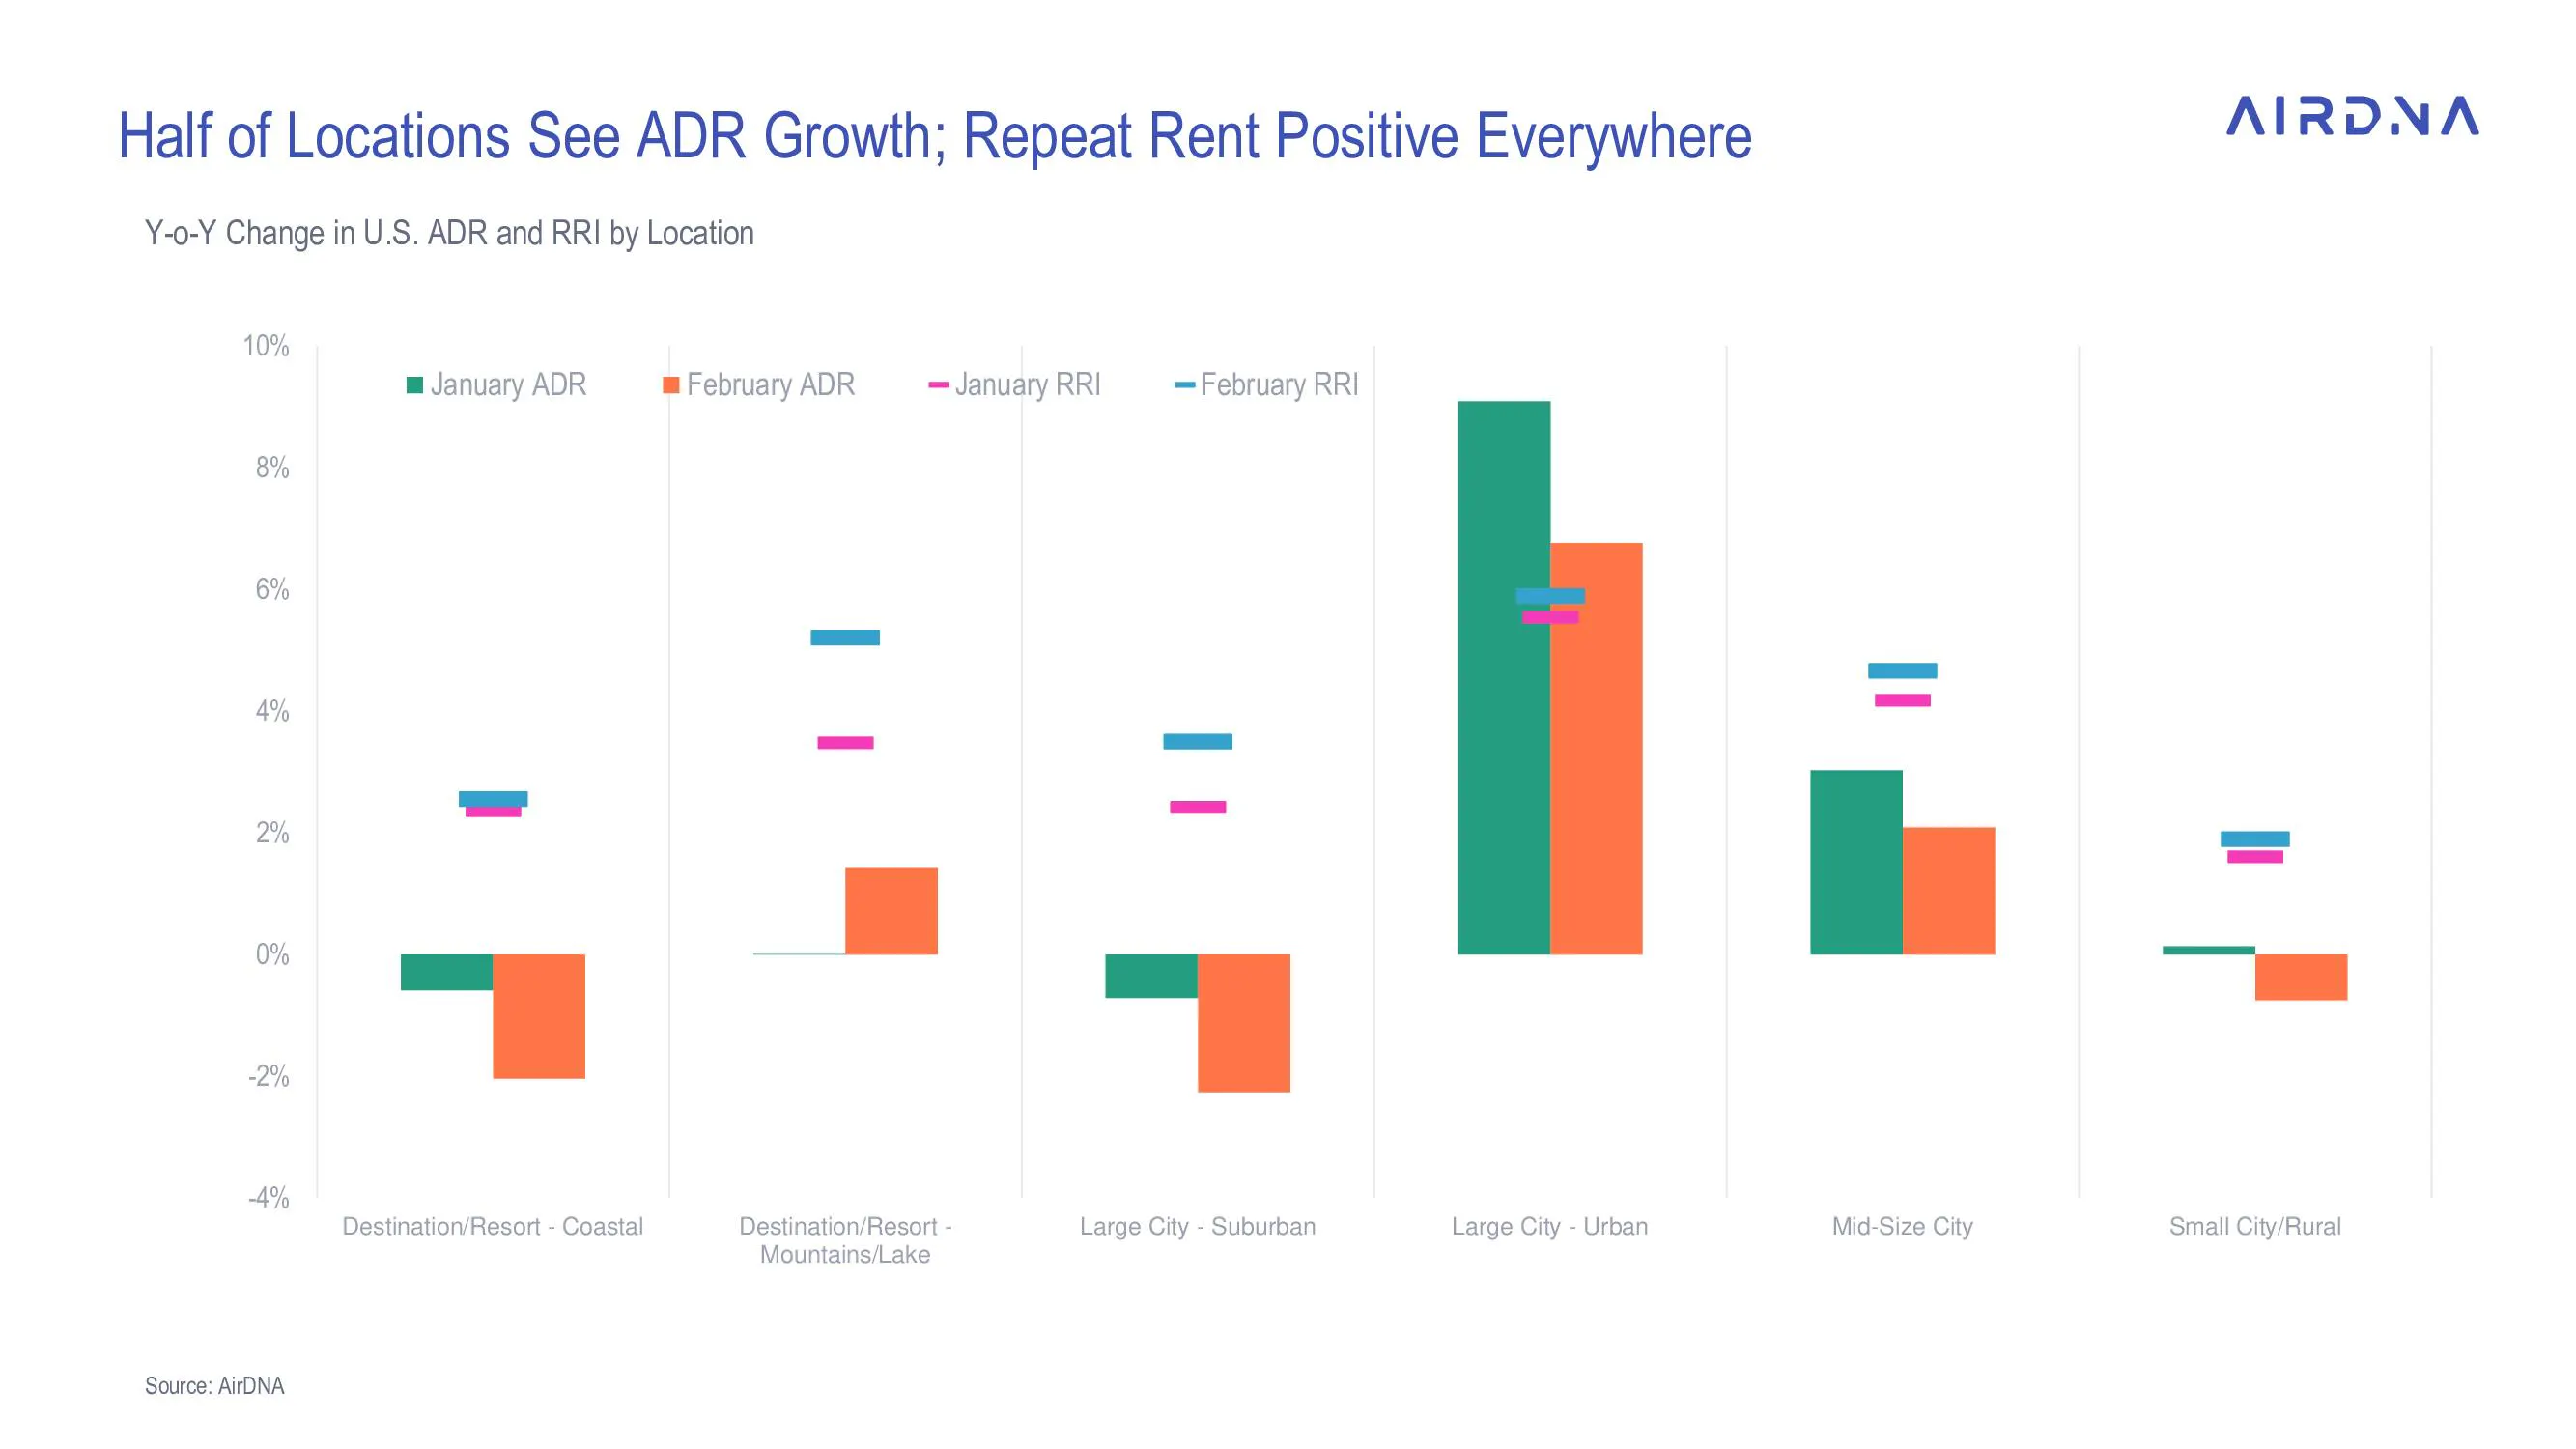
Immediately after New York City stepped up its enforcement of STR regulations in 2023, ADR grew but RRI stayed near zero, reflecting the rapid change in the mix of available listings. Now, ADR change remains high, but RRI is increasing as well, indicating that the remaining New York City listings have managed to raise rates. Generally, most markets in the AirDNA top 50 increased RRI, including several where ADR declined due to mix shifts.

Another bright spot for most markets was YOY occupancy growth. The two previous Super Bowl host cities make an interesting comparison, both of which had large YOY increases in occupancy. Las Vegas, the host of this year’s game, had a 4.6% higher occupancy rate, while Phoenix/Scottsdale saw a 16.1% occupancy growth this February over February 2023—when it hosted the Super Bowl!

This is due in large part to supply shifts in the two cities. Already well-served by traditional hotel rooms, Las Vegas added only about 1,200 additional listings in February compared to January and increased its YOY available listings by 23.4%.
Phoenix/Scottsdale, on the other hand, had an additional 3,600 listings available in February 2023 compared to January and had an 85.7% YOY increase in available listings. Since the Super Bowl, Phoenix/Scottsdale listing growth paused just enough for demand to catch up, leading to an 11.7% YOY decline in available listings for February and strong occupancy growth.

Pacing Speaks to Strong Summer; Texas Eclipse Destinations Filling Up
As the STR market gears up for the 2024 spring and summer travel seasons, demand pacing already on the books suggests that this year will easily be the strongest yet. Demand pacing is well ahead of last year through August, an exciting change whether it’s due to much lower inflation, a rebalancing of exchange rates encouraging international and domestic travel, or renewed confidence in the economy.
March benefits from an earlier Easter than in 2023, shifting many Spring Break calendars. March is now pacing 21.6% higher than it was at this time last year. April, on the other hand, is so far expecting a slight slowdown at a pacing rate of only 18.2% higher YOY. The next four months however, are pacing at or more than 30% higher.
One factor helping April demand push through the calendar change is the phenomenal interest in the North American Eclipse on April 8. Three Texas cities—Dallas, Austin, and San Antonio—have emerged as favorite destinations, promising (usually) clear skies and views near totality. In fact, those who’ve waited to book their eclipse stay may be hard-pressed to find an available rental. Occupancy in Dallas for Eclipse Eve has already reached 81.2%, and Austin and San Antonio are close behind.



Outside of these three cities, bookings are also increasing in Texas Small City/Rural locations in the eclipse’s path. The pace of demand for that entire location type is more than double this time last year—although this is a small gain compared to Dallas, which is now pacing more than 750% higher than 2023.
On the other hand, while prices in these cities are notably higher year-over-year, they haven’t reached extreme levels just yet. The highest premium for Eclipse Eve is in Dallas, but it’s only about 33% higher than last year. San Antonio's ADR pacing is only about 14.2% higher.

ARTICLE SUMMARY
February's STR market in the U.S. saw a significant increase in demand and occupancy, signaling a positive shift from January's slowdown despite average daily rates (ADR) remaining virtually unchanged.
Bram Gallagher
AirDNA Director of Economics and Forecasting
Bram Gallagher is an Economist at AirDNA, specializing in uncovering insights that drive smarter short-term rental decisions. He put his Ph.D. in Economics from the University of Georgia to work researching and forecasting hotel data with CBRE prior to joining AirDNA, as well as teaching economics at a number of universities. In his spare time, Bram enjoys making wooden furniture with hand tools.