AirDNA Market Review | Europe March 2022
Published: April 29, 2022
Last updated: May 5, 2026

Jamie Lane
Short-term rental (STR) recovery is on the rise in Europe, but disproportionately. The supply of available STRs in Europe has remained below 2019 levels since the start of the COVID-19 pandemic. And although STR supply in March 2022 climbed 5% above March 2021 levels, it still remains -6.5% below March 2019.
The caveat here is that depressed supply levels have not been felt equally across all European STR market sizes. In March 2019, 25.5% of available listings in Europe were in markets with at least 5,000 listings. In March 2022, that figure had shrunk by 4.9% to 20.6%. Moreover, markets with between 1,000 and 5,000 listings have only marginally decreased in overall market share by 0.2%. Alternatively, markets with between 1,000 and 200 listings and markets with less than 200 listings have gained 2% and 3% of the total market share, respectively.

Relative to 2019, it may be encouraging that markets with between 200 and 1,000 listings grew by +1.6%, and markets with less than 200 listings grew by 6.2%. Markets with 1,000 to 5,000 listings also saw their highest relative supply month since the onset of the pandemic. However, markets with greater than 5,000 listings have yet to catch a break and have remained at least 20% below 2019 supply levels since April 2020. This trend continued in March 2022 (-24.2%).

The key takeaway from these figures is that—despite smaller markets gaining supply market share—the gains in these areas have not been sufficient to offset the supply decreases in larger European markets. Overall European supply is down relative to the same period in 2019. This is a result of slowly recovering demand in the largest market categories.
European STR demand remained positive throughout Q1 2022
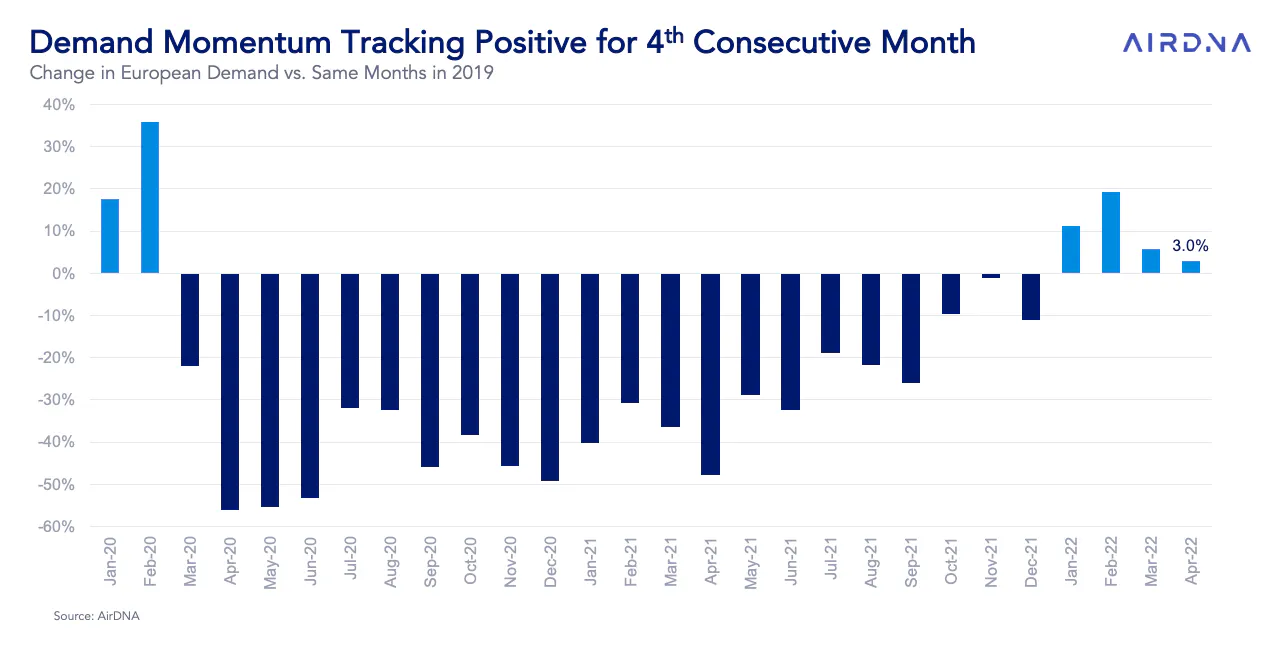
In March, overall demand was 6.2% greater than in March 2019 (66.9% above March 2021), but this is a bit of a downturn from February's demand peak (+19.7% above 2019 levels).
2022 monthly demand in Europe has been consistently positive when compared to 2019, but there are differences between data sets relative to market size.
Throughout 2019, markets with at least 5,000 listings held the lion's share of demand, (31% of European total demand in the year). However, in 2021, this market category had become the smallest demand generator, having reduced total demand share by 8.3% to just 22.7% of the total annual demand.
Over the same period, markets with 200 to 1,000 listings as well as markets with less than 200 listings gained 2.8% and 5.4% of total demand share, respectively. Markets with between 1,000 and 5,000 listings saw marginal increases in yearly demand share over the period as well, gaining 0.1% in 2021 relative to 2019.

March 2022 continued the positive demand trend seen in January and February, as each market size saw positive demand relative to the same month in 2019—aside from markets with at least 5,000 listings which were 21.8% below 2019 levels.
Monthly demand for markets with less than 200 listings has also been positive since October of 2021. The demand growth over this time period for markets with less than 5,000 listings represents a shift in guest preferences from urban destinations to less-populous areas.

Alternatively, when comparing March 2022’s last twelve months (LTM) demand to March 2021’s LTM demand, markets with at least 5,000 listings have shown the greatest levels of growth since October of 2021 (relative to their smaller market counterparts). In March, demand for markets with at least 5,000 listings grew above those for March 2021 (+121.5%), February 2021 (+120.7%), and January 2021 (+103.4%). Areas with at least 5,000 listings have a greater recovery upside in the coming months, having been more impacted by diminished demand than smaller markets. These larger international destination markets will likely benefit to a greater extent than their smaller market counterparts from relaxed pandemic restrictions and more positive sentiment towards crossing borders.

Occupancy, revenue, and average daily rates: Oh, my!
Occupancy grows when increased demand meets decreased supply. And monthly occupancy in Europe reached a new peak of 50.2% for the month of March, the highest level for the month, even beating the 49.1% of 2019. Available listing supply has yet to keep pace with demand growth. Although, as additional supply re-enters the market to meet demand, we anticipate that occupancy levels may fall in the coming months.

Reduced supply of available listings in tandem with strong demand has allowed hosts to raise average daily rates (ADRs) to unprecedented levels. Relative to the same months in 2019, ADRs have been positive for each month since April 2020. However, when compared with 2021, rates in March declined by 1.4% versus the same period last year. This represented the first downturn in rate growth for a month in 2022 over 2021, while February (+1.4%) and January (+9.1%) both posted rate growth over their respective periods.
While spring ADRs are trending lower than last year, marginal ADR growth is expected to resume during the peak summer travel season. As of April 1st, rates are trending 2.4% lower for the rest of spring and 3.4% higher for summer when compared with the same periods last year.
STR guests’ willingness to pay higher rates has caused monthly revenue to remain positive for six consecutive months when compared to 2019. March’s year-over-year revenue was 30.7% higher than in March 2019 (65% vs. March 2021) but was down from being 53.9% higher than 2019 (75.6% vs. February 2021).

Elevated occupancy in concert with higher rates has resulted in heightened levels in the revenue generated per available room (RevPAR). When compared to 2019, Europe has experienced positive RevPAR growth in each month since February 2021. For example, RevPAR in the month of March was 25.9% higher than in March of 2019.

Recovery is split in the top 20 European countries
Demand indexed to March 2019 (100) helps us yield insight to the recovery rates of each of the top European countries since the onset of the pandemic. In March 2022, 10 of the top 20 European countries saw demand figures above those for March 2019. France (134%), Greece (128%) and Germany (117%) saw the highest demand index figures in the month, while the Czech Republic (59%), Ireland (66%), and Hungary (77%) remain below the 2019 index, despite each making gains in March 2022 above March 2021. Greece, Portugal, and Austria gained the most index points in March 2022 relative to a year ago (up 67, 62, and 60, respectively).

Since 2019, ADRs have increased dramatically across Europe, pushed by increased demand on contracted supply. When comparing March 2021 to March 2019, each European country saw a double-digit increase in average daily rates. The greatest change in ADR for this period was seen in Greece (67.3%), Hungary (62.1%), the Czech Republic (60.3%), Portugal (57.3%), and Finland (45.3%). However, in March 2022, the ADR for these countries declined by 12.7%, 9.6%, 11.1%, 17.1%, and 15.9%, respectively.
The ADR increases continued in March 2022 for eight of the top European countries, with Denmark posting the strongest gain (12.3% over March 2021), followed by Poland (9.1%), and France (4.4%). Hosts have been able to benefit from a combination of increased demand and less supply while attempting to recoup lost revenue from the pandemic. However, rates were put in check for 12 of the top 20 European countries in March 2022, and it’s likely rate increases may not continue as additional supply enters the market—ultimately driving prices down.

ADRs as of April 1st, when measured year-over-year, were pacing mixed across Europe for the summer months (June to September), as some areas appear to be contracting from their 2021 highs while others continue to rise. Denmark (+15.2%), Poland (+13.6%), and Italy (+13.1%) lead the climb, while rates in Finland (-15.6%), Austria (-6.9%), and Belgium (-3.5%) are pacing lower than last year.
Revenues relative to March 2019 were higher for 17 of the top 20 European countries, largely pushed higher by increased ADRs. Greece (+87.8%), Poland (+65.2%), and France (+60.7%) saw the highest increases in revenue in 2022 versus 2019, whereas Ireland (-17.8%), the Czech Republic (-15.4%), and The Netherlands (-4.1%) saw the lowest relative revenue levels.
In March 2022, nine of the top-20 European countries tallied available listing supply levels that were above 2019’s, with Germany seeing greater supply levels than in March 2019 (+14.9%), followed by France (+10.5%), Belgium (+9.3%), and Sweden (+9.3%). Moving in step with decreased demand, the Czech Republic (-36.4%), Ireland (-35.7%), and Hungary (-30.2%) had the lowest supply levels relative to March 2019.

Summer demand pacing levels above 2021 for Europe’s top 20 countries
As of April 1st, seven of the top 20 European countries were seeing positive summer (June to September) demand pacing in 2022, relative to the same period in 2019. Germany is a clear standout coming in at 40.6% above 2019 pacing, followed by Denmark (+22.8%) and Finland (+16.3%). The Czech Republic (-43%), Hungary (+31.9%), and Ireland (-24.7%) continue to exhibit a trend of low demand and are currently maintaining the lowest demand pacing levels relative to 2019 when assessing all of the top 20 European countries.
When compared with 2021, summer demand pacing in 2022 was positive as of April 1st for each of the top-20 countries. Greece (230.5%), Portugal (189.0%), and Croatia (153.9%) lead the demand pacing over this time period while the United Kingdom (6.9%), Finland (19.1%), and Ireland (31.1%) were generating the least demand.

Summer pacing looks promising for now
At this point, positive pacing growth for the coming summer season is a promising sign after the lows experienced in 2021. However, despite indications of recovery, many countries still have plenty of demand to recoup in order to break even with 2019 STR demand levels.
The gradual removal of travel restrictions has supported guests’ willingness to travel internationally, which poses greater upsides for the European STR market. Roughly 60% of reservations in 2019 for European destinations were made by international travellers, according to Airbnb review data.
A lack of confidence in international travel (with respect to pandemic-related restrictions) has subsided in recent months, but the European travel industry now faces new challenges posed by the escalation of the conflict between Russia and Ukraine.
The ramifications of the conflict will presumably be felt at disparate levels across the different European regions. It’s anticipated that Eastern European countries will bear the brunt of decreased demand for STRs from international travellers, given the added uncertainty in the region. (In 2019, roughly 75% of Airbnb reservations in Eastern European countries were made by international guests.) The largest STR markets in this region (Poland, the Czech Republic, and Hungary) will likely experience the most adverse impact on STR demand from international travellers as a result of the war.
ARTICLE SUMMARY
The European short-term rental (STR) industry is bouncing back from the lows of the COVID-19 pandemic, albeit disproportionately in different parts of the continent. This month’s review details how supply, demand, occupancy rates, and average daily rates (ADRs) all fluctuated—and why.
Jamie Lane
AirDNA Chief Economist
He is responsible for data analysis, thought leadership, and leveraging advanced analytical techniques to provide new insights into short-term rental market trends. Native to Atlanta and an Airbnb host himself, Jamie enjoys cycling, mountain biking, backpacking, running, and playing in a dart league in his free time.