U.S. Market Review: Record Summer Ends on a High
Published: September 22, 2022
Last updated: May 5, 2026

Scott Sage
At a Glance: Key U.S. Short-Term Rental Performance Metrics for August 2022:
- Available listings reached 1.38 million, up 23.3% year over year, +7.0% vs. 2019
- Total demand rose 19.8% YOY, and is up 16.4% vs. the pre-pandemic 2019 baseline
- Occupancy declined 4.3% YOY to 63.8%; Occupancy is up +7.1% vs. 2019
- Average daily rates (ADRs) rose 2.8% YOY to $288, and are up 22.8% vs. 2019
- Total Revenue was 23.1% higher YOY in August, and is up 42.9% vs. 2019
- Nights booked for future travel were up 16.9% YOY to 17.7 million
During August, short-term rental industry performance remained robust, continuing the established trend of both the summer and 2022 as a whole. Over 20.7 million nights were stayed across short-term rentals, down from July’s peak of 23 million as many schools reopened and the family vacation demographic was slightly less active in the U.S. market.
Demand for the month was up 19.8% year-over-year, expanding from the +17.8% year-over-year reading seen in July. In 2021, concerns about the Delta variant dampened travel demand during the summer months, but overall travel spending in the U.S. this summer is estimated to hit new records, importantly passing 2019’s pre-pandemic levels.
While average daily rates continue to climb, both year-over-year and against 2019 levels, a sharp rise in supply of available listings (up 23.3% YoY in August) remains a common theme in 2022. During August supply growth outpaced demand growth, leading to the sixth month in a row of declining occupancy rates with a -4.3% reading during August.
Economic Uncertainty Continues
Due to the supply increases, hosts have faced an uphill battle in the effort to have cover costs with high inflation, currently tracking above 8% in the U.S. as per the August Consumer Price Index (CPI). ADRs were up a scant 2.8% year over year in August, following a 3.8% ADR increase in July. The addition of more listings nationwide, rising labor costs and the persistent inflation will continue to put pressure on revenue per available listing (RevPAR), which hit record levels in 2021.
Economists and the Federal Reserve (which controls interest rates) can’t seem to agree on the overall direction and health of the U.S. economy, as the outlook remains uncertain so long as inflation tracks well above historical norms. The labor and spending figures remain strong, with 315,000 jobs added during the month and discretionary consumer spending on the rise, but fears of a recession will likely remain through the year-end.
Gas prices have fallen by another 35 cents to $3.70 on average according to AAA, and should be an incremental boost to travel considerations heading into the 4th quarter.
Supply Growth Impacting Occupancy in Most U.S. Markets
The supply of available listings reached 1.38 million in August—23.3% higher than the year prior, but only 7.3% higher than 2019’s 1.28 million listings. The gradual relaxation of travel restrictions that 2022 has brought has caused many prospective hosts to enter the market, looking to take advantage of the strong ADR and occupancy figures that 2021 delivered to existing hosts. New listings growth began a sharp acceleration in March of this year, with STR listings growth of over 70,000 per month for five consecutive months. A total of 76,000 new listings hit the STR market during the month of August.

Of the 50 largest U.S. short-term rental markets the highest rate of growth has occurred mostly in large cities in Texas and the southwest. Houston had the strongest growth in listings, going from 10,950 listings in August 2021 to 16,270 listings in 2022, a 48.6% increase in just one year. The next fastest growth markets included Phoenix (+45.8%), San Antonio (+44.7%), Las Vegas (+41.4%), and Dallas (+39.0%). These larger cities may be beginning to benefit from the return of business travel for conventions and meetings.
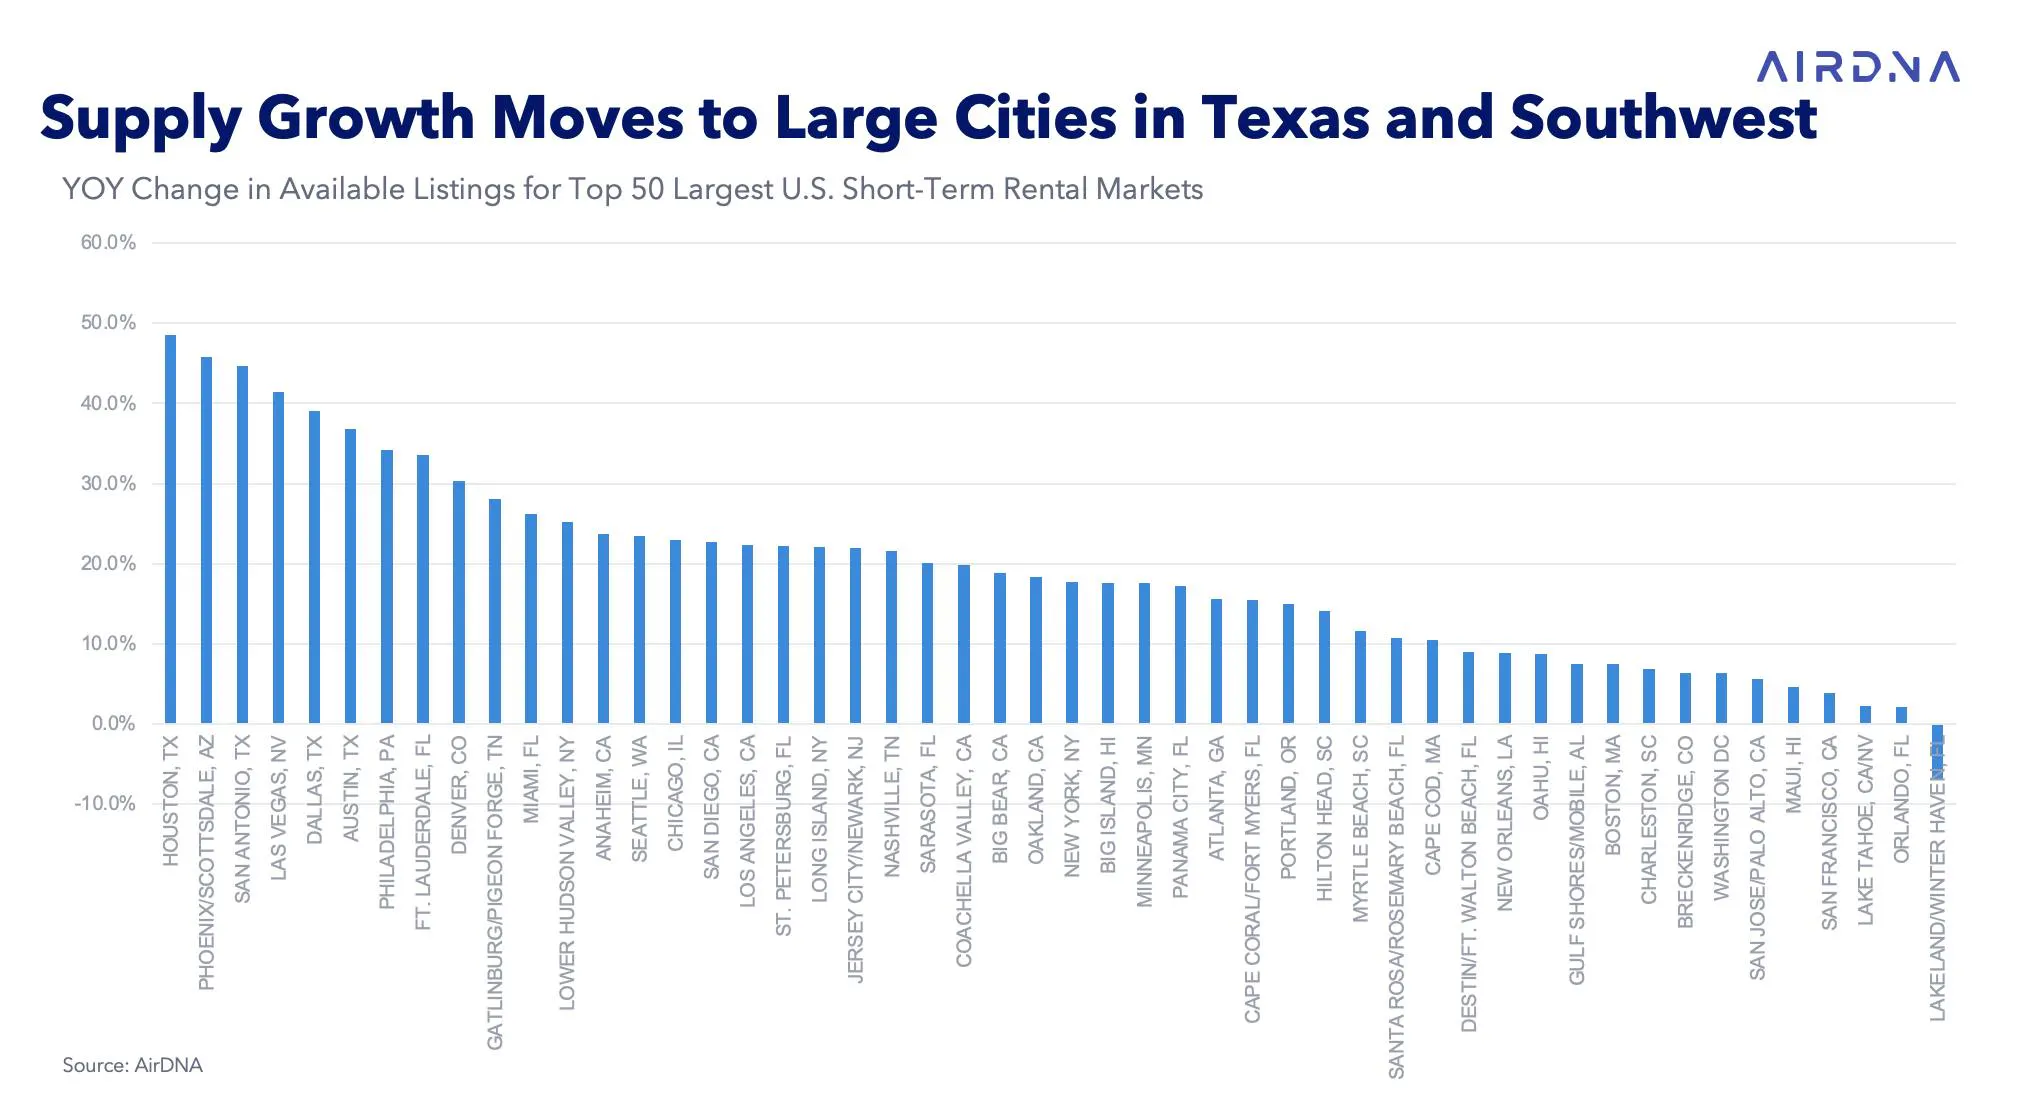
With the significant gains in listings, many markets saw major declines in average occupancy for the month with Las Vegas seeing the largest decline of 13% year over year. Only Lakeland/Winter Haven, Florida, had a year-over-year decline in listings, which helped it achieve a 10.2% increase in occupancy over the prior year. Of the 50 largest markets, only 20 achieved occupancy gains in the month.
Total U.S. occupancy was at 63.8% during August— dropping below both 2020 and 2021 levels. Looking back to 2021’s record level (66.7% last August), massive pent-up demand met up with a hotel industry that was slow to fully reopen, and STR listings growth that was still in a pandemic-driven lull.
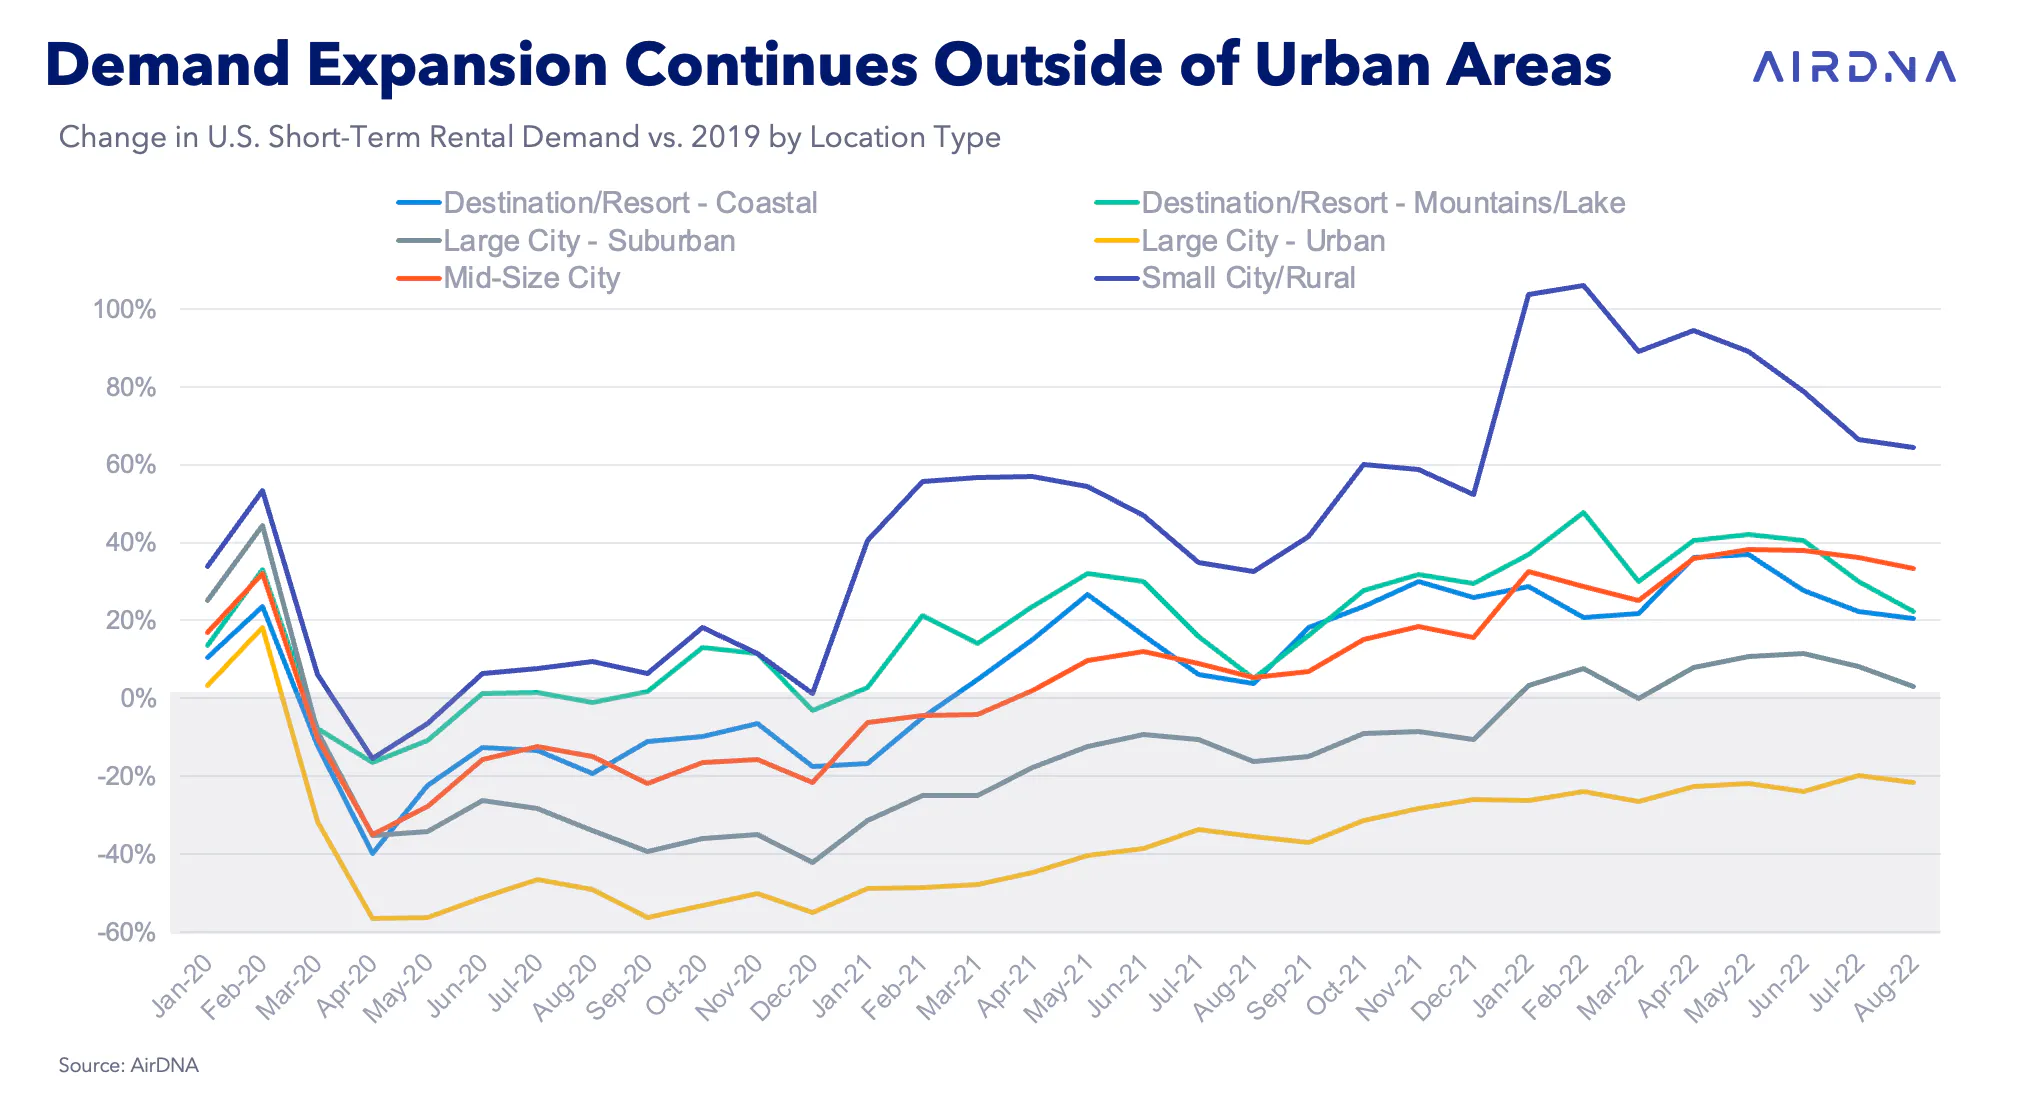
All location types saw a year-over-year decline in occupancy, ranging from a mild 1.5% decline in coastal destinations to a 7.7% decline in midsize cities. Rural markets have been a pocket of strength throughout the summer, as travelers have expressed a desire to get closer to nature and take more trips to destinations close to mountains, rivers, and national parks.

No Weakness to be Found in Demand for Short-Term Rentals
While 2021 was the year for record occupancy, 2022 will set new records for the number of nights stayed in short-term rentals. Following economists’ predictions for a travel boom in Summer 2022, U.S. and international travelers delivered, with 19% more nights stayed this year than in 2021. The increase in listings supply certainly helped in this regard, as more supply came online in popular destinations, allowing more guests to travel.
All location types realized significant gains in demand compared to 2021. The strongest year-over-year gains were in rural markets (with over a 60% increase year-over-year) and midsize cities, where demand grew by 26.8%.
The slowest growth continues to be in the coastal and mountain destinations where demand averaged 16% gains year over year. All locations are above 2019 levels except urban areas, where demand continues to lag about 20% lower. The lag in urban areas reflects a business travel climate that has yet to fully recover from pre-pandemic levels, as the trends in remote work along with fewer mass groupings & conferences may become more permanent fixtures of the business economy.
Demand growth from 2019 levels slowed across the board in August when compared to the growth rates in the spring. And traditionally higher demand levels in the summer months does limit expansion during this peak period when compared to the quieter spring months, where we've seen "shoulder season" blending into the high season.
Strong Booking Activity for Fall
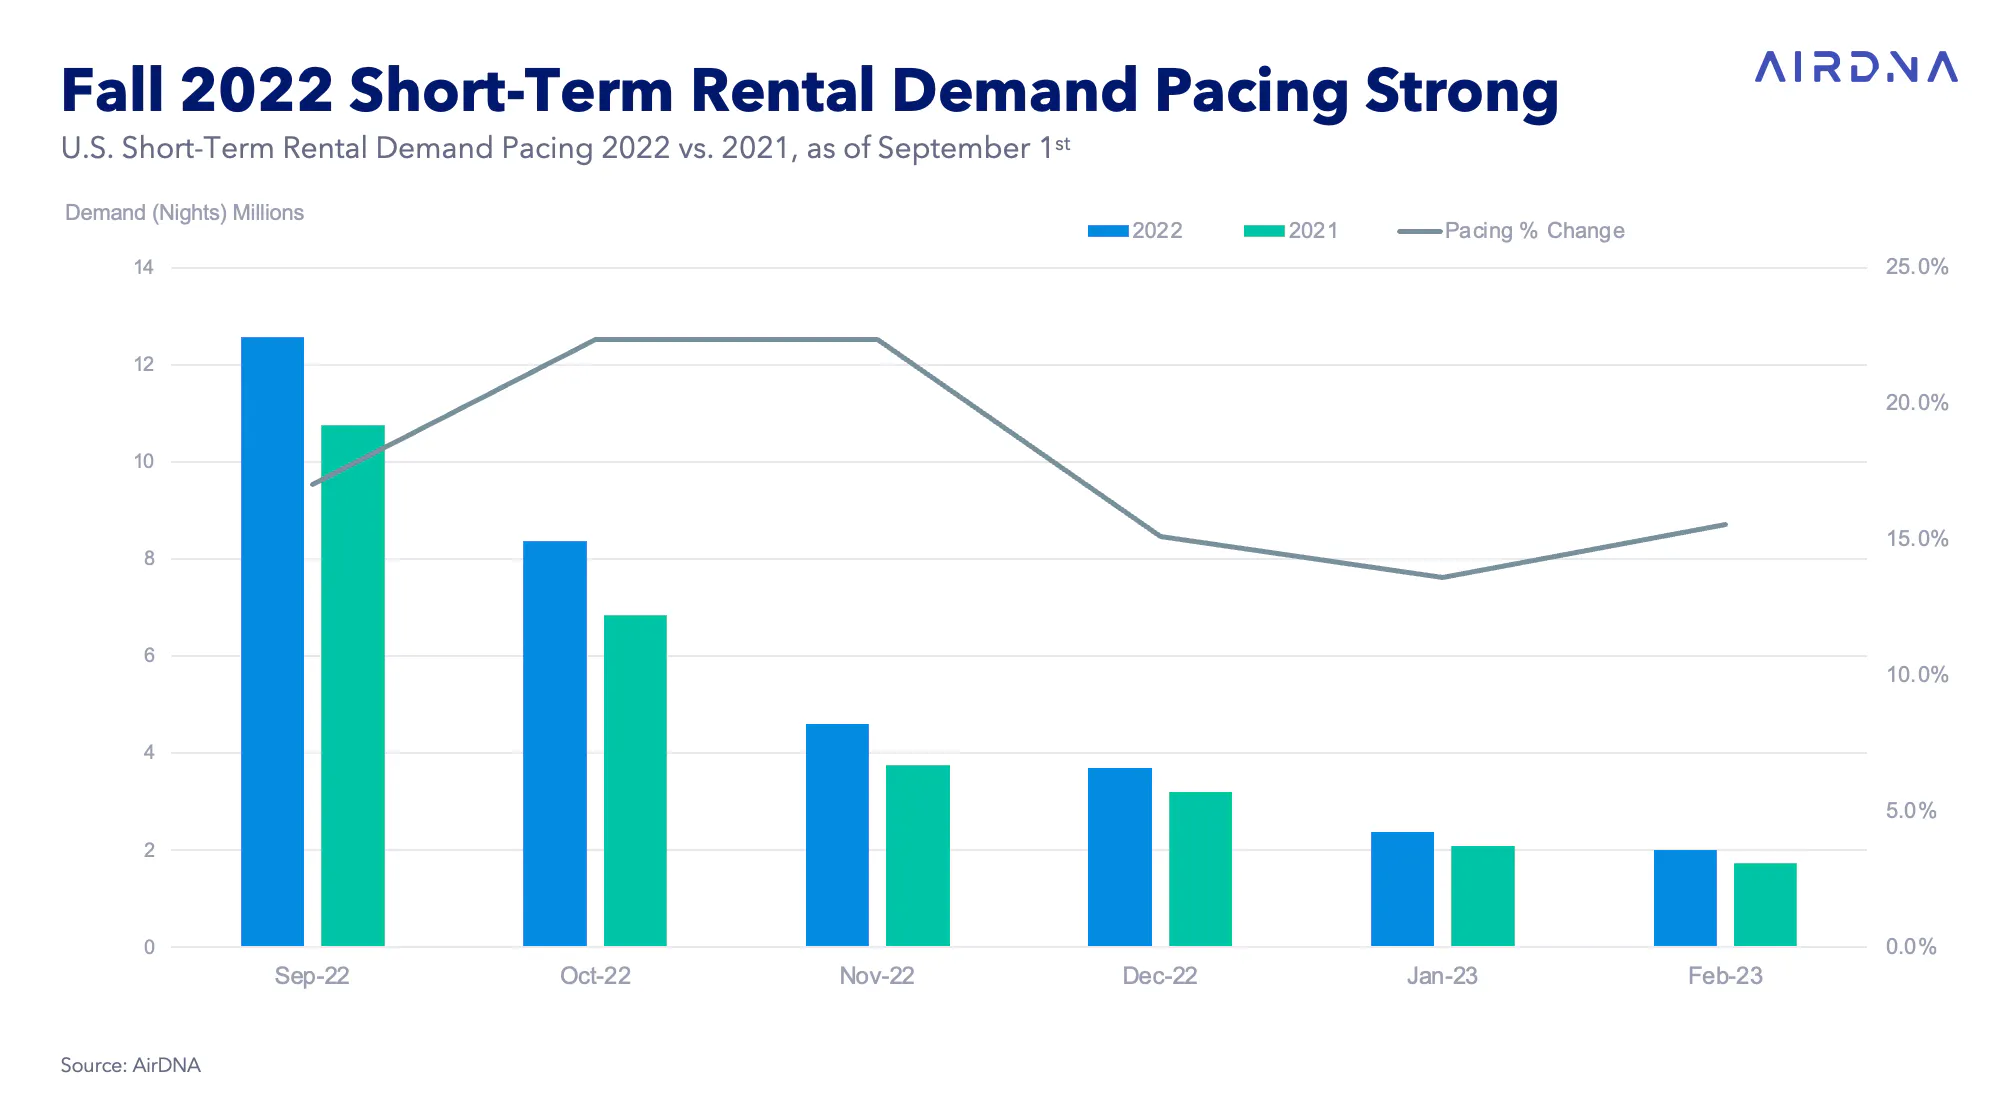
Looking at nights booked during August, the future demand picture remains strong. Nights booked for future travel were up 26.7% year-over-year, an expansion from the +20.3% reading in July.
As we look out over the next six months, nights currently “on the books” are averaging 18.4% higher than at the same point last year. Bookings made through September 1st for October and November are looking especially strong, with demand pacing over 20% higher as the pre-holiday period approaches.
Domestic travelers have increasingly been using the Thanksgiving and Christmas holidays as a chance to book STRs to gather family and friends together. This is a unique opportunity for hosts of larger properties in all markets.
As we look towards the holiday season, the weeks of both Thanksgiving and Christmas are seeing robust advanced bookings as well as significant increases in ADRs. Vacation rental companies have been aggressively raising ADRs for the past year, and this provides hosts some cover to raise their own rates while remaining at cost parity with the broader hospitality industry.
For Thanksgiving, demand is tracking +24% over 2021 levels, with ADRs up more than 10%. The current pacing of demand for the last week in December is up a more modest 18% compared to last year, with ADRs tracking 8.8% higher— noticeably cracking above the current rate of inflation in the U.S., a welcome indicator for hosts concerned about winter bills.
ADR Gains Fail to Keep Pace With Inflation
ADRs increased by just 2.8% in August - the lowest year-over-year increase since the start of the pandemic. The slowing ADRs are manifesting from a variety of factors but it's most apparent at the high end with luxury properties (those with the highest 20% of ADRs in a market). Across the luxury tier, ADRs went from a 5% year-over-year decrease in July to a 5.6% decrease in August.
Luxury property hosts still have the intermediate wind at their back, with the highest ADR growth when compared to 2019 at +18.4%. But it is more than plausible that the excess ADR growth seen in 2021 is not sustainable given overall listings supply growth, and the seasonality effects of the holiday months, when luxury travelers trade the Rockies for the Alps.

Properties in mountain/lake destinations were the only location type to see an overall decline in ADRs for the month, down 1.7%, a result largely driven by a 11.8% decrease in luxury ADRs in those markets.
The markets with the biggest declines in ADRs were generally located in the Mountain West, led by Steamboat Springs, Colorado, (-29.8%), Big Bear, California, (-23.6%) and Park City, Utah, (-23.5%).
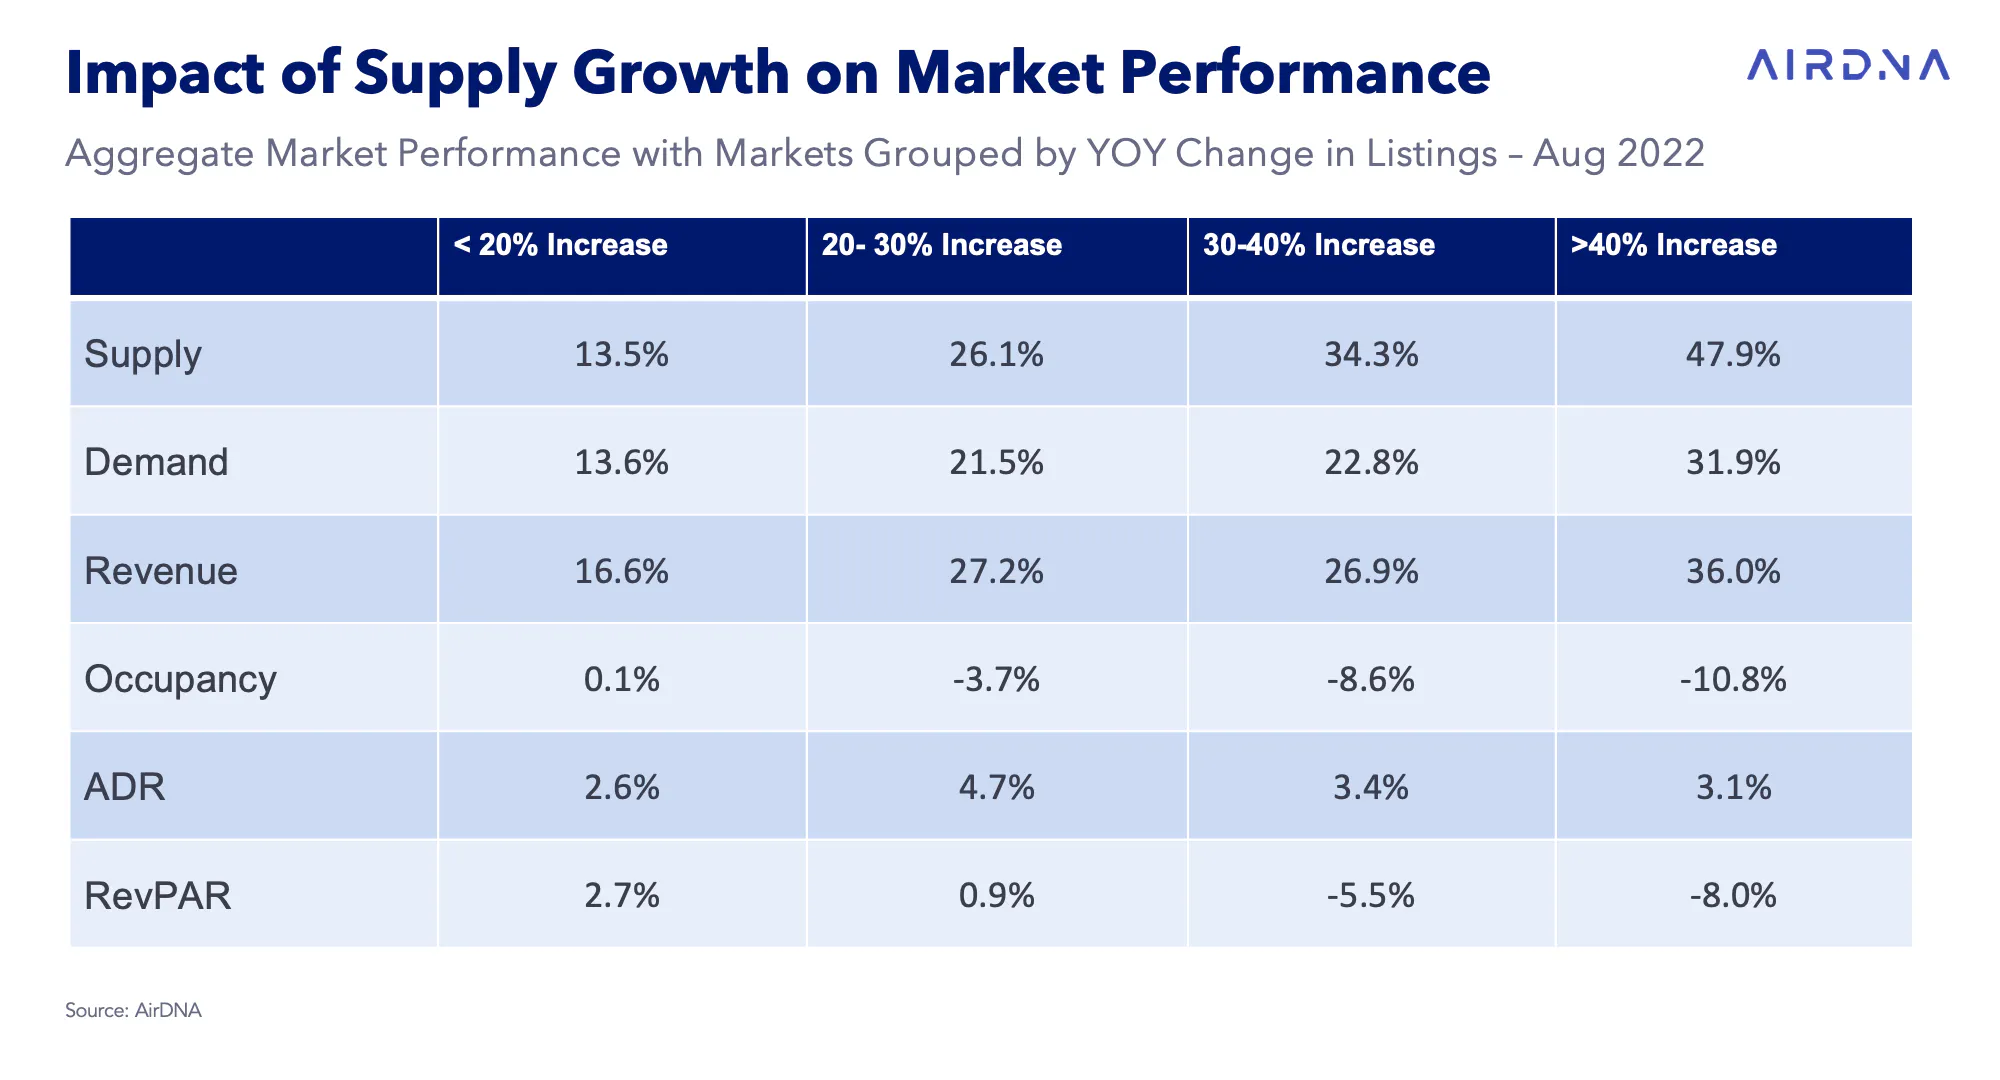
Not surprisingly, the other major factor impacting ADR growth is the broad-based growth in listings supply. When comparing the performance across 265 U.S. short-term rental markets as defined and collated by AirDNA, we see that the markets with the highest year-over-year increase in listings (40% growth or more) are seeing the sharpest decreases in occupancy, ADR, and RevPAR (Revenue Per Available Rental).
The average property in a market with less than a 30% increase in listings growth year-over-year was still able to maintain positive gains in RevPAR in August, but nationwide the STR market had a RevPAR decline of 1.7% during the month. While this is a better reading than the 4.1% decrease in July, it does continue a streak of four consecutive months of declining RevPAR for the industry. It should be noted that RevPAR for the short-term rental industry can be pushed lower than its true potential, as some hosts only choose to have their properties rented for a few windows of time per year, in stark contrast to a hotel industry that is “open for business” 365 days per year, at least in year-round destinations. The multi-year trends in RevPAR and ADR both point to sustained strength coming out of the pandemic and a long runway to add more capacity in the form of listings supply.
Demand for short-term rentals remains resilient, and the industry has clearly established a floor after a sustained rebound from the worst of the pandemic in 2020. Mixed macro signals for the U.S. economy and persistent inflation remain the biggest enemies to the travel demand picture over the coming months.
It is incumbent on hosts to keep refining and upgrading their value proposition to prospective guests - not just into the holiday period of 2022 but in the coming years. A recent McKinsey study found that while 78% of U.S. travelers say they are comfortable staying in a hotel, far less – only 61% – are comfortable staying in alternative accommodation. This implies a strong runway for future growth as the STR industry continues to evolve its professional messaging and service offering to the domestic traveler.

Europe Calling
Is a record summer for demand in Europe impacting US domestic bookings? Find out more on booking trends in our Europe Market Review.
Market Insights
Understand your market to price smarter and boost occupancy with AirDNA's MarketMinder™

Bookings Down? Don't Panic
If your short-term rentals are tracking behind 2021’s numbers, know that you’re not alone. And there may be no need to sound the alarms.
ARTICLE SUMMARY
The U.S. short-term rental industry has shown no weakness during summer 2022, despite growing inflation and uncertainty in the overall macroeconomic backdrop. August was another record month for STR demand: over 20.7 million nights stayed (+19.8% YOY), slightly higher than the growth of 17.9% the month before.
Scott Sage
Senior Vice President, Marketing & Customer Experience
Scott is an Airbnb Superhost and industry pro, having founded Home Base BnBs—a short term rental management company that scaled to 200+ units. Scott combines his experience and passion for hosting to empower AirDNA customers' success. When he's not thinking about STRs, he is hiking, playing basketball, or playing pickleball.