


U.S. Review February 2026: Demand Slows, but Event-Driven Travel Signals a Comeback
Published: March 24, 2026
Last updated: October 30, 2026

Scott Sage

Key Takeaways:
- The U.S. STR market is rebalancing as supply continues to outpace softening demand, pushing occupancy lower but signaling a return to more typical travel patterns.
- Booking activity remains steady despite lower demand, suggesting forward demand is holding as travelers shift toward shorter booking windows and more seasonal travel.
- RRI continues to outperform ADR, with established operators maintaining pricing strength even as overall market performance softens.
February 2026 saw U.S. short-term rental supply continue to expand while demand softened, putting downward pressure on occupancy across the market. Although demand has cooled following sustained post-pandemic growth, booking activity remains steady, pointing to a more normalized travel environment.
Average daily rates (ADR) held relatively stable, helping to offset some of the impact on revenue, while the Repeat Rent Index (RRI) continued to climb, indicating ongoing pricing strength among established operators. As seasonal travel patterns shift, demand is becoming more concentrated around peak and shoulder periods rather than evenly distributed throughout the year.
At a Glance: Key U.S. STR Performance Metrics for January 2026
- Revenue per Available Rental (RevPAR) increased 2.6% year-over-year (YoY) to $154.00
- Available listings reached 1.61 million, a 2.9% increase YoY
- Demand nights were up 0.9%
- Occupancy averaged 59.3%, down -0.7% YoY
- Average Daily Rates (ADR) climbed to $259.58, up 3.3% from last year
- The Repeat Rent Index (RRI) rose 4.4% YoY
- Total nights booked were up 7.2% from 2025
Economic Outlook
The U.S. labor market appears to be on shakier ground than expected, with 92,000 jobs lost in February. Unemployment ticked up slightly to 4.4%, even as labor force participation dropped to 62.0%, its lowest level since December 2021, when the economy was still recovering from the pandemic shock. Concerns about future employment may influence consumers to defer or downscale travel plans.
The inflation report provided a brief respite from gloomy economic news, with the year-over-year (YoY) change in the CPI remaining steady at 2.4%. Although slightly above the Fed’s 2.0% target for stable prices, the report was widely seen as confirmation that tariff passthrough as an inflationary factor has diminished. Additionally, a Supreme Court ruling has rendered many of the tariffs imposed under emergency provisions invalid. Although the administration quickly used other legal levers to impose global tariffs, the total effective rate appears to have stabilized.
Unfortunately, this report came just before the U.S. attacks on Iran and the subsequent closing of the Strait of Hormuz, a series of events that has driven WTI crude oil prices more than 40% higher than at the end of February. Liquid natural gas also passes through the strait, and those prices have begun increasing as well. The crude oil price shock has had, and will continue to have, an impact on gasoline prices, but oil prices can also transmit more broadly through energy markets. Oil prices also affect freight costs and raw input prices. Higher energy prices can therefore enter inflation calculations both directly and indirectly, adding to consumer uncertainty and potentially straining budgets.
In the past, inflation has had the contemporaneous effect of reducing pricing power for hosts. However, even with a continued surge in oil prices, Oxford Economics does not expect inflation to reach the post-pandemic highs seen in 2022. One factor to watch is whether the Trump administration pressures the Fed to cut rates too quickly, which could lead prices to rise more rapidly.
Listing Growth Down A Little, But Not Out
Listing growth responded negatively to interest rate hikes that started in March 2022, as high home prices and rapidly increasing mortgage rates put the U.S. housing market in a deep freeze that continues to this day. However, recent interest rate cuts that have lowered mortgage rates, along with tax incentives for commercial real estate and stabilizing STR occupancy, have added tailwinds to supply.
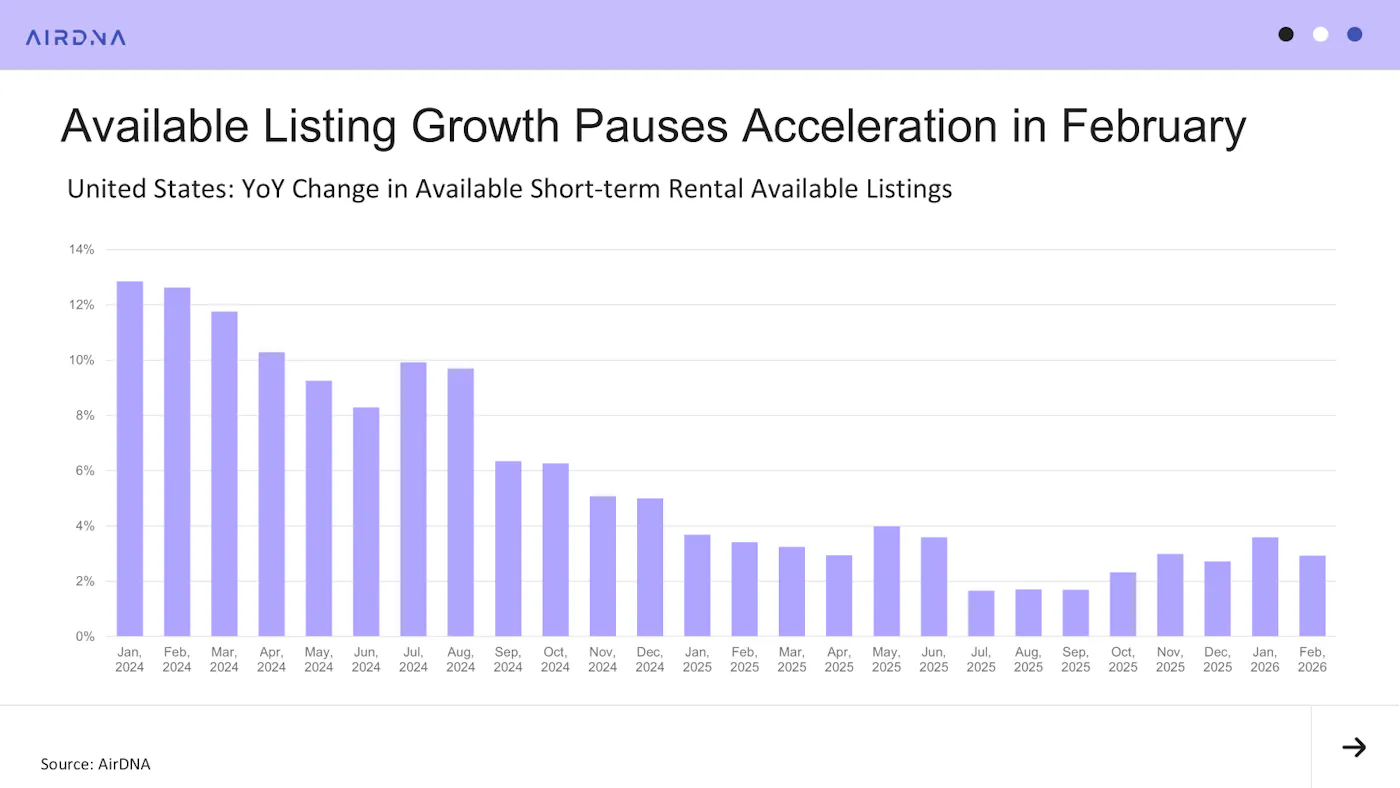
Since the sub-2% growth rates of the past summer, available listing growth has made a halting recovery, so far peaking in January at 3.6% YoY. February saw a slight deceleration to 2.9%, but still ahead of five of the past seven months. Especially cold weather in January caused home sales to decline from already low levels, and it may have had a similar effect on hosts preparing to introduce new listings.
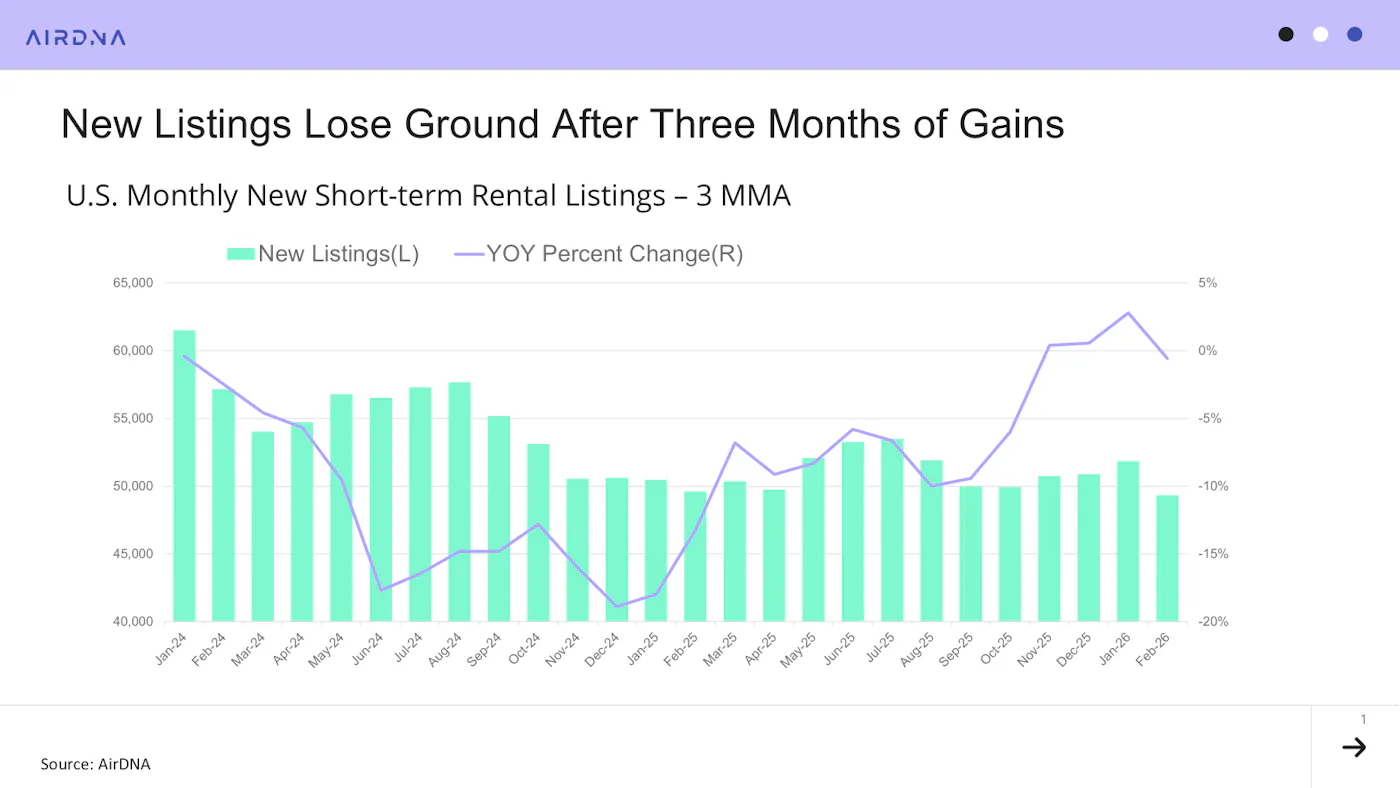
In fact, new listings saw a more precipitous decline than overall listing growth. After three straight months of YoY increases in new listings entering the market, growth fell from +2.8% in January to -0.5% in February. Prior to November 2025, new listings on a YoY basis had been in freefall, so while the slowdown in growth is an unexpected turn, it is not so severe that AirDNA believes it marks the beginning of a trend. Rather, weather effects and random noise may be responsible.
Bookings Surge Even as Demand Flags
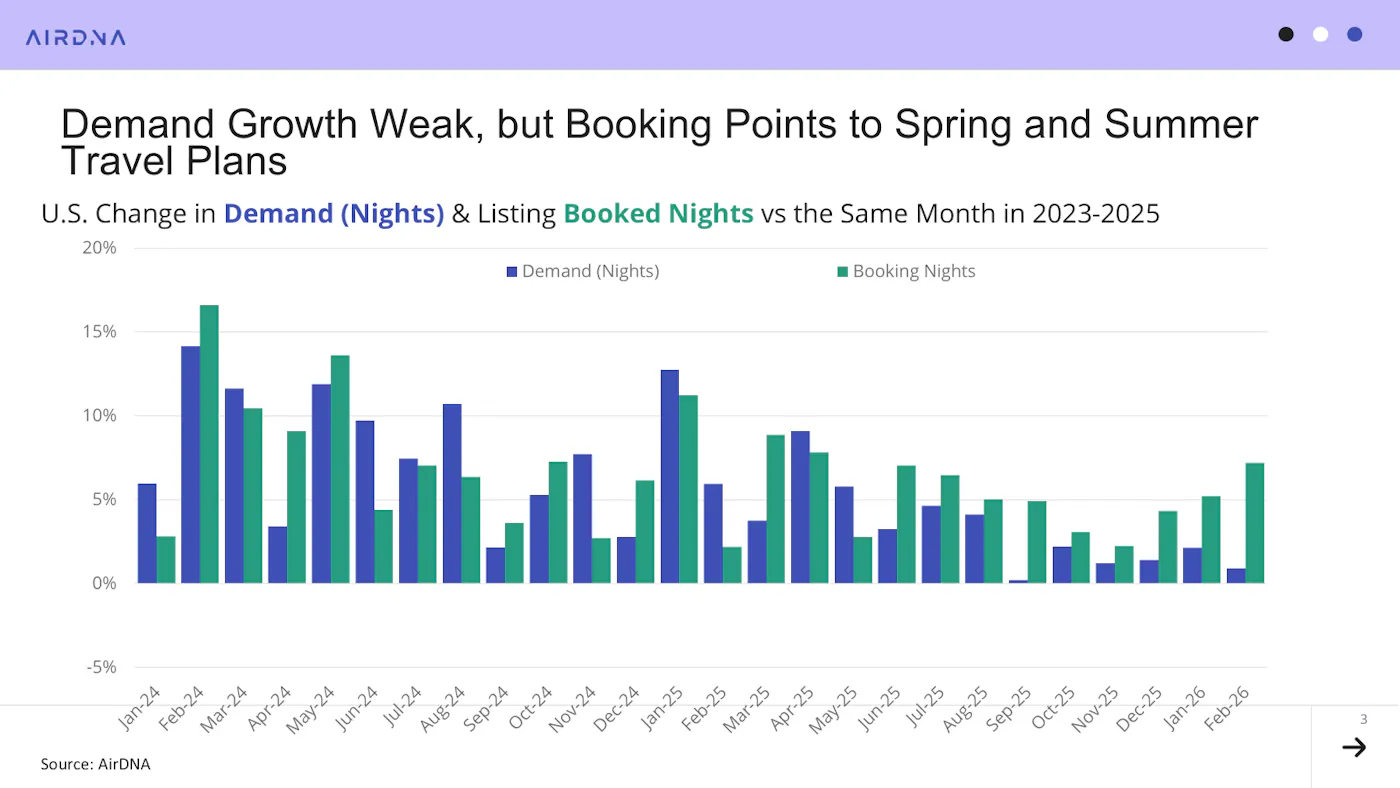
February demand growth was weak, at 0.9%, and marked only the second time AirDNA has recorded YoY demand growth below 1% since February 2021. Still, bookings continue to accelerate for the third month in a row, illustrating greater enthusiasm for future travel. Strong Spring Break bookings and mounting reservations for the World Cup are contributing to booked nights, which were 7.2% higher than the previous February.
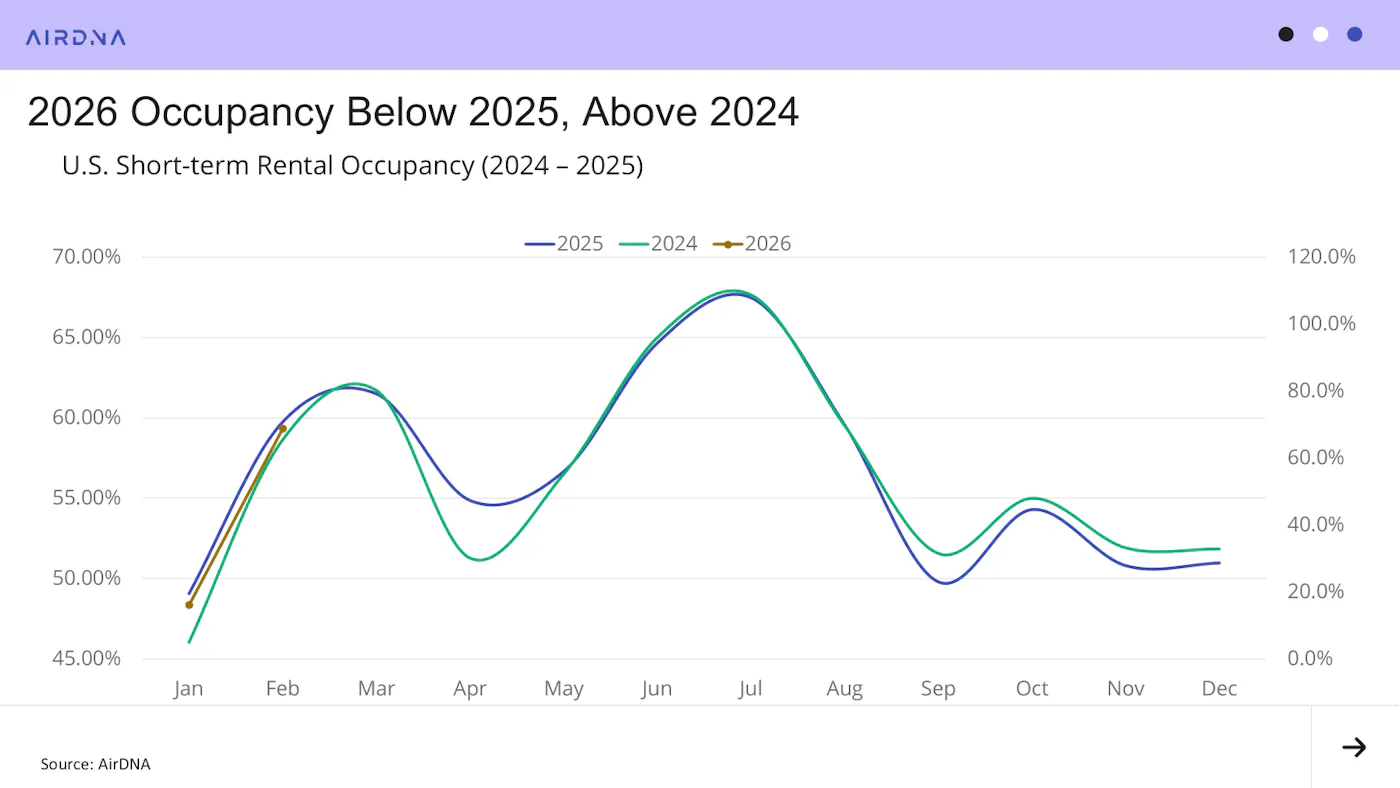
Together, slowing supply and sluggish demand in February produced occupancy below last year, but above 2024. So far, 2026 is tracking slightly more closely to 2025’s occupancy path, which was particularly strong during the first half of the year.
Pricing Power Remains
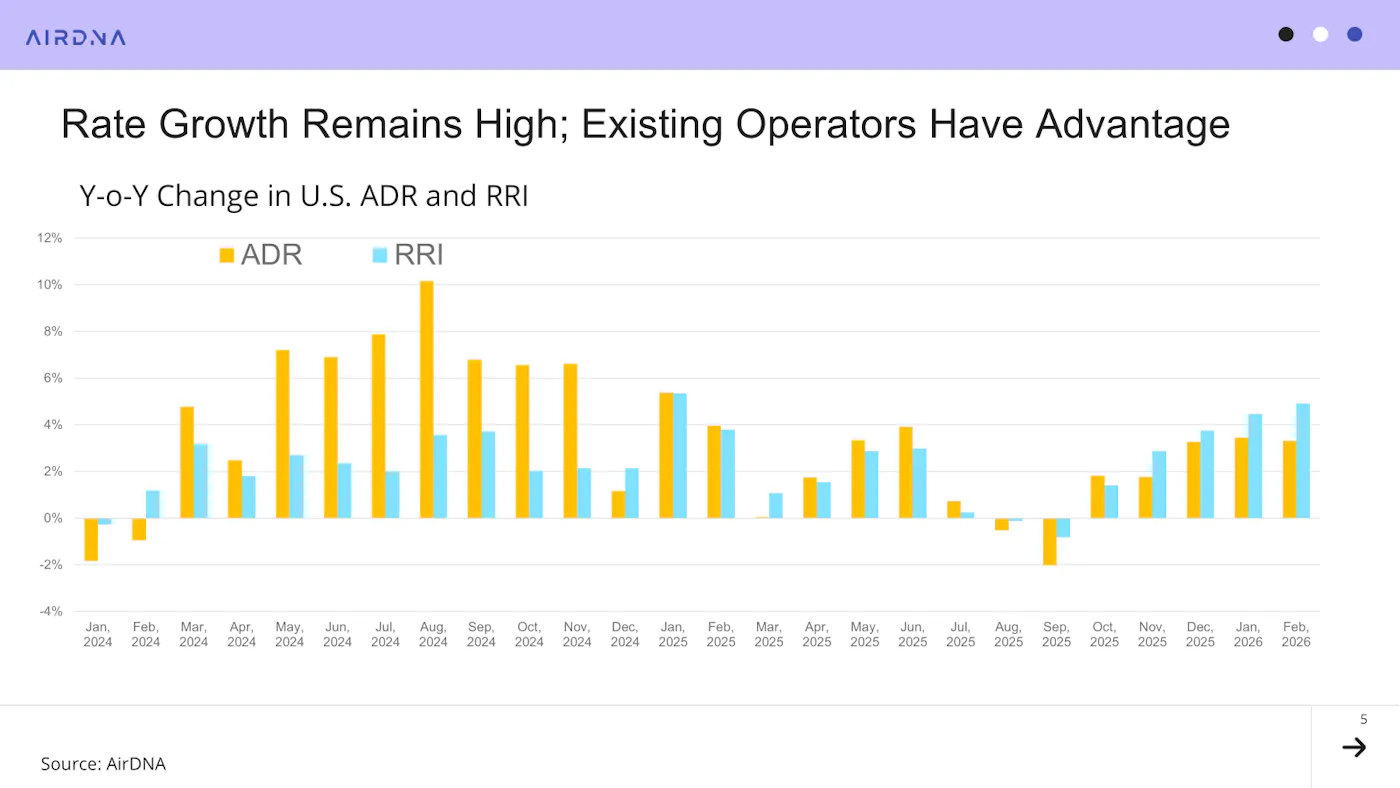
A bright spot for STR performance in February was pricing. ADR grew at 3.3%, slightly less than the 3.5% rate seen in January, but well above the 2.4% inflation rate. The AirDNA Repeat Rent Index (RRI) posted even stronger results at +4.9%, marking the fifth month in a row that RRI growth has accelerated. When RRI growth is above ADR growth, operators currently in the market can price more aggressively than new entrants. Typically, this occurs when new entrants position themselves as more value-conscious and operate smaller listings than the existing market.
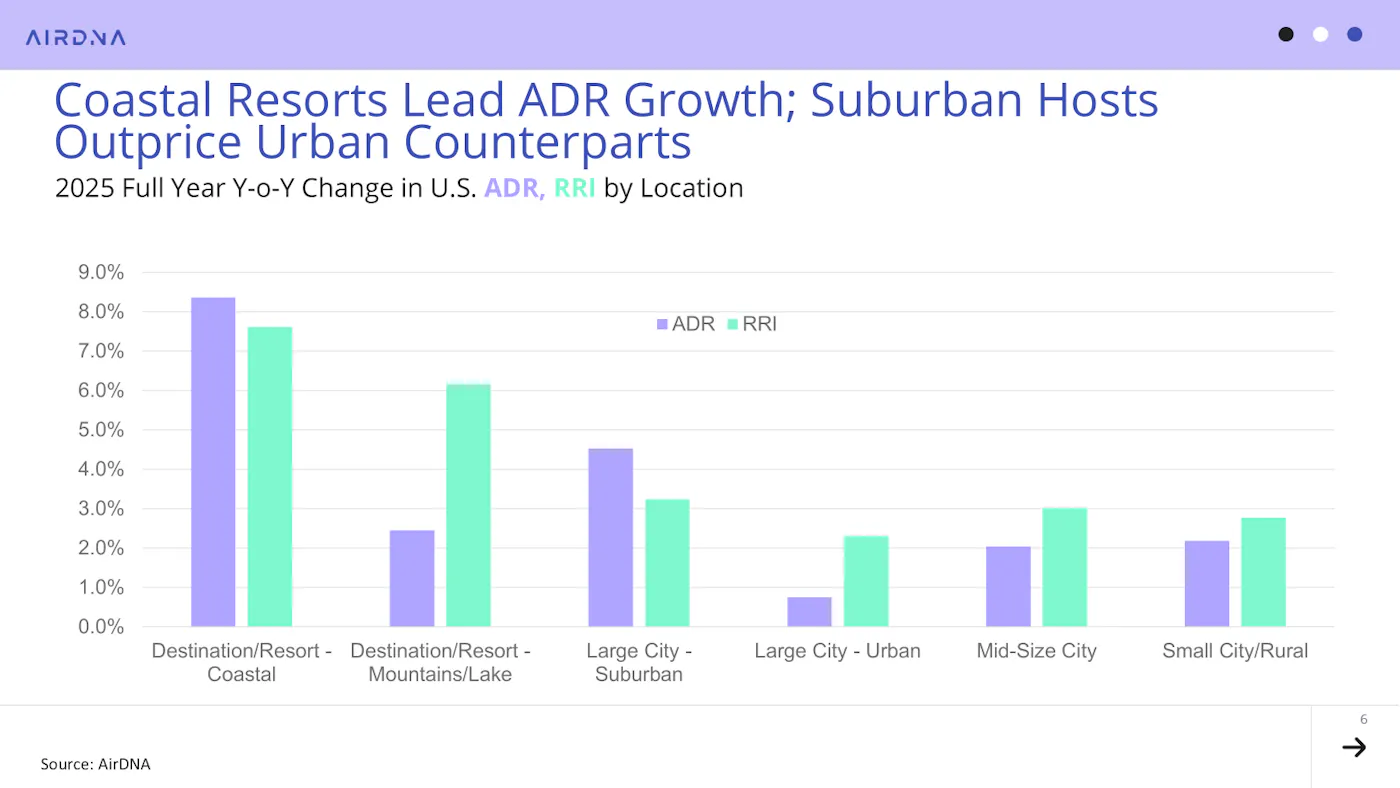
Interestingly, when turning to location types, Coastal Resorts saw the largest increase in ADR (+8.4%), as markets such as Key West, Florida (+5.8%), Kauai, Hawaii (+7.9%), and Santa Rosa/Rosemary Beach, Florida (+17.3%) were able to take advantage of bitter cold driving travelers to warmer locales.
Mountain/lake resorts saw some relief as the snow drought that plagued much of the West in January relented somewhat, but existing operators were more able to raise their rates, causing RRI growth to exceed ADR growth substantially (+6.2% compared to +2.5%).
Urban locations saw weak pricing power (+0.7%), easily outmatched by their suburban counterparts (+4.5%).
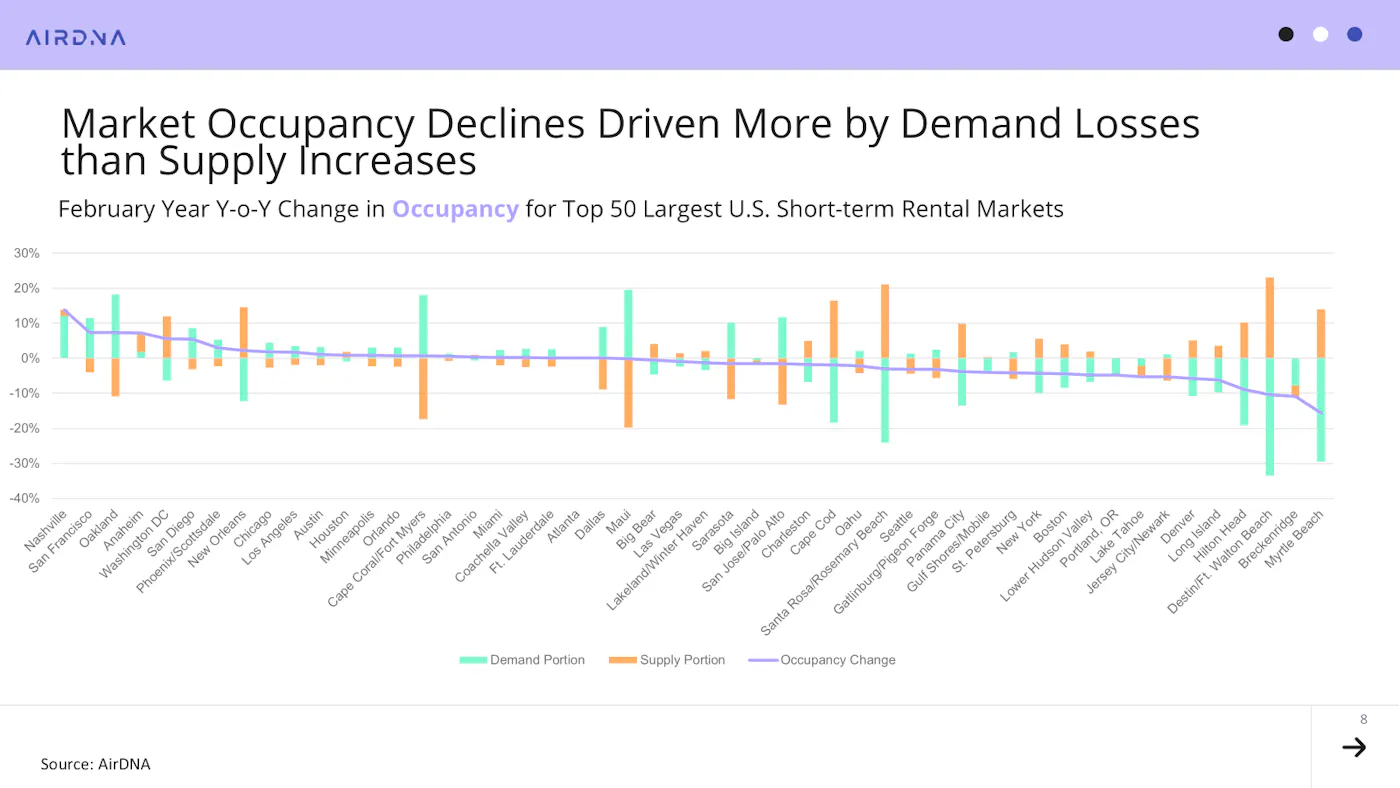
Turning to markets, of the top 50 U.S. STR markets, 28 recorded declining occupancy. While past occupancy declines nationally were driven by the incredible supply expansion following outsized post-pandemic performance in 2021, demand shortfalls are more responsible for February’s decline.
In the chart below, we decomposed the effect of changing supply and demand on occupancy. When demand has increased YoY, this is represented by a teal bar above the zero line, indicating that additional demand is contributing to occupancy gains. On the other hand, when supply has increased, this creates an orange bar below the zero line, indicating that new supply is contributing to occupancy losses. The reverse also holds, with decreases in demand and supply subtracting from and adding to occupancy, respectively.
Glancing at the markets losing occupancy on the right-hand side of the chart reveals that many of these markets saw larger-than-usual seasonal supply declines. In these cases, the occupancy declines can therefore be attributed to weak demand. Many of these markets are also coastal resort markets, meaning the high ADR and RRI growth seen in this location type may have been supported by lower-quality listings not being offered in these markets due to expectations of weak demand.
On the other hand, the top markets for occupancy growth, including Nashville (+13.8%), San Francisco (+7.4%), and Oakland, California (+7.4%), generally saw increasing demand.
Forward Pacing Signals Strong Q2 and Beyond
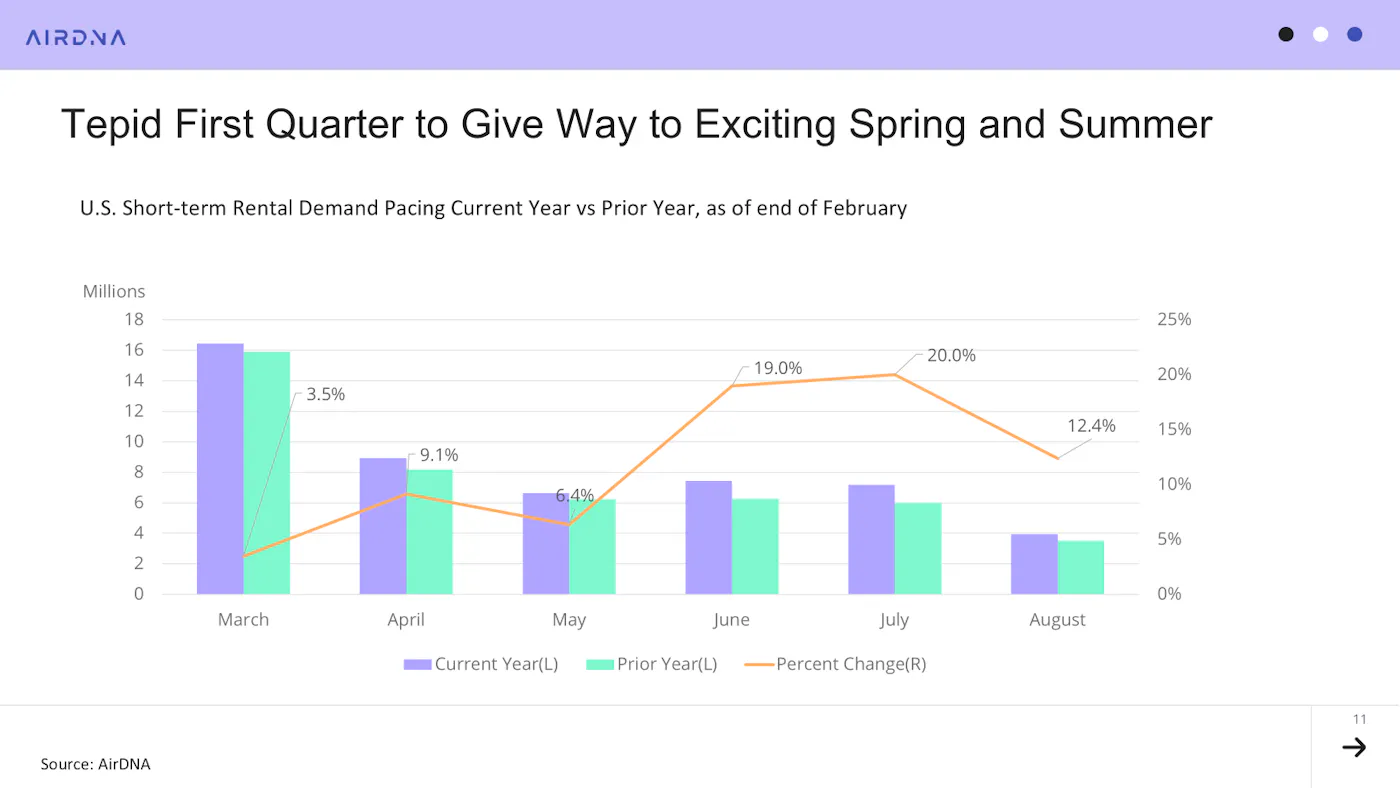
Slow demand in January and February, and potentially in March, is consistent with our pacing models from previous months. Meanwhile, April through August appear to accelerate substantially, as plans for Spring Break, which this year most frequently falls near the end of March or early April, and the summer travel season, including World Cup matches, drive bookings. While early booking may be pushing summer pacing beyond where eventual demand may land, the pacing is a strong positive signal for travel plans in the upcoming quarter and beyond.
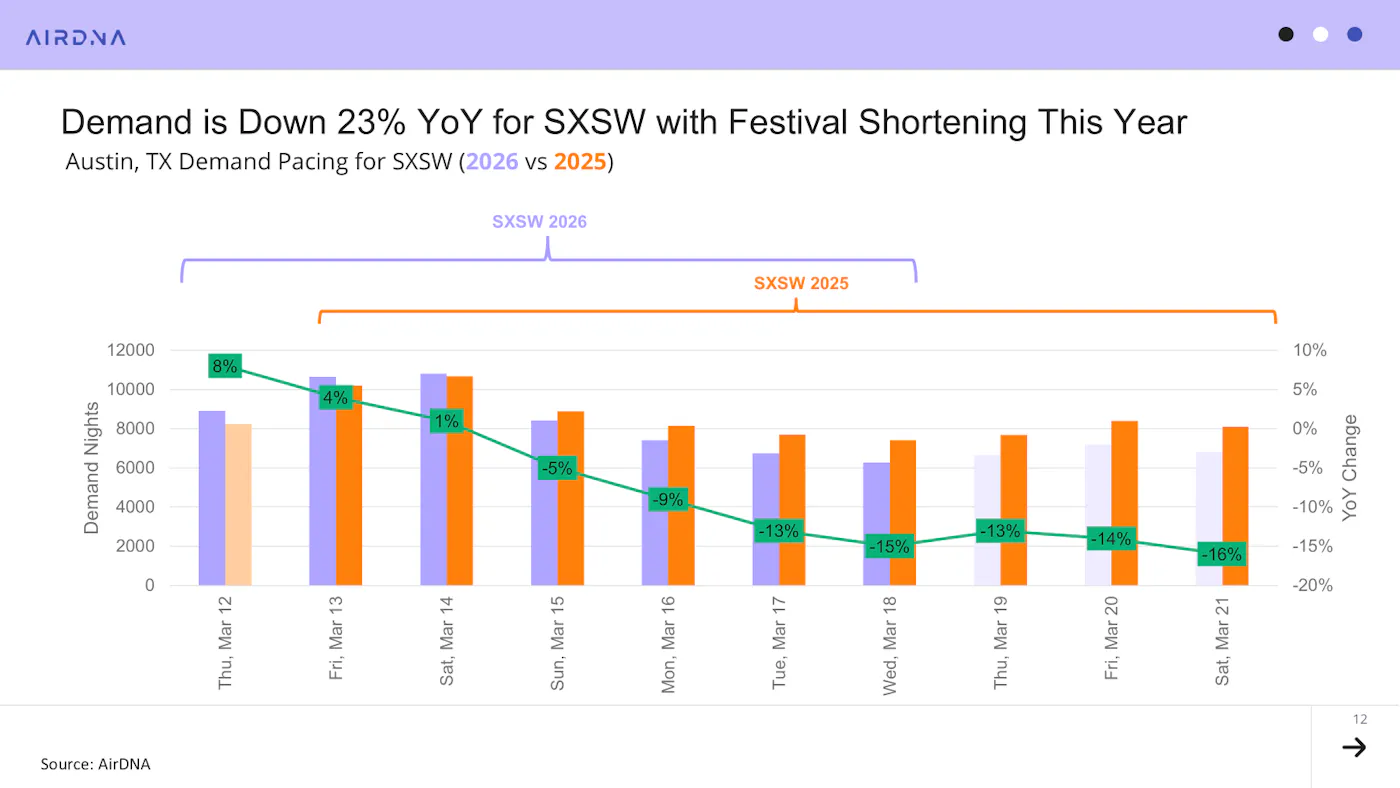
Besides the World Cup and Spring Break, spring music events are also currently driving bookings. In the case of the famous SXSW festival in Austin, however, a slightly shorter planned duration is having some negative impact on pacing for the event, particularly nearer the latter half of the festival, which falls on Monday, Tuesday, and Wednesday. The shortening of the event naturally allows for fewer demand nights, but the day-of-week timing may also make it less worthwhile for some travellers to take time off work and travel for the last few days of the festival.
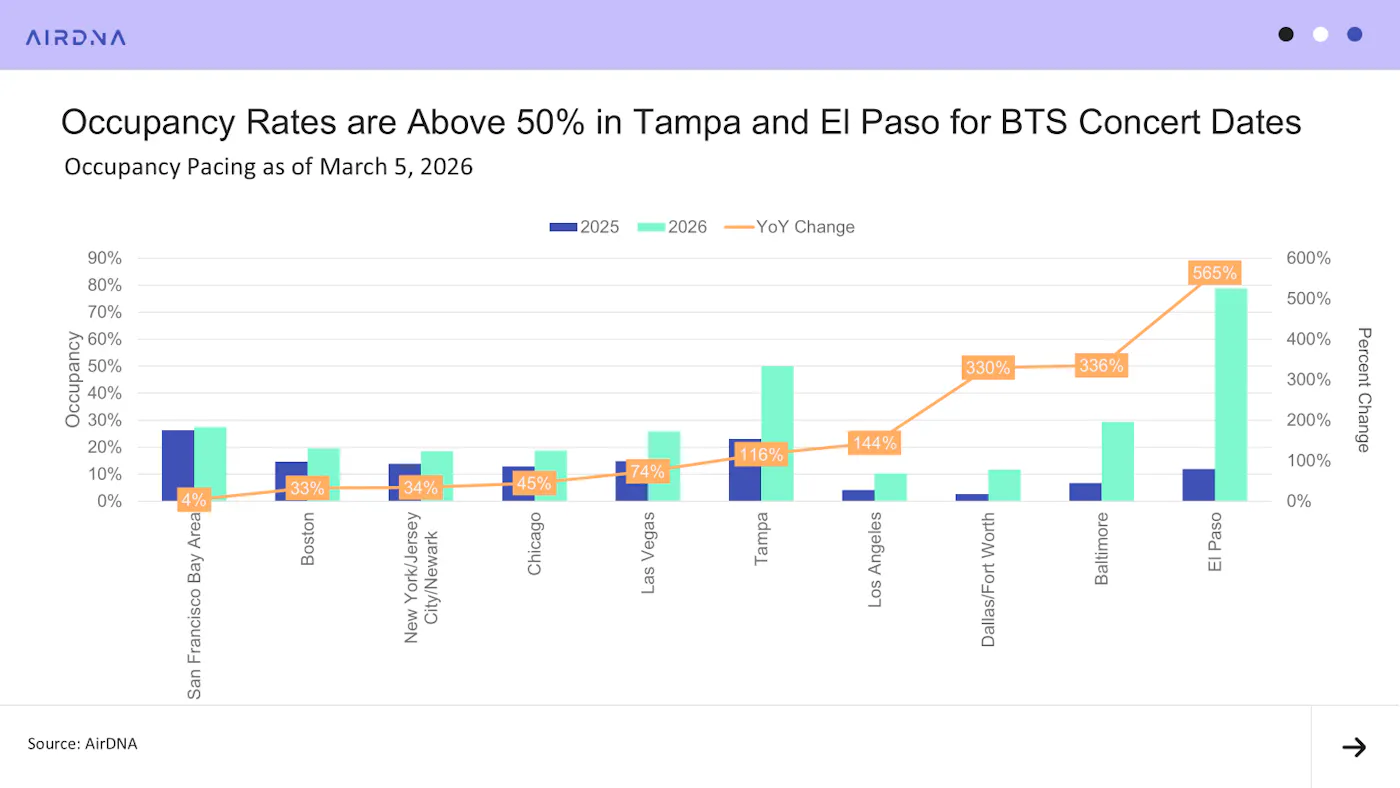
On the other hand, the relentlessly popular Korean pop outfit BTS is planning an extensive world tour with many stops in the U.S., and reservations are already pacing briskly. Notably, in Tampa, Florida, and El Paso, Texas, where stops occur in late April and early May, more than half of available STR listings have already been booked. For El Paso, this amounts to a +565% increase in occupancy for those dates compared with the same time last year, with total occupancy close to 80%.
Other markets seeing large effects in their paced occupancy include Baltimore at +336%, the Dallas/Fort Worth area (with the concert held in Arlington) at +330%, and Los Angeles (with the concert held in Inglewood) at +144%.
ARTICLE SUMMARY
February’s U.S. STR market showed mixed signals, with softer demand and easing supply growth pushing occupancy down, while strong booking activity for Spring Break, the World Cup, SXSW, and BTS tour dates points to a more active Q2 and summer ahead.
Scott Sage
Senior Vice President, Marketing & Customer Experience
Scott is an Airbnb Superhost and industry pro, having founded Home Base BnBs—a short term rental management company that scaled to 200+ units. Scott combines his experience and passion for hosting to empower AirDNA customers' success. When he's not thinking about STRs, he is hiking, playing basketball, or playing pickleball.
Related


Get started with AirDNA today.
Powerful, easy-to-use tools that help hosts and investors succeed in the short-term rental market.
Try for free