


U.S. Review December 2024: Year-In-Review
Published: January 28, 2025
Last updated: November 13, 2026

Bram Gallagher

Key Takeaways:
- Short-term rental demand grew 6.8% year-over-year (YOY) in 2024, driving a 3.7% increase in RevPAR and reversing prior declines.
- Slower supply growth (+3.3% YOY) helped stabilize occupancy, up 0.3% YOY despite a December dip.
- Spring and summer 2025 bookings are pacing 12% higher YOY, with events like Super Bowl LIX boosting demand.
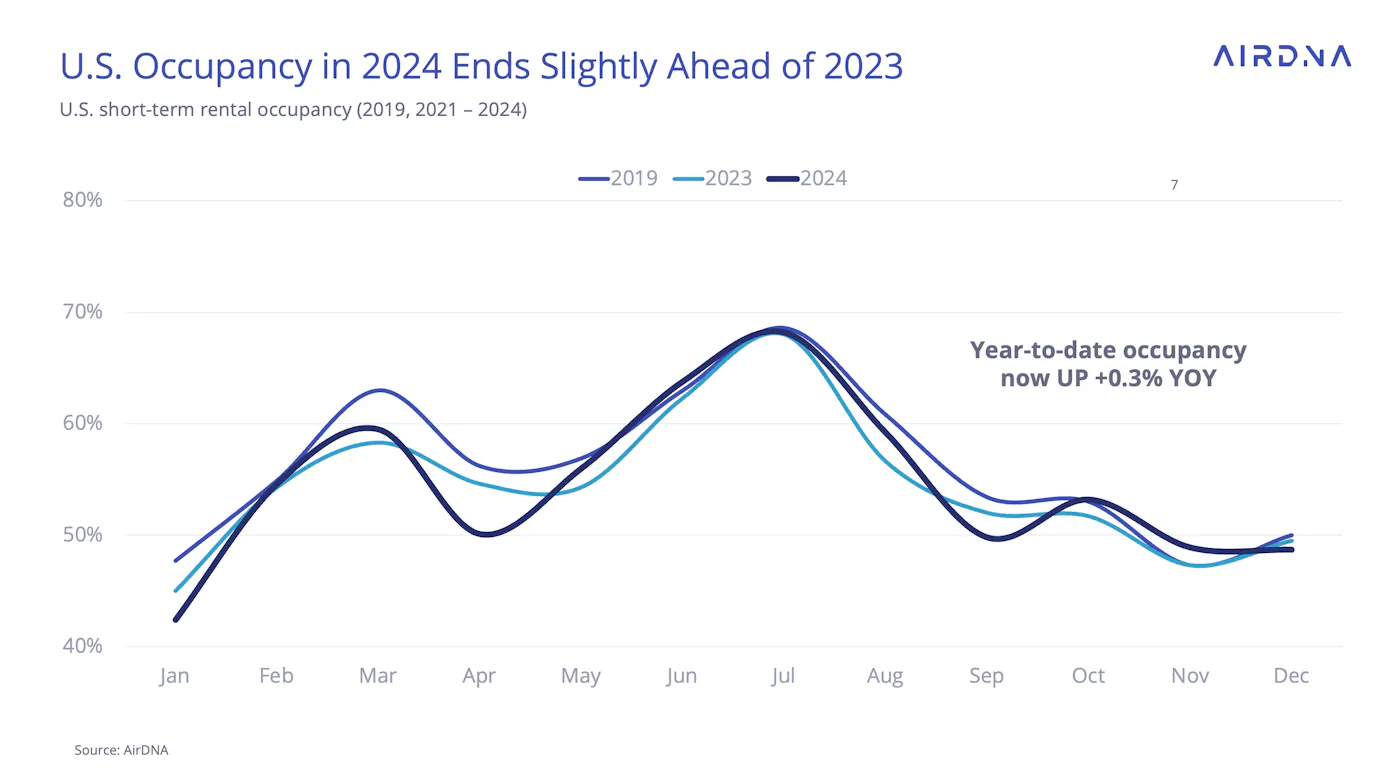
December marked the end of a year that felt like a turning point in the U.S. short-term rental (STR) market. Although occupancy had ups and downs throughout the year, culminating in a 1.6% YOY decrease in December, the year as a whole saw occupancy 0.3% higher than 2023.
Our verdict? AirDNA predicts that 2024 marks the end of declining performance since those record highs of 2021 following the lifting of pandemic restrictions.
This prediction demands further scrutiny, though: Could it really be that the slump is over? The signals indicate so.
Throughout 2024, supply growth continued to slow as high interest rates and home prices, along with a downward trajectory in occupancy, discouraged new investment. At the same time, improving feelings around inflation and potentially deferred trips from 2023 led to generally strengthening demand growth. This pattern, no doubt welcomed by operators, restored pricing power, stopped occupancy losses, and reversed the negative growth in Revenue per Available Rental (RevPAR) seen in 2023. Year-over-year, RevPAR grew 3.7%, up from -8.5% in 2023 — a promising sign for the year ahead.
Smart investments happen here.
AirDNA’s powerful yet easy-to-use tools make hosting and investing a breeze. This means having every insight you need, all in one place, always up-to-date.
Start exploring for freeEmployment and Inflation’s Impact
While tremendous headway has been made in fighting the inflation levels seen in 2022 and the beginning of 2023, market watchers are still carefully scrutinizing pricing data. The swings of the 1970s demonstrated that inflation can bounce back aggressively if interest rates are lowered too quickly, and the government seems to be heeding that warning.
The Federal Reserve’s fiscal focus is on restoring the balance between interest rates and inflation. In spite of this, policies floated by the second Trump administration may contribute to inflationary pressure. It’s likely that the Fed will prioritize keeping inflation under control over stimulating the economy with lower interest rates, so we may see higher rates into the new year.
This uncertainty is reflected in the stats. The Bureau of Labor Statistics (BLS) has released somewhat ambiguous inflation figures for December, with headline inflation increasing slightly to 2.9% YOY from 2.7% in November. At the same time, core CPI (Consumer Price Index), which excludes exceptionally volatile food and energy prices, declined to 3.2% after three stubborn months at 3.3%. The report was interpreted as a positive for the U.S. economy by most economists, although not a very strong signal to be optimistic. The consensus still favors predictions of two or fewer cuts for the entirety of 2025.
The Fed also has plenty of justification from the labor market for keeping interest rates high: unemployment lowered to 4.1% in December. Although down from 4.2% in November, the unemployment rate has wavered between 4.1% and 4.2% for the past seven months.
This is a low rate historically. The tightness in the labor market means a boost to aggregate demand could lead to shortages and potentially inflationary wage increases. Thus, the difficult investment conditions and recovered labor market that gave rise to slowing supply and strong demand in 2024 are likely to continue through the next year.
At a Glance: Key U.S. STR Performance Metrics for December 2024
- Revenue per Available Rental (RevPAR) increased 1.2% year-over-year (YOY) to $151.26
- Available listings were 1.69 million, up 4.7% YOY
- Total demand (nights) rose 3.0% YOY
- Occupancy was 1.6% lower YOY at 48.7%
- Average Daily Rates (ADR) increased 3.1% YOY to $310.84.
- Repeat Rent Index (RRI) increased by 3.6% YOY
- Nights booked increased by 8.0% YOY

Slowing Supply Growth Reflects Challenging Investment Climate
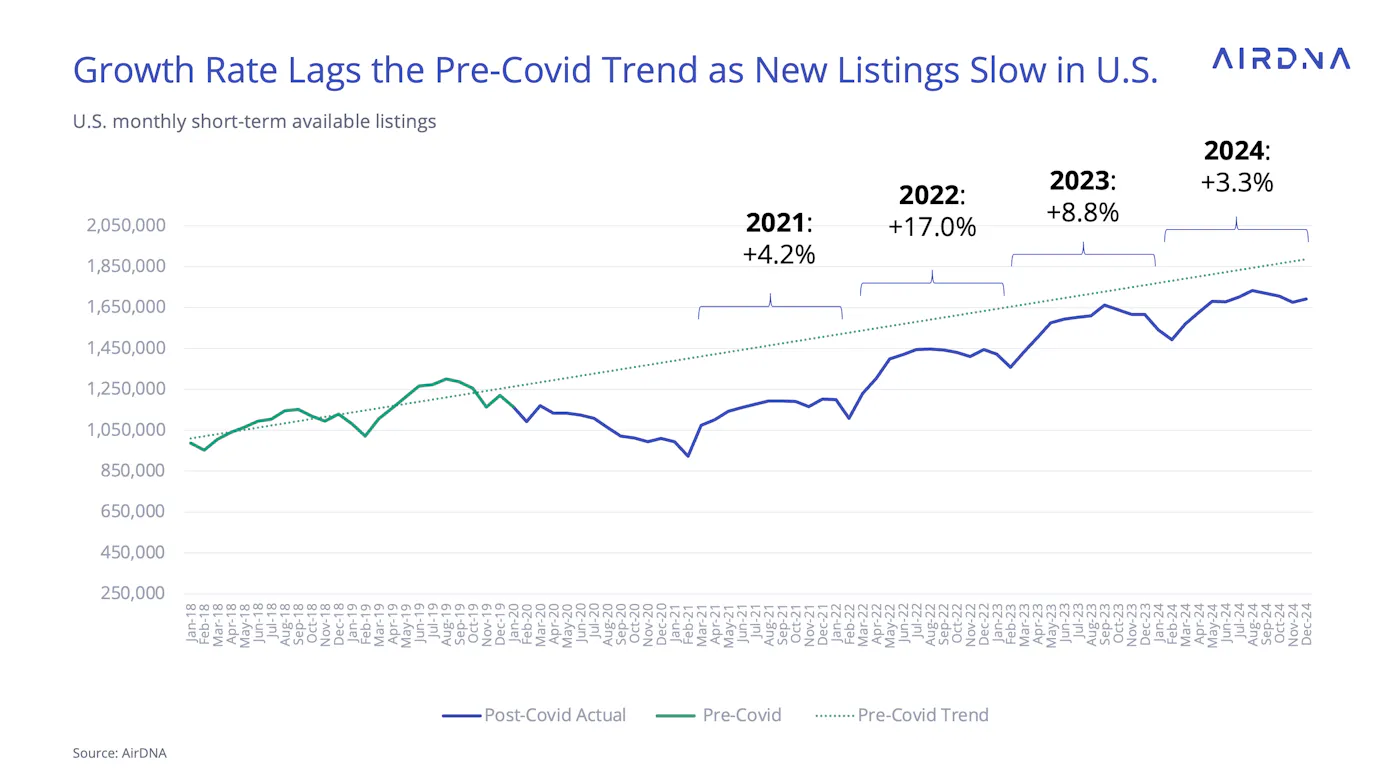
Available listings in 2024 grew at the slowest pace (+3.3%) since the downturn of the pandemic.
Prior to 2024, available listings approached the pre-Covid linear trend until about 30,000 listings shy in September 2023. This past summer, the gap widened substantially to more than 50,000 listings as annual supply growth slowed to less than the pre-Covid rate.
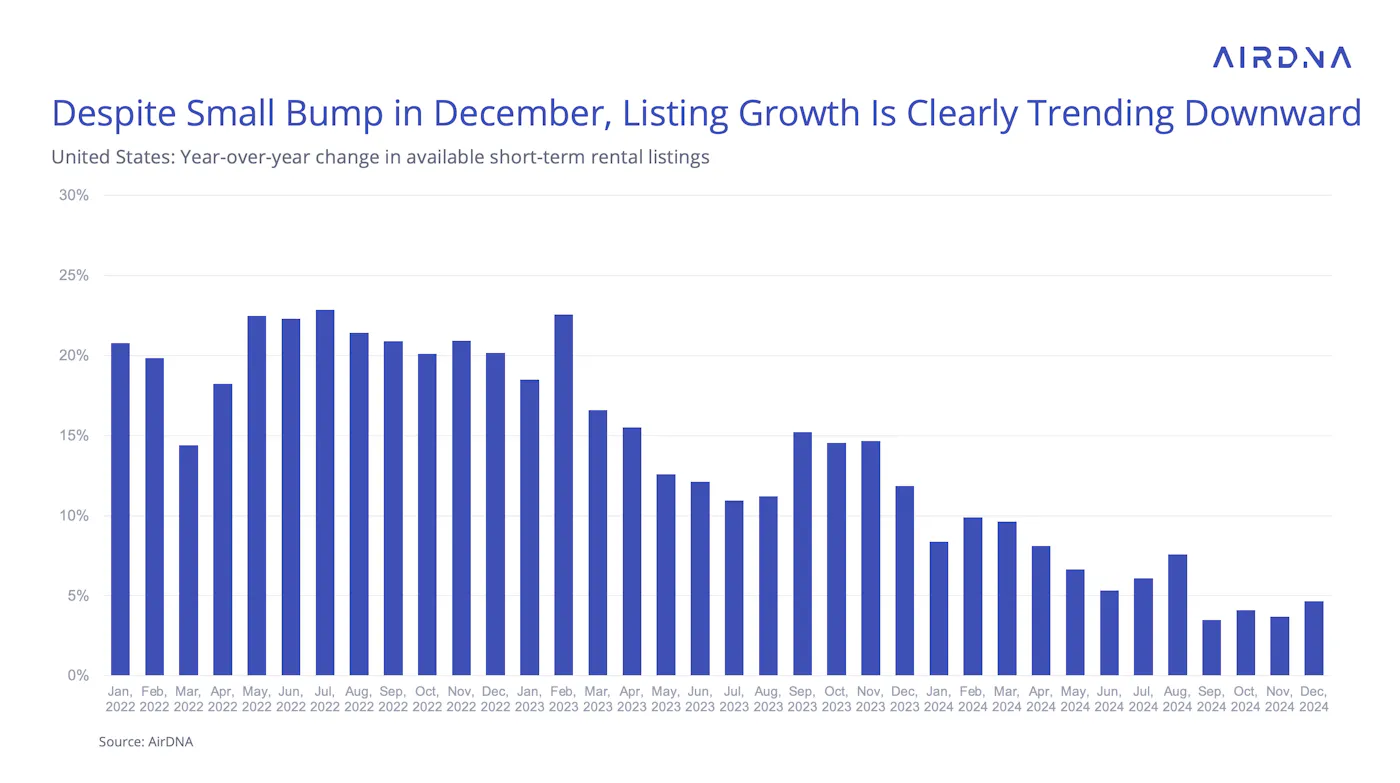
Looking at monthly growth in available listings shows a clear trend. Despite a small acceleration in December, growth remains lower than 5%. There remains a clear downward trend since high interest rates took hold in late 2022.
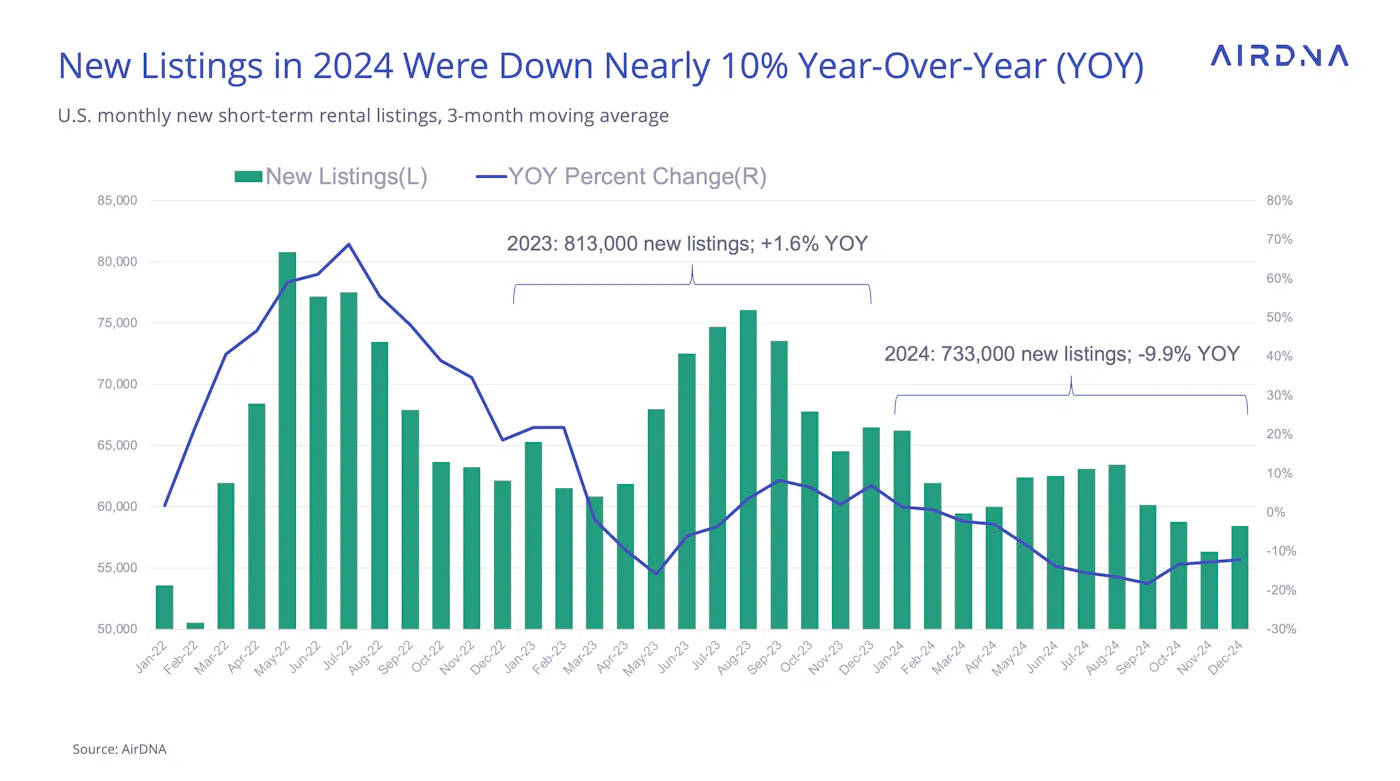
The downturn was acutely felt in new listings. The momentum from the dramatic upswing in 2022 carried through to actually increase new listings in 2023 by 1.6% YOY; however, by 2024, continued downward pressure on investment lowered the total new listings by 80,000 listings compared to 2023 — nearly a 10% decline.
How is your STR performing?
Your vacation rental may be amazing, but is it better than your competition? Connect your Airbnb listing to AirDNA to see its Booking Performance Score.
See your scoreDemand Rebounded and Occupancy Stabilized in 2024
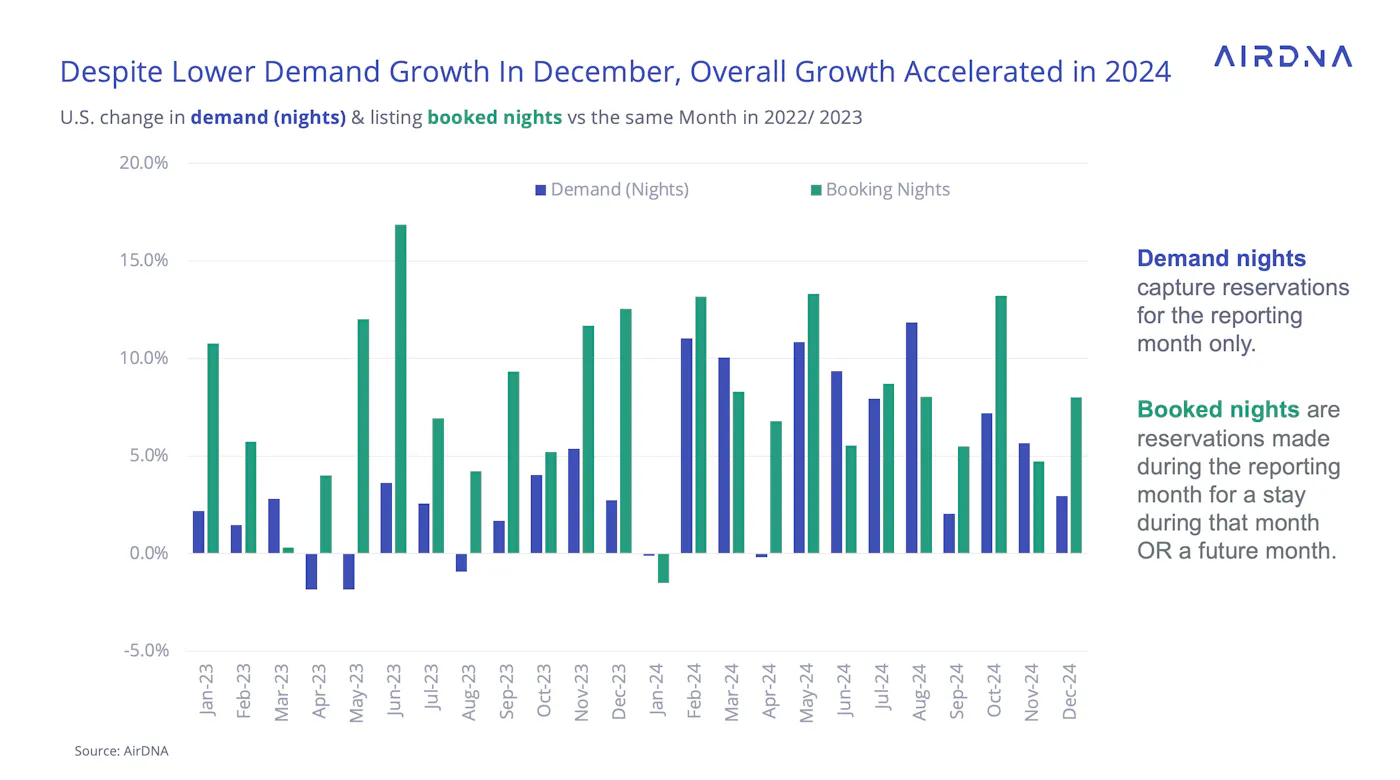
While supply slowed, demand growth had a resurgence in 2024 compared to the year previous.
Whereas demand grew feebly by 1.8% over the full year 2023, 2024 demand accelerated to 6.8%. Some of this growth may stem from deferred trips from travelers anxious about the state of the economy in 2023, and booking growth was consistent from 2023 (+8.0%) to 2024(+7.8%).
December demand growth was slightly slower than either November or October. This is likely due to Christmas and New Year’s occurring on Wednesdays, making long weekend trips more difficult to organize. Nevertheless, demand growth clearly trended upward in 2024, particularly during the high season.
Occupancy also grew on an annual basis in 2024 for the first time since the initial lifting of Covid restrictions in 2021.
Consistently slowing supply allowed occupancy in 2024 to settle into a familiar pattern as in 2023, albeit with a few calendar shifts. Although December was slightly down, –1.6%, the year as a whole ended +0.3% higher.
Although the gain was small, and occupancy for the year is still lower than in 2019 (-2.9%), it seems occupancy has found a bottom, and the current trend is a slow reversion to long-run averages.
Strengthened Occupancy Fueled ADR Growth in 2024
The result of this new momentum in occupancy was increased pricing power throughout the entire year.
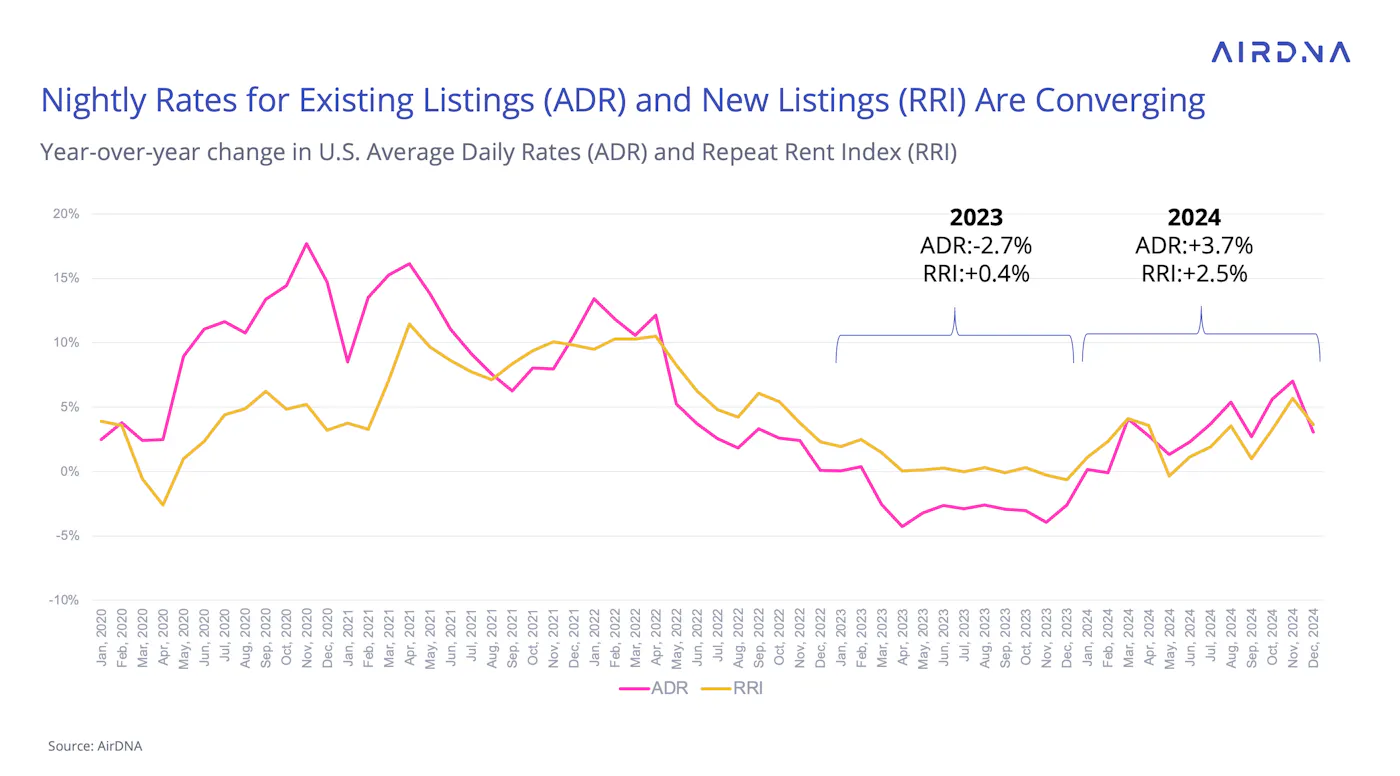
ADR change in 2023 was -2.7% overall, and every month after February saw ADR lower YOY. However, ADR declines essentially stopped in January 2024. By March, ADR was growing, and 2024 ADR growth over the whole year was a promising +3.7%.
Additionally, while the Repeat Rent Index (RRI) — AirDNA’s metric of tracking the performance of existing short-term rentals over time, minus the impact of new listings—remained relatively flat in 2023, growing only 0.4% YOY, it grew +2.5% in 2024.
The implication for mix shift, which refers to the impact of new listings on ADR market averages, was also significant. Mix shift lowered ADR in 2023 through the introduction of lower-cost listings. In 2024, this situation flipped, and mix shift contributed to higher ADRs. New listings are charging more on average than the markets they're entering.

Location-Specific Trends Shaped STR Performance in 2024
Turning to location types, every type, with the exception of urban locations, significantly accelerated demand growth.
Resort locations, which suffered demand losses in 2023, made particularly notable comebacks. Small City/Rural and mid-size cities continued to have the fastest growth, as lower housing costs and ease of entry have allowed supply to continue expanding rapidly in these areas to accommodate new demand.
Urban locations experienced the opposite, in that high costs and barriers to entry saw supply decline, taking demand with it. The most notable decline was seen in New York, where rigorous enforcement of regulations all but eliminated STRs in the city.
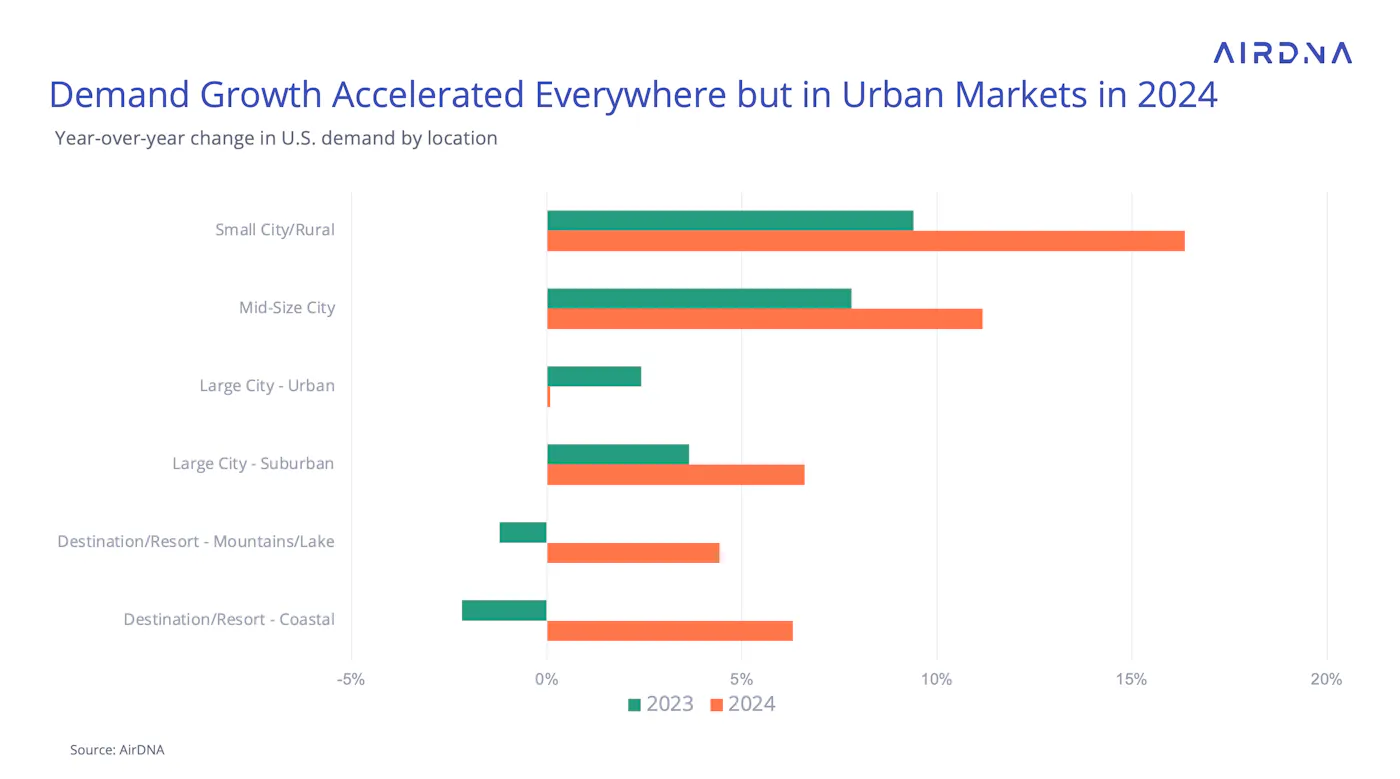
However, slower demand growth in a location doesn’t necessarily mean bad performance from the listings, especially if supply growth is associated with the difference in demand growth.
When we examine ADR change in location types, urban locations had the swiftest growth in 2024 while Small City/Rural was the only location type to see ADRs shrink in 2024.
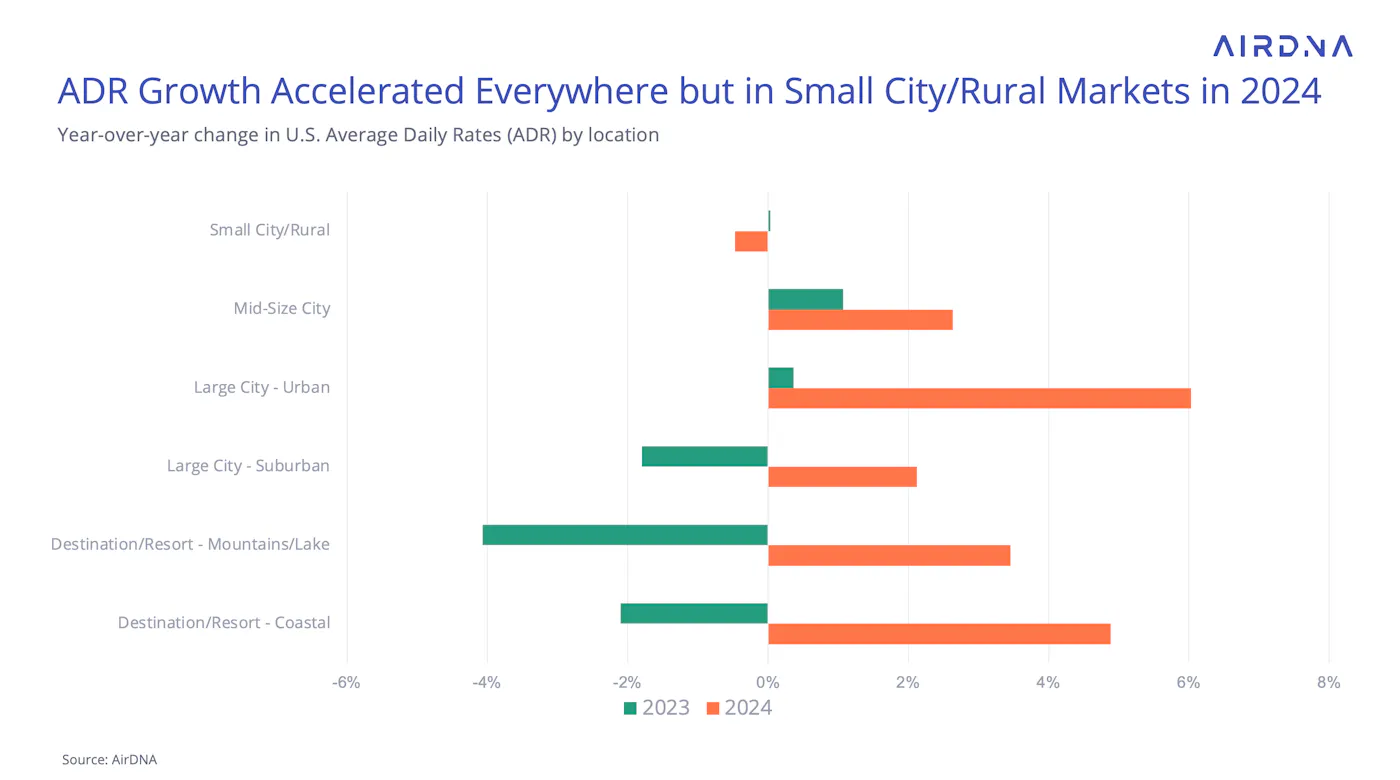
Despite many listings being eliminated by enhanced enforcement, New York was the market in our top 50 with the highest RevPAR growth in 2024 (+19.0). One reason for this is that the remaining listings in New York generally have much higher ADR than the removed ones.
Several large metropolitan areas, plus a few gulf locations, rounded out the list for top cities with highest RevPAR growth in 2024:
- Chicago (+18.2%)
- Philadelphia, Pennsylvania (+15.5)
- Houston, Texas (+14.9%)
- Gulf Shores/Mobile, Alabama (+16.2%)
- Panama City, Florida (+15.7%)
While most of these cities’ unit-level performance benefitted from low or negative listing growth, Chicago stands apart by having available listings increase by 3.1% and available listing nights increase by 9.4% in 2024. Demand growth in Chicago was a remarkable +15.6% and ADR grew by 11.8% year-over-year, propelling the quick-growing market to the top 5 without relying on reduced competition.
Strong Event Demand Boosts Early 2025 Pacing
Looking ahead to the future through on-the-books demand pacing reveals that while January 2025 looks like a strong month (+12.3%), February 2025 is actually pacing below 2024. While February 2024 was an extra leap year date, even this extra date cannot account for the difference. Pacing is barely positive at 1.1% YOY.
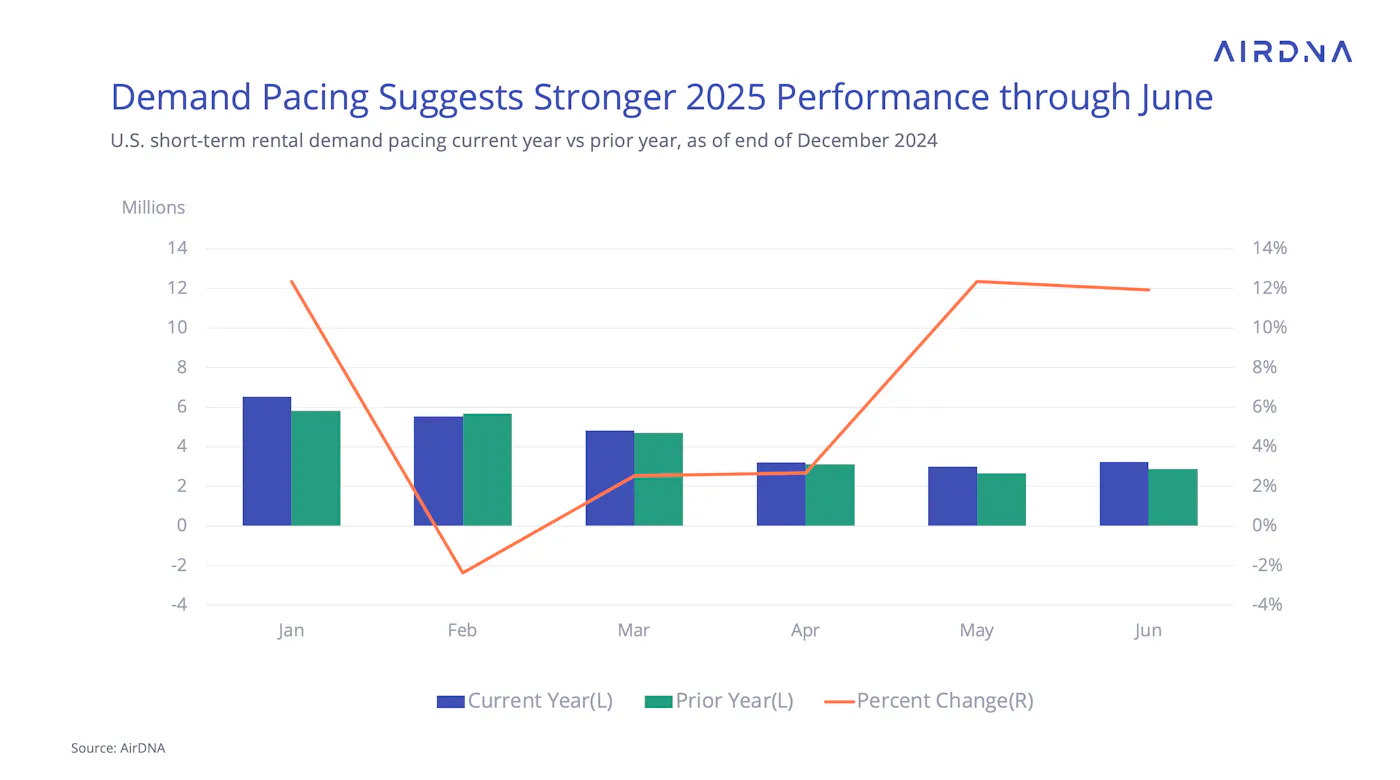
Still, there already seems to be some inertia behind spring and summer bookings, as May and June are pacing around 12% higher YOY.
Not everywhere is expecting a slow February, however. Several special events are helping drive demand to particular locations. Valentine’s Day is benefitting from a calendar shift that moves the holiday to Friday this year from Wednesday in 2024.
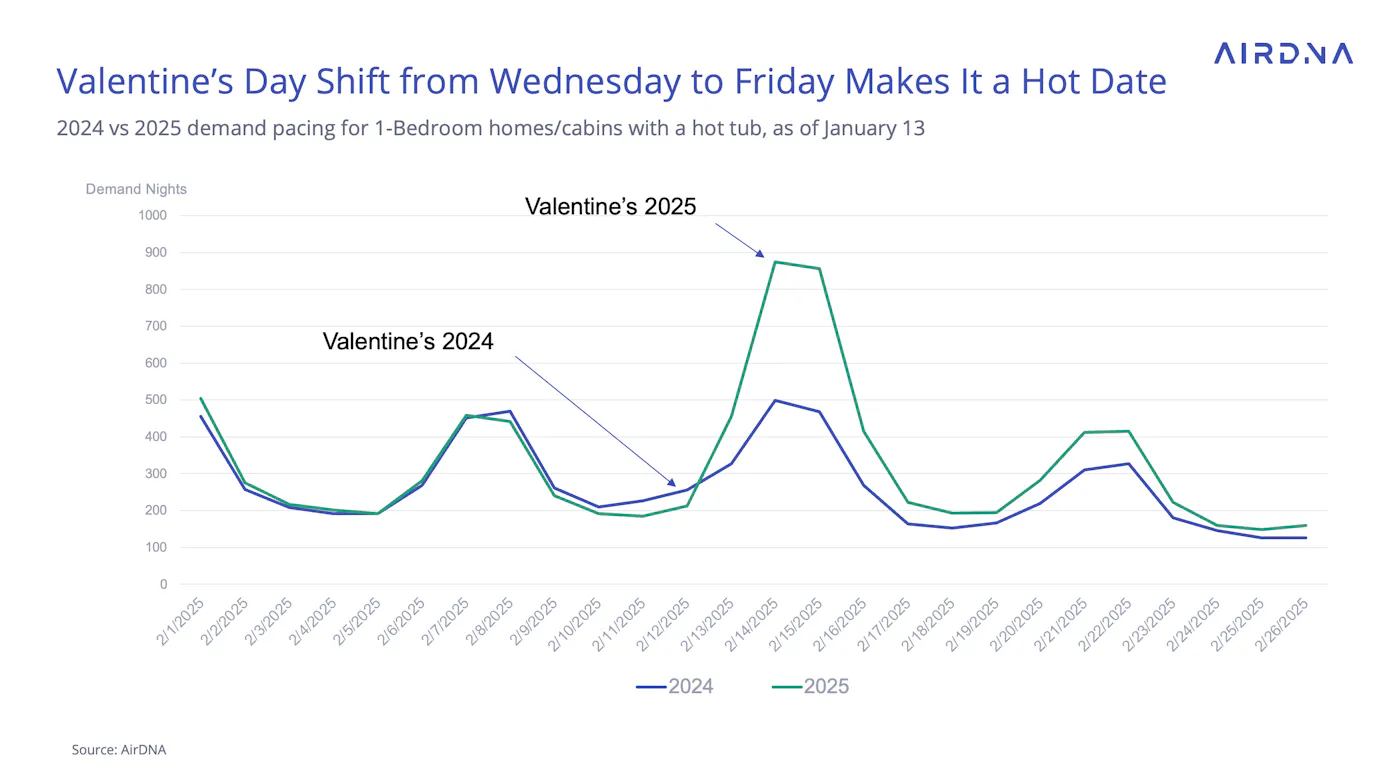
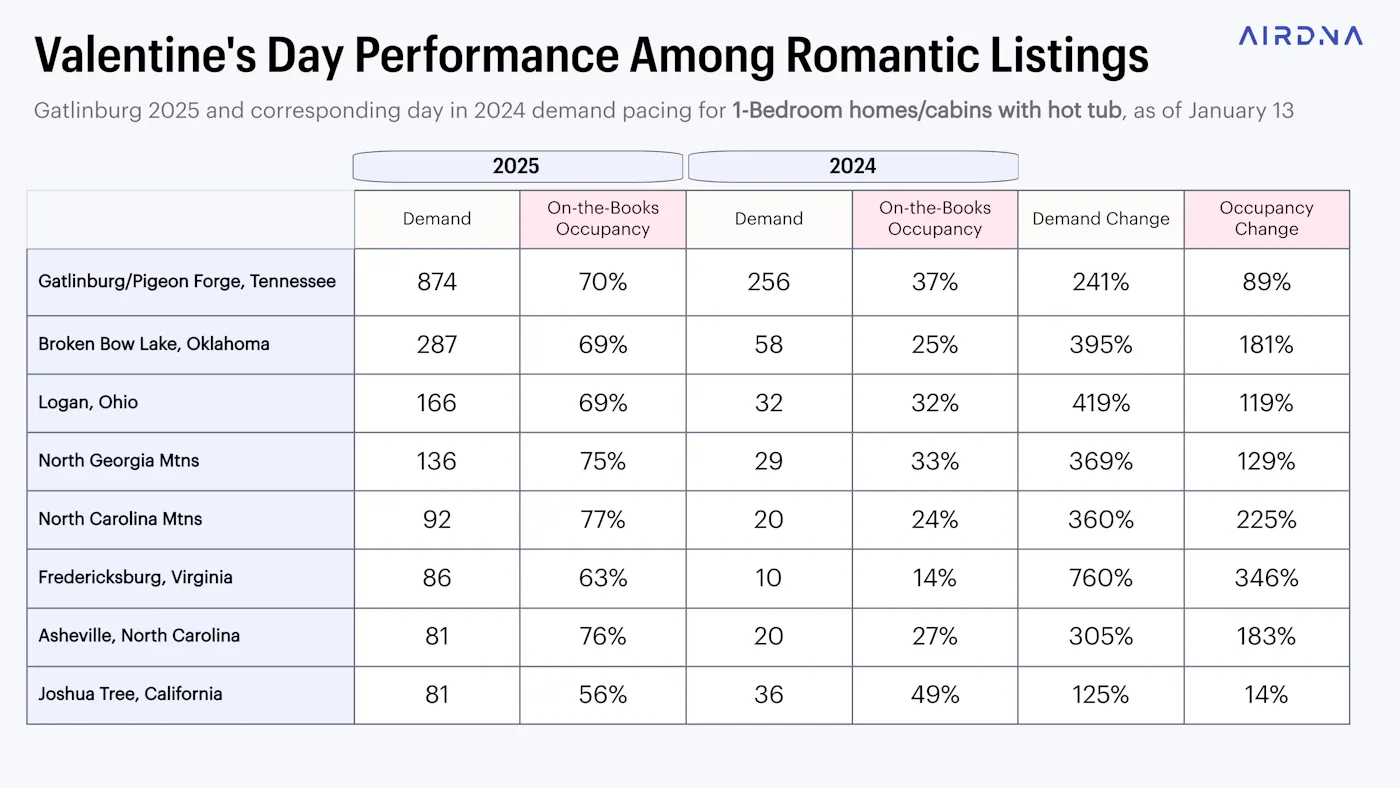
The move has had a dramatic effect on single-bedroom homes and cabins with a hot tub, the perfect listing type for the romantically inclined.
While Valentine’s Day hardly made an identifiable mark for these properties in 2024, demand is four or five times greater YOY in 2025. When comparing Valentine’s 2025 to the corresponding Friday in 2024, the result is less dramatic. Demand still manages to nearly double YOY in Gatlinburg, however, as the nation’s hot spot for hot tubs.
Last but not least, the premiere hospitality event of the year, Super Bowl LIX, is occurring February 9 in New Orleans in what is a nearly head-to-head comparison with Mardi Gras, which fell on February 13 in 2024.
New Orleans shows resilience as it gears up for two major events—Super Bowl LIX and Mardi Gras. Despite the tragic events on New Year’s Day, demand pacing for the Super Bowl is rivaling, if not surpassing, that of Mardi Gras 2024.
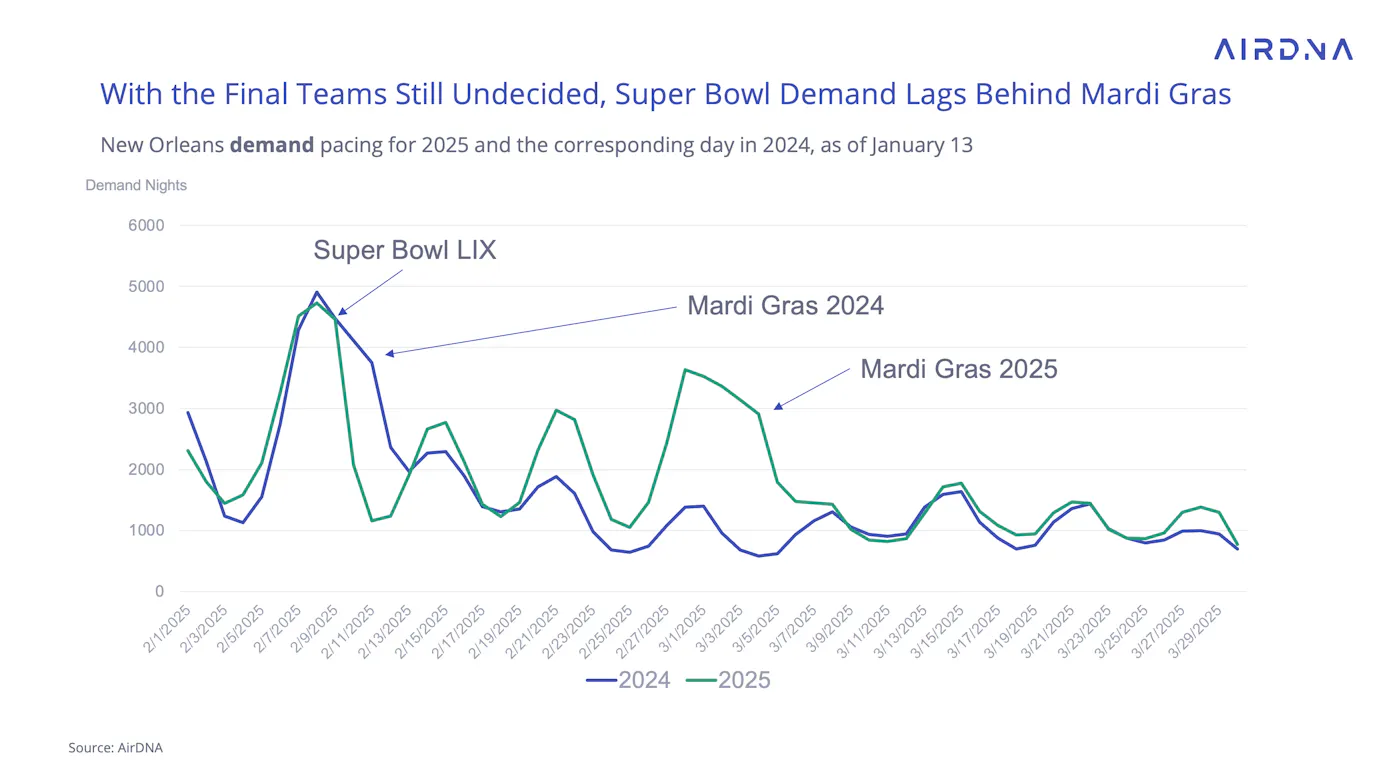
Even better for operators, average daily rates (ADR) for the Super Bowl are currently tracking significantly higher.
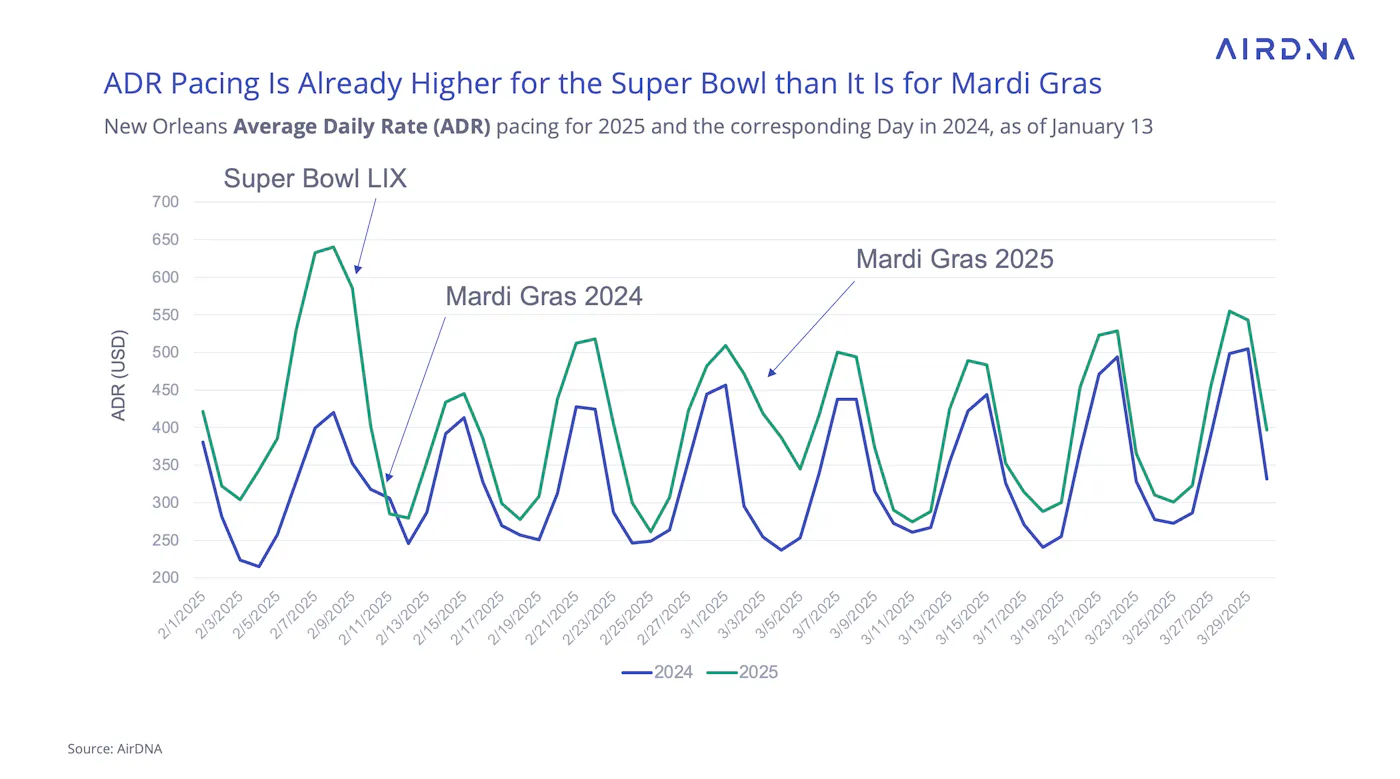
Following the Super Bowl on February 9, New Orleans will dive straight into Mardi Gras celebrations, culminating on March 4. Looking further ahead, demand for Mardi Gras 2025 is already shaping up to be strong, offering hosts the potential for a lucrative start to the year.
It’s worth noting that New Orleans plans to implement stricter short-term rental enforcement measures in early March. AirDNA will monitor whether current Mardi Gras demand pacing translates into realized bookings under these new regulations.
ARTICLE SUMMARY
The U.S. short-term rental market regained momentum in 2024, with rising demand and slowing supply growth stabilizing occupancy and restoring pricing power for hosts. As the industry heads into 2025, strong booking trends for spring and summer, alongside major events like Super Bowl LIX, signal another promising year ahead.
Bram Gallagher
AirDNA Director of Economics and Forecasting
Bram Gallagher is an Economist at AirDNA, specializing in uncovering insights that drive smarter short-term rental decisions. He put his Ph.D. in Economics from the University of Georgia to work researching and forecasting hotel data with CBRE prior to joining AirDNA, as well as teaching economics at a number of universities. In his spare time, Bram enjoys making wooden furniture with hand tools.



Get started with AirDNA today.
Powerful, easy-to-use tools that help hosts and investors succeed in the short-term rental market.
Try for free