

 Calculate Revenue
 Research Markets
 Find For Sale Properties
 Compare My Listing
 STR Revenue Calculator
 Custom Comp Sets
 Submarket Insights
 Custom Search Filters
 Rate Recommendations
 Performance Benchmarking
 Competitor Comparison
 Owner Contact Details
 Property-level performance data
 Tourism Insights
 Real Estate Investment Analytics
 About Us
 Sales
Sales Support
 Press
PressU.S. Review March 2025: Smooth Sailing in March, With Tariffs on the Radar
Published: April 16, 2025

Bram Gallagher
Key Takeaways:
- March STR demand rose 3.1% YoY, holding steady despite the absence of Easter and Spring Break travel.
- Average daily rates (ADR) rose 3.0% YoY, showing that hosts are regaining pricing power—especially in mid-size cities and high-demand markets.
- Rising tariffs and international tensions—particularly with Canada—introduced new uncertainty, but have not yet dampened overall market performance.
March 2024 was boosted by an early Easter and Spring Break. March 2025, by contrast, had to stand on its own. Yet even without those demand drivers, the U.S. short-term rental market saw nights stayed increase 3.1% year-over-year — a quiet win that signals underlying strength.
Consumer confidence declined for the fourth straight month, and recent drops in the stock market could push high-income households — who drive much of the STR demand — toward more cautious spending. Whether these signals translate into canceled trips or delayed plans remains to be seen.
Employment and Inflation’s Impact
March’s economic headlines were full of drama — stock market drops, looming tariffs, and shaky consumer confidence. But on the ground, the actual data painted a steadier picture.
The biggest wildcard was trade. In March, speculation around steep new U.S. tariffs sparked market volatility. While the most aggressive measures weren’t announced until early April, markets braced for impact. The S&P 500 fell roughly 8% from its February 20 peak by the end of March, with higher-income households likely adjusting spending in response to declining portfolio values and rising uncertainty.
Consumer confidence fell for the fourth consecutive month, according to the Conference Board. Older consumers, in particular, showed declining optimism about income stability for the year ahead.
And yet, the job market held steady. The U.S. added 228,000 jobs in March, with unemployment ticking up only slightly to 4.2%. The Bureau of Labor Statistics called the labor market “little changed,” and they meant it — the phrase or some variation of it appeared ten times in their March summary.
Inflation also cooled. The Consumer Price Index (CPI) posted its first month-over-month decline since May 2020. Annual inflation dropped to 2.4% — a four-year low — with energy prices leading the decline. Core inflation (excluding food and energy) dipped to 2.8%.
While this drop could ease pressure on interest rates, the Fed is likely to wait out the tariff fallout before acting. New trade restrictions could reverse inflation gains and create more pricing instability. Oxford Economics still expects one or two rate cuts this year, likely in the second half.

At a Glance: Key U.S. STR Performance Metrics for March 2025
- Revenue per Available Rental (RevPAR) increased 1.3% year-over-year (YOY) to $185.56
- Available listings were 1.63 million, up 4.2% YOY
- Total demand (nights) rose 3.1% YOY
- Occupancy was 1.7% lower YOY at 58.6%
- Average Daily Rates (ADR) increased 3.0% YOY to $316.48.
- Repeat Rent Index (RRI) increased by 4.0% YOY
Supply Starts to Stabilize as Hosts Regain Confidence
Despite the shifting calendar and macroeconomic uncertainty, March proved to be a steady performer for the U.S. short-term rental market. Demand increased 3.1% year-over-year, and although occupancy dipped slightly, other key indicators remained strong.
Supply is also showing signs of modest recovery. Mortgage rates dipped to 6.65% in March, and while rates remain historically high, they’ve stayed within a narrow 6–7% band since late 2022. That consistency may be helping rebuild investor confidence.
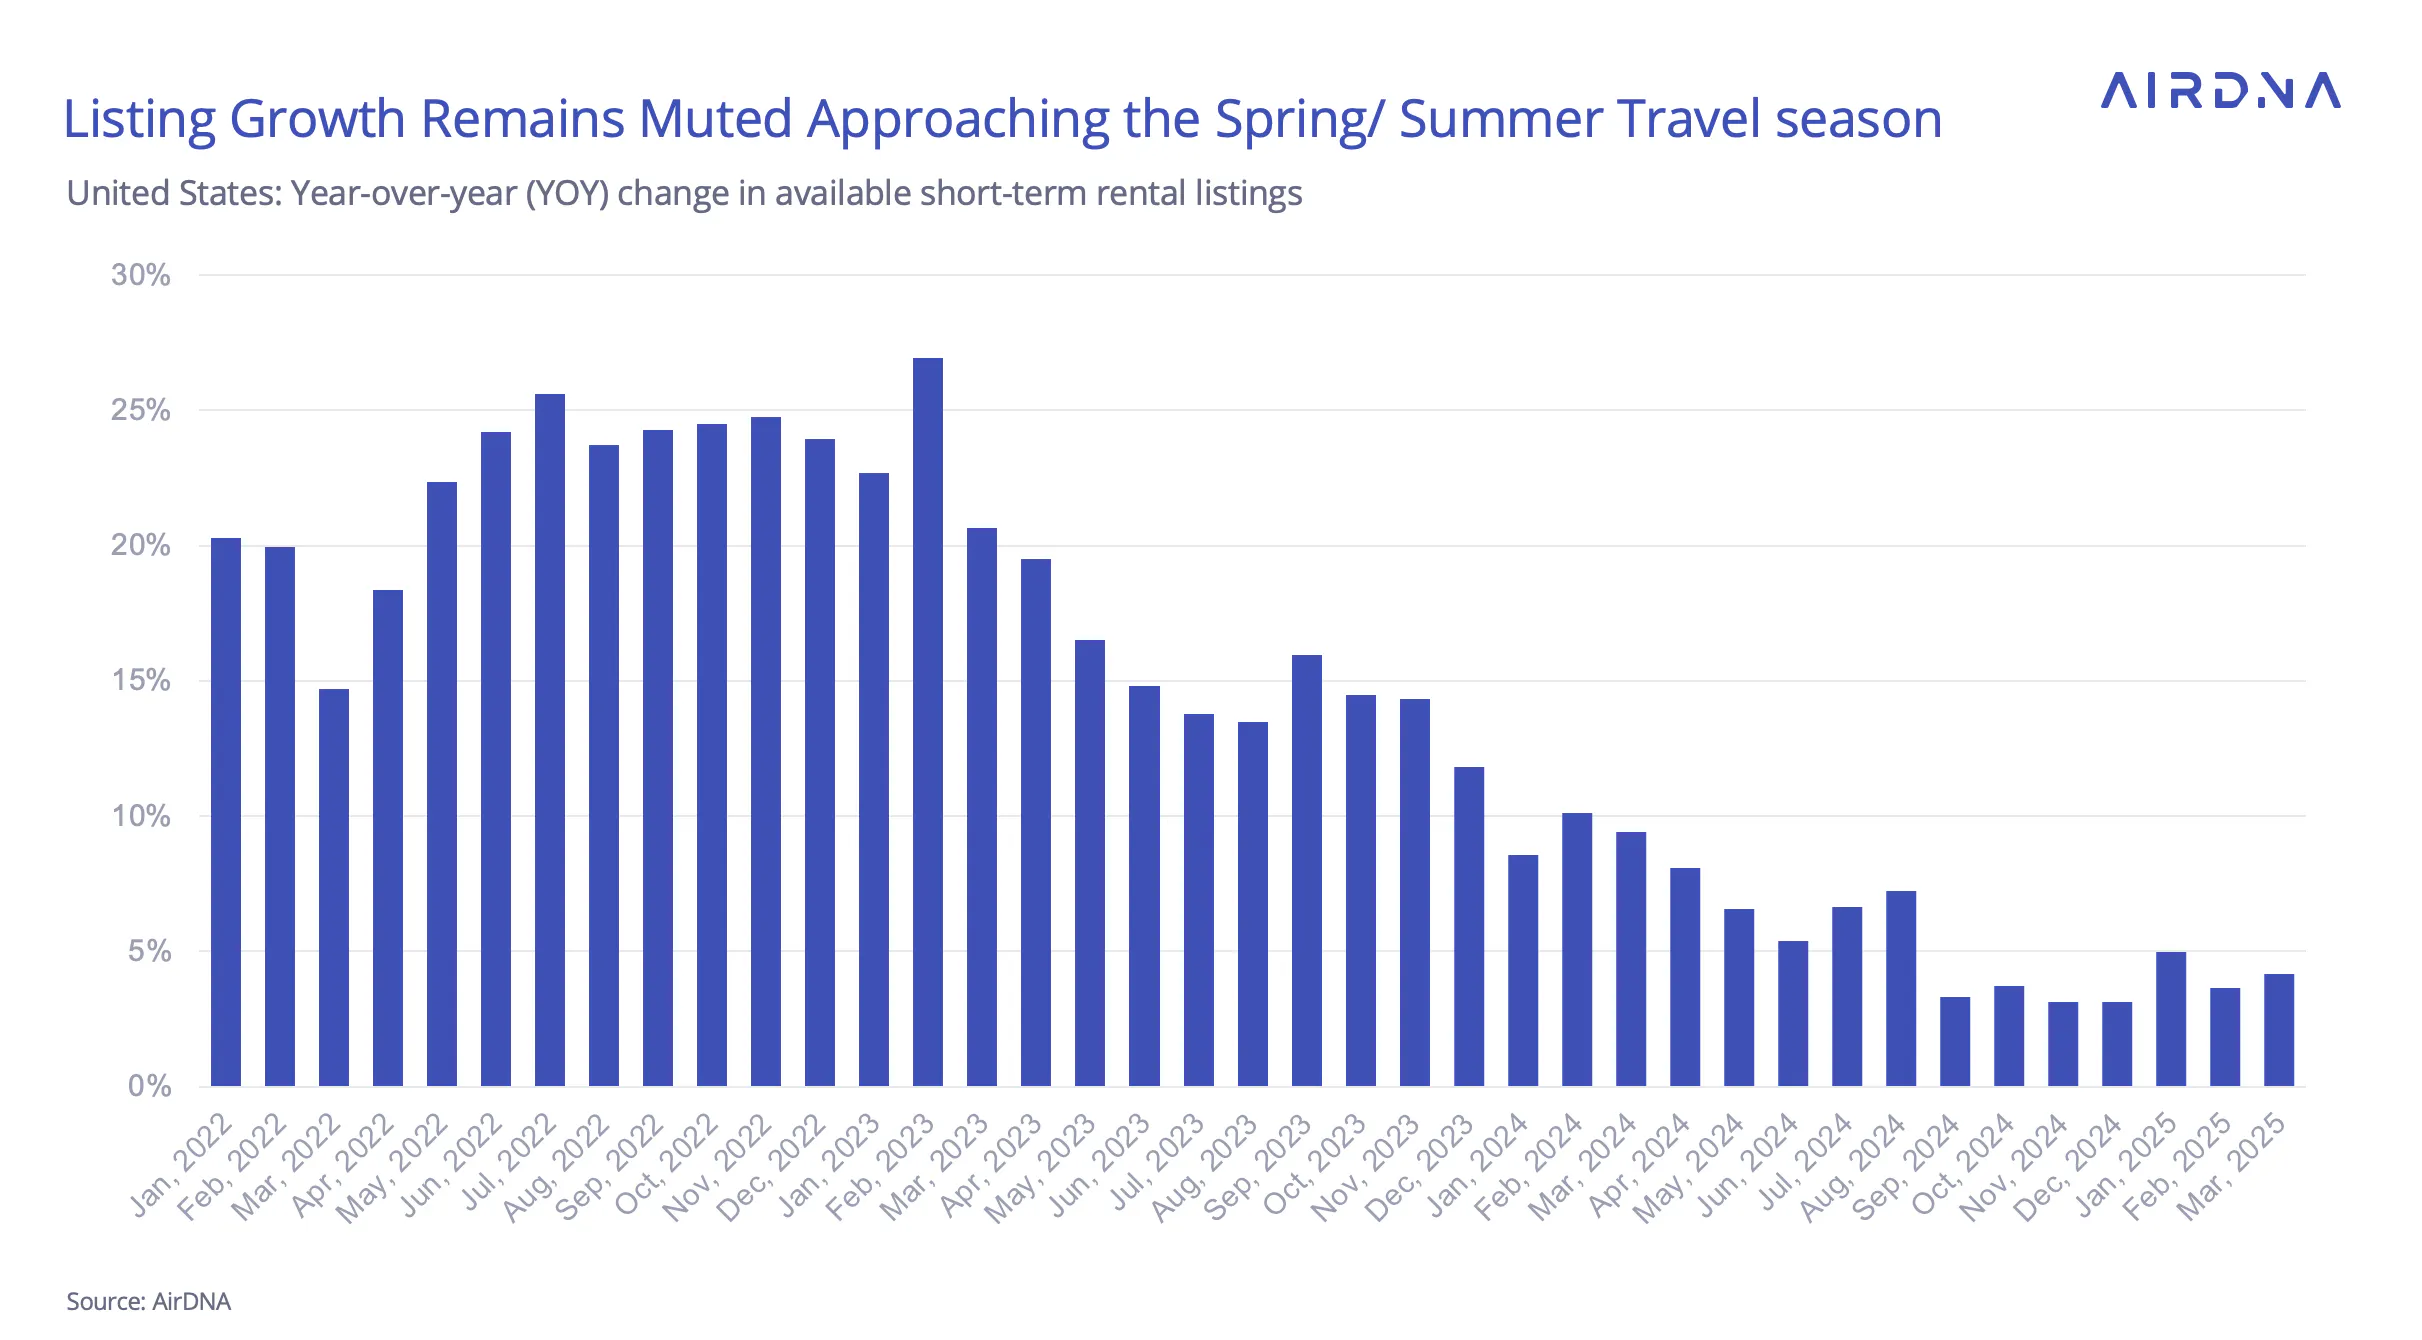
Listing growth edged up to 4.2%, up from 3.6% in February. It’s a slow rebound, but a welcome one — especially for hosts who’ve spent the past two years navigating intense competition in overheated markets. The supply picture suggests a shift toward cautious optimism, rather than a full-blown investment resurgence.
New listings also climbed for the fourth consecutive month. March saw 58,380 new listings — nearly matching March 2024’s total — a strong turnaround from September 2024, when new listings were down more than 18% YoY.
While inflation may have eased in March, the Fed is expected to hold off on interest rate cuts until the dust settles from ongoing tariff developments. Any inflationary shock caused by supply chain shifts or retaliatory pricing could prompt a more cautious monetary stance, even with the labor market at near-full capacity.
Demand and Bookings
Demand growth in 2024 was largely stable, running between 6–12%, but it came with quirks — including snowless cold in January and holiday-related calendar shifts in April and September. This year started strong, but growth slowed slightly in February and March, dipping below 5%.
That said, February 2025 lacked the leap day present in 2024. Adjusting for that gives us a more realistic growth figure — closer to 8% — showing that underlying demand remained solid.
March 2025, by comparison, faced the opposite challenge: a calendar reversal. Easter and Spring Break boosted March last year, but have shifted into April this time around. Against that backdrop, a 3.1% YoY increase in nights stayed is still a respectable showing.
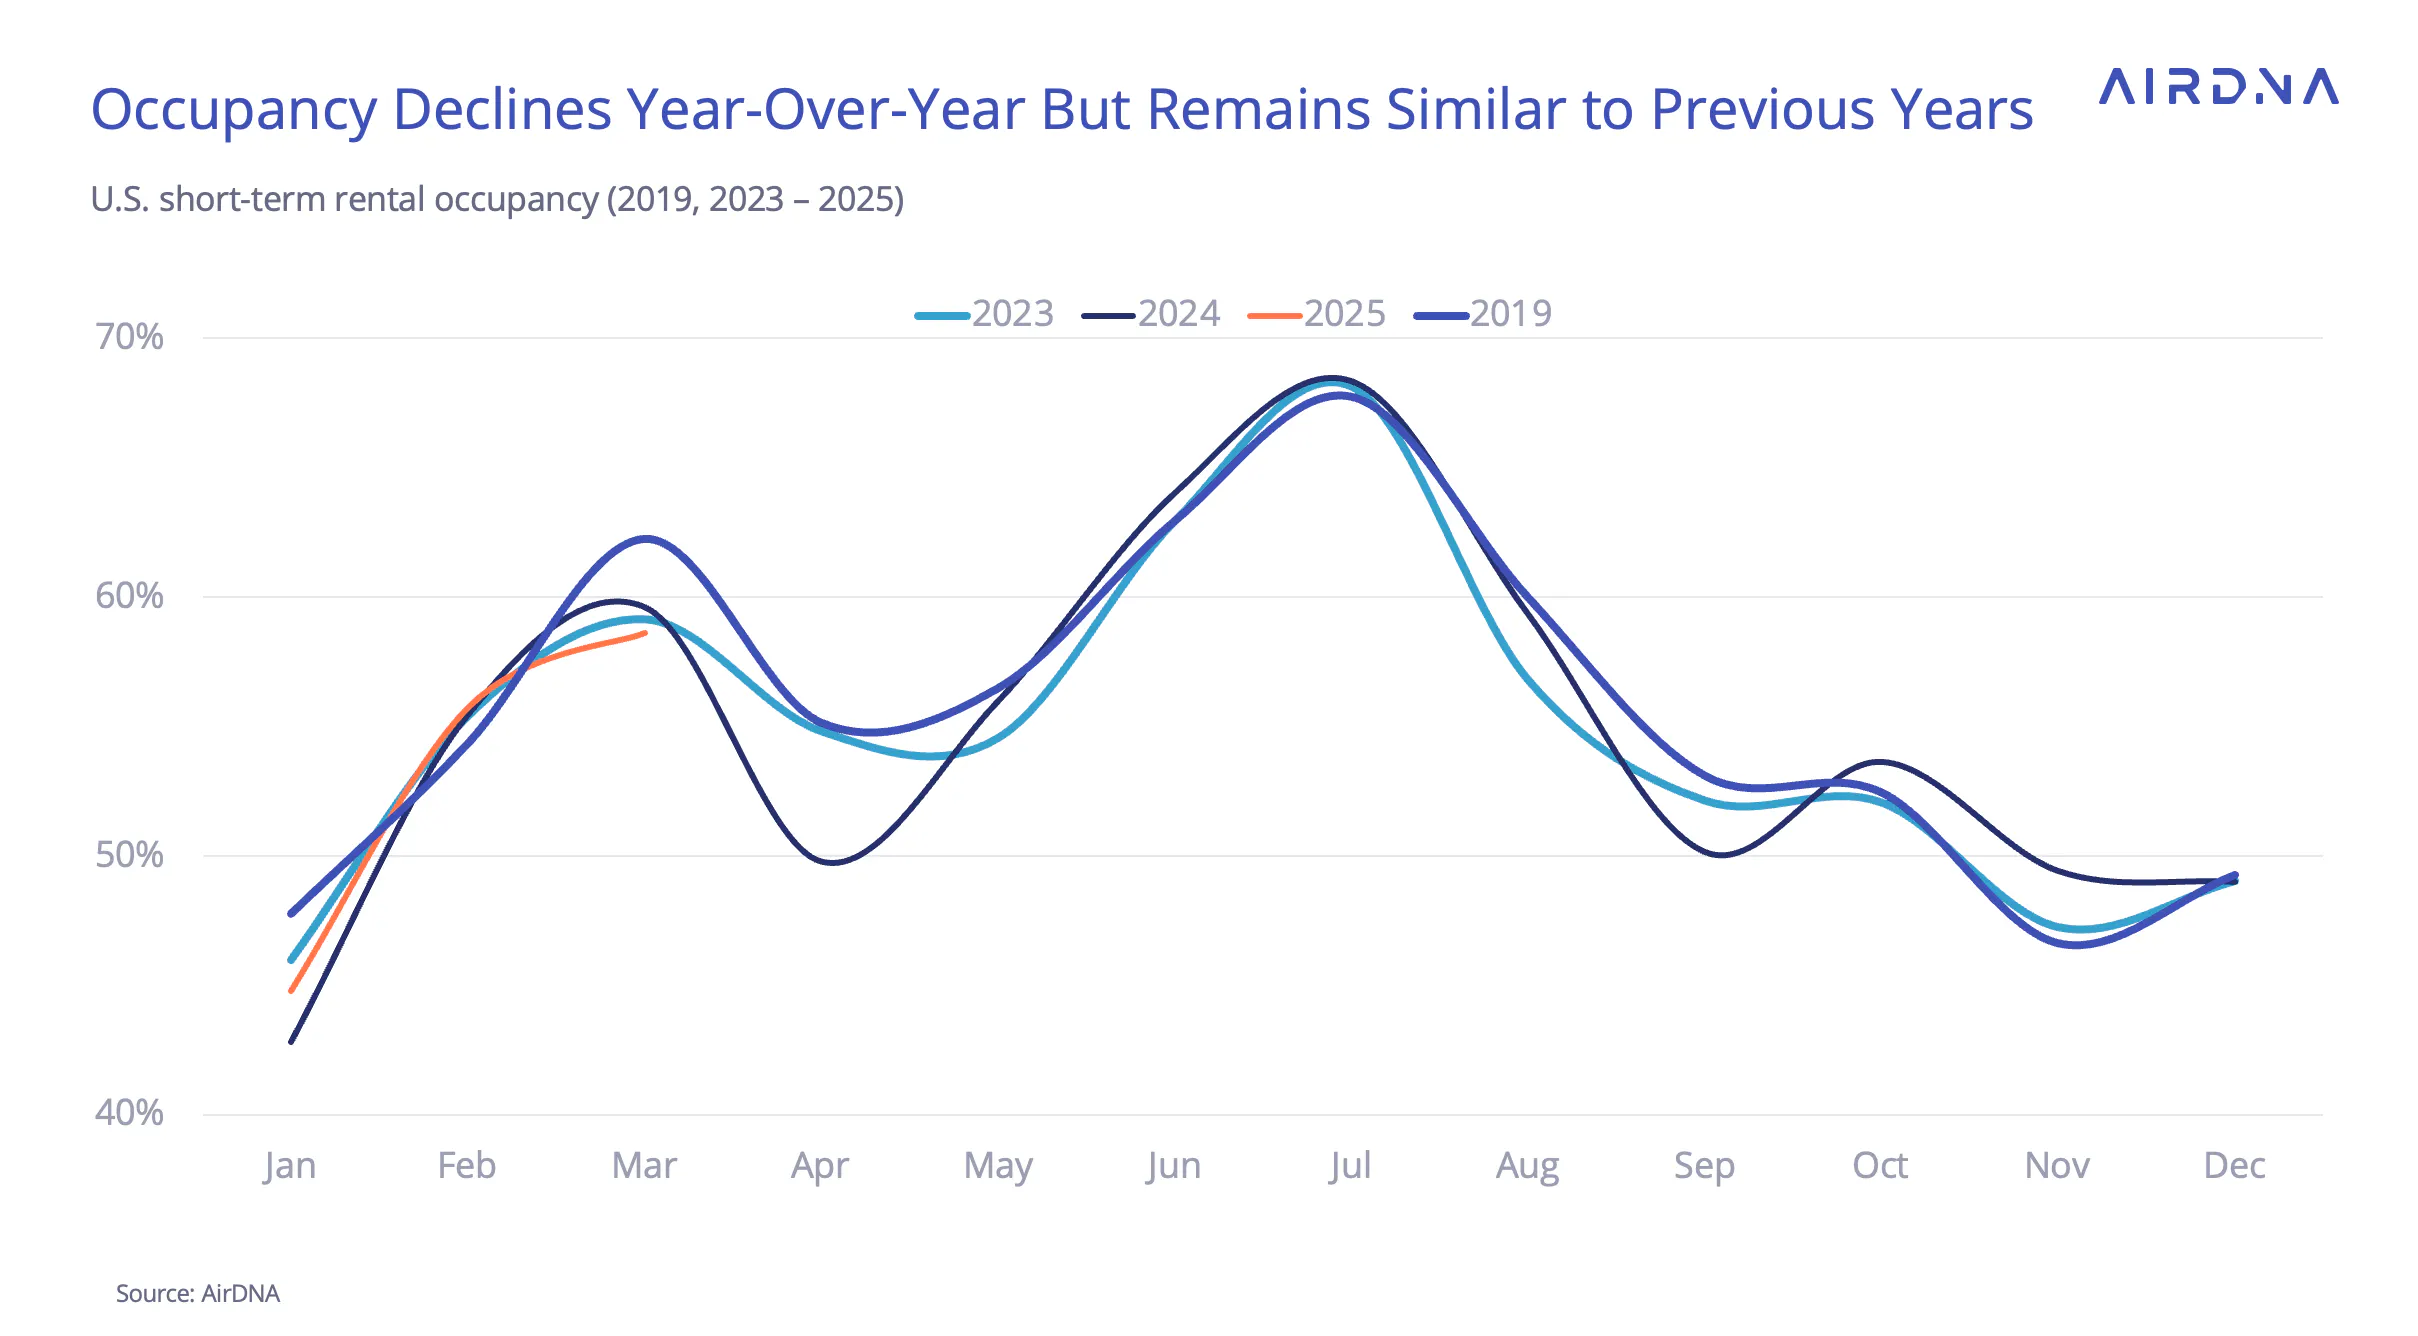
Occupancy trends mirrored demand: somewhat hard to pin down, but not discouraging. Supply growth remains low, but deferred holiday travel pushed some demand out of March. Still, occupancy rates stayed within a percentage point of the past two years — stable, all things considered.
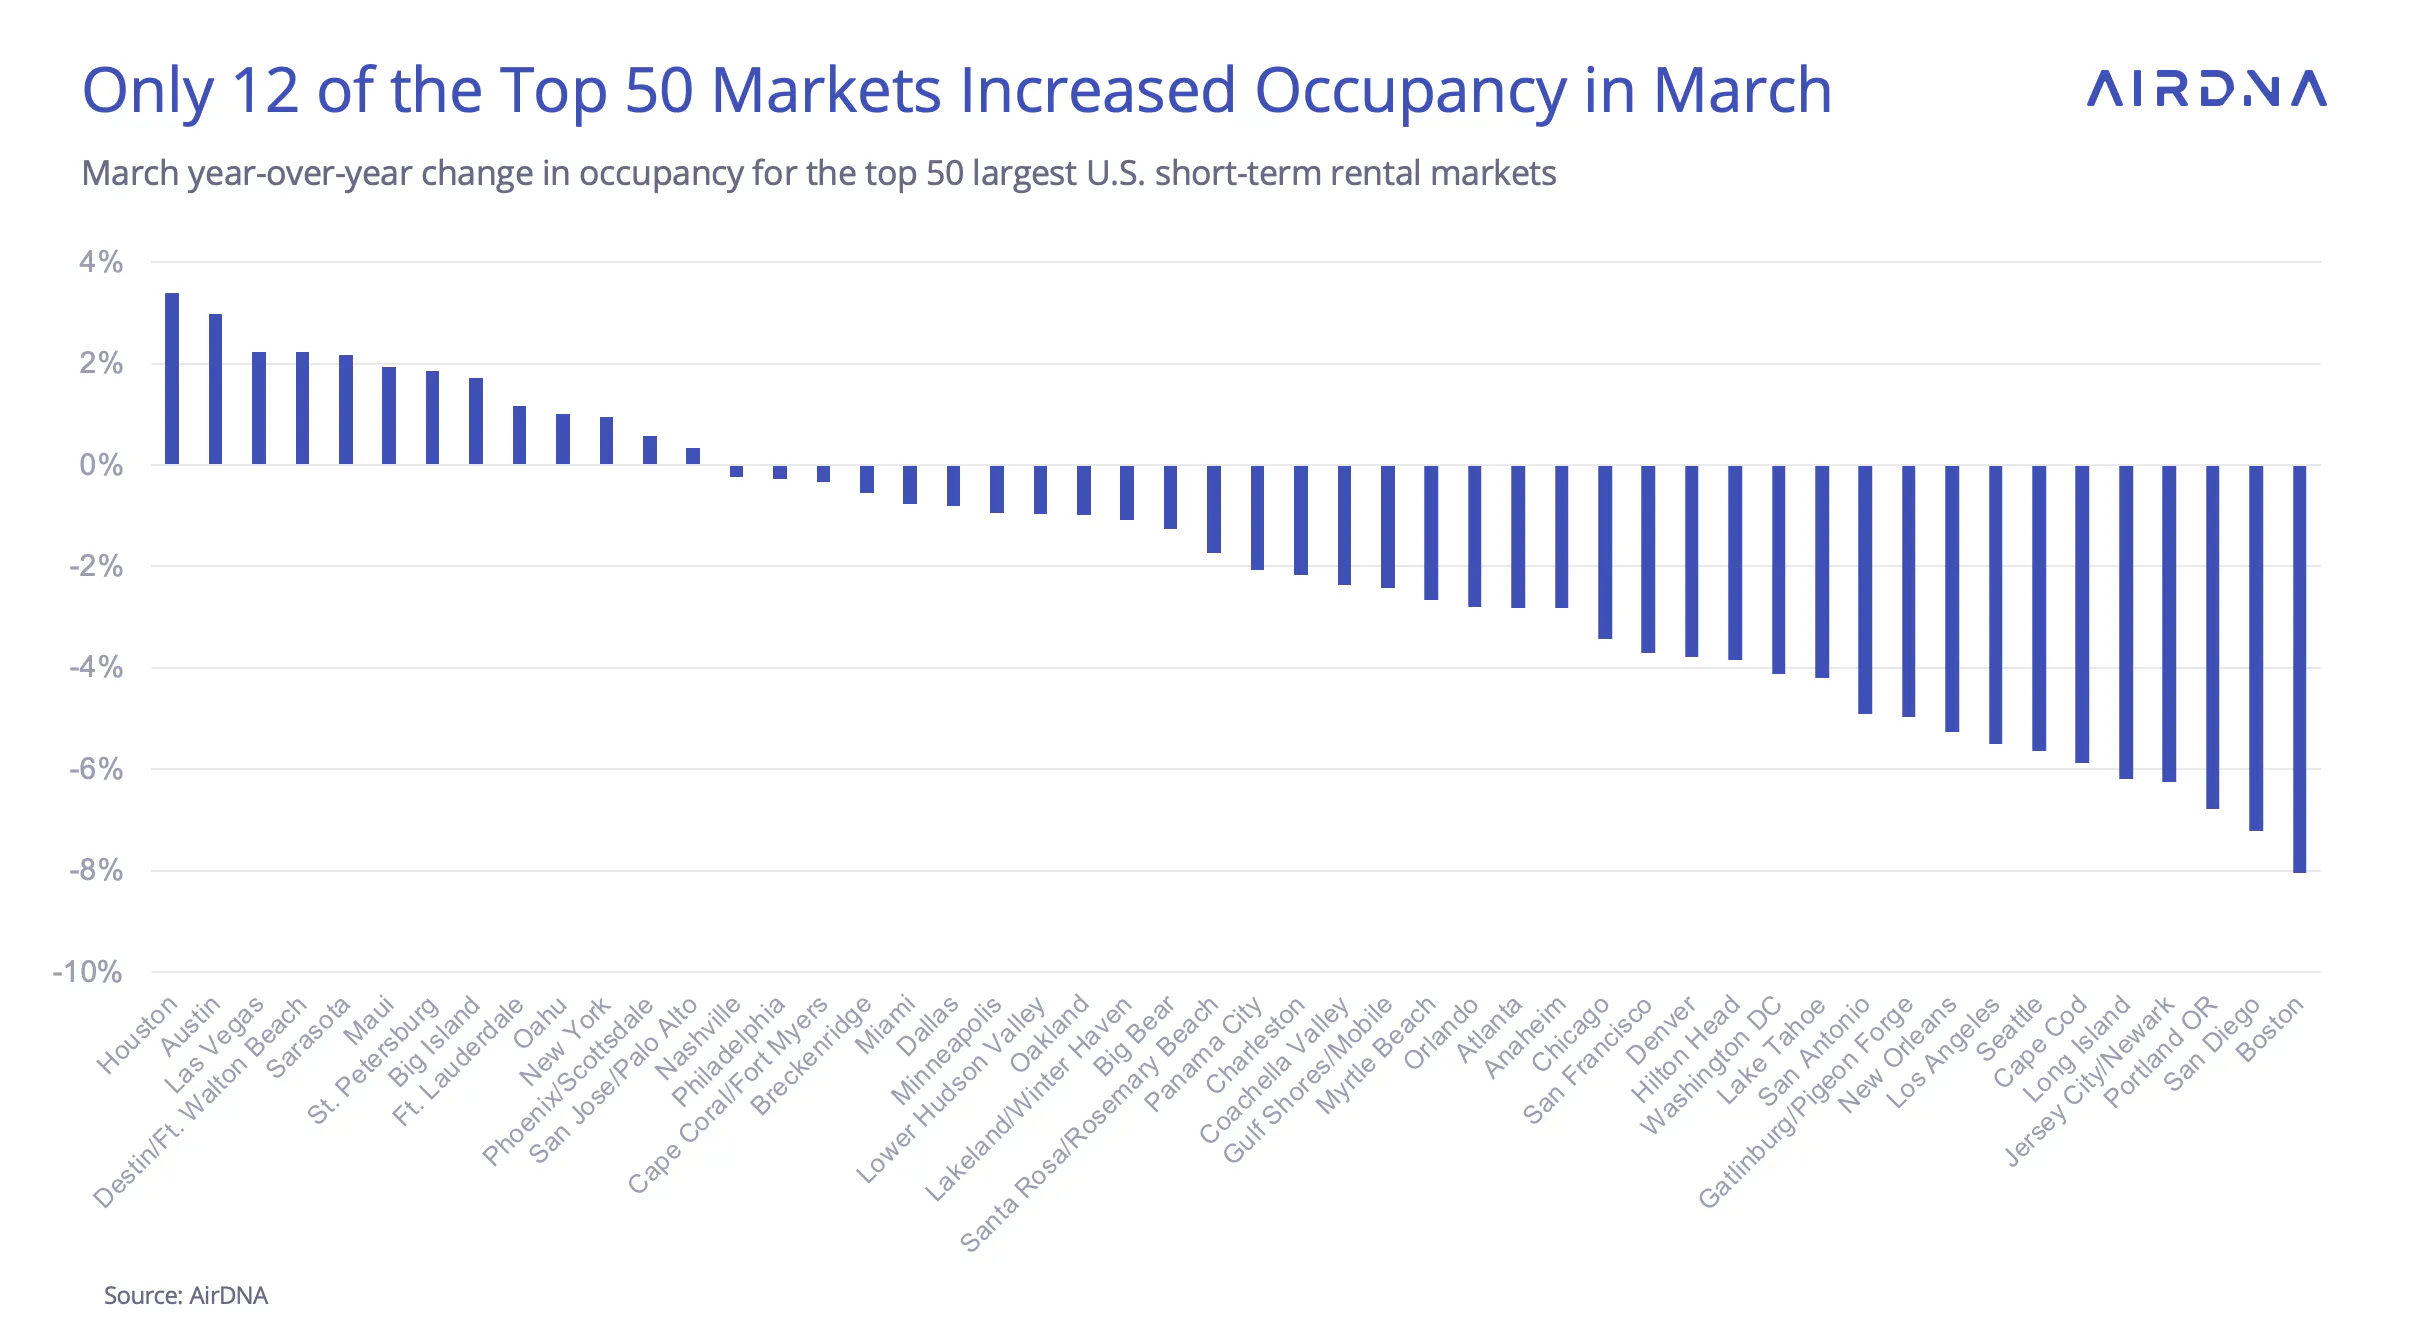
The slight downturn in occupancy was widespread. Of the top 50 markets, only 12 saw occupancy grow or hold steady — and those were mostly warm-weather destinations in Texas, Florida, and Hawaii, likely benefiting from travelers seeking an escape from lingering winter cold.
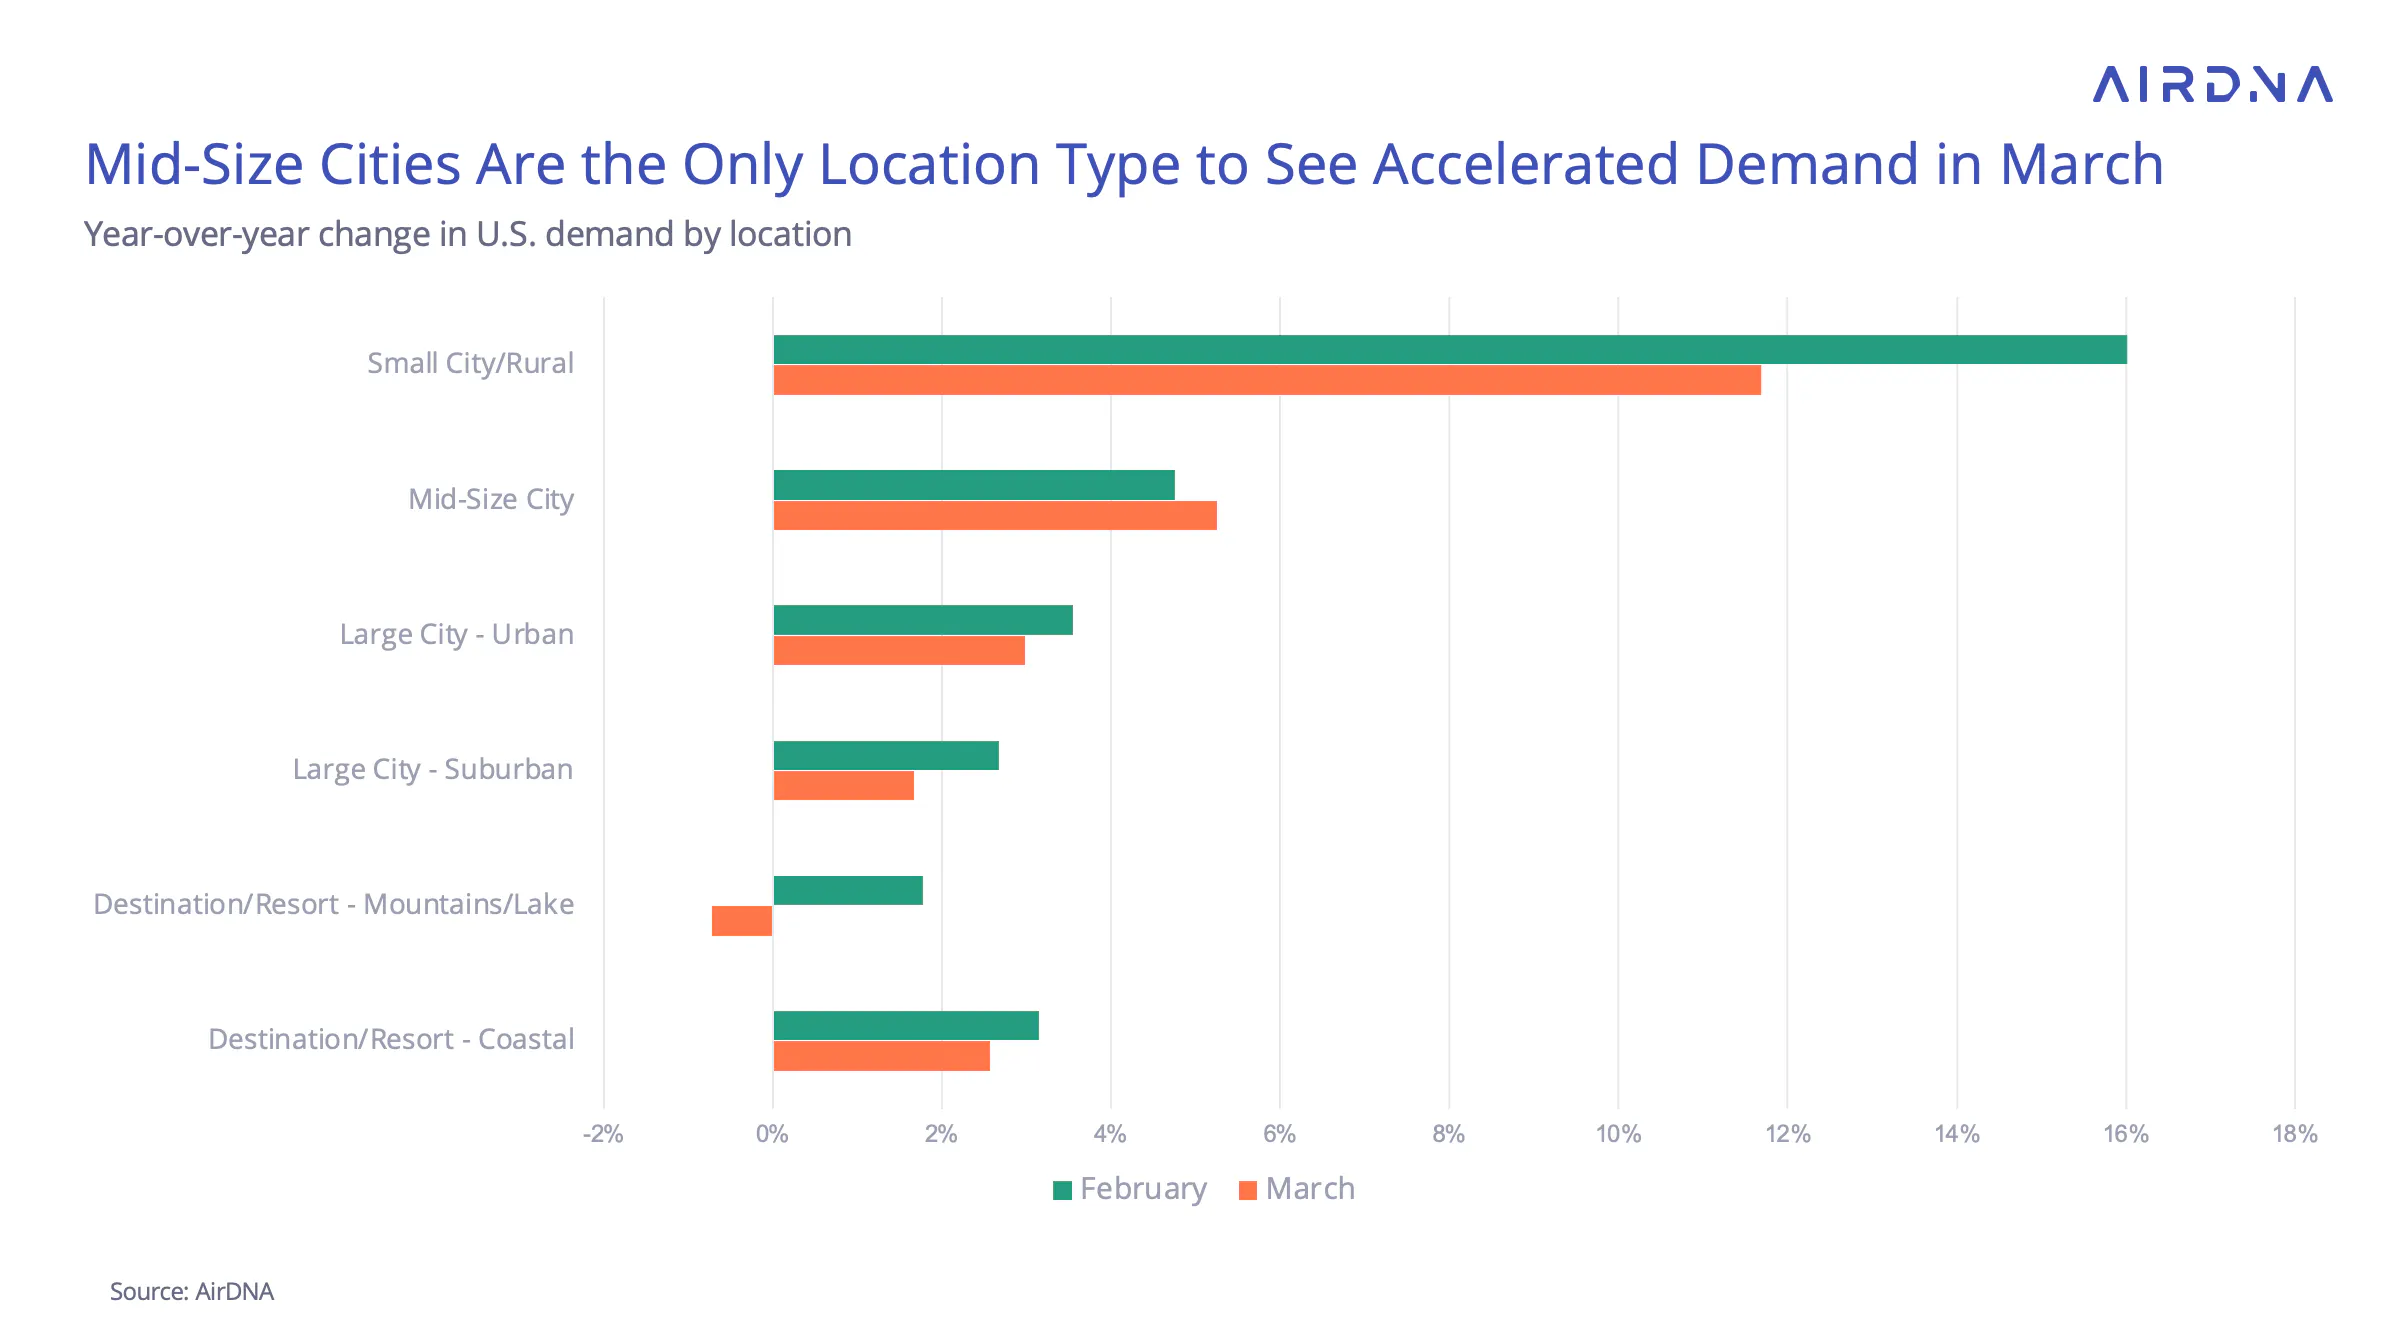
One consistent demand bright spot was mid-size cities. These markets continued to accelerate, coming in as the second-fastest growing location type after rural/small town areas.
Meanwhile, mountain and lake resorts saw a minor dip in demand. After a strong January and steady February, March was a tougher comp — especially as 2024’s poor early-season snow may have pushed some ski trips later into last year’s season, making this March a double-tough comparison.
Learn from your competitors
Without reliable rental comps, you're making pricing decisions in the dark. Use real data to compare your listing performance to similar properties and discover your true market position.
ADR and RRI Growth
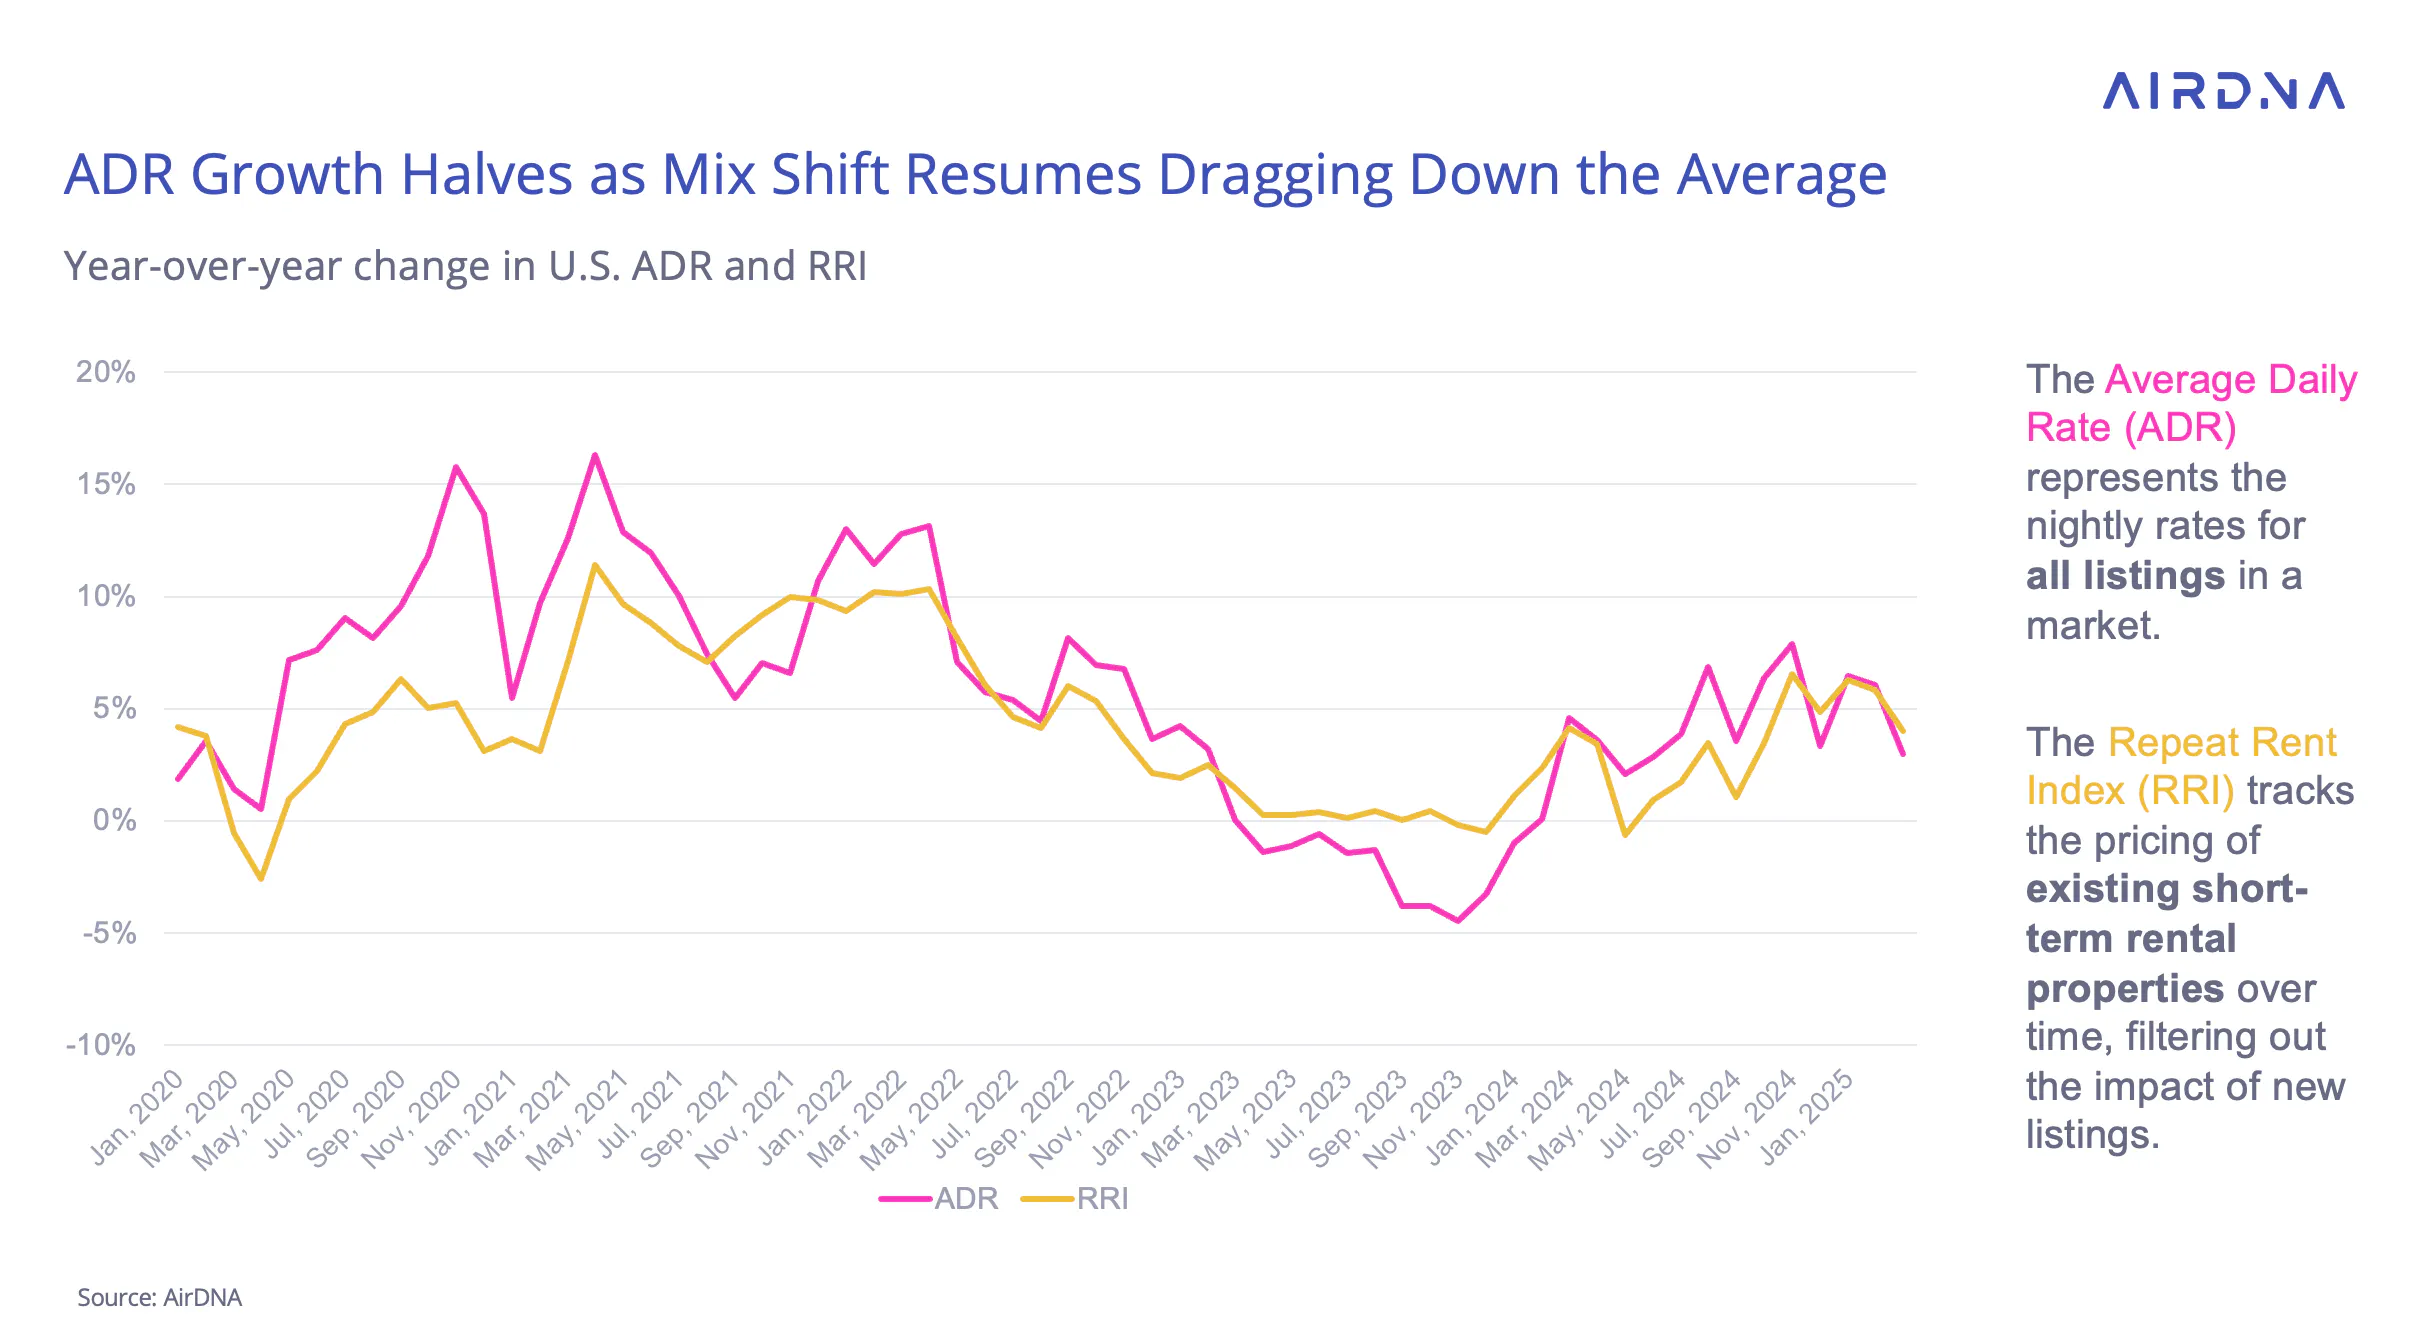
After a challenging 2023, pricing power is making a cautious comeback. In March, average daily rates (ADR) grew 3.0% year-over-year — a noticeable drop from February’s 6.1% gain, but still positive. Some of the slowdown stems from mix shift: more bookings went to lower-priced listings, slightly dragging down the overall average.
The Repeat Rent Index (RRI), which measures pricing on the same listings year-over-year, dipped from 5.9% in February to 4.0% in March. That suggests price changes on existing inventory remained relatively stable — with most of the ADR softening coming from what’s getting booked, not how hosts are pricing repeat properties.
Throughout much of 2024, mix shift had been contributing to ADR gains as new listings skewed larger and more premium. This trend reflected growing consumer appetite for quality — and host confidence to meet it. However, as the new administration’s broader economic policies take shape, some operators may be adjusting expectations. It may take several months for the full impact on listing strategy to show up in the data.
Location Trends
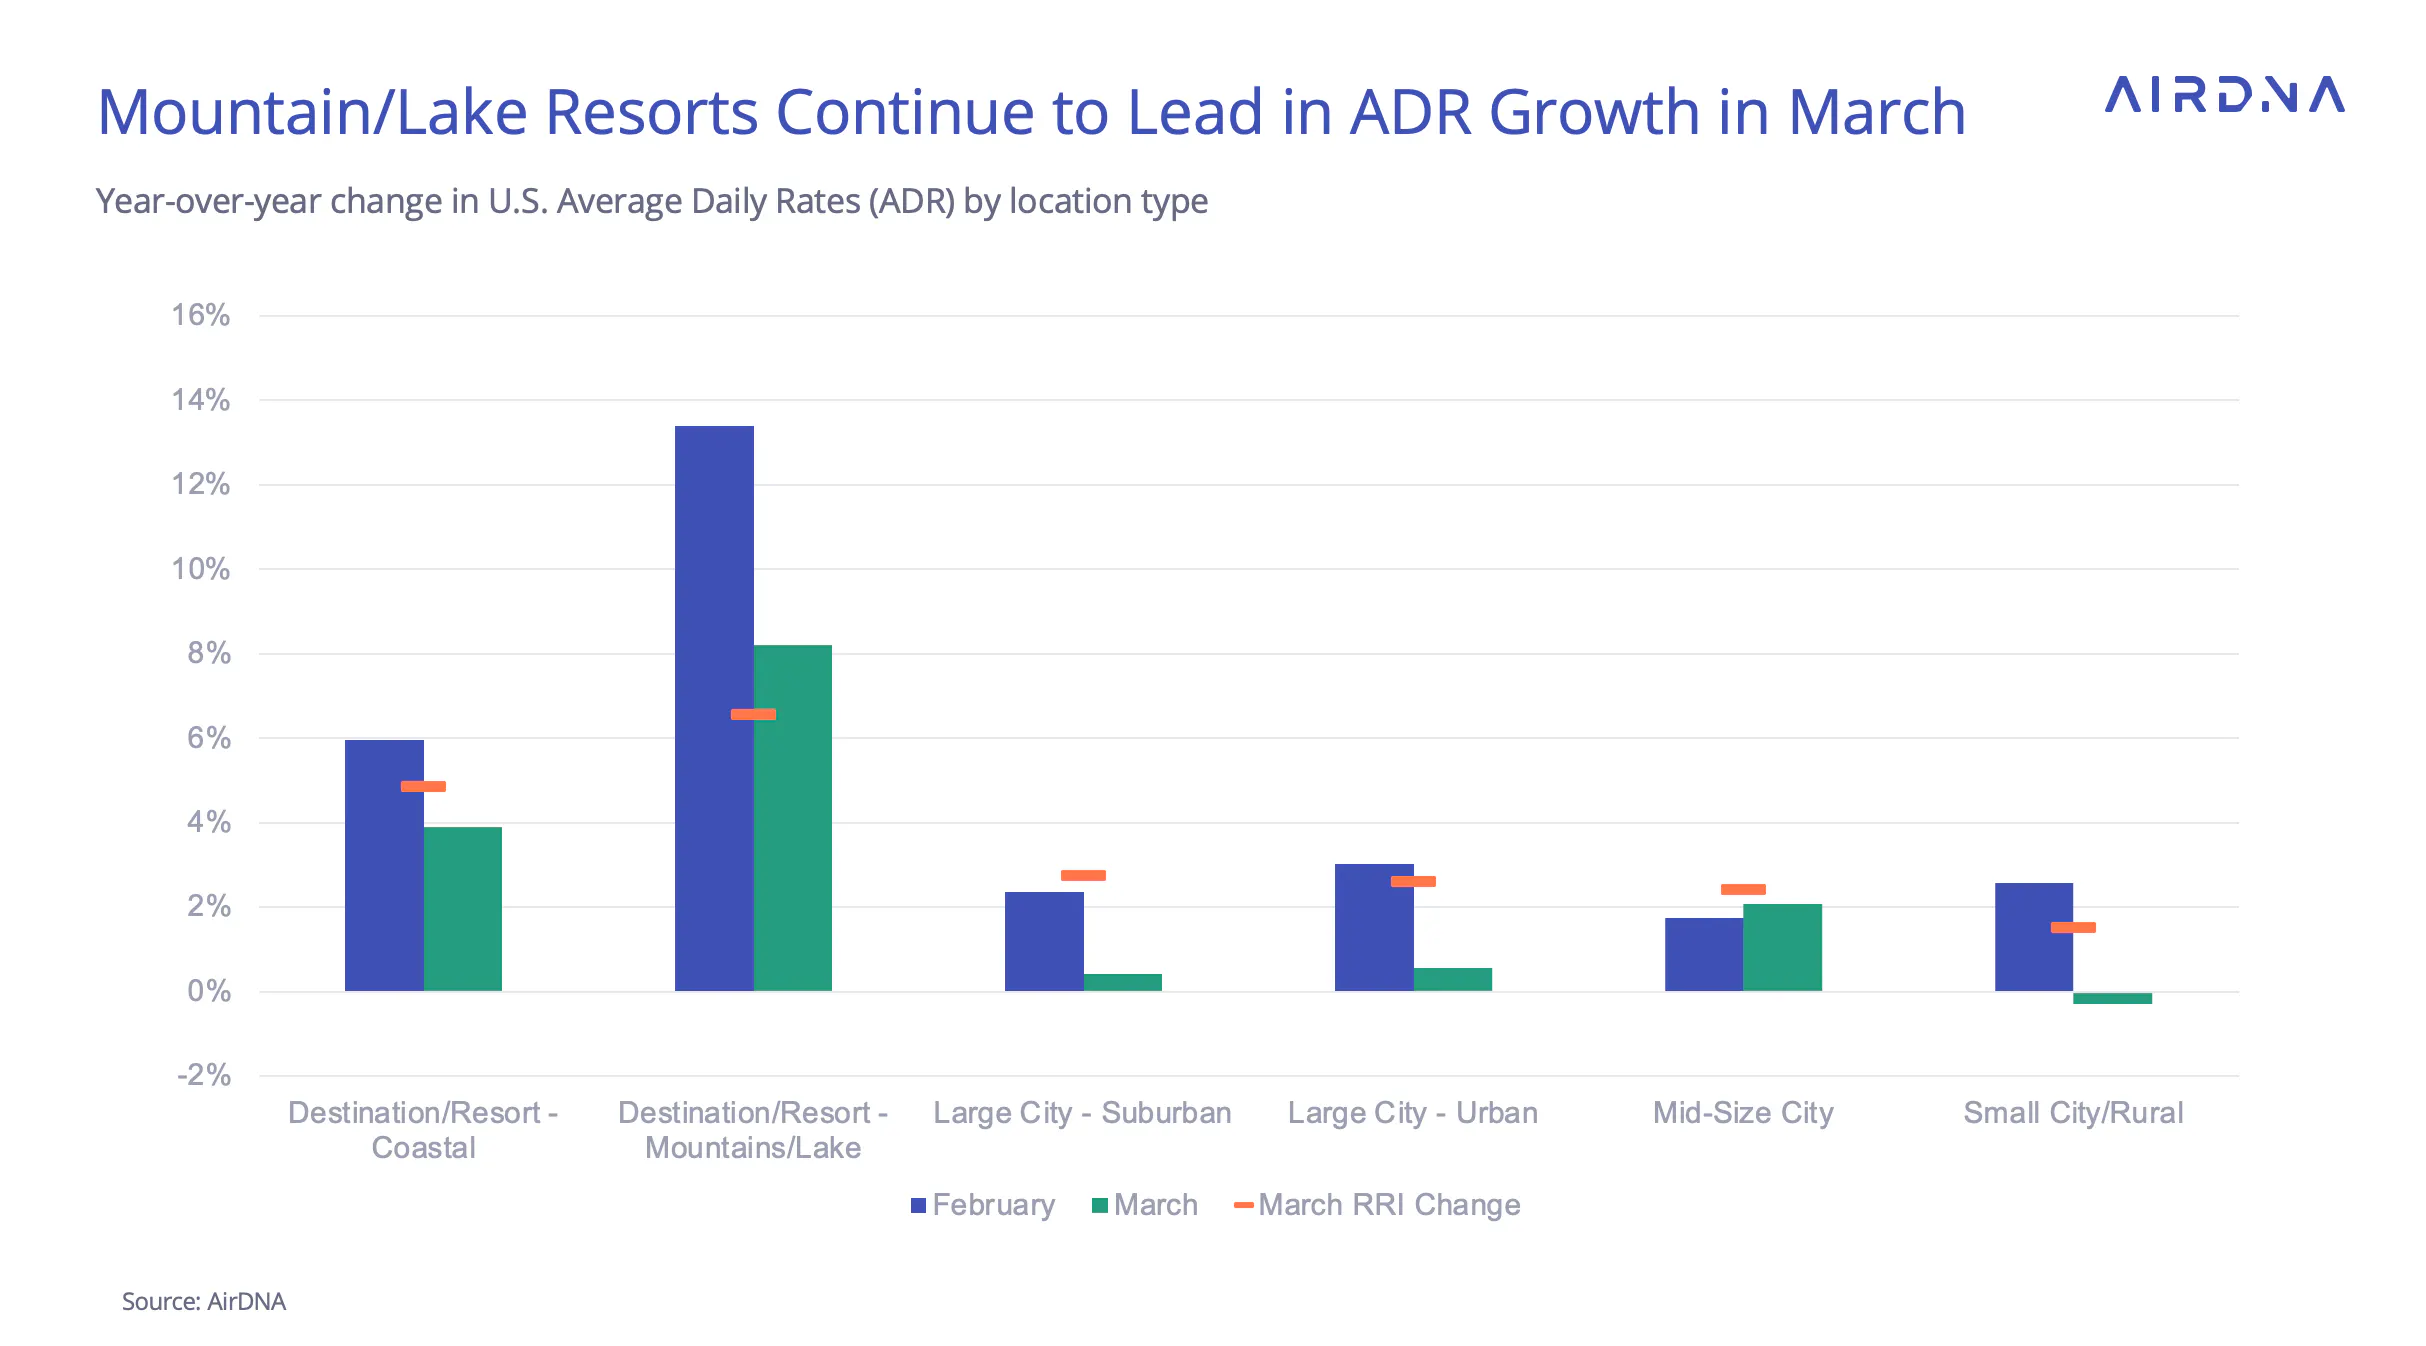
ADR growth slowed across nearly every location type in March — except mid-size cities. These markets saw rising demand, and instead of discounting to fill calendars, hosts were able to raise prices in line with interest.
Mountain and lake resorts, which posted strong rate gains in February, also saw slower growth. Still, they remained the top location category for ADR growth overall — proof that pricing power hasn’t disappeared, even if its pace has cooled.
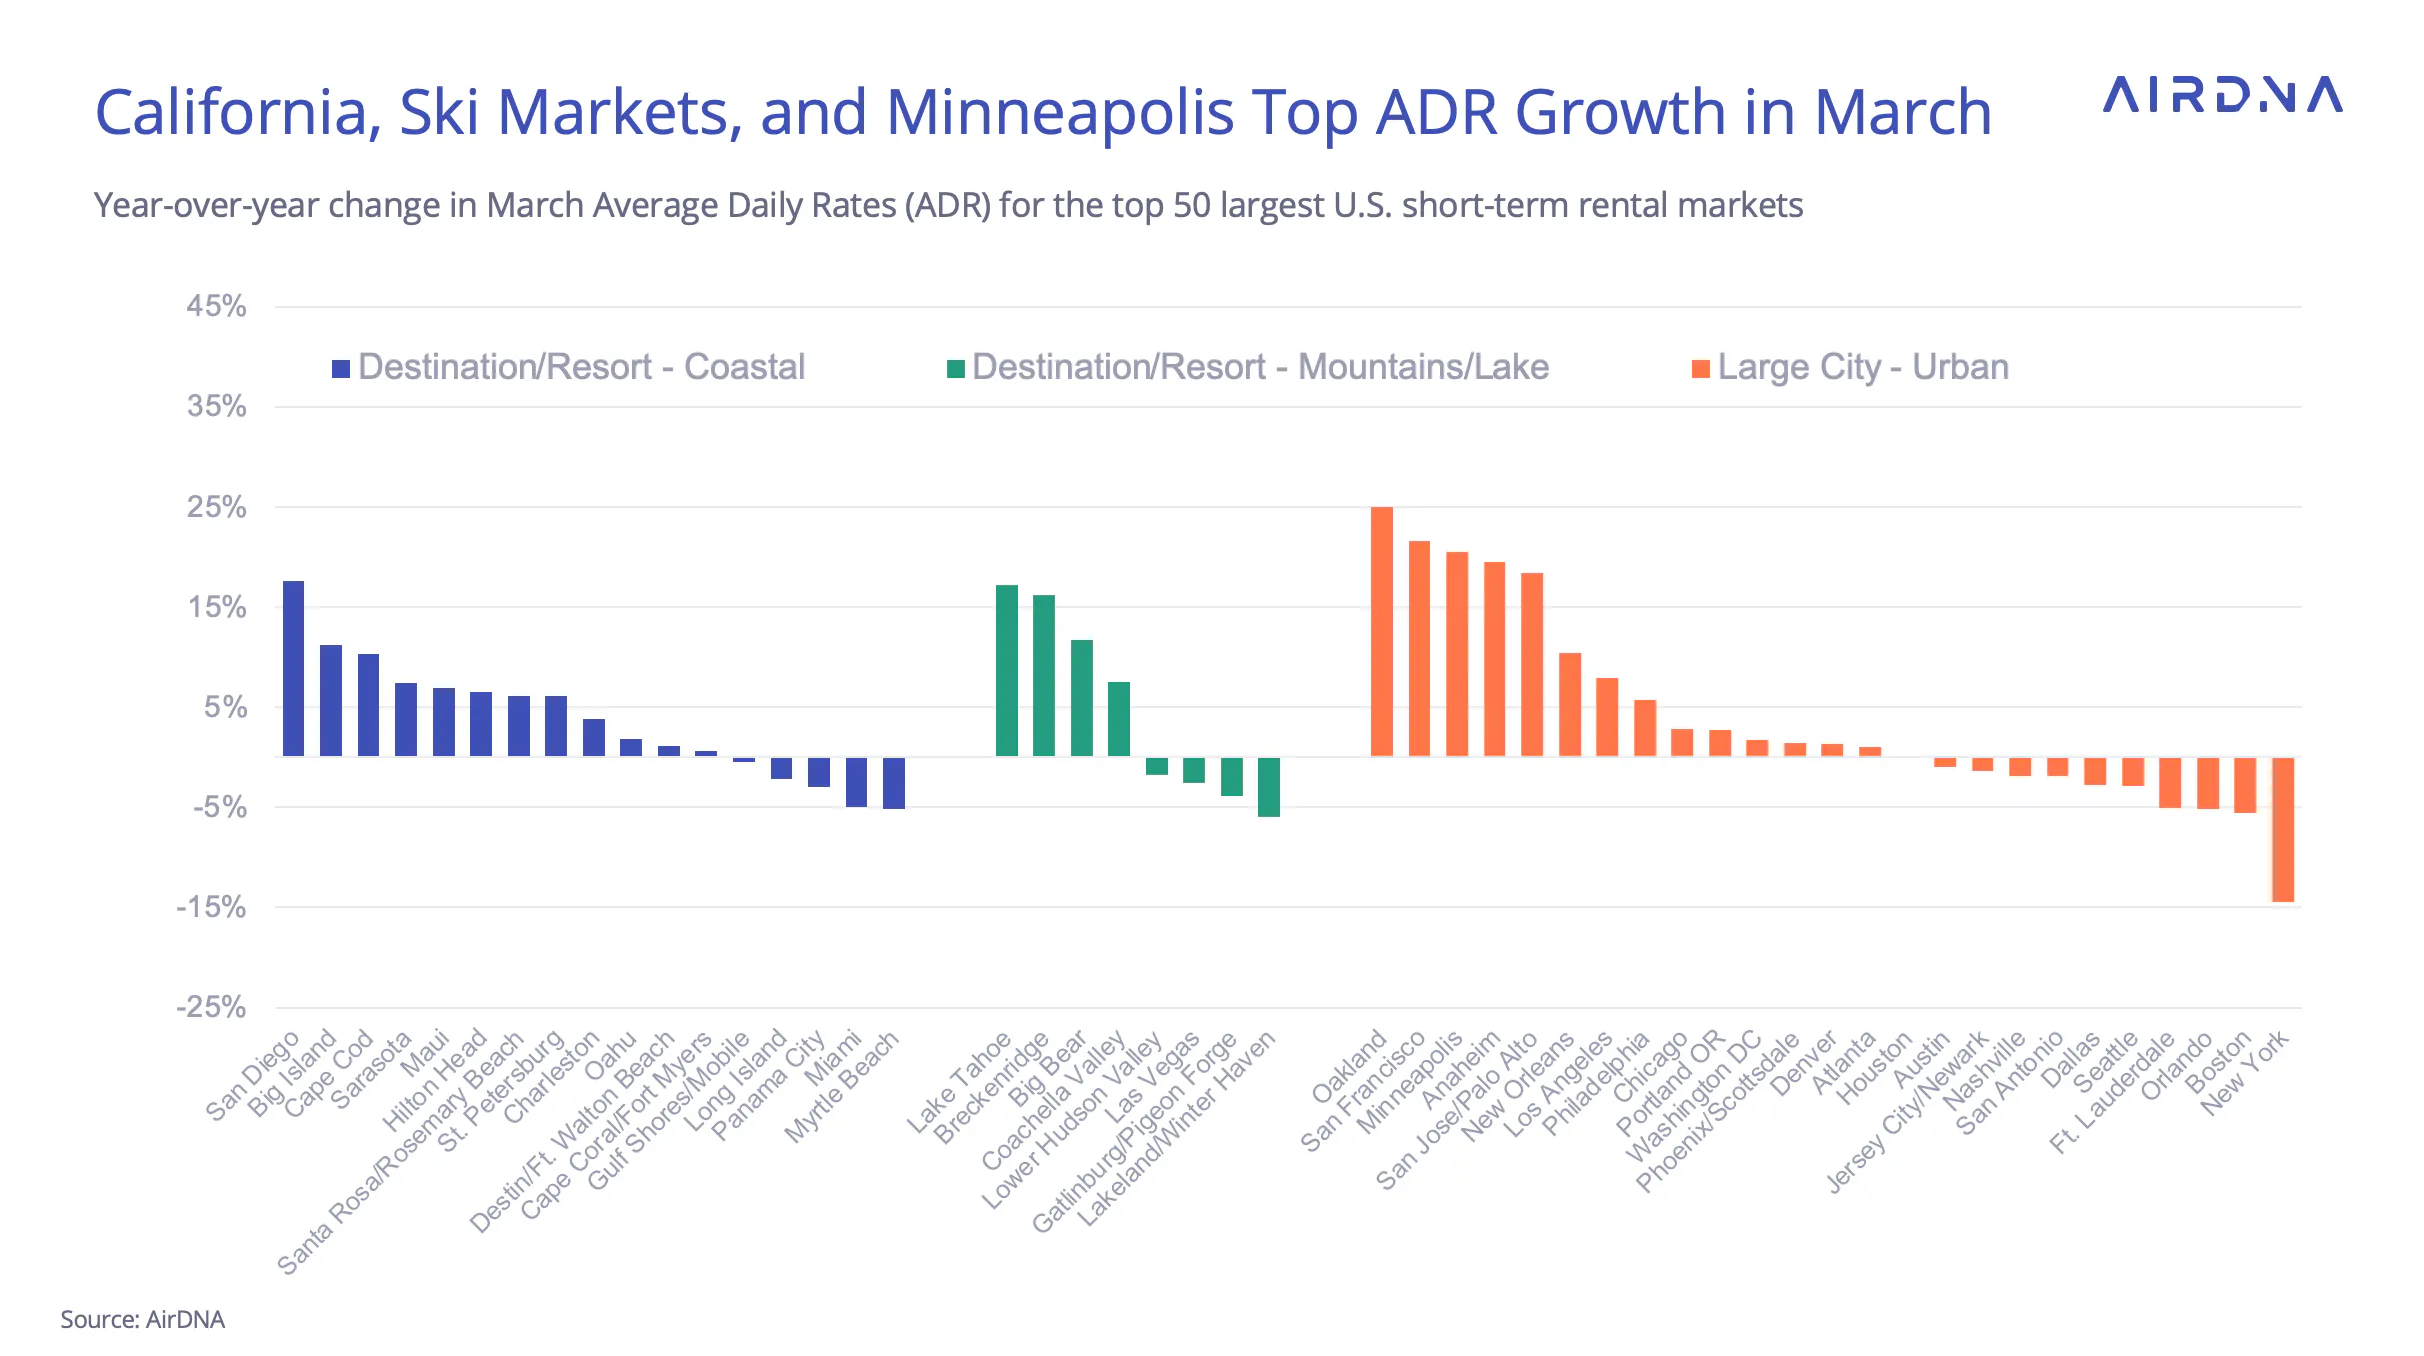
Within AirDNA’s Top 50 markets (which exclude most mid-size cities and include only a handful of ski destinations), eight markets saw ADR growth above 15% in March:
California led the charge:
- Oakland (+25.0%)
- San Francisco (+21.6%)
- Anaheim (+19.5%)
- San Jose / Palo Alto (+18.4%)
- San Diego (+17.6%)

In some of these cities — particularly San Diego and several Bay Area metros — renewed regulatory scrutiny on short-term rentals may be limiting supply, giving existing operators more leverage to raise rates.
Other standouts included:
- Minneapolis, Minnesota (+20.6%)
- Lake Tahoe (+17.2%)
- Breckenridge, Colorado (+16.2%)
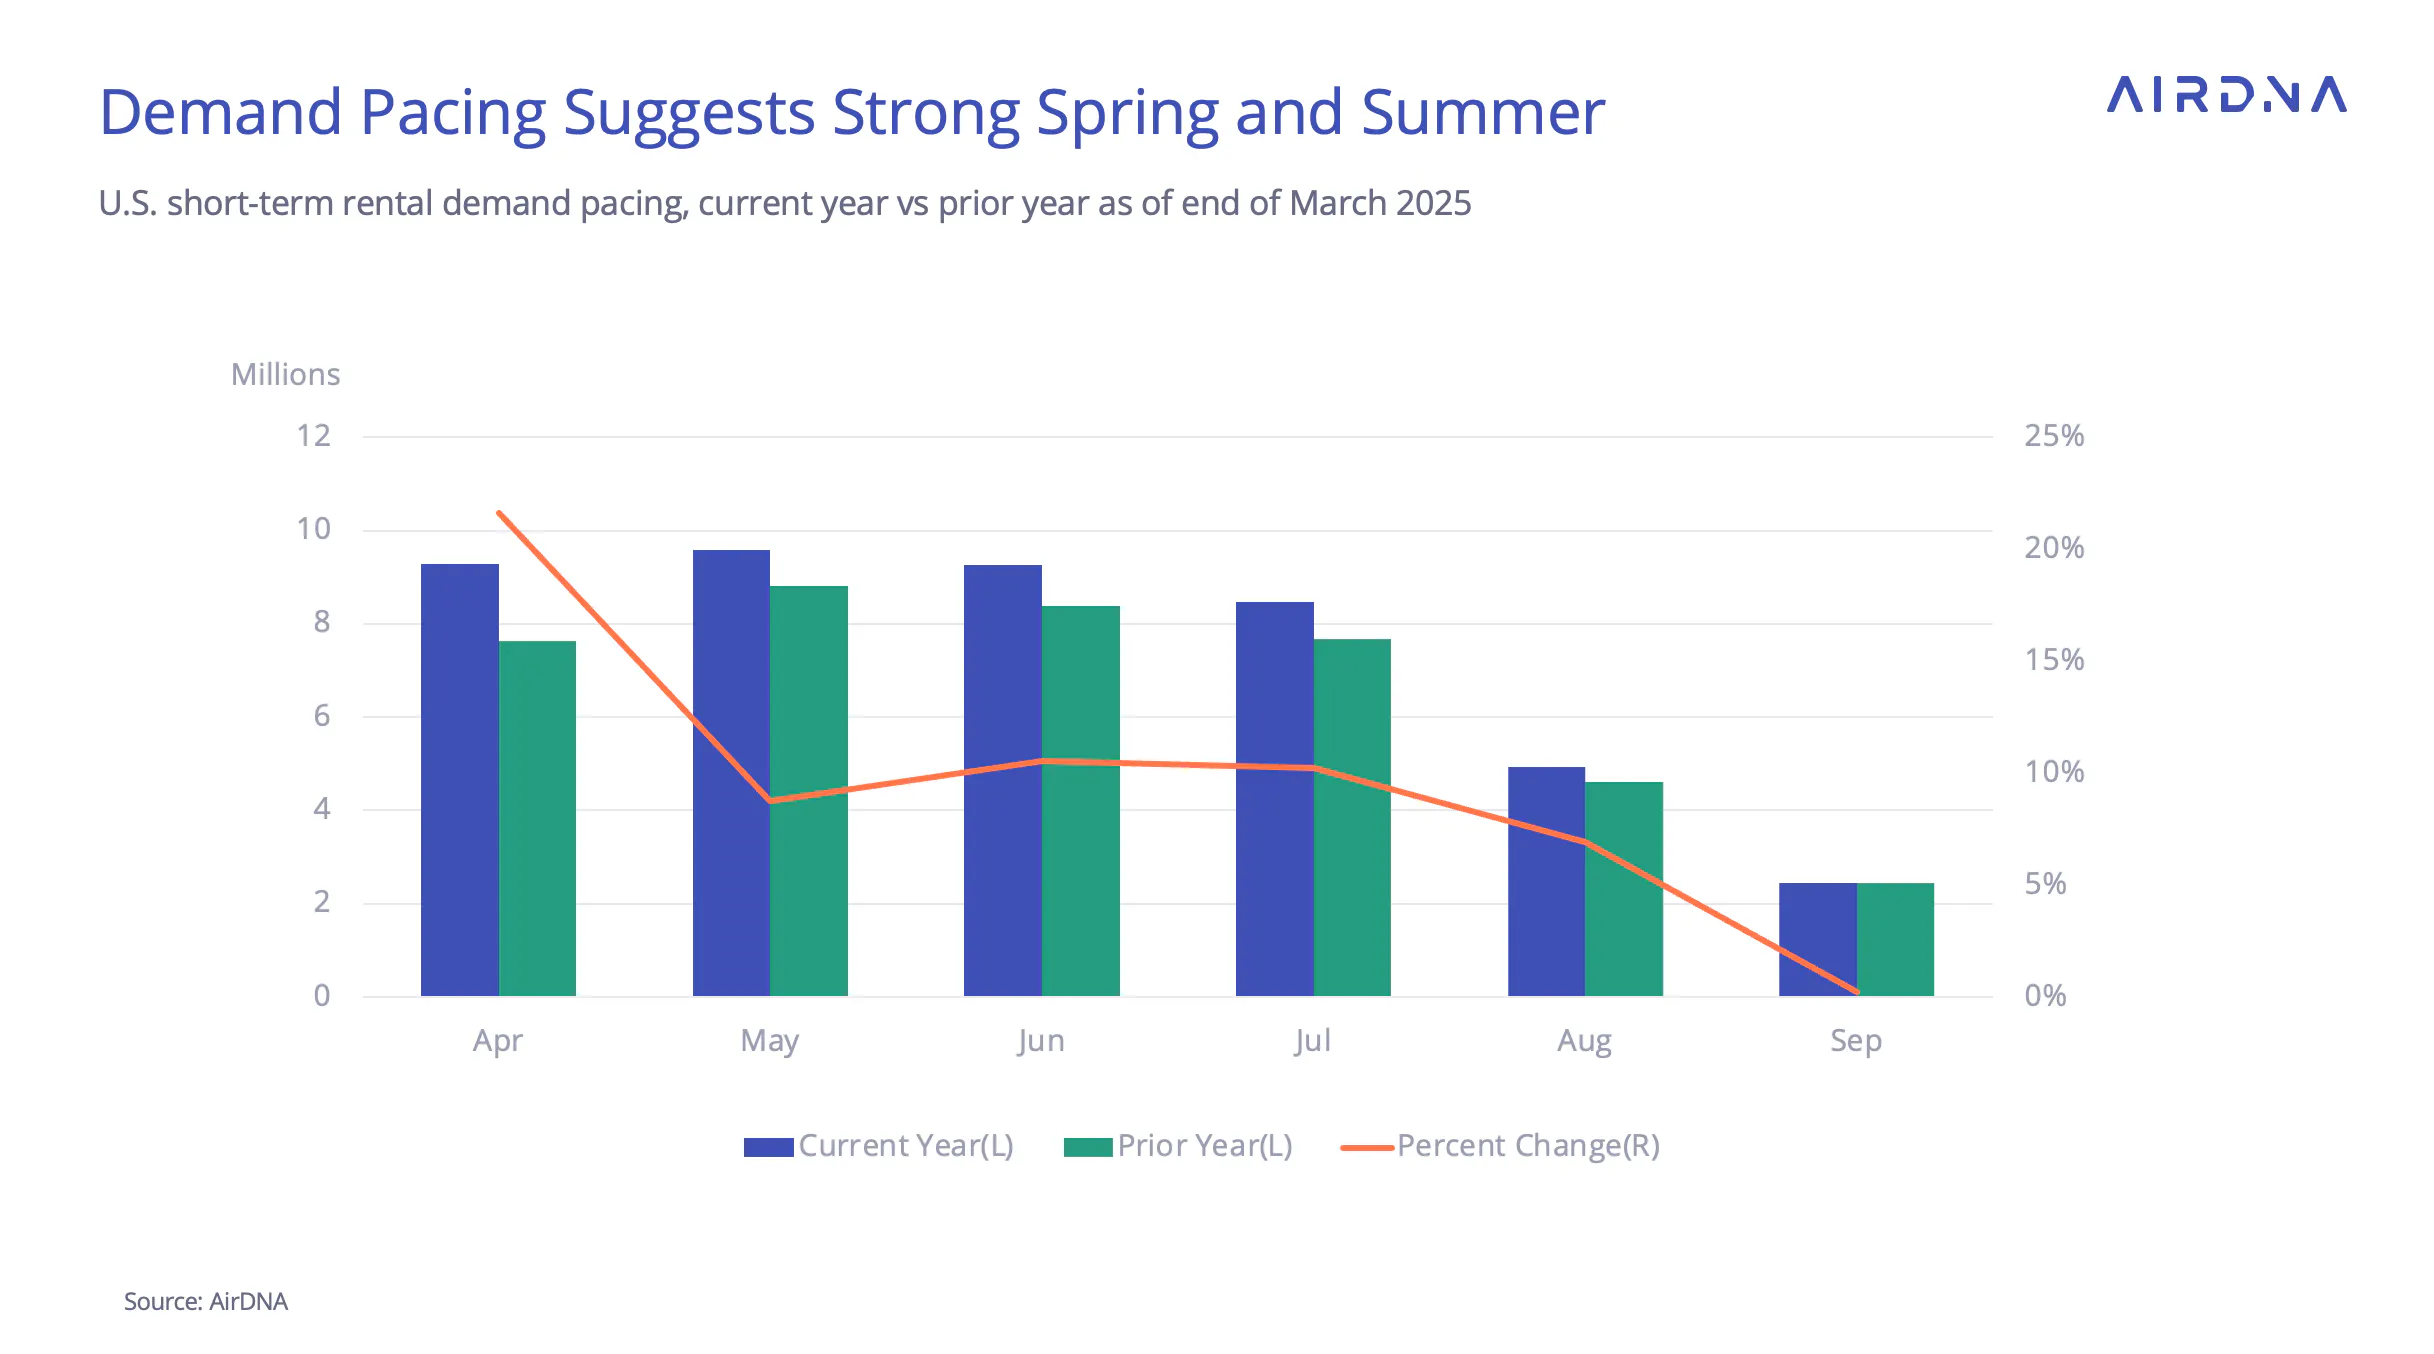
In summary, March was a steady month in the U.S. STR market, with hints that April could be considerably stronger still. Forward pacing also seems to paint a picture of strong performance for the rest of the summer travel season, with months May through August each having demand pace between 7-11% ahead of this same time last year.
International Travel: Canada Boycotts and Border Market Impacts
But if one thing could slow down the U.S. travel market this year, it’s rising tension over international trade policy. In early April, the U.S. announced a slate of aggressive new tariffs, prompting backlash from global partners. But even before that, smaller-scale measures were already having ripple effects.
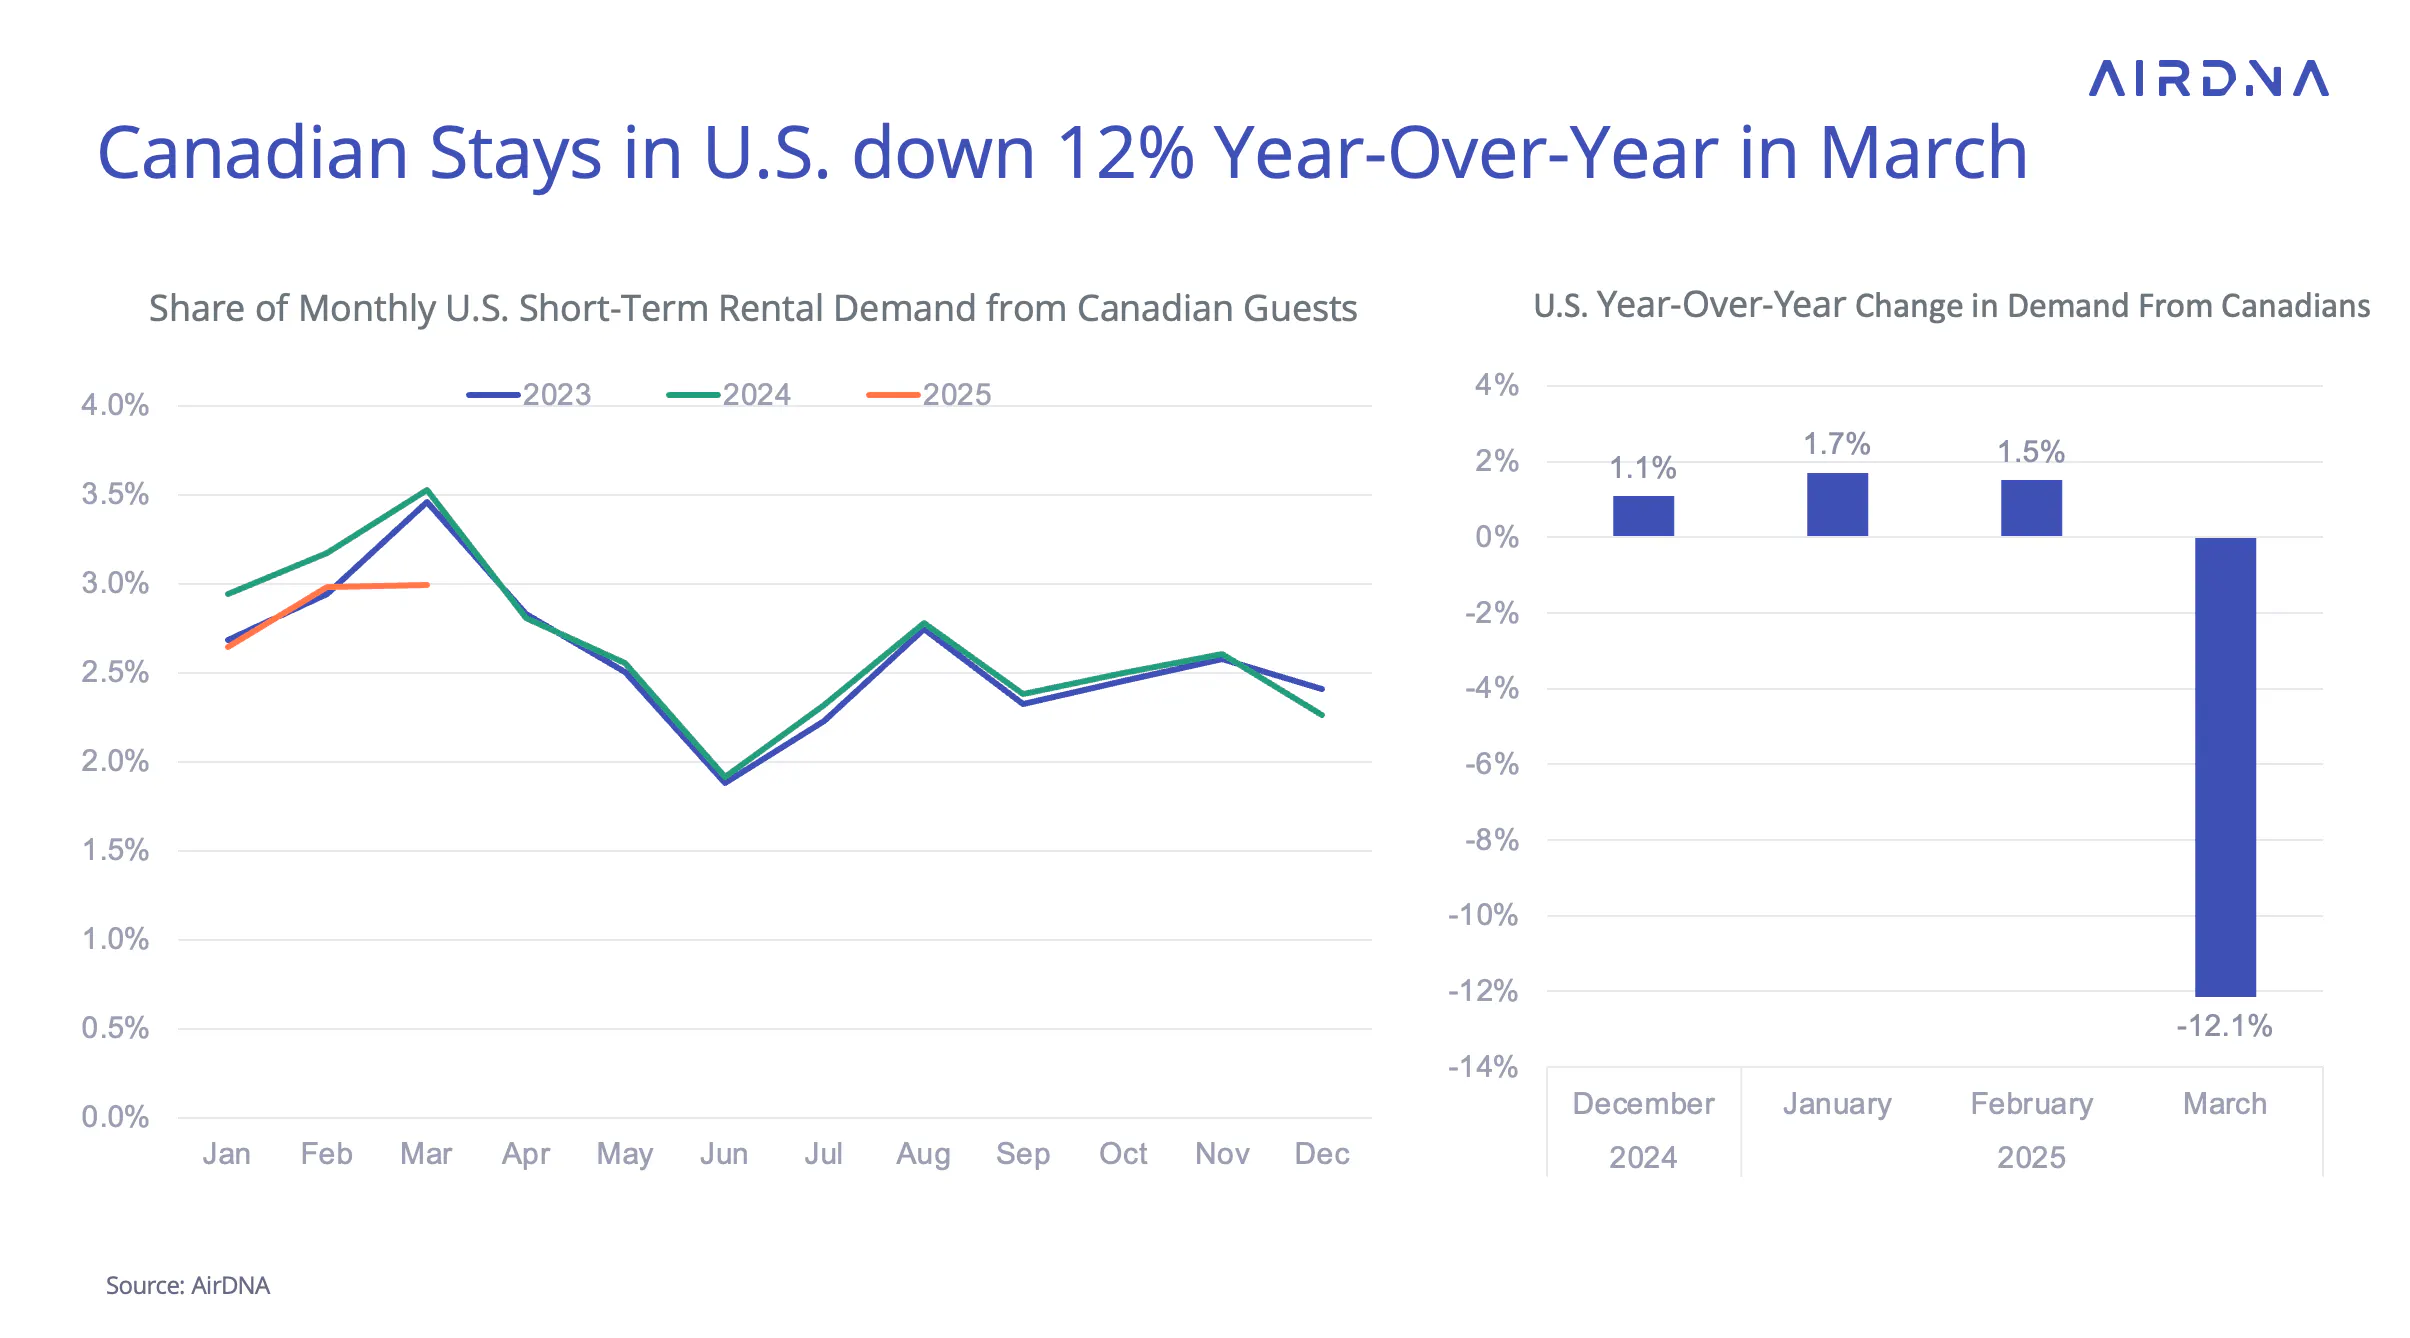
In March, new tariffs targeting Canada led to calls for boycotts from public figures north of the border — and it seems those calls resonated. Travel to the U.S. from Canada fell sharply, down 12.1% year-over-year.
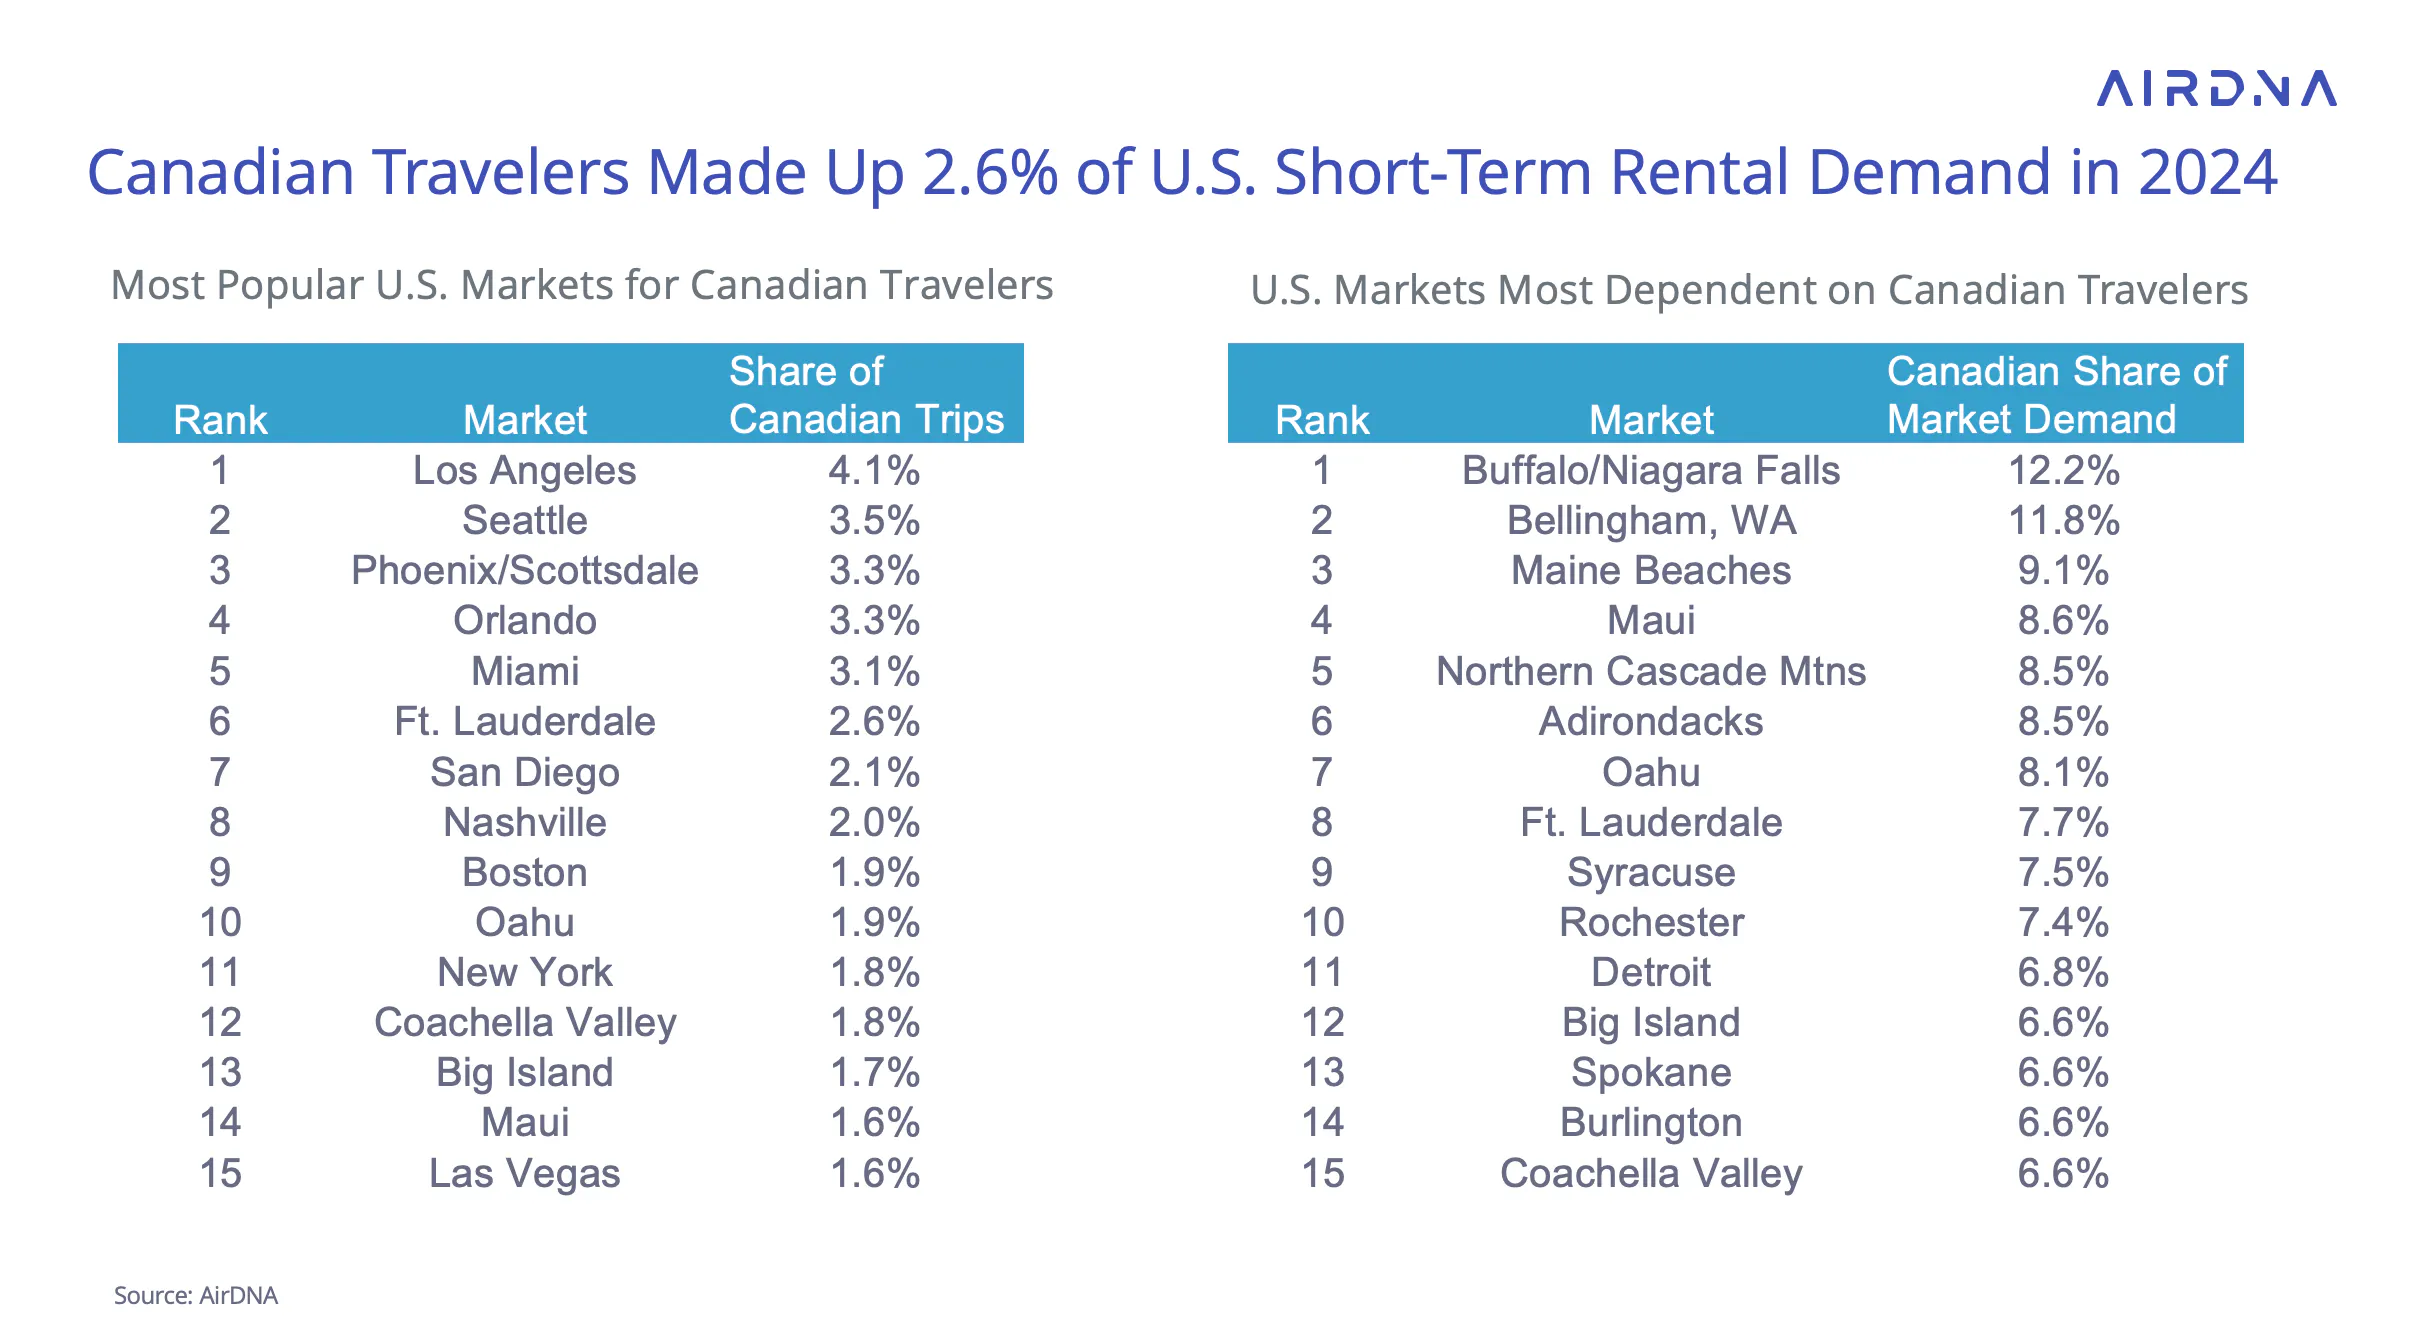
While Canadians only make up about 2.6% of total U.S. STR demand, their absence is felt more in specific markets — especially those near the border or in traditionally popular snowbird destinations.
Some cities, like Los Angeles and Seattle, see high Canadian visitor volume in absolute terms. Others, like Buffalo/Niagara Falls, the Maine Beaches, Fort Lauderdale, and Hawaii’s Big Island, may see fewer Canadian travelers overall — but they represent a much larger share of those markets’ total demand.
Should other countries follow Canada’s lead in response to U.S. tariffs, the effect on international demand will likely remain concentrated by market. AirDNA will continue monitoring these shifts and their potential impact across STR locations.
Get reliable data for smarter investment decisions
AirDNA allows you to handpick the active short-term rentals that align with your investment criteria and shows you exactly how a similar property performs in the real world.
ARTICLE SUMMARY
March 2025 was a steady month for the U.S. short-term rental market, even without the usual holiday travel boost. Demand continued to rise modestly, ADRs inched upward, and new listings kept climbing. Behind the calm, though, hosts are watching bigger forces—from tariff tensions to shifting consumer confidence—that could shape the months ahead.
Bram Gallagher
AirDNA Director of Economics and Forecasting
Bram Gallagher is an Economist at AirDNA, specializing in uncovering insights that drive smarter short-term rental decisions. He put his Ph.D. in Economics from the University of Georgia to work researching and forecasting hotel data with CBRE prior to joining AirDNA, as well as teaching economics at a number of universities. In his spare time, Bram enjoys making wooden furniture with hand tools.
