


U.S. Market Review: Demand Remains Healthy; Occupancy a Little Under the Weather
Published: December 20, 2022
Last updated: May 5, 2026

Scott Sage
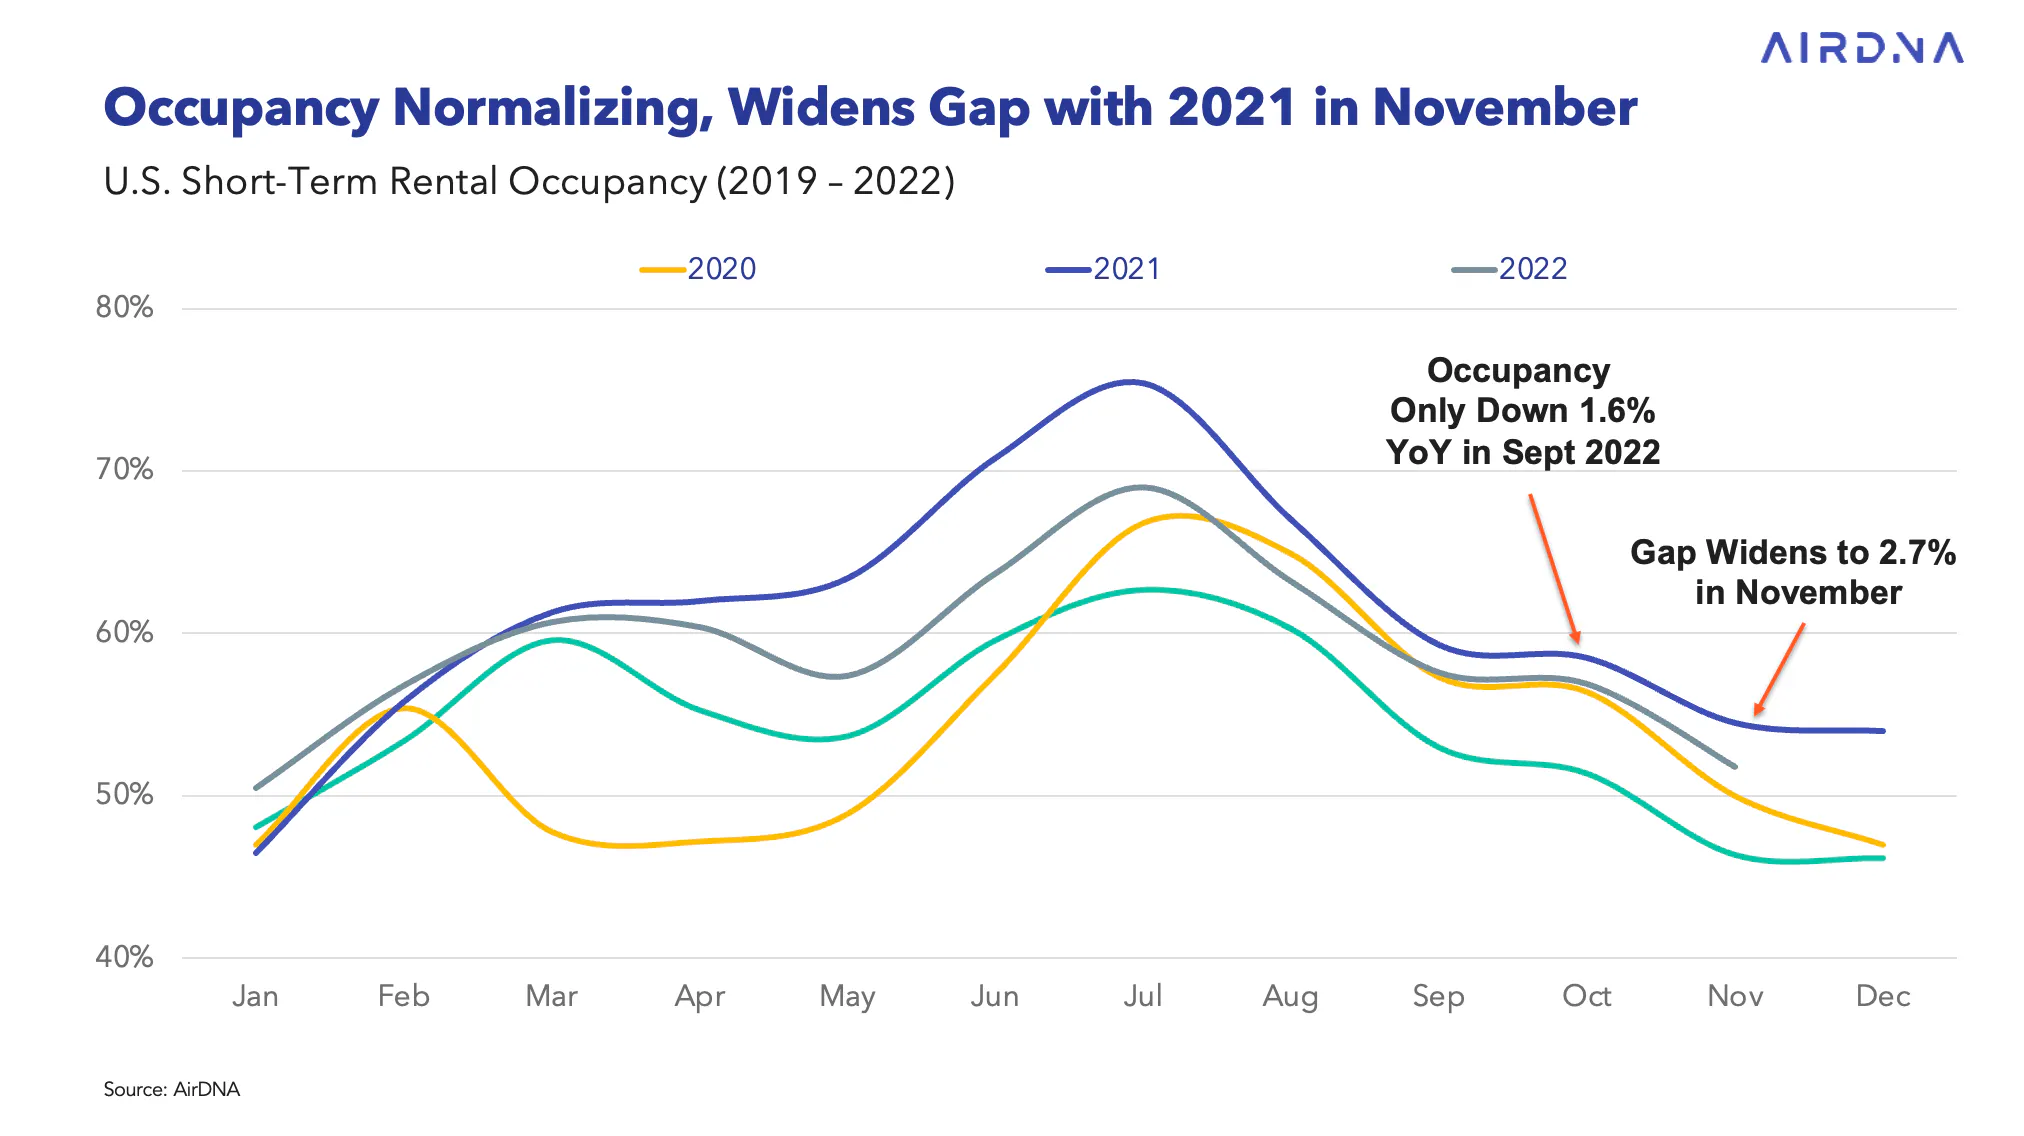
U.S. short-term rental (STR) demand continued a pattern of strength in November, with nights booked for future travel increasing 13% year over year (YoY). Average daily rate (ADR) increased 5.7% as well, but the phenomenal increase in supply seen in 2022 is weighing on performance, with occupancy declining from 54.5% in November 2021 to 51.8% in November 2022. While occupancy has remained below 2021 levels since March, the most recent number represents a slight widening of the gap compared to previous months. While September and October had fallen by 2-3% year over year, the gap widened down to 5% in November. The net result of the shrinking occupancy is flat RevPAR, up only 0.4% year over year in November.
The macro-economic environment remains stable and should support further growth in travel demand throughout the winter. The TSA reported that passenger throughput was only 5% below 2019 levels—the strongest reading since the start of the pandemic—and auto trips, as reported by Arrivalist, were up 3% compared to 2019. The latest inflation figures from the Bureau of Labor Statistics show that prices only increased by 0.1% from the prior month and only 7.1% from a year prior, which represents a continued slowing of inflation and bodes well for the Fed to be able to slow their increases in interest rates in future months. The U.S. added 263,000 jobs in November, and employment growth remains strong and is a bright spot for economic growth, especially as it relates to maintaining growth in consumer spending.
At a Glance: Key U.S. Short-Term Rental Performance Metrics for November 2022:
- RevPAR rose by 0.4% YoY, +50.6% vs. 2019
- Available listings reached 1.33 million – up 24.6% YoY and +19.5% vs. 2019
- Total demand (nights) rose 17.0% YoY and sits 30.8% higher vs. 2019
- Occupancy declined 5.0% YoY to 51.8% but is up +11.7% vs. 2019
- Average daily rates rose 5.7% YoY to $301 and are up 34.8% vs. 2019
Demand Slows for the Winter, but not Hibernating Yet
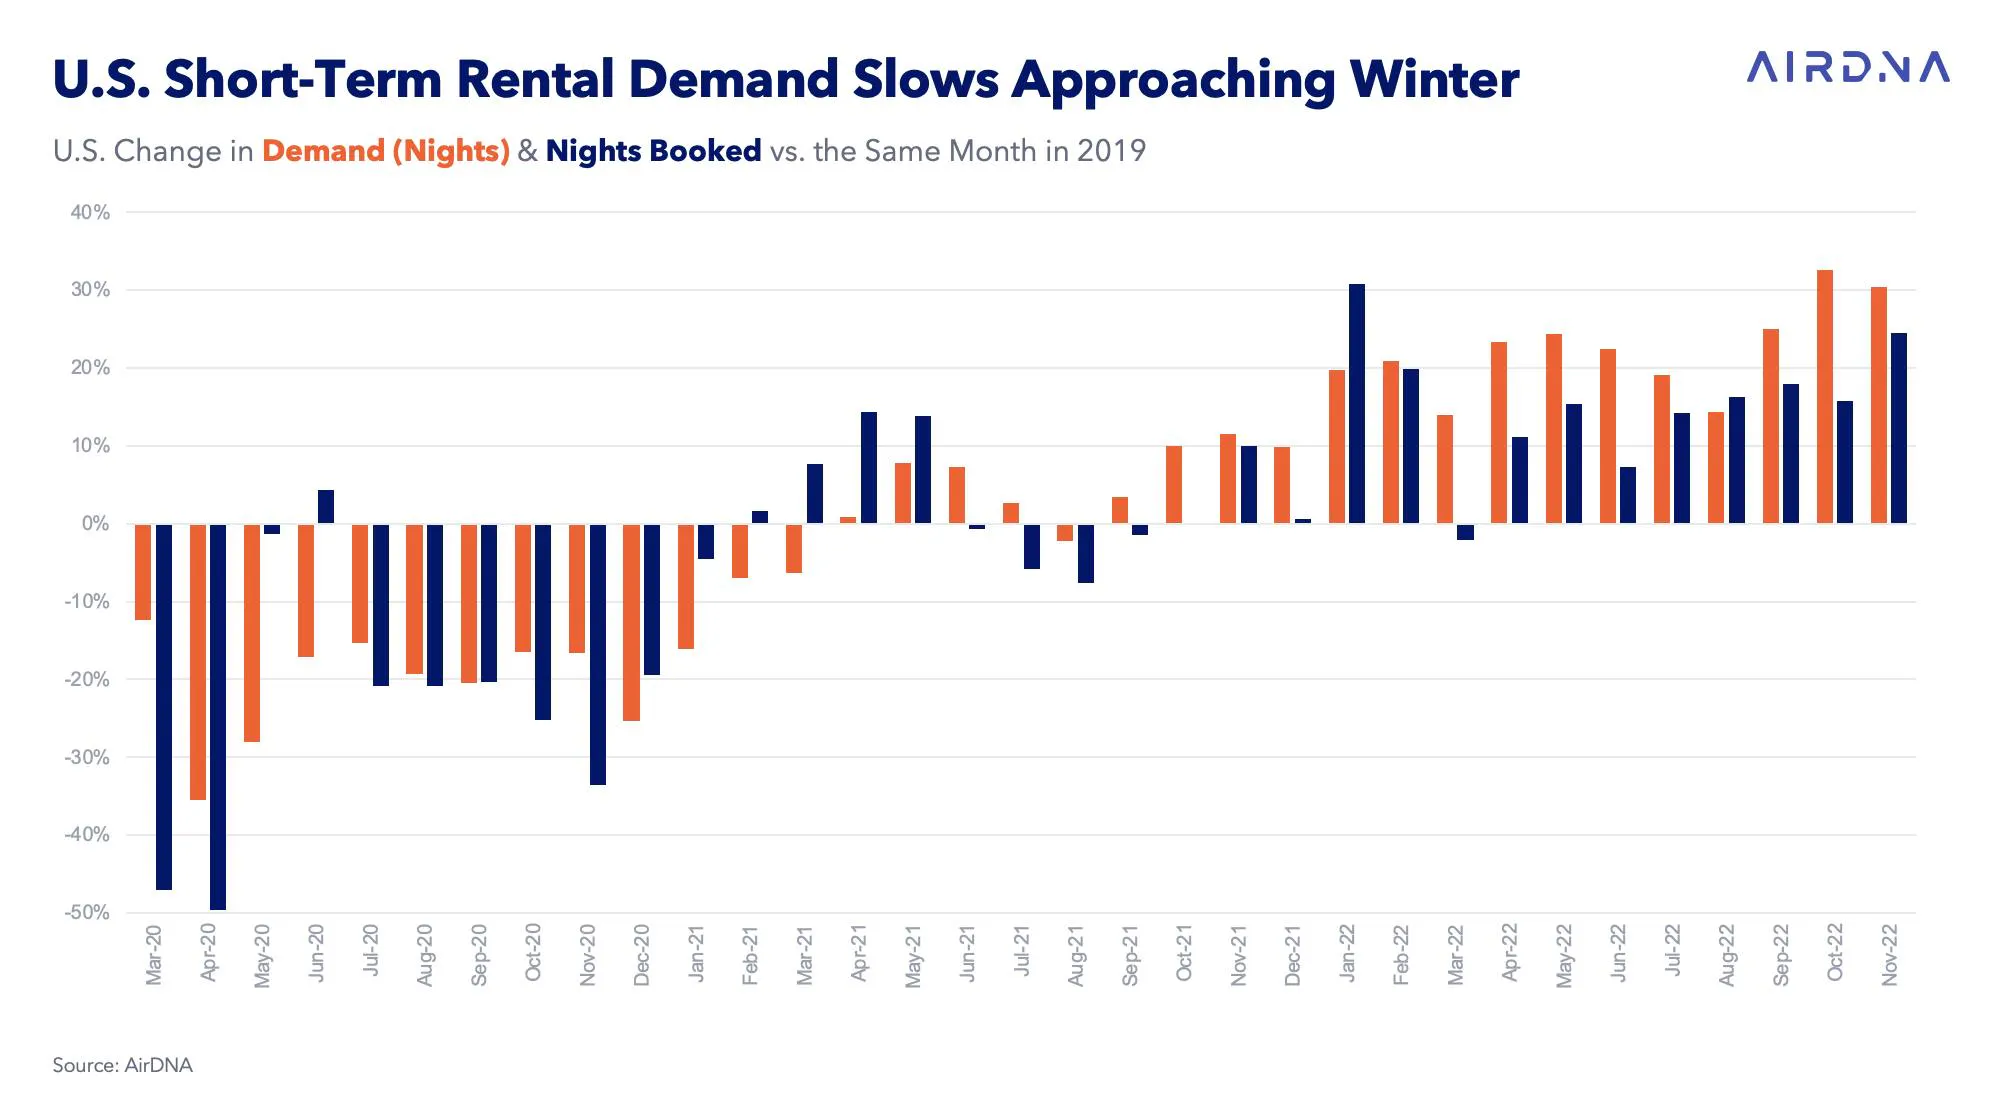
STR demand, measured in nights stayed in November, remains well above 2022 levels, although as we approach winter, this pace is slowing. A lengthening of the 2022 travel season into September and October led to demand exceeding 2021 by approximately 21% in both months. A return to a more conventional slowing of travel during cold-weather seasons has reduced this premium to 17% in November.
A lagged version of this behavior can be seen in booked nights—that is, nights booked in November for future stays—which reached 26% higher than 2021 levels in August but declined each month since to 13% higher in November. Nights booked versus 2019 have sharply accelerated in November, to 25% higher than the same month in 2019 compared to only 16% higher in October.
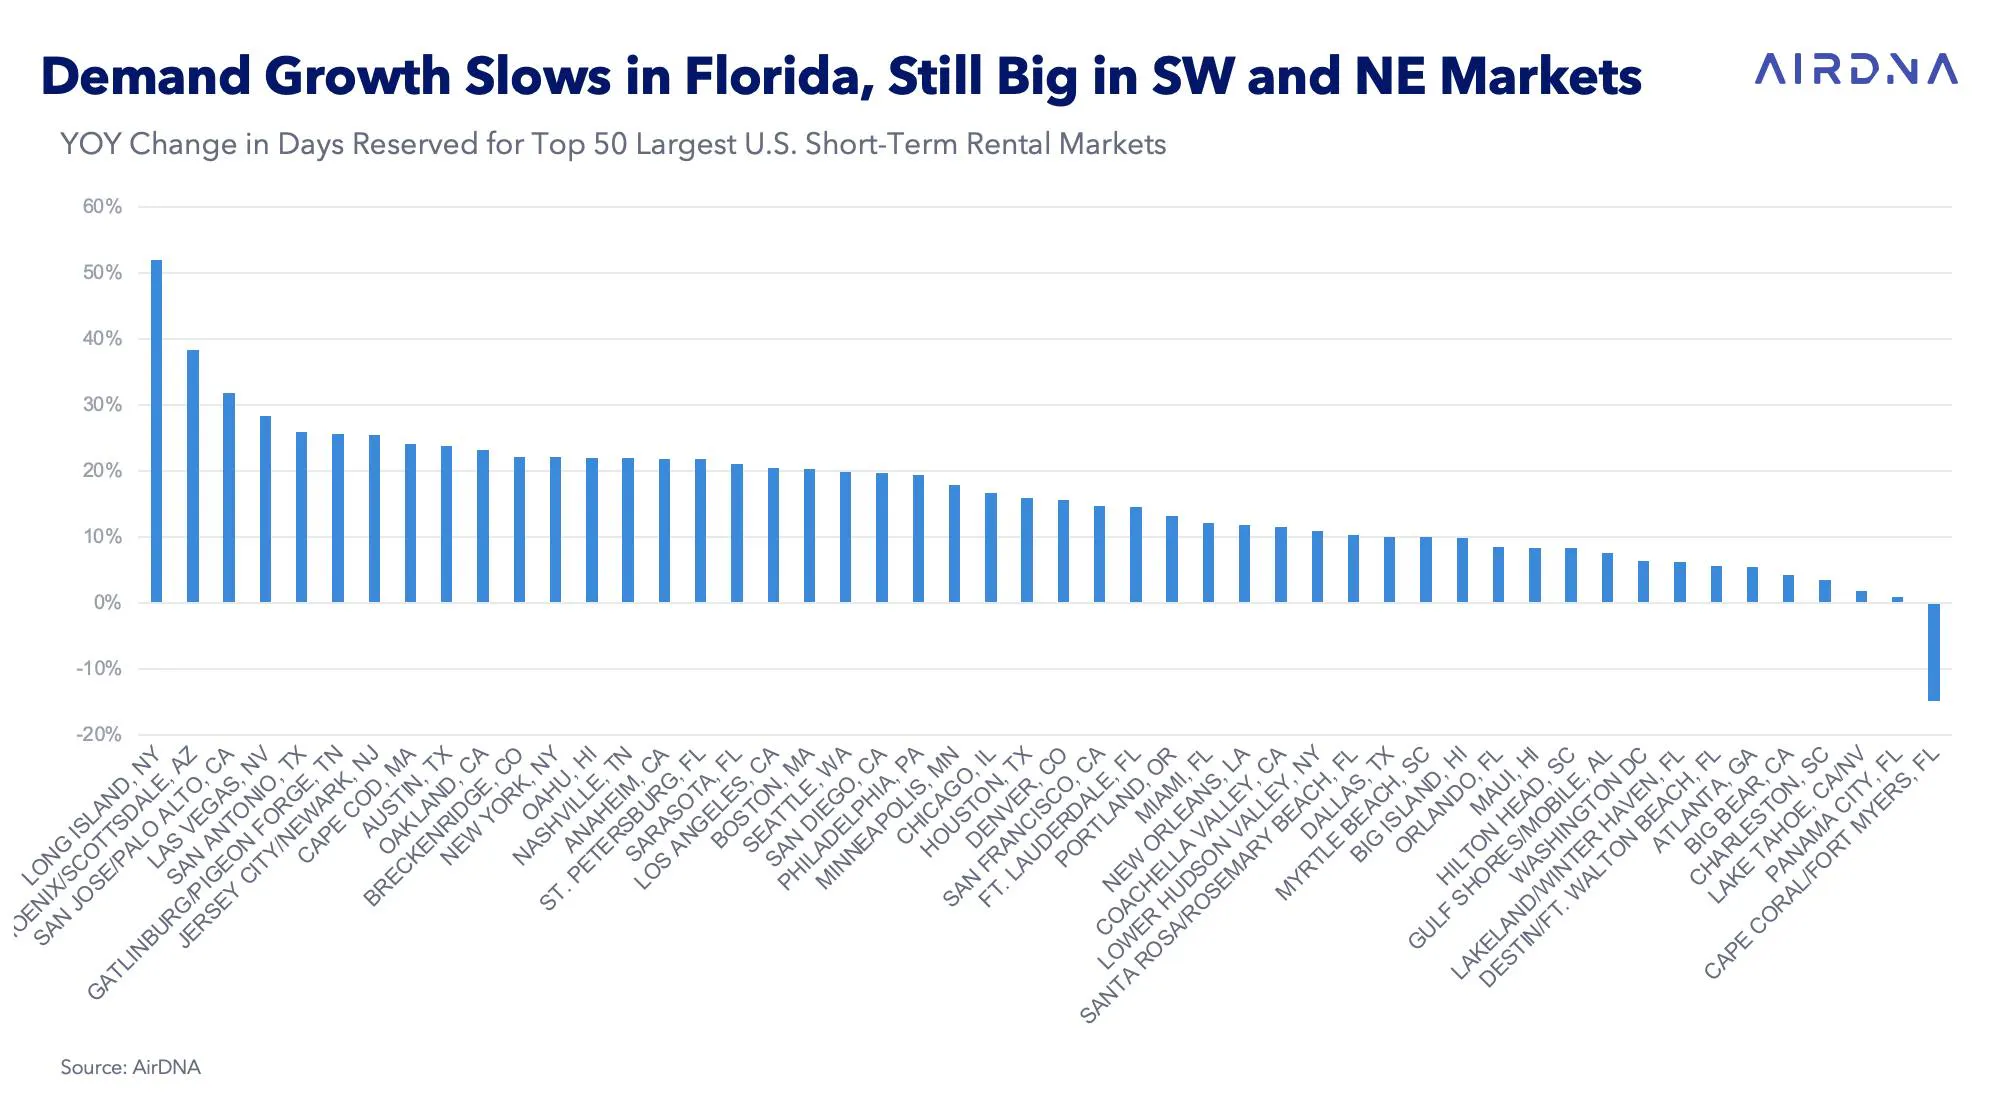
Turning to the largest markets, the changing over of travel seasons can be seen in the top 50 markets, where many coastal resort locations are experiencing slow growth compared to 2021.
The highest growth in demand compared to 2021 in November was observed in Southwestern destinations such as Las Vegas, San Antonio, and Phoenix/Scottsdale; a few Bay Area markets such as San Jose/Palo Alto and Oakland; and Northeastern markets that have been slow to recover their hospitality markets such as Long Island, New York, and Jersey City/Newark, New Jersey.
The market of Cape Coral/Fort Myers, Florida, badly shaken from Hurricane Ian, is the only top-50 market to see a decline in STR demand year over year.
Supply Growth Remains Strident
Where STR demand has demonstrated resilience in 2022, supply has exhibited exuberance. Total available listings posted a 24.6% increase year over year in November, which was a slight acceleration in the growth rate from September and October.
The year-over-year growth is highest in large and midsize cities where listings are up more than 35% from the prior year.
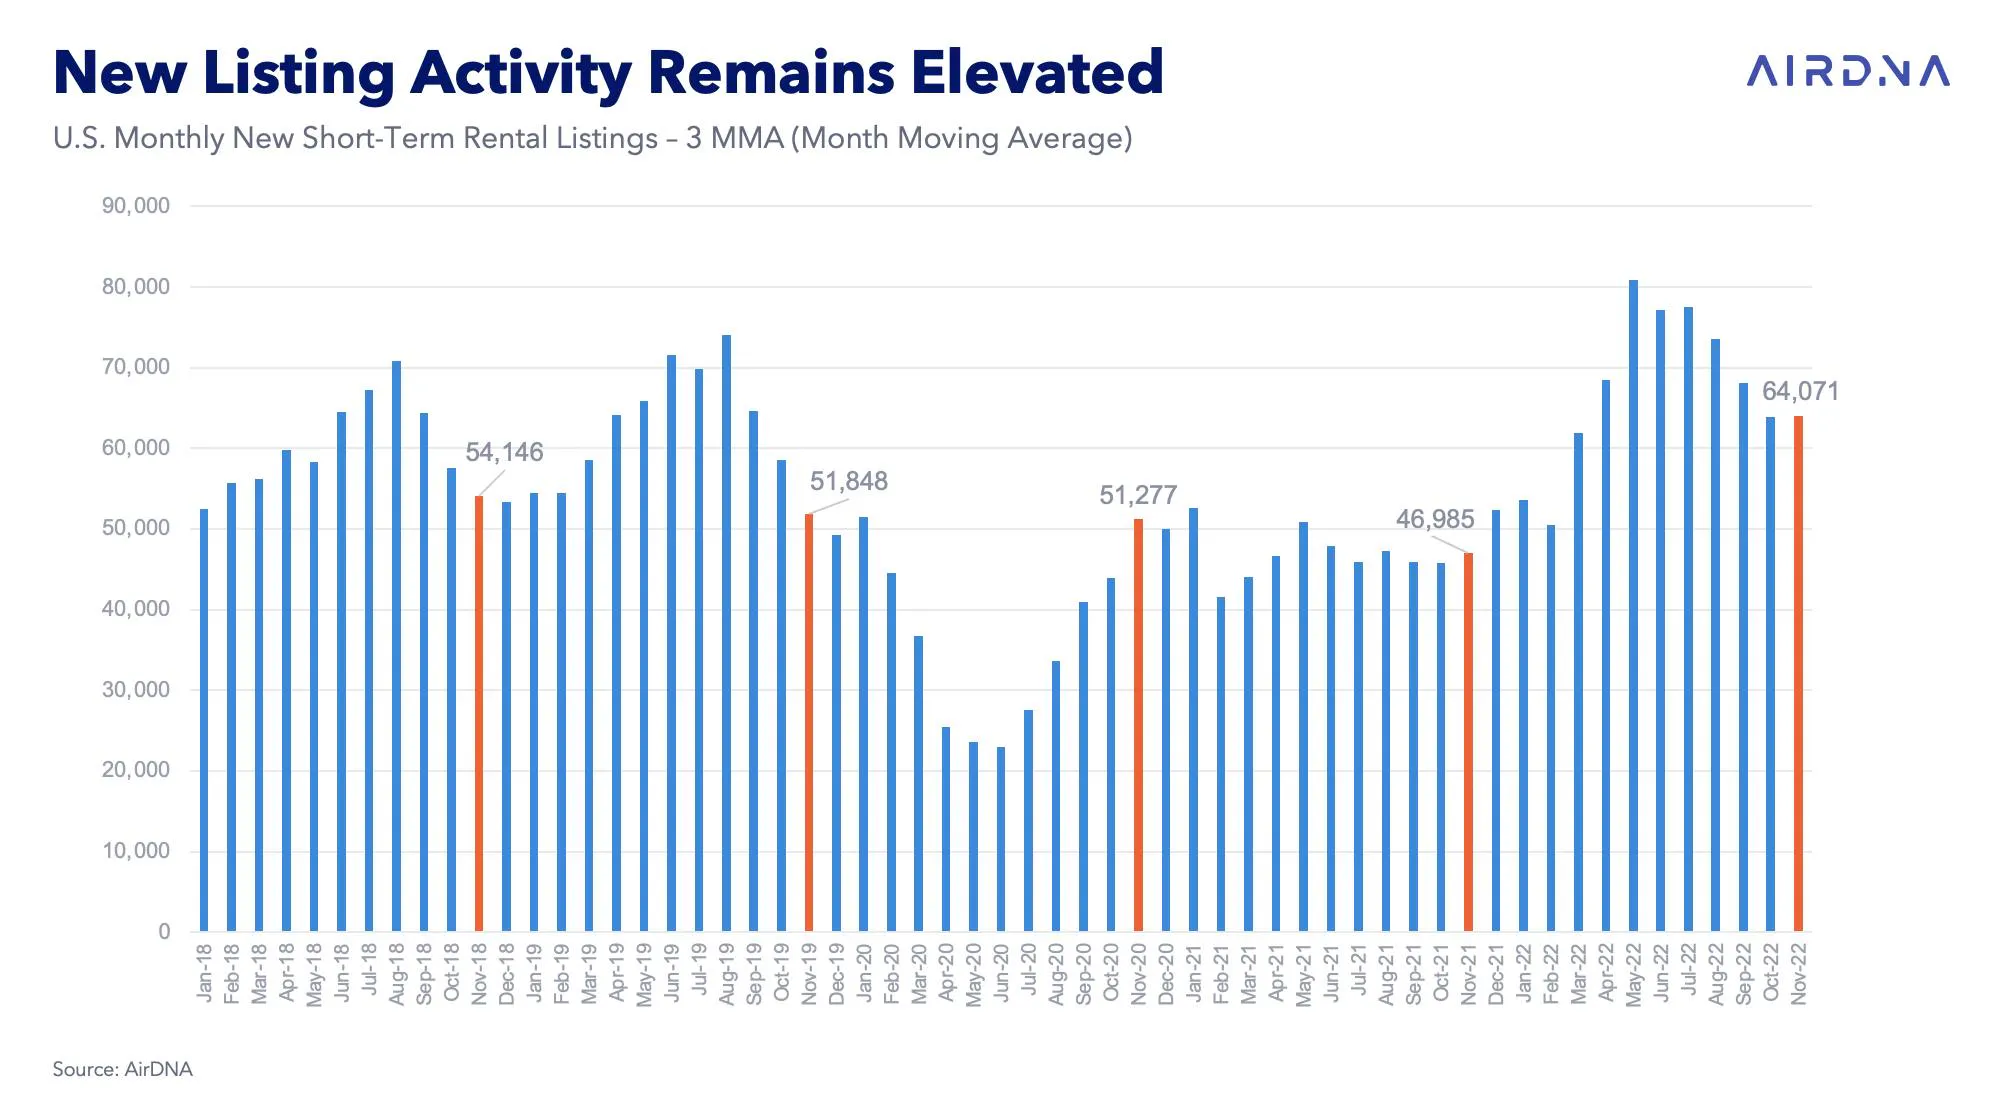
Maintaining this high supply level can, in large part, be attributed to elevated new listings. While we usually see a seasonal dip in new listings over the winter months, new listings grew slightly in November compared to October, to just over 64,000.
This is the largest number of new listings for November recorded yet.
Average Rates Stabilize
Against the backdrop of elevated new listings, high supply, and a widening gap in occupancy, the 5.7% increase in ADR appears to be a positive note. Inflation in November, as measured by year-over-year growth in the Consumer Price Index (CPI), was 7.1%, slightly less than economists expected but still enough to cause real ADR to contract.
As noted earlier, listing growth was highest in the cities, suggesting that supply pressures may at least explain part of the declining ADR growth in these locations. ADR growth accelerated in small city/rural, coastal, and mountain locations, remained about the same in midsize cities, but experienced significant declines in the large city market.

But is the relationship between ADR and supply growth as simple as high supply lowering ADR? After a few seasons of very quick supply growth, an examination of U.S. markets shows that while the connection between year-over-year demand and occupancy growth appears straightforward, this is not necessarily the case with ADR growth.
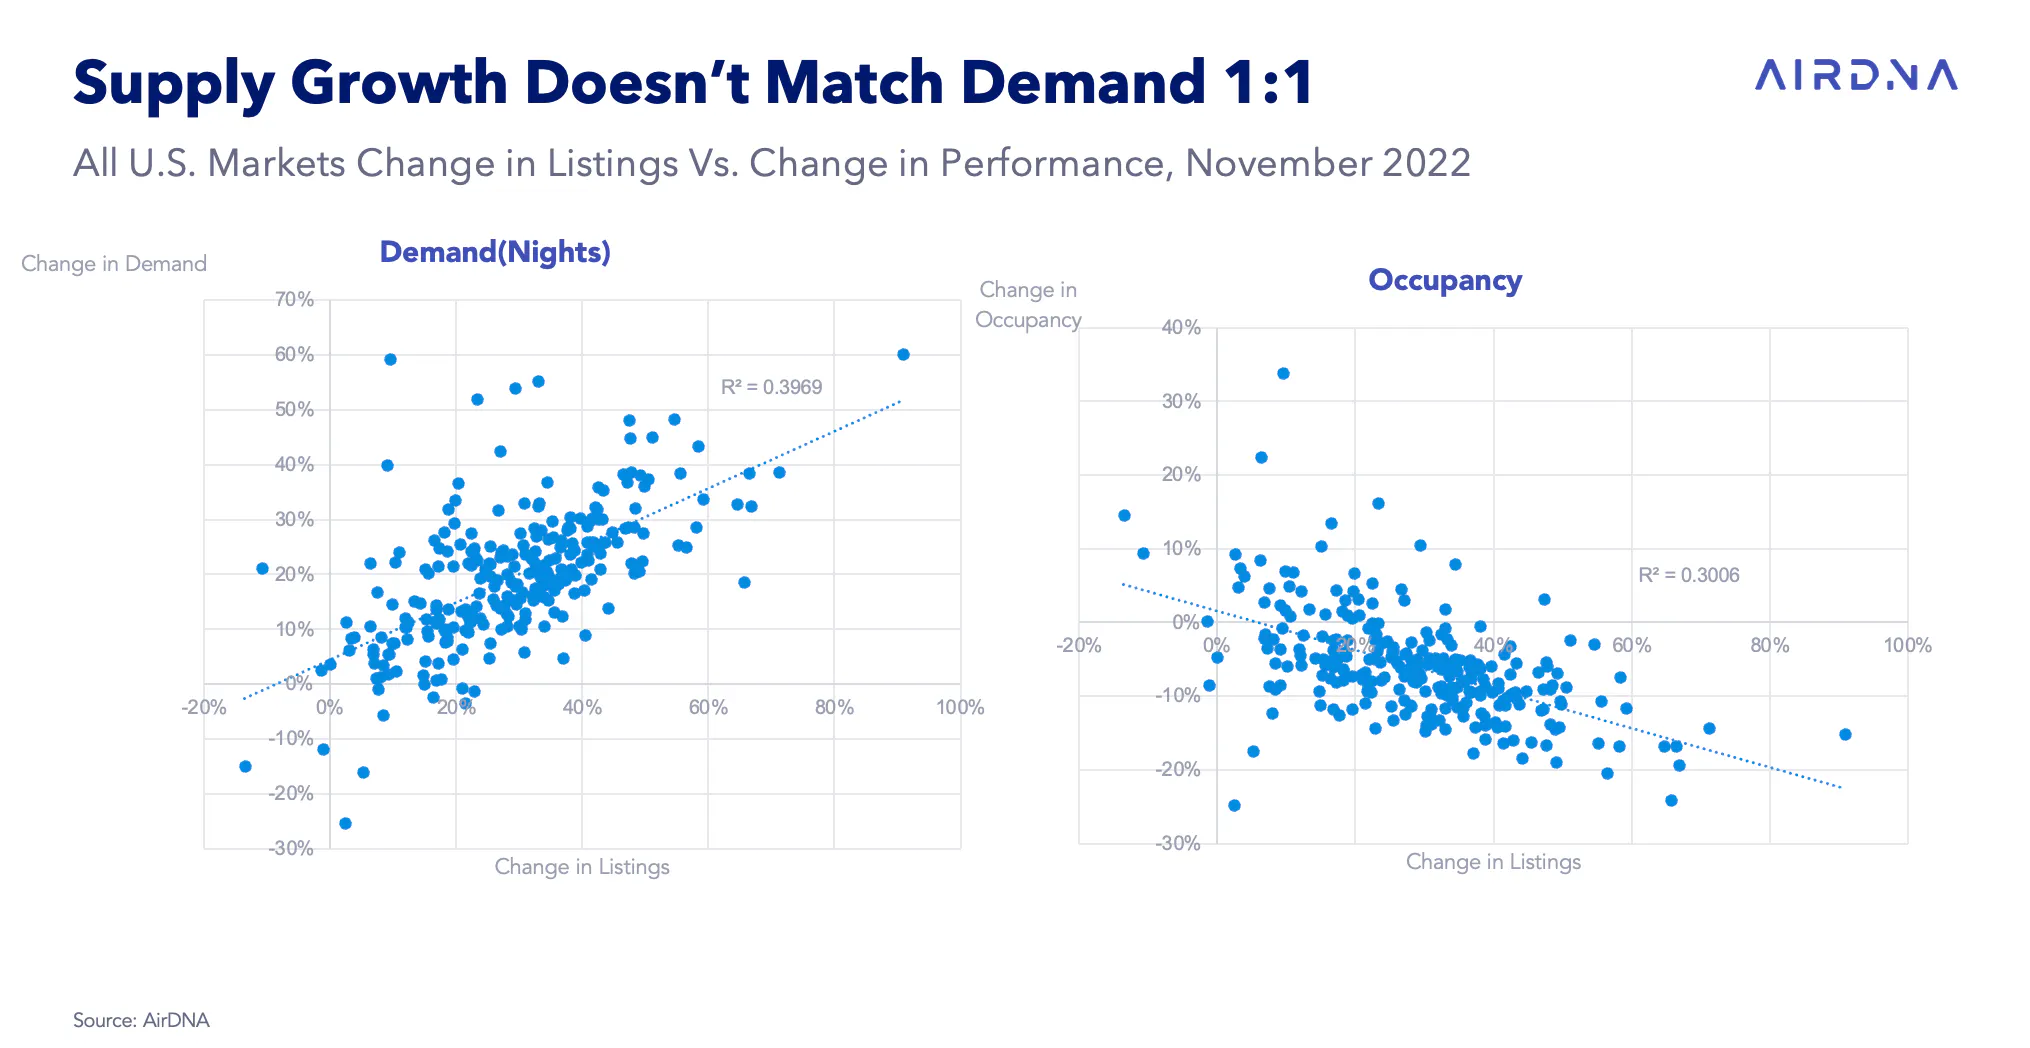
It intuitively follows that supply would precede areas where there is good expectation of new demand. Moreover, it would be difficult to accommodate more demand without more supply. Hence, the relationship between demand growth and supply growth is positive. Moreover, just this simple correlation explains 40% or so of the variation in demand growth across all U.S. markets—remarkable considering the multitude of factors that potentially could influence someone to rent an STR in a given market! However, while the relationship is positive, it’s not enough to keep occupancy from declining as well. A similarly strong, negative relationship can be observed between supply growth and occupancy change as supply increases faster than demand.
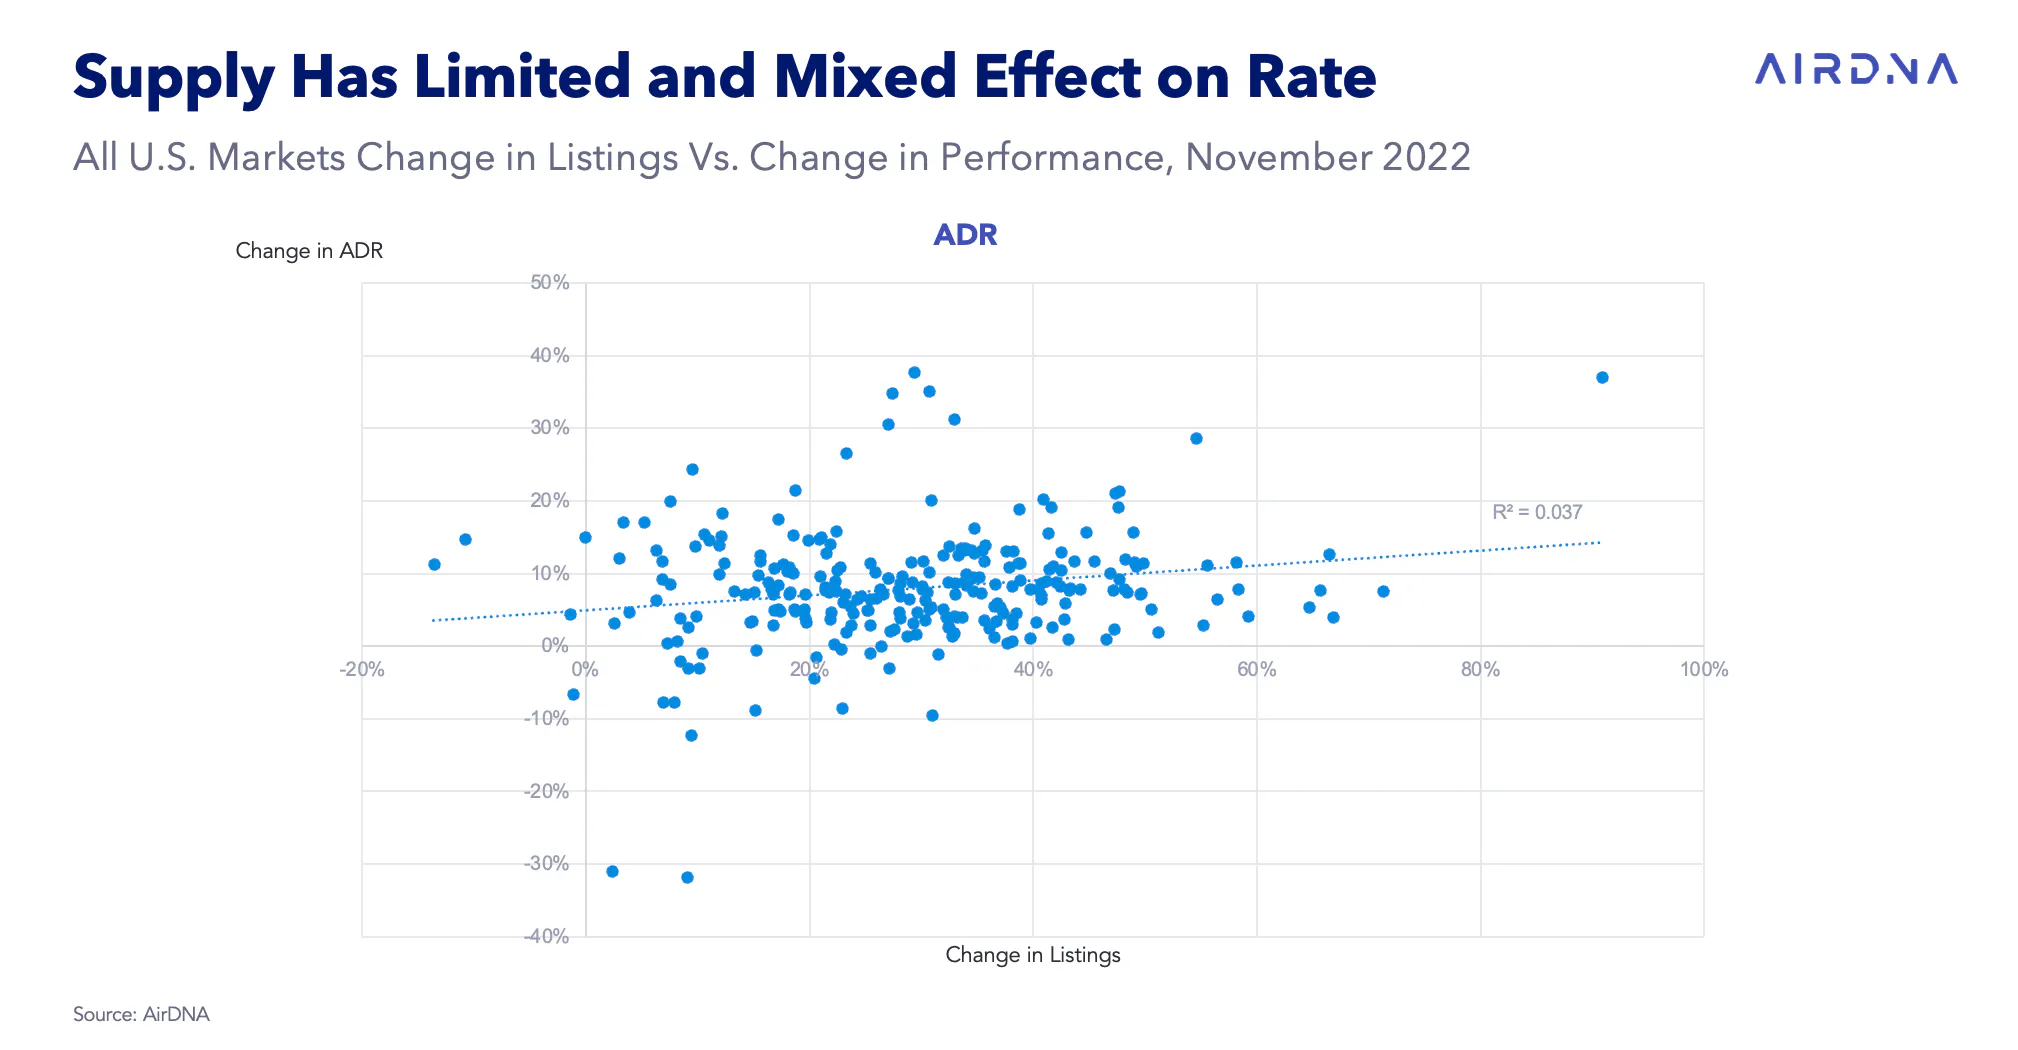
Logically, lower occupancies should also lower STR market power, and we might expect to see lower ADRs with higher supply growth as well; however, no real clear relationship emerges from a simple correlation between supply and ADR. The types of properties that make up this new supply must have an outsized effect on the ADR that is charged.

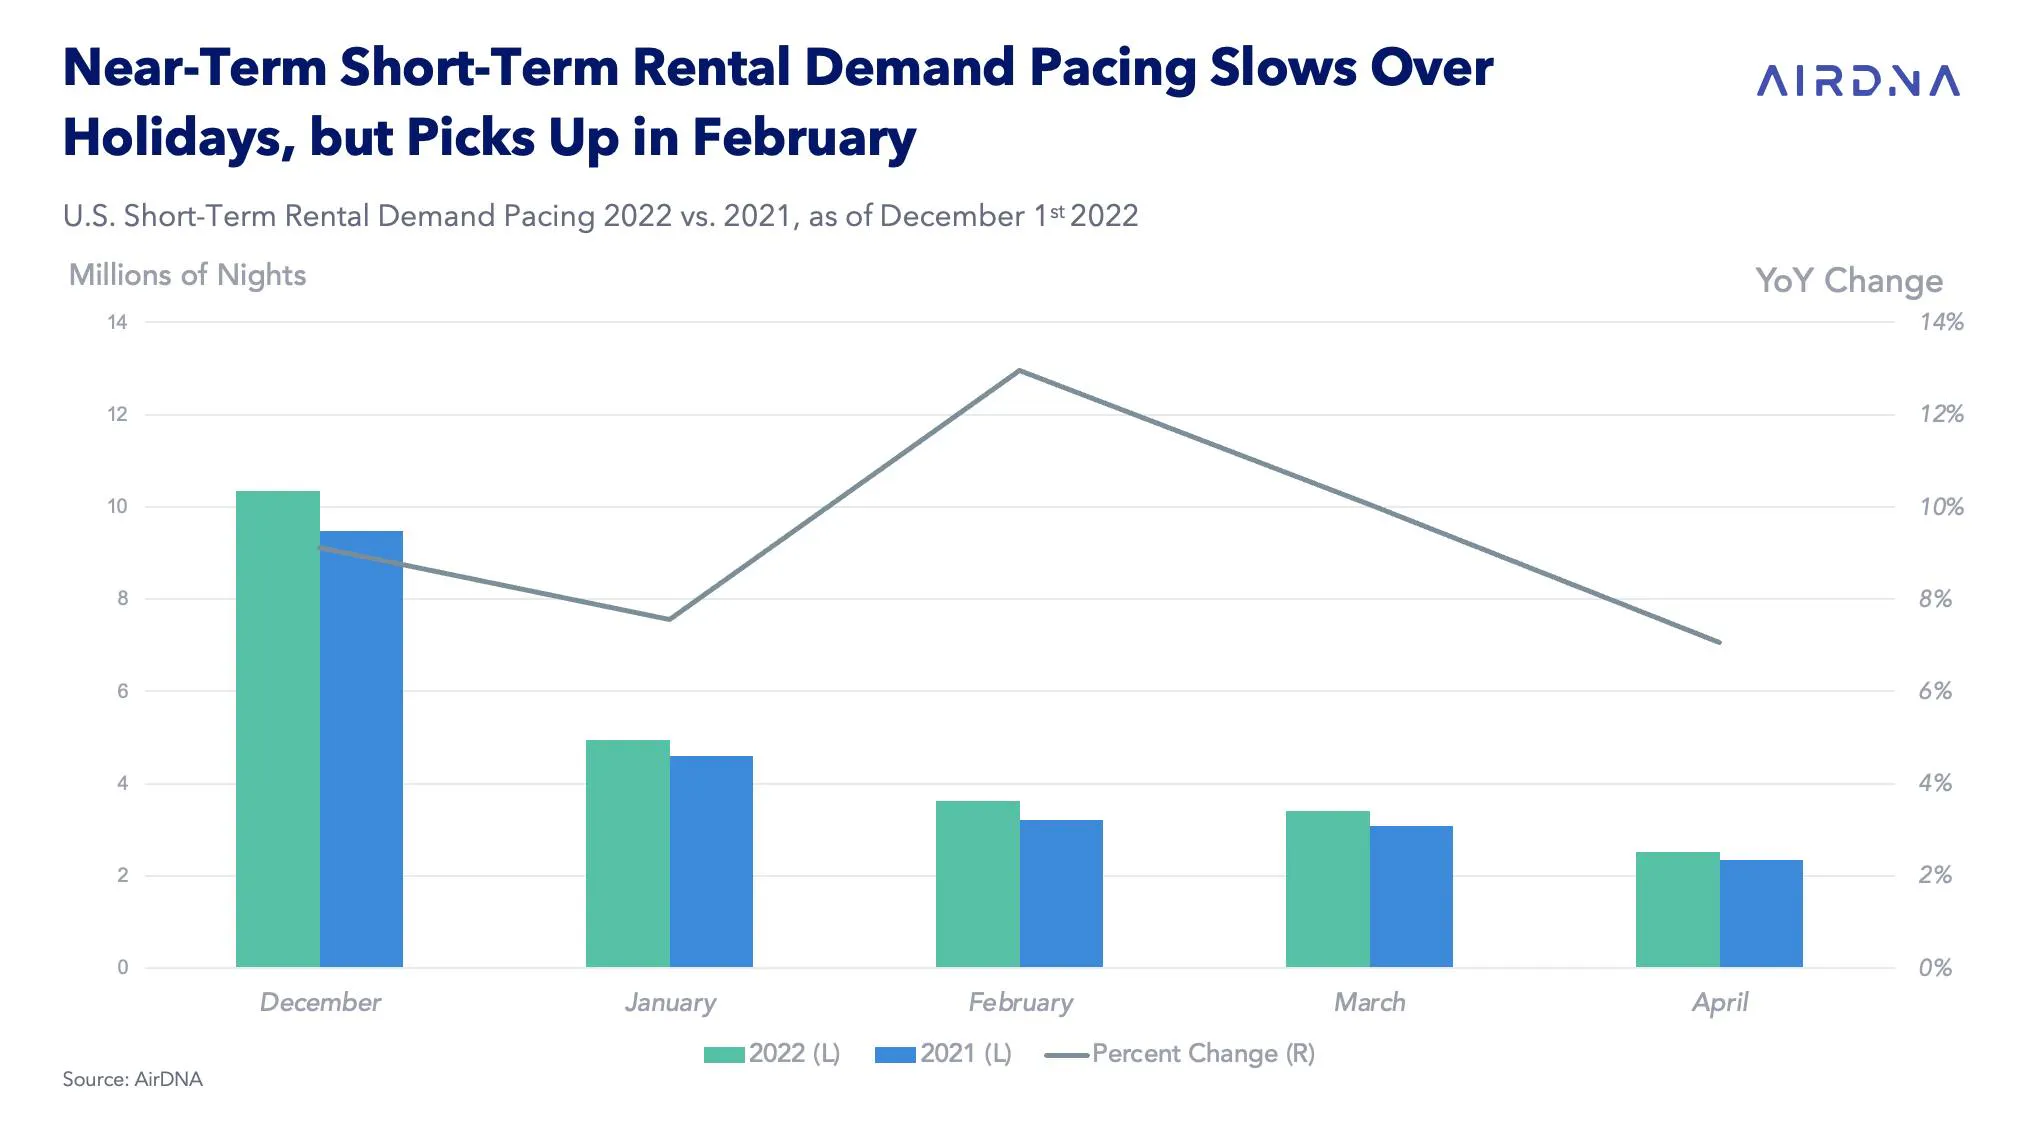
As the year winds down to a close in December, naturally, attention is given to the year ahead, and a dependable way to look into the future is to look at the pace of forward bookings.
While higher than bookings made by the same time last year, the pace of 9.1% growth in bookings for the month of December is markedly lower than the 17% actual demand growth observed in November.
One possible explanation is that more people could be waiting to book travel accommodations due to economic uncertainty. Fears of respiratory illness during an uncommonly fierce flu season may also be delaying holiday travel booking. The year-over-year comparison falls in January as well, to 7.6% higher than in 2022, before picking up in February, already 13% higher year over year.
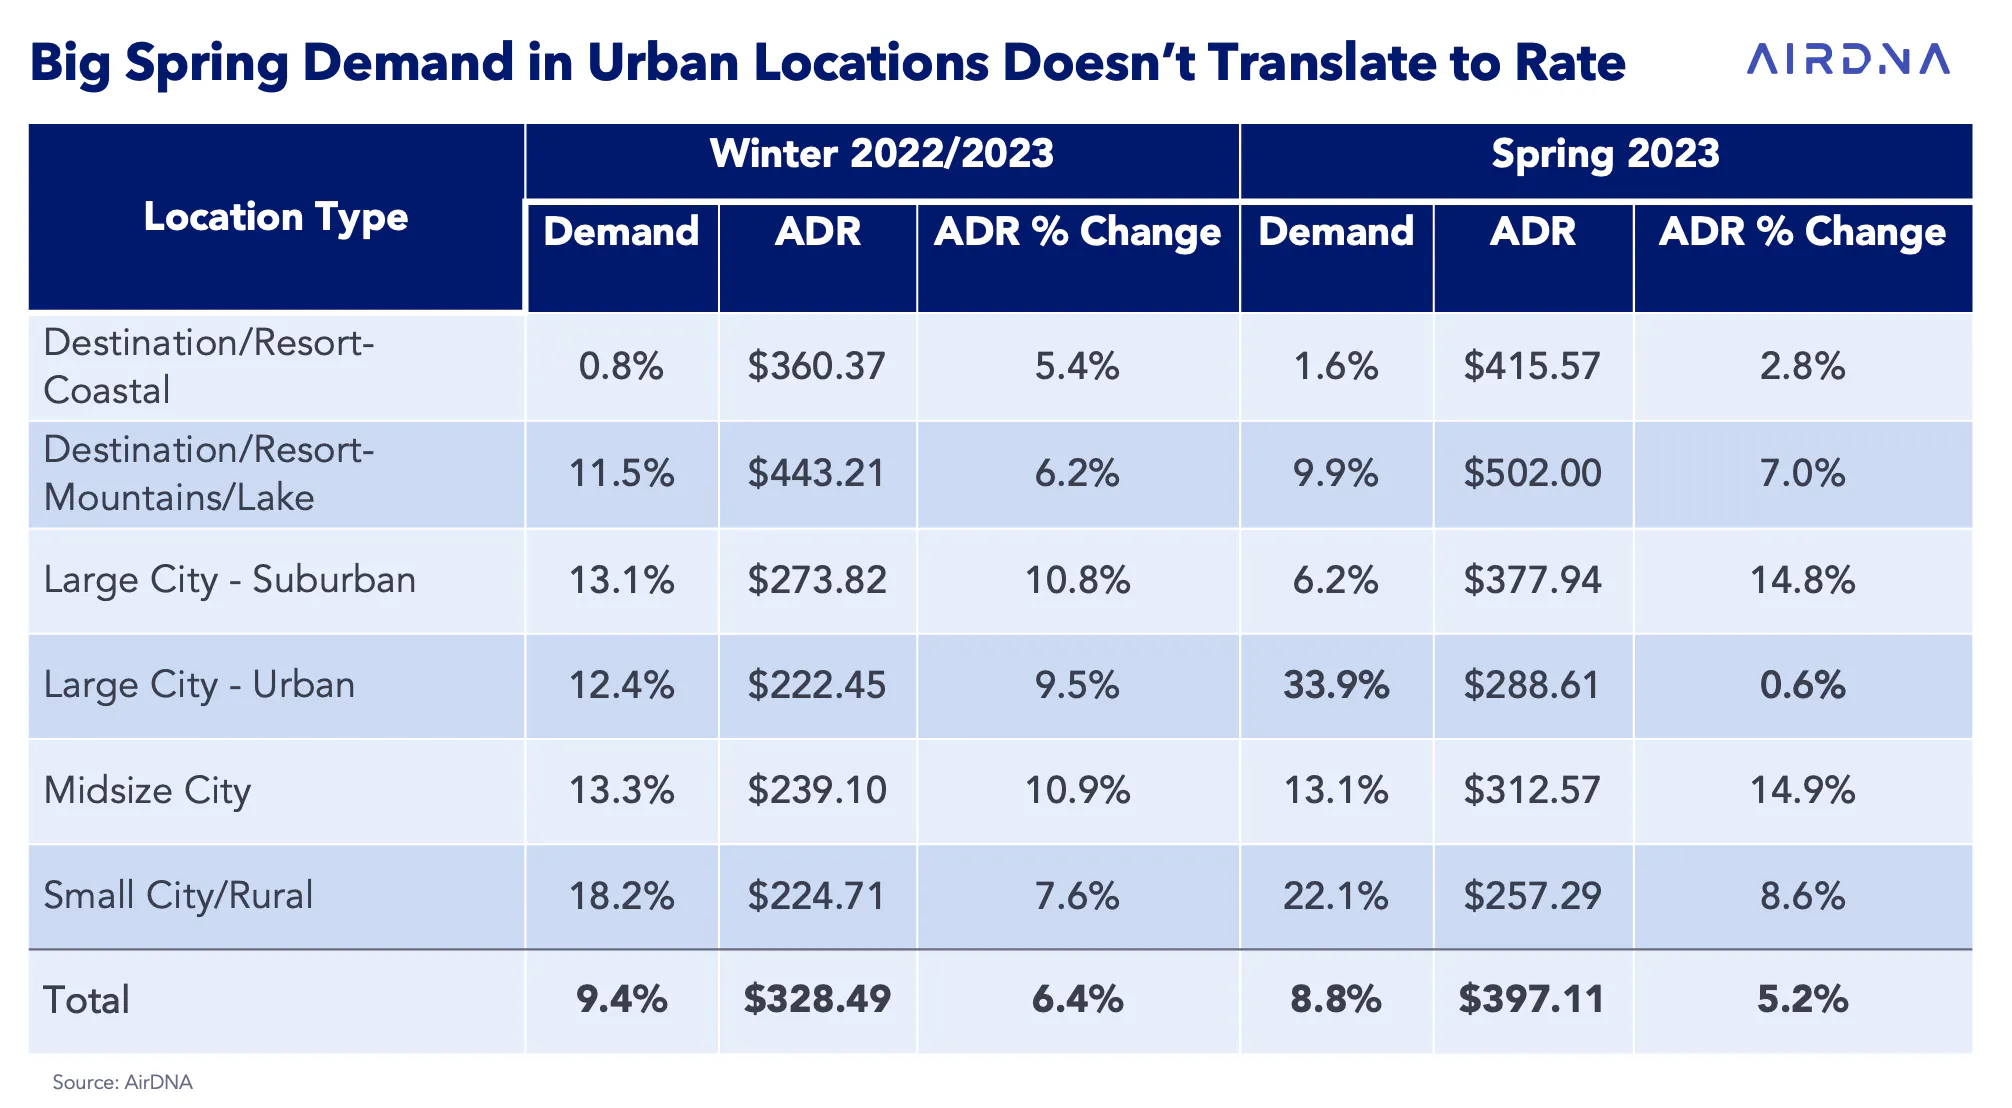
Breaking out the forward booking by location reveals notable differences in the booking pace, shedding some light into the aggregate behavior. Winter (December 2022 – February 2023) booking for coastal resorts, not highly sought after in colder weather, is barely in advance of 2021/2022 totals, while winter bookings for small city/rural locations are up 18.2%, perhaps from people looking to enjoy a small-town Christmas with family and avoid the crowds and potential illness.
Turning to spring bookings, large city/urban locations are far and away the largest gainer, with bookings up more than a third compared to a year ago. Interestingly enough, the ADR for these bookings has barely moved, up only 0.6% compared to 2022 and well below the nearly 15% boost seen in suburban and midsize city locations, signaling that affordability remains a key advantage of STR accommodation in the big city.
Examining the markets shows that there is significant movement in the distribution of booking demand moving into the spring of 2023.
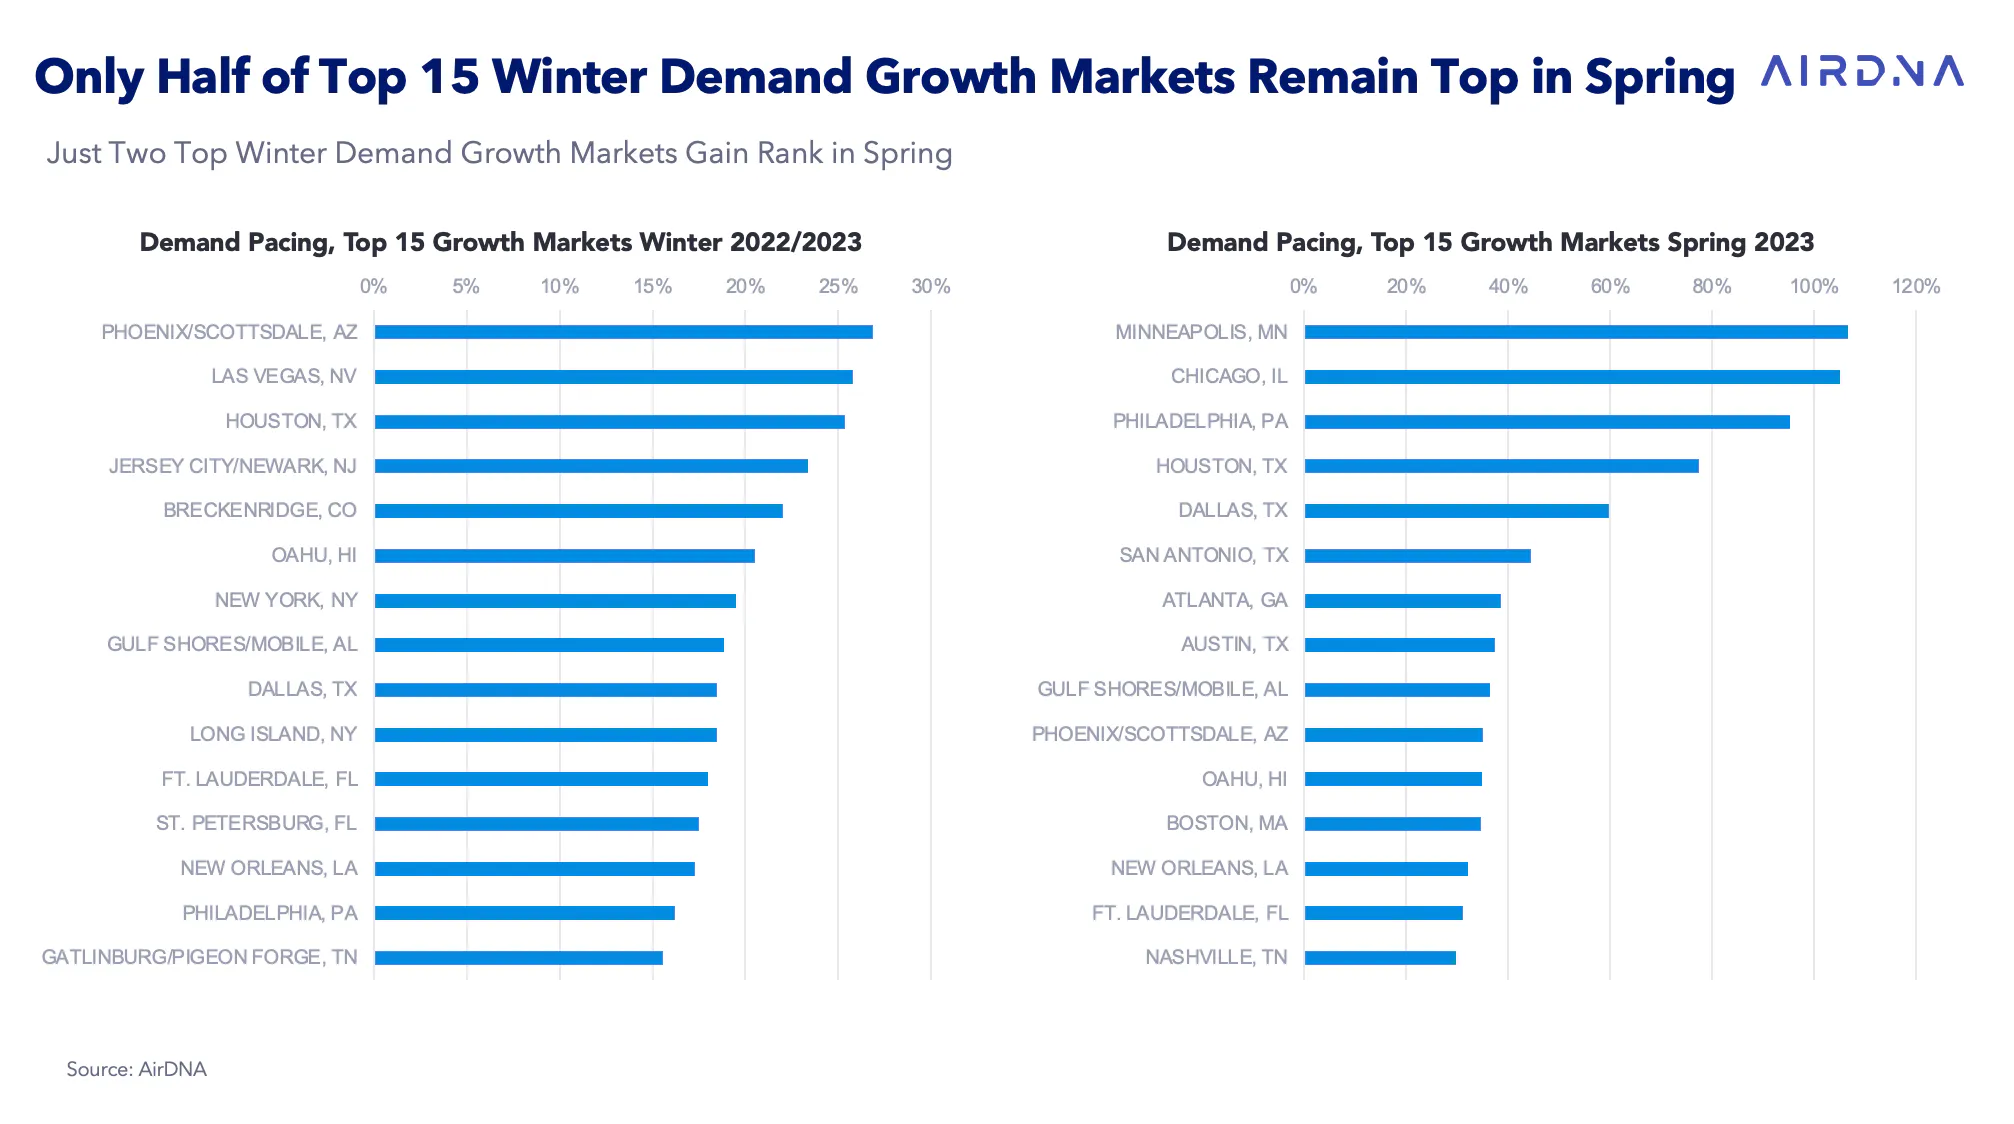
While many of the markets that have high forward-booking growth compared to 2022 are the familiar Southwest and Northeast markets from the November demand chart, only eight of the top markets from winter make the top-15 list in spring.
Minneapolis and Chicago, nearer the middle of the demand growth markets in November, more than double their booked demand compared to the previous year in spring 2023 and shoot to the top of the list, with Philadelphia nearly equalling that growth. Value considerations in uncertain economic times may be leading this surge in early bookings in these large cities.
While supply made enormous gains in 2022, high housing prices and interest rates, combined with declining occupancy, will provide some relief to current hosts as the introduction of new listings slows in 2023. Still, in all likelihood, occupancy will continue to lower from the all-time highs seen in 2021. Economic uncertainty will put additional emphasis on value, particularly in large city centers where competition with traditional lodging is pronounced. Nevertheless, demand remains strong, and even in times of economic downturn, it appears that spending priorities favor travel.
2023 Outlook Report
Find out what's in store for the U.S. short-term rental market in 2023 in our latest outlook report
Data before drama
Analyze better and make the right decisions for your STR business with AirDNA.
Benchmarking is table stakes
Worry no more about benchmarking with our latest guide.
ARTICLE SUMMARY
November saw a boost from Thanksgiving travel for the U.S. short-term rental market, with vacation rentals in the country seeing 17% growth in demand from last year, and supply growing 24.6%.
Scott Sage
Senior Vice President, Marketing & Customer Experience
Scott is an Airbnb Superhost and industry pro, having founded Home Base BnBs—a short term rental management company that scaled to 200+ units. Scott combines his experience and passion for hosting to empower AirDNA customers' success. When he's not thinking about STRs, he is hiking, playing basketball, or playing pickleball.


