Croatia Short-Term Rental Market 2026: Fewer Nights, Higher Rates
Published: October 28, 2026

Camilo Schmid Rivas
Key Takeaways
- Croatia sold −13.4% fewer demand nights in the twelve months to September 2026, the steepest decline among Europe’s 20 largest markets, while ADR rose +10.3% to €145.13 and RevPAR +7.2% to €90.45.
- It was the fourth straight year of fewer nights at higher rates: demand nights are a quarter below 2019, available listings a fifth below and ADR two-thirds above.
- Most lost nights came outside July and August and from guests within driving distance, as demand from Germany, Austria and the Netherlands fell −43% to −44% since 2022.
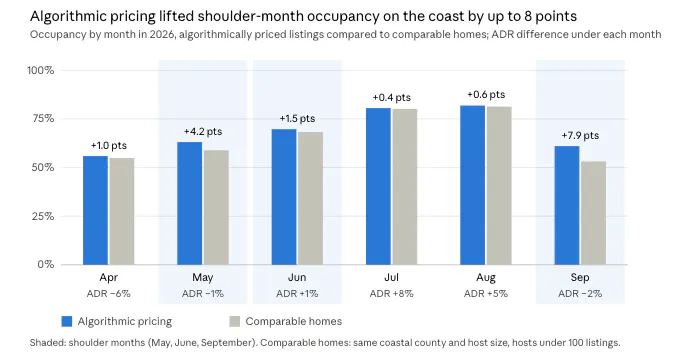
- Only 12.5% of Croatian listings price dynamically, compared to 29% across Europe, yet algorithmically priced coastal listings gained up to 7.9 points of occupancy in the shoulder months.
Croatia’s Short-Term Rental Market at a Glance
AirDNA’s monthly European Review follows the short-term rental market across Europe; this pulse takes a deeper look at one country. Croatia is Europe’s ninth-largest market by demand nights, with 10.9 million in the twelve months to September 2026, between Poland (11.6 million) and the Netherlands (7.3 million). Its demand nights have declined for four consecutive years, but ADR rose in each of them, and the data suggest a repositioning towards fewer, pricier nights from a smaller base of listings rather than a market in retreat.
Croatia’s short-term rental market earned more from fewer nights in the twelve months to September 2026. Demand nights declined −13.4% compared to the previous twelve months, the steepest decline among Europe’s 20 largest markets, ahead of Spain (−10.0%), while ADR rose +10.3% to €145.13 and RevPAR +7.2% to €90.45. Since 2022 Croatia has sold fewer nights from fewer listings at higher rates, and it has made that shift with little dynamic pricing: only 12.5% of Croatian listings were priced actively or algorithmically, compared to 29% across Europe.
| Metric, twelve months to September 2026, Croatia | Value | Compared to the previous twelve months |
|---|---|---|
| Available listings (monthly average) | 131,421 | −3.0% |
| Demand nights | 10.89 million | −13.4% |
| Occupancy | 62.3% | −1.8 pp |
| ADR | €145.13 | +10.3% |
| RevPAR | €90.45 | +7.2% |
| Revenue | €1.58 billion | −4.4% |
Demand Nights Declined −13.4% While Occupancy Held at 62.3%
Four consecutive years of declining demand nights since 2022 have cost Croatia volume rather than appeal. Most of the lost demand nights came in the months either side of the July-August peak and from guests in countries within driving distance, such as Germany, Austria and the Netherlands, while occupancy at the homes that kept selling barely moved: the pattern of a market becoming smaller and more selective rather than one losing its pull.
Demand nights in Croatia declined −13.4% to 10.89 million in the twelve months to September 2026, almost six times the decline across Europe (−2.3%). Occupancy held up far better, declining −1.8 points to 62.3%, because active listing nights declined −10.9% alongside demand. The homes that kept selling were almost as full as a year earlier, so the decline came mostly from fewer homes taking bookings rather than from emptier calendars.
Croatia’s demand nights have declined in every twelve-month period to September since 2023, after growth of +14.4% in the twelve months to September 2022, while ADR rose in each of those years. It is now the only one of twelve Mediterranean and Balkan markets below the twelve months to September 2019 on both demand nights and available listings, while Europe stood +51% above that level on demand nights.
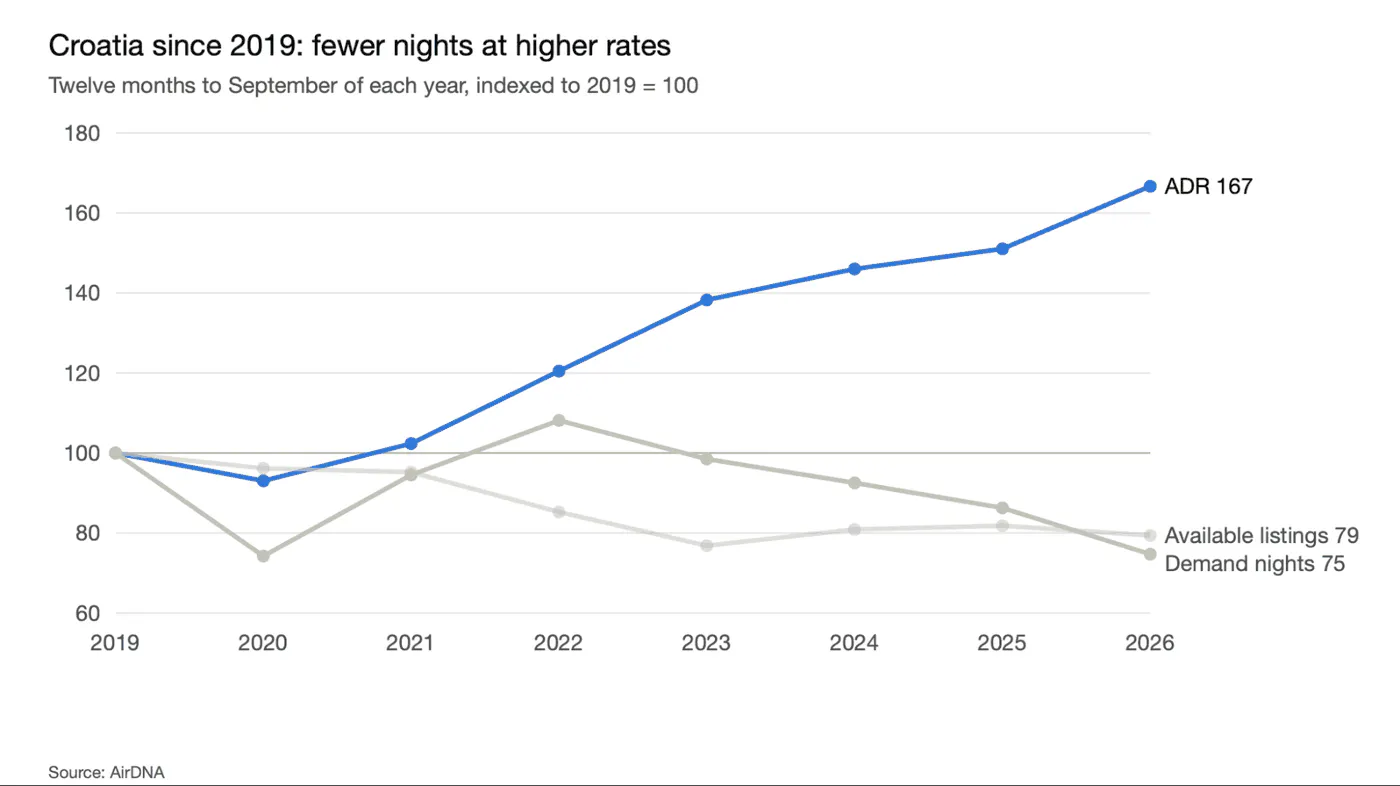
By the twelve months to September 2026, four years after the three lines separated, demand nights were a quarter below 2019, available listings a fifth below and ADR two-thirds above.
Most of the lost nights fell outside July and August
July and August held 51.4% of Croatia’s January-September demand nights in 2026, +3.1 points compared to 2022, so most of the decline came in the other months. Greece (41.0%), Italy (34.8%), Spain (31.0%), Malta (30.2%) and Europe (34.2%) moved the other way over the same period, spreading demand into more months.
Guests within driving distance account for most of the decline
Foreign guests filled 93.4% of Croatia’s demand nights in the twelve months to July 2026, estimated from the home countries of Airbnb reviewers, led by the United States (14.0%), Germany (13.2%), the United Kingdom (10.7%) and France (9.6%). Compared to the twelve months to July 2022, demand nights from Germany, Austria and the Netherlands declined −43% to −44%, while demand nights from Canada grew +36% and from Australia +80%. Most of the guests Croatia lost since 2022 came from within driving distance.
Listings Stayed on the Market but Sold Fewer Nights
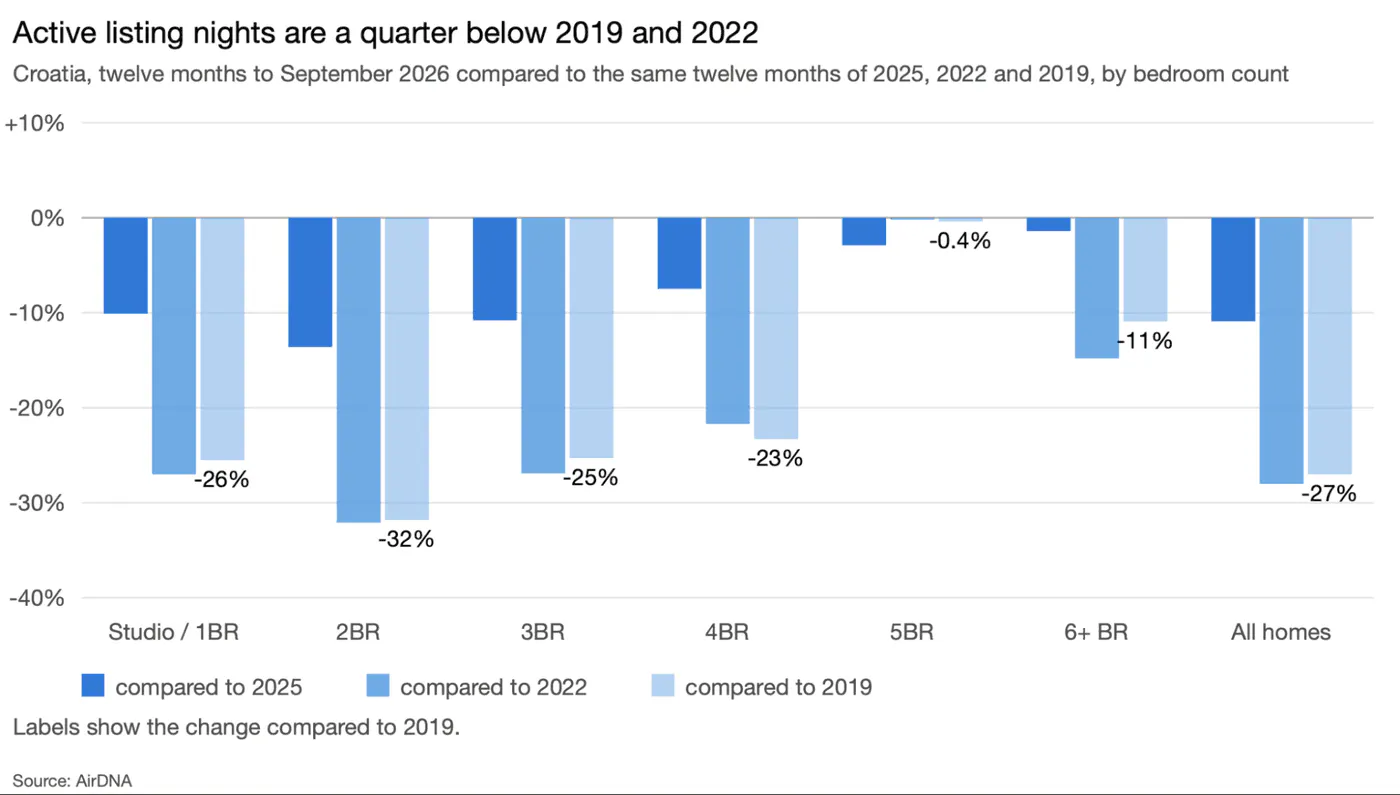
Available listings in Croatia averaged 131,000 a month in the twelve months to September 2026, −3.0% compared to the previous twelve months and −21% compared to the twelve months to September 2019. Europe moved the other way, adding +2.4% in the year to stand +40% above 2019. Every home size declined in Croatia over the twelve months to September 2026, from −2.0% for studios and one-bedroom homes to −4.5% for two-bedroom homes.
Active listing nights are the nights a listing advertised as available or had booked while it was actually renting, meaning it took at least one booking in the previous 28 days, and they are the base on which occupancy is calculated. They declined faster than available listings, −10.9% in the twelve months to September 2026 compared to the previous twelve months and −28% compared to the twelve months to September 2022. Available listings were only −7% fewer than in 2022, so most of the loss came from each listing counting −23% fewer active nights. Homes stayed on the market but went longer between bookings, which points to weaker demand rather than hosts closing their calendars.
Five Coastal Counties Hold 82% of Croatia’s Demand Nights
Five coastal counties held 82% of Croatia’s demand nights in the twelve months to September 2026, led by Split-Dalmatia (23.2%) and Istria (21.8%). Dubrovnik-Neretva earned 12.8% of revenue from 8.8% of available listings.
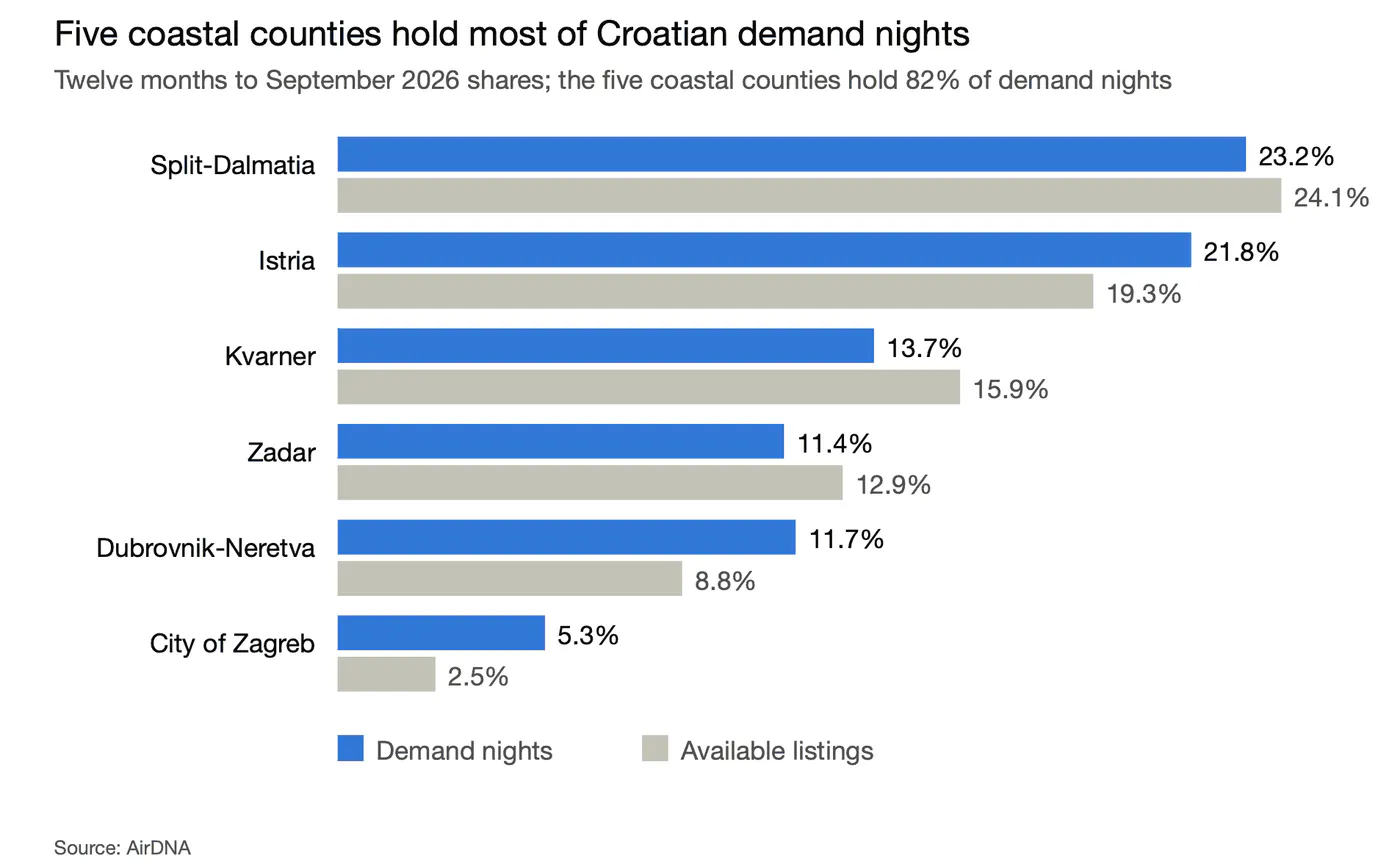
Every large county lost demand nights in the twelve months to September 2026 compared to the previous twelve months, from −6.3% in the City of Zagreb to −15.7% in Istria, and every coastal county lost between −1.2 and −2.3 points of occupancy. The decline was national rather than regional, so county shares barely moved.
| County, twelve months to September 2026 | Demand nights compared to a year earlier | ADR compared to a year earlier | Occupancy |
|---|---|---|---|
| Split-Dalmatia | −13.7% | +13.1% | 64.1% |
| Istria | −15.7% | +9.2% | 62.8% |
| Kvarner | −12.6% | +11.3% | 61.8% |
| Zadar | −14.4% | +7.6% | 63.0% |
| Dubrovnik-Neretva | −11.5% | +12.6% | 67.6% |
| City of Zagreb | −6.3% | +1.7% | 61.3% |
Source: AirDNA
Dubrovnik held volume better than other coastal cities
Dubrovnik was the exception among the coastal cities, with demand nights declining −7.3%, about half the national decline, compared to −10.3% in Zadar, −12.0% in Split and −16.7% in Pula, while its share of city demand nights rose to 9.0% from 6.7% in the twelve months to September 2023. Only Zagreb, a year-round city market, lost fewer demand nights (−6.2%). Dubrovnik also had the highest occupancy of the five largest cities, 71.1% compared to 61.7% to 65.9% in the other four, at an ADR of €167, +15% above the Croatian average. In Dubrovnik the repositioning held volume as well as rate better than other markets in Croatia.
ADR Rose +10.3% as Croatia Repositioned Towards Pricier Nights
ADR in Croatia rose +10.3% to €145.13 in the twelve months to September 2026 compared to the previous twelve months, ahead of Europe (+5.5%) and of every other euro-area market among Europe’s 20 largest, including Spain (+10.0%) and Greece (+9.9%). RevPAR rose +7.2% to €90.45 even as occupancy declined −1.8 points, so higher rates more than made up for lower occupancy.
Same-home rates rose less than ADR
Much of that ADR growth reflected what sold rather than hosts charging more. AirDNA’s Repeat Rent Index (RRI), which tracks the rates of the same homes and so removes the effect of a changing mix, rose +4.3% in the twelve months to September 2026, leaving a 6.1-point gap to ADR, compared to 2.4 points across Europe. Since January-September 2021 the gap is wider still, with Croatian ADR up +65% and the RRI +22%, compared to +40% and +25% across Europe. The euro changeover in January 2023 left no lasting step, as same-home rates rose +9.8% in the twelve months to September 2023 and declined −2.9% in the following twelve months.
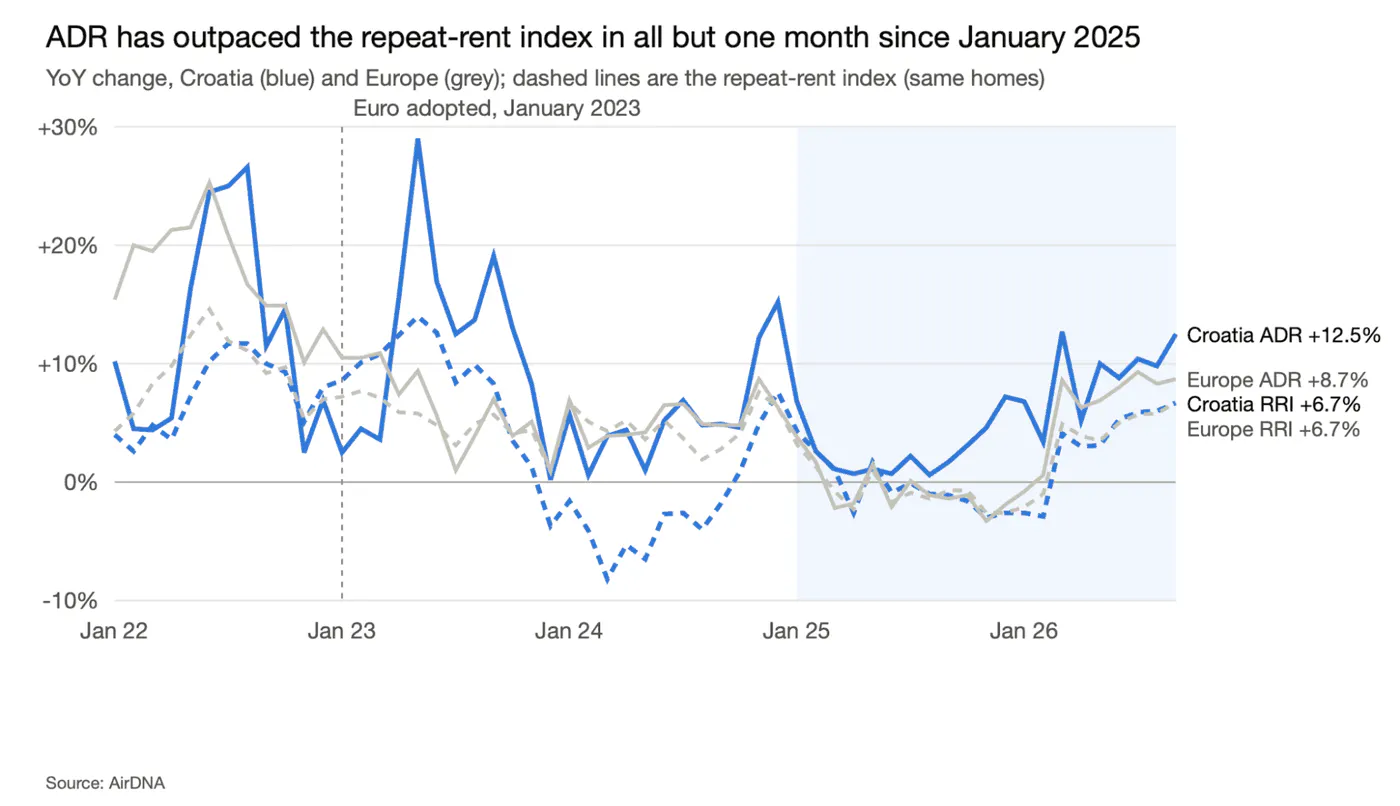
Croatia’s ADR (solid blue) ran above its RRI (dashed) in every month since January 2025 except May 2025, and the gap widened through 2026, while Europe’s two lines stayed close together.
The gap reflects cheaper homes and off-peak nights dropping out of the mix. Budget listings lost −2.4 points of occupancy in the twelve months to September 2026 compared to −0.6 points for luxury listings, and every coastal county raised ADR while losing occupancy, from +7.6% ADR in Zadar to +13.1% in Split-Dalmatia.
The repositioning has not come at the cost of guest satisfaction, as guests rated Croatian stays 4.88 out of 5 in January-September 2026, higher than Greece (4.85), Italy (4.81), Portugal (4.76) and Spain (4.73). Croatia has become a smaller, pricier, but still well-rated market, and the guests it lost are those who no longer come rather than those who came and were disappointed.
Only 12.5% of Croatian Listings Use Dynamic Pricing
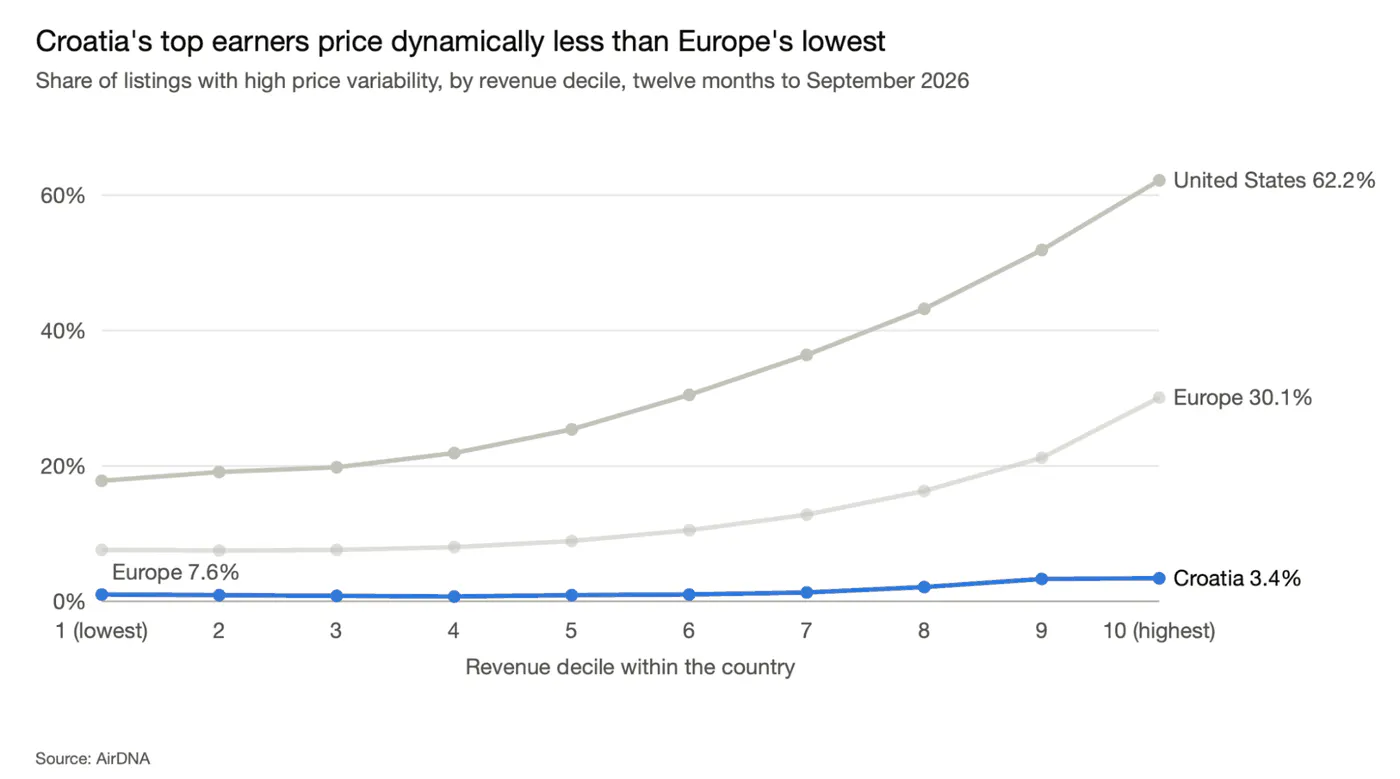
Croatia made this shift with little dynamic pricing, as only 12.5% of its listings were priced actively or algorithmically in January-September 2026, the lowest share among Europe’s 20 largest markets. Greece (25.0%), Italy (34.0%), Spain (34.7%) and the United States (36.8%) priced dynamically at two to three times Croatia’s rate, and Europe averaged 29%.
Ranking listings by revenue in the twelve months to September 2026, the share with high price variability rose steeply with earnings in the United States and across Europe but stayed flat in Croatia. Croatia’s top-earning tenth (3.4%) priced dynamically less often than Europe’s lowest-earning tenth (7.6%), so in Croatia success has not brought the habit with it.
Algorithmic pricing earned more by keeping calendars open
Algorithmically priced listings in Croatia earned €80.4 per available night in January-September 2026 compared to €52.2 for statically priced ones, +54%, mostly through higher ADR (€124 compared to €89). Part of that gap is location and home size, but compared to similar homes in the same county, of the same size and host type, algorithmic listings still earned +5.6% higher RevPAR and +41% more revenue per listing, because they stayed open and kept selling nights.
On the Croatian coast the advantage showed in the shoulder months (May, June and September) as well as the peak, with algorithmically priced listings reaching 63% occupancy in May 2026 compared to 59% for comparable homes, and 61% compared to 53% in September, at ADR within −2% to +2% of those homes. For hosts, the implication is that the shoulder is where Croatia has most to gain. With half of its January-September demand nights sold in July and August, filling May, June and September is the clearest route back to growth.
FAQs
Is Croatia’s short-term rental market growing or shrinking?
It is shrinking in volume but growing in value per night. Demand nights declined −13.4% to 10.89 million in the twelve months to September 2026, the fourth annual decline in a row, while ADR rose +10.3% to €145.13 and RevPAR +7.2% to €90.45. Revenue declined −4.4% to €1.58 billion.
What is the average daily rate for a vacation rental in Croatia?
ADR in Croatia was €145.13 in the twelve months to September 2026, +10.3% compared to the previous twelve months and about two-thirds above 2019. Dubrovnik averaged €167, +15% above the national figure.
Which part of Croatia has the most short-term rental demand?
Five coastal counties held 82% of Croatia’s demand nights in the twelve months to September 2026, led by Split-Dalmatia (23.2%) and Istria (21.8%). Dubrovnik-Neretva had the highest county occupancy at 67.6%.
Why did ADR in Croatia rise while demand fell?
Mostly because of what sold rather than hosts charging more. Same-home rates, measured by AirDNA’s Repeat Rent Index, rose +4.3%, while ADR rose +10.3%, as cheaper homes and off-peak nights dropped out of the mix.
Does dynamic pricing work for vacation rentals in Croatia?
Only 12.5% of Croatian listings price dynamically, compared to 29% across Europe. Compared to similar homes in the same county, algorithmically priced listings earned +5.6% higher RevPAR and +41% more revenue per listing, and on the coast they reached 61% occupancy in September 2026 compared to 53% for comparable homes.
ARTICLE SUMMARY
AirDNA data on Croatia’s short-term rental market in the twelve months to September 2026: demand nights declined −13.4%, the steepest drop among Europe’s 20 largest markets, while ADR rose +10.3% to €145.13, as the market repositioned towards fewer, pricier nights with little dynamic pricing.
Camilo Schmid Rivas
Senior Research Analyst
Camilo Schmid Rivas is a Senior Research Analyst at AirDNA who brings a uniquely well-rounded perspective to short-term rental analytics. With a background that spans investment, real estate, and business analysis—including roles at Stayery and Sollers Consulting—Camilo has worn many analyst hats, each sharpening his ability to turn complex data into clear, actionable insights. A graduate of École hôtelière de Lausanne, he now channels his multidisciplinary expertise into uncovering trends that drive smarter STR decisions. In his free time, he enjoys playing tennis or scuba diving in or around Barcelona.