Calculate Revenue
 Research Markets
 Find For Sale Properties
 Compare My Listing
 STR Revenue Calculator
 Custom Comp Sets
 Submarket Insights
 Custom Search Filters
 Rate Recommendations
 Performance Benchmarking
 Competitor Comparison
 Owner Contact Details
 Property-level performance data
 Tourism Insights
 Real Estate Investment Analytics
 About Us
 Sales
 Support
 Press
How Static Pricing Leaves More Gap Nights on the Calendar
Published: October 16, 2026

Linda Rollins
Static-priced short-term rental hosts book about two fewer nights a month than hosts using algorithmic pricing, a gap worth more than $6,000 a year in lost revenue. Despite that gap, about 42% of U.S. short-term rentals still run static pricing, or static pricing with only an occasional manual tweak.
In this article, we break down the five ways U.S. hosts set prices, from static rates to fully algorithmic dynamic pricing with a revenue management system (RMS), and how common each approach is by location type and market. We also look at how hosts with more sophisticated pricing fill more gaps in their calendar. They’re more likely to discount unsold nights and adjust their minimum stay requirements, often combining both into gap night rules that are easy to set up in an RMS such as Adapt.
Key Takeaways
- Static-priced properties average 13.1 gap nights a month, compared with 11.0 for algorithmically priced properties.
- About 42% of U.S. short-term rentals use static or manual pricing, while just 19% use algorithmic pricing.
- In all 37 large U.S. markets analyzed, properties with actively managed or algorithmic pricing have fewer unbooked nights than static-priced ones.
- Algorithmically priced properties discount unsold nights by 12.7% on average, compared with 1.2% for static-priced properties.
- About 81% of static-priced properties keep one minimum stay nearly all year, compared with fewer than four in 10 algorithmically priced properties.
How Hosts Set Prices: 42% Still Use Static or Manual Rates
Sophisticated pricing tools are still uncommon among short-term rental operators. Broadly, we see five approaches to pricing:
- Static pricing: properties that keep the same price all year.
- Manual pricing: hosts that generally hold the same price but occasionally make manual adjustments.
- Rule-based pricing: hosts that use set rules to vary their price and calendar settings based on day of week, season, or days from check-in.
- Actively managed pricing: hosts that use rules to vary pricing but also actively monitor booking performance in the market and make adjustments.
- Algorithmic pricing: hosts that use an RMS such as Adapt, where pricing is fully algorithmic and rates for every calendar date are recalculated daily in response to booking trends in the market.
Only about 19% of U.S. properties use an algorithmic pricing tool, and another 19% actively manage their pricing. A remarkable 42% are running static pricing, or static pricing with the occasional manual tweak.
Pricing sophistication in the U.S. varies by market. Algorithmic and actively managed pricing is most common in mountain and lake destinations, coastal destinations, and major cities. Roughly 40-45% of properties in these location types actively manage their pricing or use an RMS, likely reflecting a heavier presence of professional operators, who tend to use more sophisticated pricing tools. Small city and rural markets sit at the other end. They have the smallest share of properties actively managing price, and nearly 60% run static or manual pricing.
| Location Type | Actively Managed + Algorithmic | Static + Manual | Static | Manual | Rule-Based | Actively Managed | Algorithmic |
|---|---|---|---|---|---|---|---|
| Mountain/lake resort | 45.1% | 34.7% | 6.5% | 28.2% | 20.2% | 23.1% | 22.1% |
| Urban | 43.0% | 36.3% | 6.6% | 29.7% | 20.7% | 19.6% | 23.4% |
| Coastal resort | 39.0% | 39.3% | 7.3% | 32.0% | 21.7% | 19.7% | 19.3% |
| Suburban | 38.1% | 41.5% | 6.9% | 34.6% | 20.4% | 18.5% | 19.6% |
| Mid-size city | 35.8% | 44.2% | 8.0% | 36.1% | 20.0% | 18.5% | 17.4% |
| Small city/rural | 24.8% | 57.2% | 12.3% | 44.9% | 18.0% | 14.7% | 10.1% |
| All U.S. | 37.7% | 42.1% | 7.9% | 34.1% | 20.3% | 19.1% | 18.5% |
Sophisticated Pricing Books More Nights in Every Major U.S. Market
Among the largest U.S. markets, the share of full-time properties using algorithmic or actively managed pricing ranges from 25% in San Francisco, California, to 70% in Gatlinburg, Tennessee. But regardless of where a market falls in that range, properties that actively change their pricing consistently book more nights than static-priced ones.
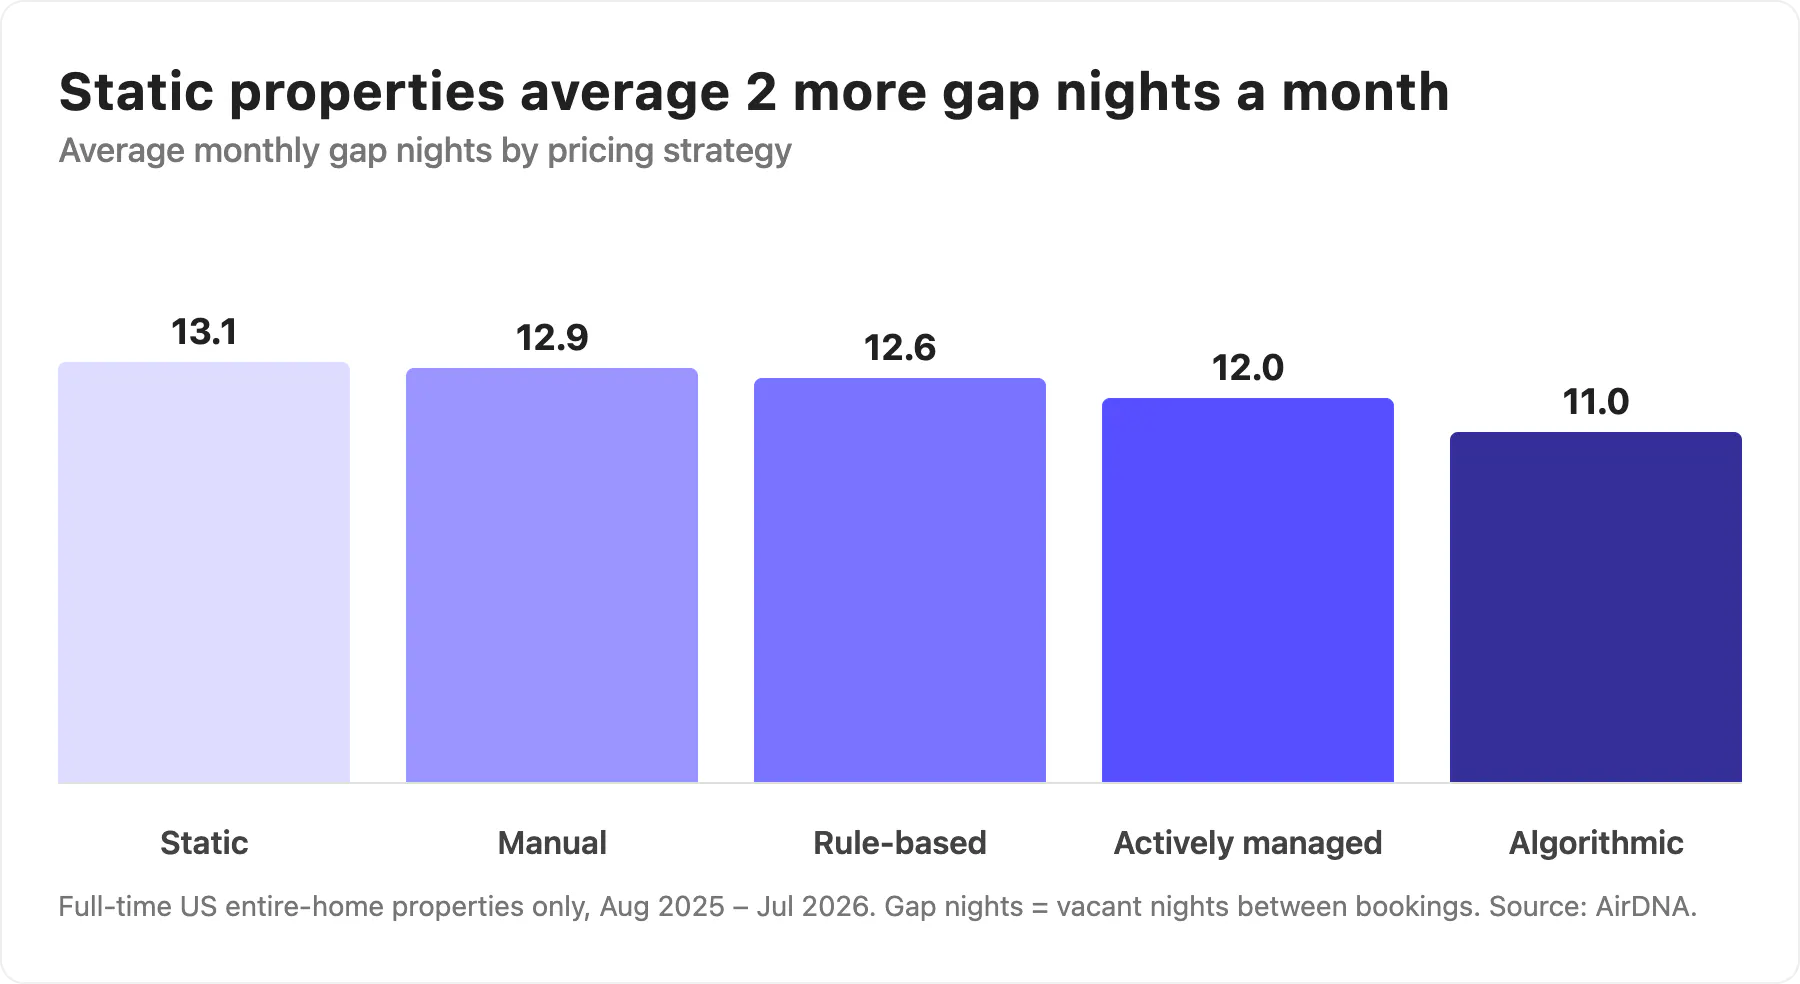
The table below shows the monthly average number of unbooked nights for full-time static-priced hosts compared with full-time hosts using algorithmic or actively managed pricing. A few things stand out:
- In every market we analyzed, properties that actively manage or algorithmically price have fewer unbooked nights than static-priced properties. In San Antonio, Texas; Orlando, Florida; and Austin, Texas, operators with more sophisticated pricing book more than four additional nights a month compared with hosts who don’t vary their price.
- That gap tends to be widest in markets where sophisticated pricing is already common. San Antonio, Orlando, and Austin, where static hosts give up several nights a month to more sophisticated competitors, are also markets where more than 40% of properties use actively managed or algorithmic pricing. The pattern makes intuitive sense. The more of a market’s supply is repricing itself in real time, the more effectively it captures demand at the expense of hosts holding a static rate. Where sophisticated pricing is rarer, static-priced hosts face less competition for that demand and see a smaller deficit. It’s not an ironclad rule, since a handful of high-sophistication markets show only a small gap, but the relationship holds for many markets.
- Markets with higher occupancy rates tend to show a smaller gap between static and algorithmic pricing. In tight markets such as San Francisco and Oahu, Hawaii, where average annual occupancy runs above 70%, demand for limited supply is strong enough that nights are more likely to fill regardless of how they’re priced, so pricing sophistication has less room to matter.
| Market | Extra Unbooked Nights a Month (Static) | Share With Actively Managed or Algorithmic Pricing | Avg Monthly Unbooked Nights (Static) | Avg Monthly Unbooked Nights (Actively Managed or Algorithmic) |
|---|---|---|---|---|
| San Antonio | 4.4 | 43.3% | 15.3 | 10.9 |
| Orlando | 4.1 | 51.8% | 12.8 | 8.7 |
| Austin | 4.1 | 46.3% | 15.5 | 11.4 |
| Las Vegas | 3.8 | 33.3% | 14.2 | 10.4 |
| San Diego | 3.5 | 45.8% | 12.4 | 8.9 |
| Big Bear | 3.3 | 48.8% | 19.0 | 15.8 |
| Gatlinburg/Pigeon Forge | 3.1 | 69.9% | 14.0 | 10.8 |
| Ft. Lauderdale | 2.8 | 53.2% | 11.8 | 9.0 |
| Dallas | 2.8 | 44.0% | 13.7 | 10.9 |
| Coachella Valley | 2.4 | 40.8% | 17.1 | 14.7 |
| Nashville | 2.1 | 59.9% | 13.9 | 11.8 |
| Anaheim | 1.9 | 30.4% | 9.9 | 8.0 |
| Philadelphia | 1.9 | 40.8% | 12.2 | 10.4 |
| Jersey City/Newark | 1.8 | 35.1% | 10.9 | 9.2 |
| Hilton Head | 1.8 | 45.3% | 13.3 | 11.6 |
| Phoenix/Scottsdale | 1.7 | 48.7% | 11.4 | 9.7 |
| Chicago | 1.6 | 45.8% | 11.1 | 9.5 |
| Sarasota | 1.5 | 31.2% | 11.7 | 10.1 |
| Lower Hudson Valley | 1.5 | 30.7% | 15.0 | 13.5 |
| Big Island | 1.4 | 34.4% | 10.0 | 8.5 |
| Miami | 1.4 | 48.0% | 10.2 | 8.8 |
| Lake Tahoe | 1.4 | 44.5% | 15.7 | 14.4 |
| Gulf Shores/Mobile | 1.3 | 54.1% | 12.2 | 10.9 |
| Atlanta | 1.1 | 29.3% | 13.4 | 12.2 |
| Myrtle Beach | 1.0 | 45.2% | 13.2 | 12.2 |
| St. Petersburg | 0.9 | 42.2% | 10.9 | 10.0 |
| Maui | 0.9 | 46.0% | 9.4 | 8.4 |
| Panama City | 0.8 | 55.5% | 12.0 | 11.2 |
| Los Angeles | 0.8 | 26.1% | 9.2 | 8.4 |
| Portland, OR | 0.8 | 35.2% | 9.6 | 8.8 |
| Seattle | 0.6 | 40.7% | 10.0 | 9.4 |
| Lakeland/Winter Haven | 0.6 | 41.2% | 10.2 | 9.7 |
| San Francisco | 0.5 | 25.6% | 8.0 | 7.5 |
| San Jose/Palo Alto | 0.5 | 25.7% | 8.1 | 7.6 |
| Denver | 0.5 | 40.2% | 9.5 | 9.0 |
| Washington DC | 0.3 | 35.8% | 10.0 | 9.7 |
| Oahu | 0.2 | 37.6% | 5.9 | 5.7 |
So what’s the secret? Why do properties with more sophisticated pricing fill more nights? In many cases, it’s a combination of pricing strategies working together rather than a single strategy. Actively managed and algorithmic properties pull multiple levers at once, such as adjusting minimum stays, applying length-of-stay discounts, offering last-minute discounts, and adjusting rates based on occupancy pacing.
Each of those levers plays a part, but this article focuses on how operators with more sophisticated pricing fill gap nights, which plays a significant role in their ability to book more nights.
What Is a Gap Night? Sophisticated Pricing Leaves Fewer and Shorter Ones
A gap night is an unbooked night, or stretch of nights, that sits between two existing reservations.
Say you have a Tuesday, Wednesday, and Thursday sitting open between a Tuesday checkout and a Friday check-in. That’s a three-night gap. An open Friday wedged between a Friday checkout and a Saturday check-in is a single-night gap, often called an orphan night. Gap nights vary in length, and depending on the days they fall on, they can be difficult to fill.
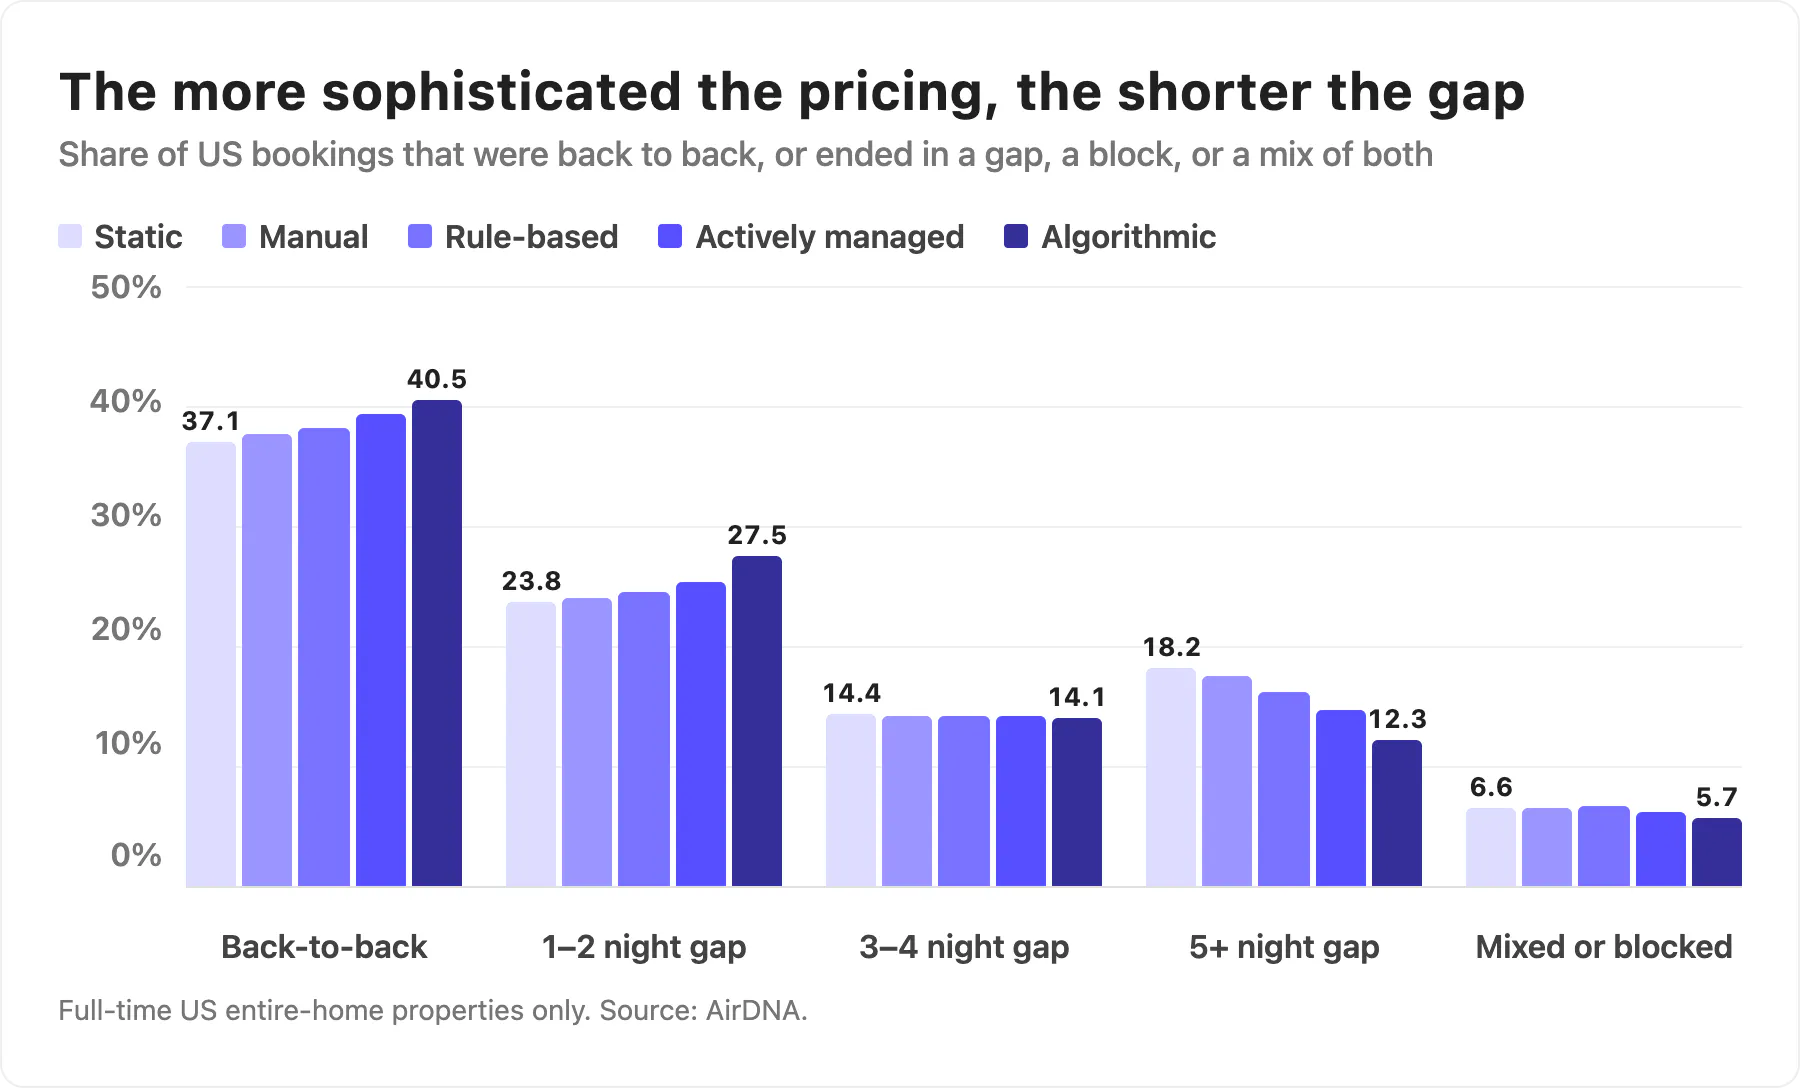
Actively managed and algorithmically priced properties are more successful at closing gaps in their calendar, which is a large part of why they book more nights overall than static-priced properties. Back-to-back bookings make up 41% of bookings among algorithmically priced properties, compared with 37% among static-priced properties. Manual, rule-based, and actively managed pricing fall in between. The more sophisticated the pricing strategy, the higher the share of back-to-back bookings.
When they do have a gap, actively managed and algorithmically priced properties also tend to have smaller ones: a slightly bigger share of one- to two-night gaps, and a much smaller share of long ones. Only about 12% of algorithmically priced bookings and about 15% of actively managed bookings end in a gap of five nights or more, compared with 18% for static-priced bookings. That suggests sophisticated pricing is more effective at turning a big gap into a small one.
How Do Hosts Close Gap Nights? Discount Unsold Nights and Flex Minimum Stays
Properties with sophisticated pricing pull two specific levers that make them very effective at closing gaps: discounting unsold nights and loosening their minimum-stay policy.
Lever 1: Discount unsold nights
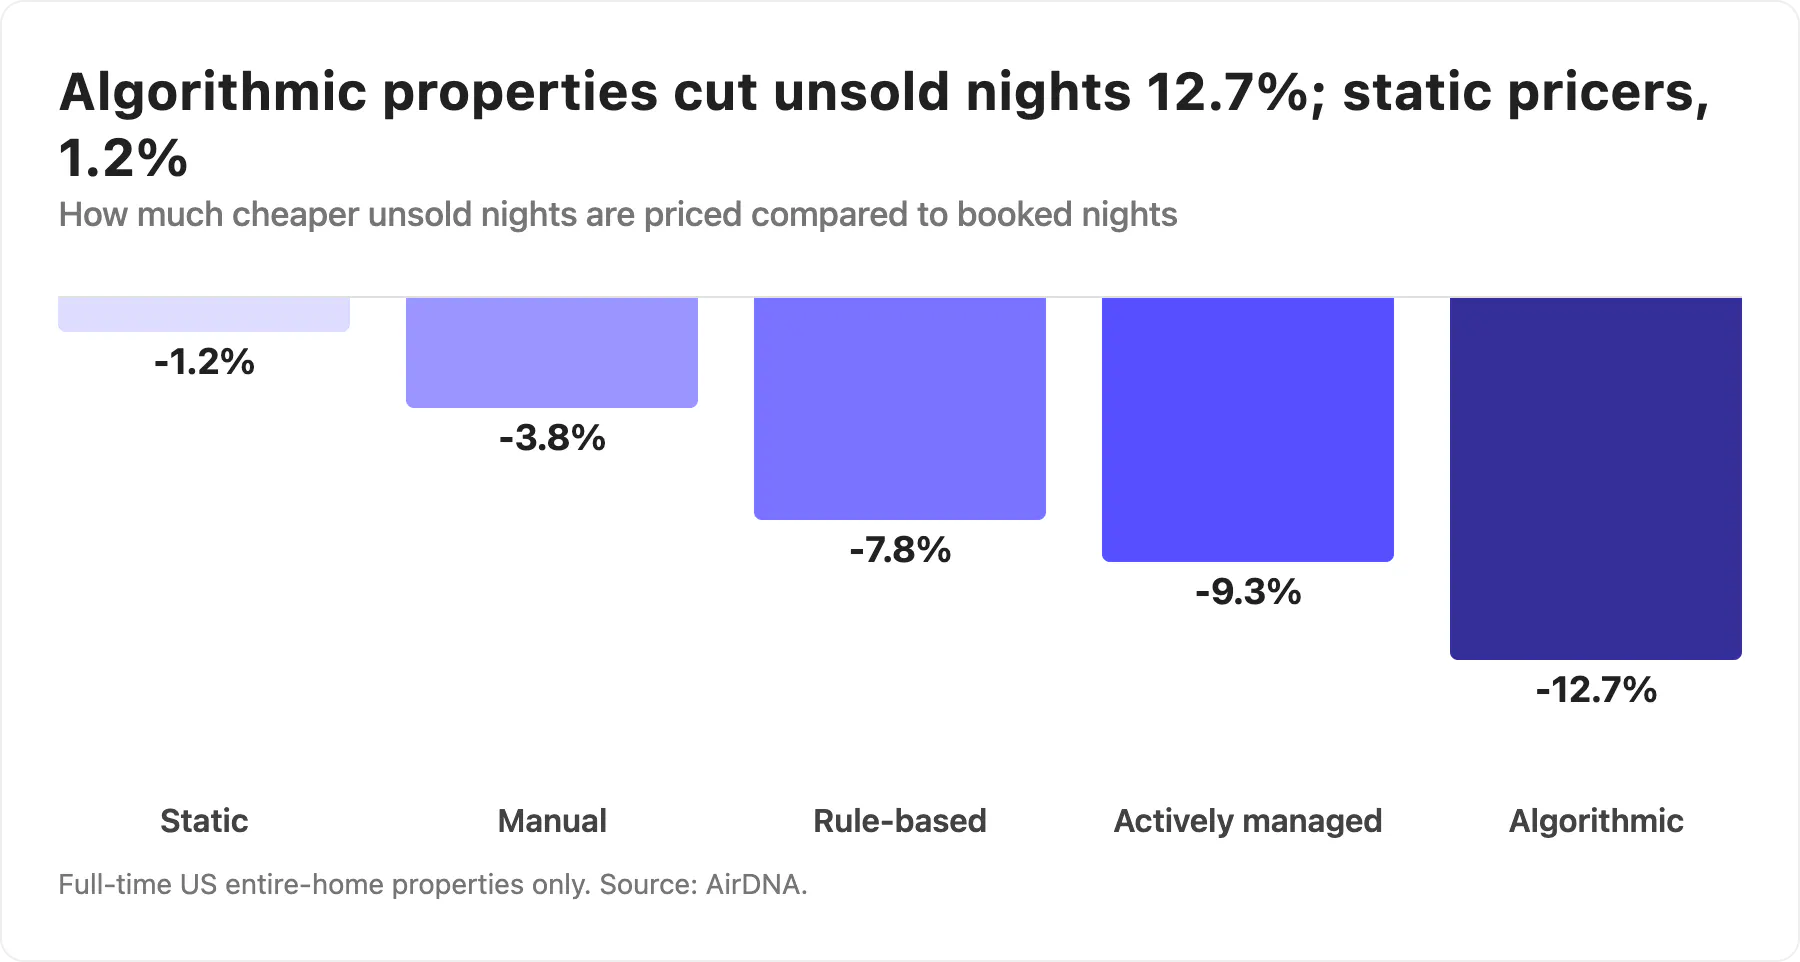
Properties with more sophisticated pricing cut the rate on unbooked nights to try to fill them. Controlling for day of week, we compared the price posted on unsold nights against the price booked for properties with each pricing strategy.
Static-priced properties barely move on this. Their unsold-night rate is only about 1% below their booked rate, essentially the same price whether or not the night is selling.
Algorithmic properties discount unsold nights by about 12.7% on average, and actively managed properties discount by about 9%. Manual and rule-based pricing fall in between, discounting more than static pricing but less than fully algorithmic pricing, a pattern that lines up neatly with how successful each group is at capturing nights.
Lever 2: Loosen the minimum stay around gaps
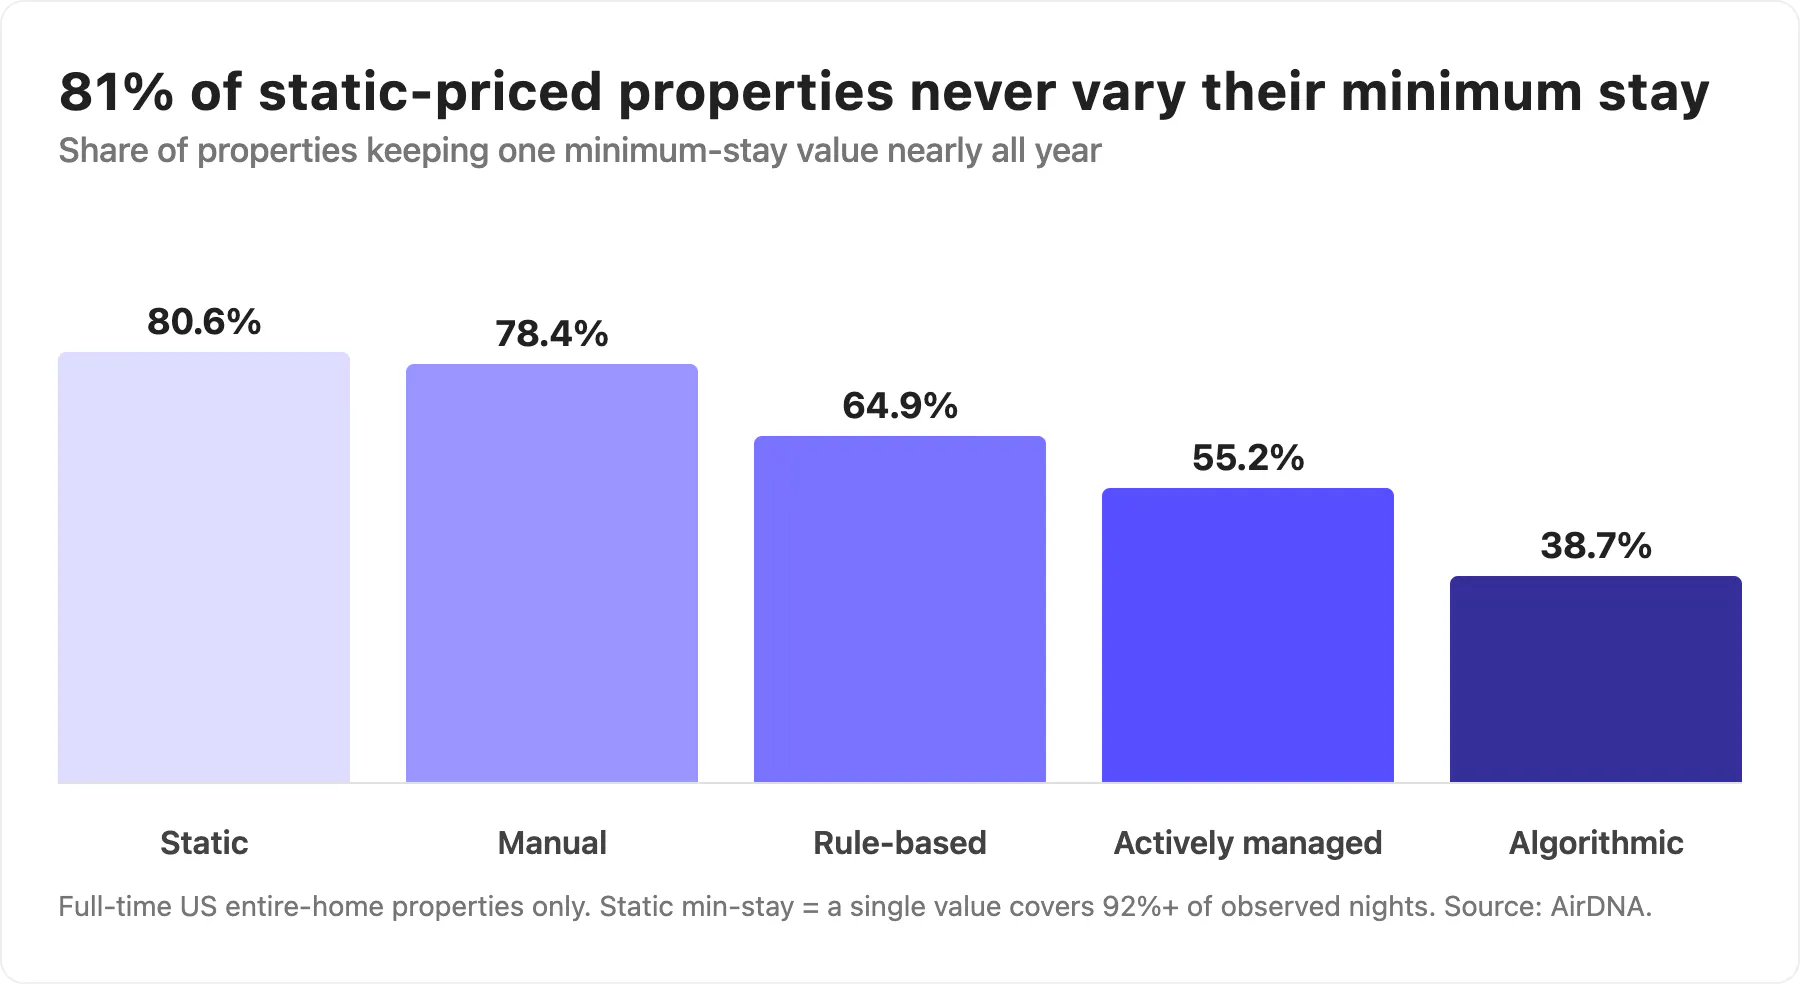
Static-priced properties tend to run static minimum stays too. About 81% of static-priced properties keep one minimum-stay value nearly all year, compared with only about 38% of algorithmic properties. Hosts running more sophisticated pricing are far more likely to adjust their minimum stay by day of week, by season, and specifically around gap nights to improve their odds of getting booked.
When a three-night minimum stay blocks a two-night gap from being booked, these hosts lower the minimum to one or two nights to open those dates. The host who keeps the three-night minimum loses the chance to fill those nights.
For gaps between bookings, sophisticated operators often combine both levers into a single standing instruction known as a gap night rule: cut the price and loosen the minimum-stay policy whenever a gap of a specific size opens up. A lower price and a shorter minimum stay, applied specifically to the awkward nights between two bookings, is what closes the gap, and it’s exactly what the data above shows sophisticated operators doing.
How Do You Set Up a Gap Night Rule in Adapt?
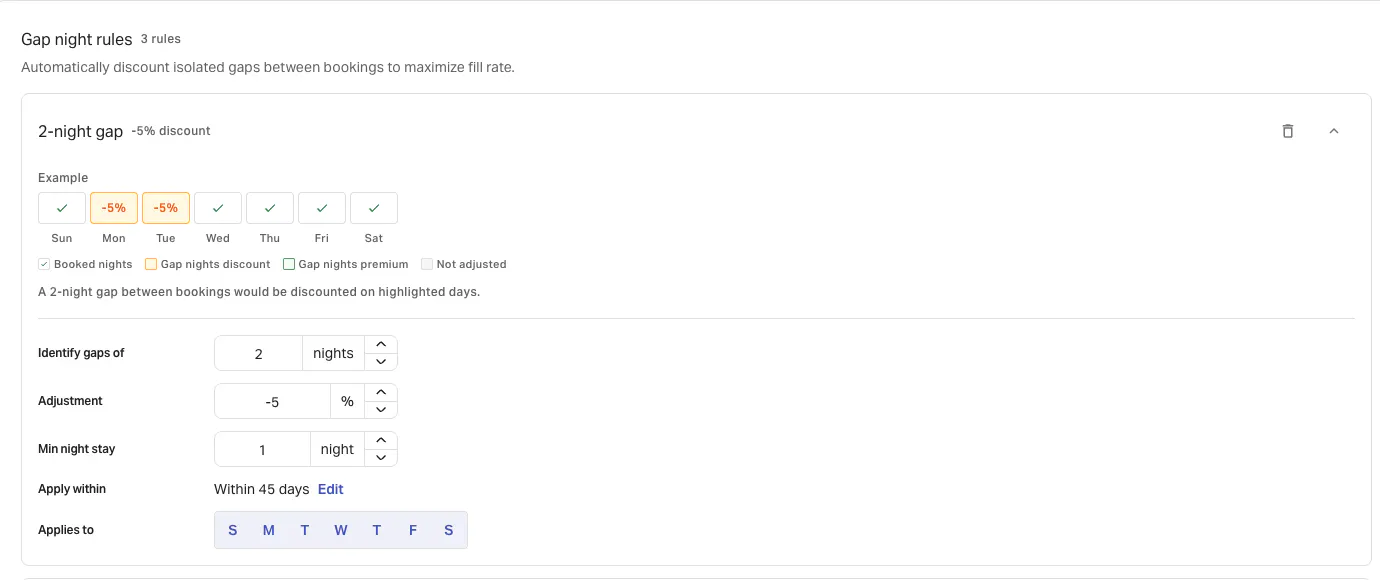
With a revenue management system such as Adapt, you can set up gap night rules and start closing gaps in your calendar. Adapt lets you set gap night rules for any size gap and choose a discount or premium for that gap, along with a minimum-stay adjustment.
For the Tuesday-through-Thursday gap mentioned earlier, you might set a three-night gap rule: whenever a three-night gap opens up between two bookings, drop the rate 10% and lower the minimum stay from three nights to one or two.
You can also choose which days a rule applies to. Your three-night gap rule can apply only when the gap falls on weekdays, for example, leaving weekend gaps discounted on their own terms.
You can also set the lead-time window a rule applies in. Say you want to discount a three-night gap, but only once you’re within 45 days of check-in. That’s usually good practice. Discounting nights while you’re still far out in your booking window discounts demand that might book at full price anyway, while waiting until you’re inside your booking window means you only discount once you need to.
Not sure which rules to apply? You don’t have to build them from scratch. Pick a pricing strategy and Adapt sets your gap night rules to match that goal automatically:
- Smart Yield to optimize your revenue per available rental (RevPAR).
- Volume Builder to price at market and work discounts hard to keep occupancy high.
- Steady Earner to fill early at a slightly lower rate for predictable income.
- Premium Hold if you’d rather have an empty night than a cheap one.
Beyond your gap night rules, Adapt adjusts your pricing every day, for every calendar date, to match real-time market demand, so you’re optimizing occupancy and nightly rate for every night ahead. Two nights a month is real money. Stop leaving it on the table with static pricing.
FAQs
What is a gap night in a short-term rental?
A gap night is an unbooked night, or stretch of nights, that sits between two existing reservations. A single open night between two bookings is often called an orphan night. Gap nights can be difficult to fill, depending on how long they are and which days they fall on.
How many more gap nights do static-priced rentals have?
Full-time U.S. static-priced properties average 13.1 gap nights a month, compared with 11.0 for algorithmically priced properties, or about two more nights a month. In San Antonio, Orlando, and Austin, static-priced properties have more than four extra unbooked nights a month compared with properties using actively managed or algorithmic pricing.
What share of U.S. short-term rentals use dynamic pricing?
About 19% of U.S. properties use an algorithmic pricing tool, and another 19% actively manage their pricing. About 42% run static pricing, or static pricing with an occasional manual tweak.
What is the difference between static and dynamic pricing for short-term rentals?
Static pricing keeps the same rate all year. Dynamic, or algorithmic, pricing uses a revenue management system (RMS) to recalculate the rate for every calendar date daily based on booking trends in the market. Algorithmically priced properties discount unsold nights by about 12.7% on average, compared with about 1% for static-priced properties.
How do you fill gap nights on your calendar?
The most effective approach combines two levers: discount the unsold nights and lower the minimum stay so the gap can be booked. A gap night rule does both automatically whenever a gap of a set size opens up. In Adapt, you can set gap night rules for any size gap, limit them to specific days, and apply them only within a lead-time window, such as 45 days of check-in.
ARTICLE SUMMARY
AirDNA analyzed full-time U.S. short-term rentals across five pricing strategies, from static rates to fully algorithmic dynamic pricing, to measure how pricing sophistication affects gap nights. Static-priced properties average about two more unbooked nights a month than algorithmically priced ones, yet 42% of U.S. listings still use static or manual pricing. Hosts with more sophisticated pricing fill more gaps by discounting unsold nights and loosening minimum stays, often combined into a single gap night rule.
Linda Rollins
Senior Research Analyst
Linda Rollins is a Senior Research Analyst at AirDNA and a self-managing short-term rental host, which means she understands the market as both an analyst and an operator. She writes research and blogs for AirDNA and for Adapt, its revenue management tool, making her work a go-to resource for investors trying to find and size up the right opportunities, and for operators looking to understand changing market dynamics and find concrete ways to improve occupancy, rates, and guest experience. Her data is regularly cited in major news outlets, and she has a knack for bringing both the numbers and the story behind them. In her free time, Linda enjoys spending time with her family, traveling, and looking for good eats.