

 Calculate Revenue
 Research Markets
 Find For Sale Properties
 Compare My Listing
 STR Revenue Calculator
 Custom Comp Sets
 Submarket Insights
 Custom Search Filters
 Rate Recommendations
 Performance Benchmarking
 Competitor Comparison
 Owner Contact Details
 Property-level performance data
 Tourism Insights
 Real Estate Investment Analytics
 About Us
 Sales
Sales Support
 Press
PressEuropean Review November 2024: Record Fall Demand Sets Stage for a Strong Holiday Season
Published: December 17, 2024
Last updated: February 26, 2025

Linda Rollins
Key Takeaways:
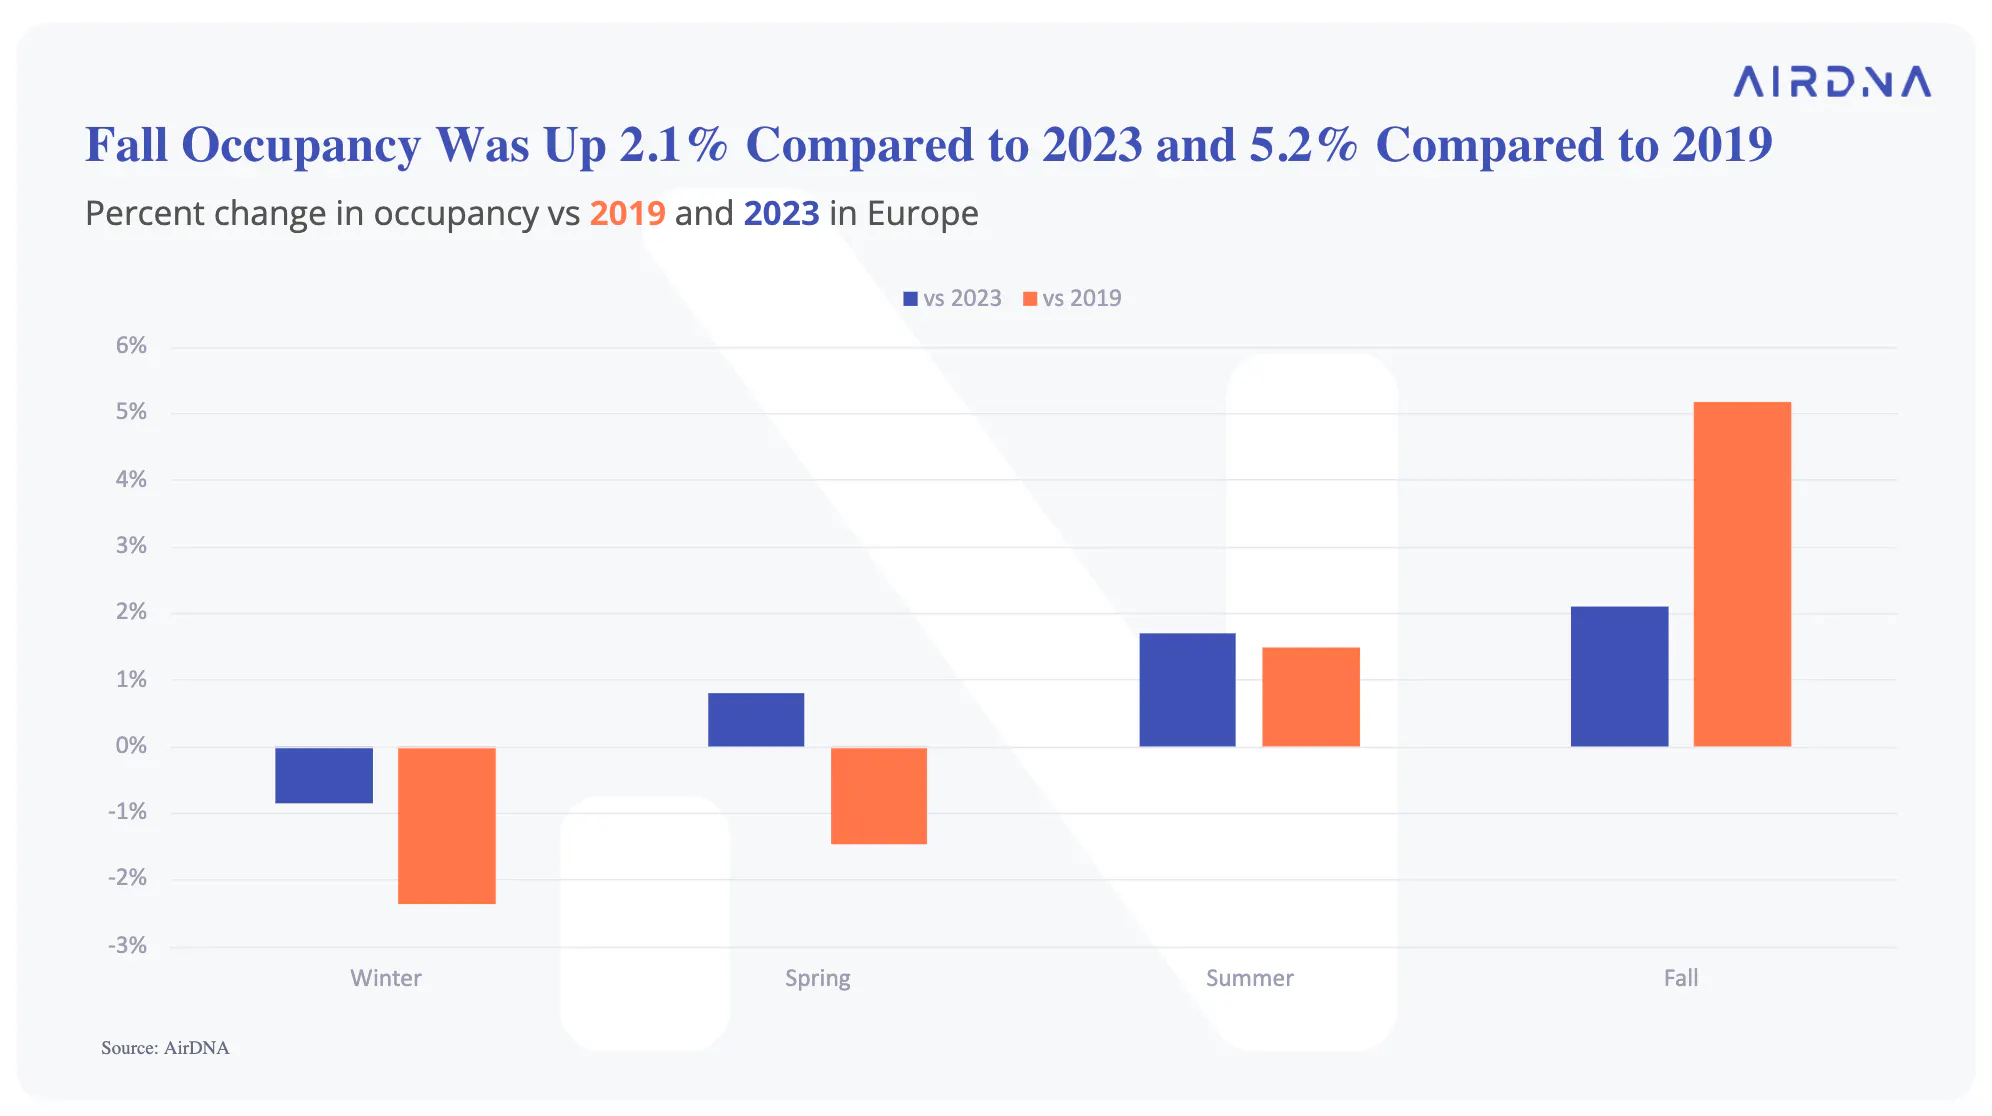
- November demand grew 18% YOY, with fall occupancy up 5.2% compared to 2019.
- Smaller properties and unique stays drove listing growth, with unique stays up 54% over five years.
- Christmas and New Year’s bookings are up 21% YOY, with ski season demand strong in key Swiss and German Alps markets .
November put a bow on a successful fall season for European short term rentals. Total demand nights last month reached 24.6 million, an 18% increase from last year and a new record high for the month of November.
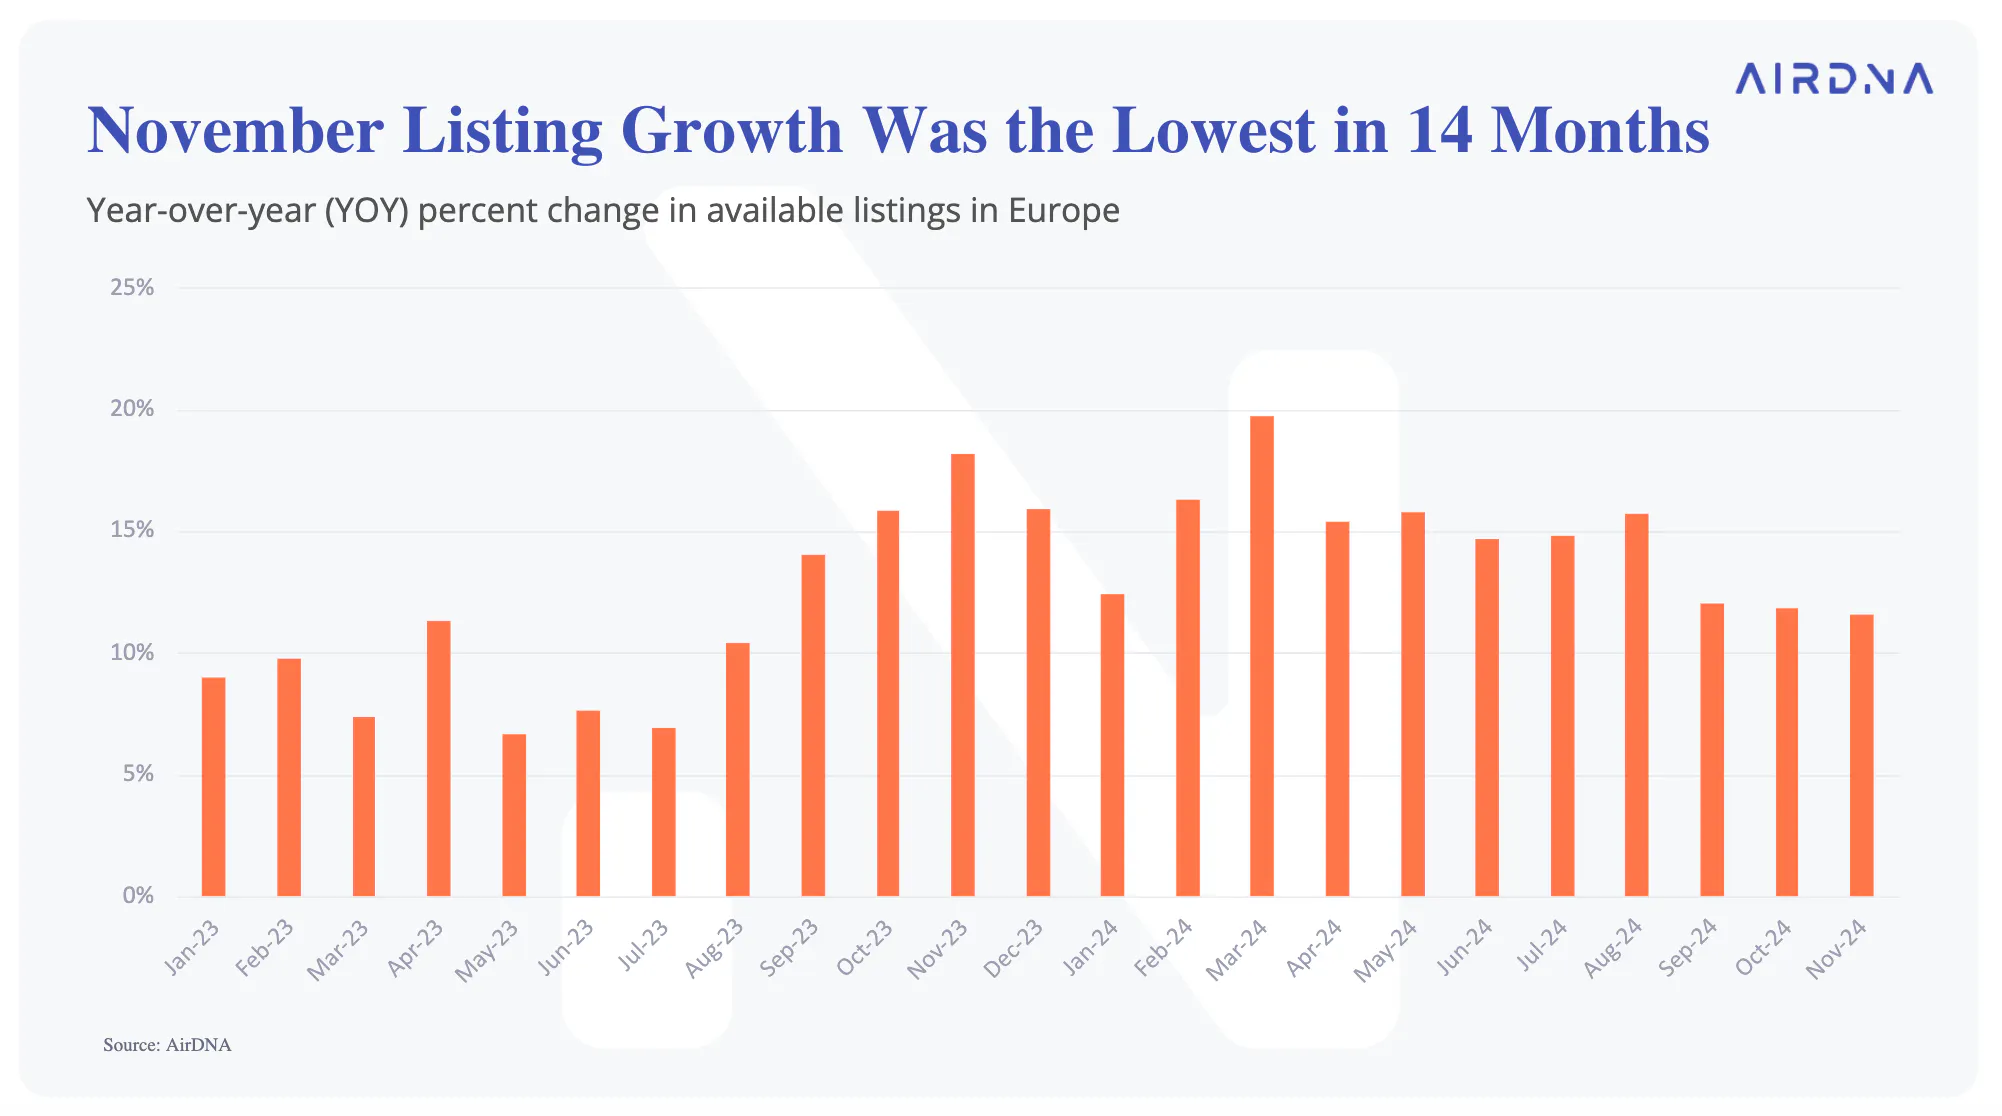
The number of new listings entering the market, or listing growth, was able to match the enthusiasm of demand growth. Available listings totaled 3.3 million last month, up 11.6% year-over-year (YOY).
While this influx of new listings reflects a vibrant and growing market, it also puts slight downward pressure on occupancy rates. Occupancy rates measure how full the available listings are. When supply grows faster than demand, it becomes harder for each individual property to maintain high booking levels. Occupancy growth YOY fell to 1.3% in November, compared to 3.5% in October.
The dip in occupancy growth also weakened average daily rate (ADR) growth. ADRs across Europe averaged €150 last month, a modest 1.8% YOY increase.

At a Glance: November 2024 STR Performance in Europe
- Available listings totaled 3.3 million, up 11.6% year-over-year (YOY)
- Demand reached 24.6 million, an increase of 18.2% YOY
- Average daily rates (ADR) averaged €150, up 1.8% YOY
- Average occupancy was 43%, up 1.3% YOY and up 13% compared to 2019
- Revenue per Available Rental (RevPAR) increased 3.1% YOY to €65
- Booked nights increased 12.3% YOY
Despite the dip in occupancy performance from October to November, this fall was still an impressive season for occupancy. Fall has consistently stood out for its occupancy growth since the pandemic, and this year was no different.
Occupancy rates for the fall season were up 5.2% compared to 2019 and up 2.1% compared to 2023. In contrast, occupancy rates this winter and spring saw YOY declines and were below 2019 levels.
Even during the peak summer months, occupancy managed only a modest increase of 1.5% compared to 2019, reinforcing fall’s status as the strongest season for occupancy recovery in recent years.
Listing Growth in Europe Slows and Favors Smaller Properties
Available listing growth remains in the double digits across Europe but it’s been gradually slowing in recent months. The 11.6% increase in listings in November was the smallest year-over-year (YOY) increase that we’ve seen in the last 14 months.
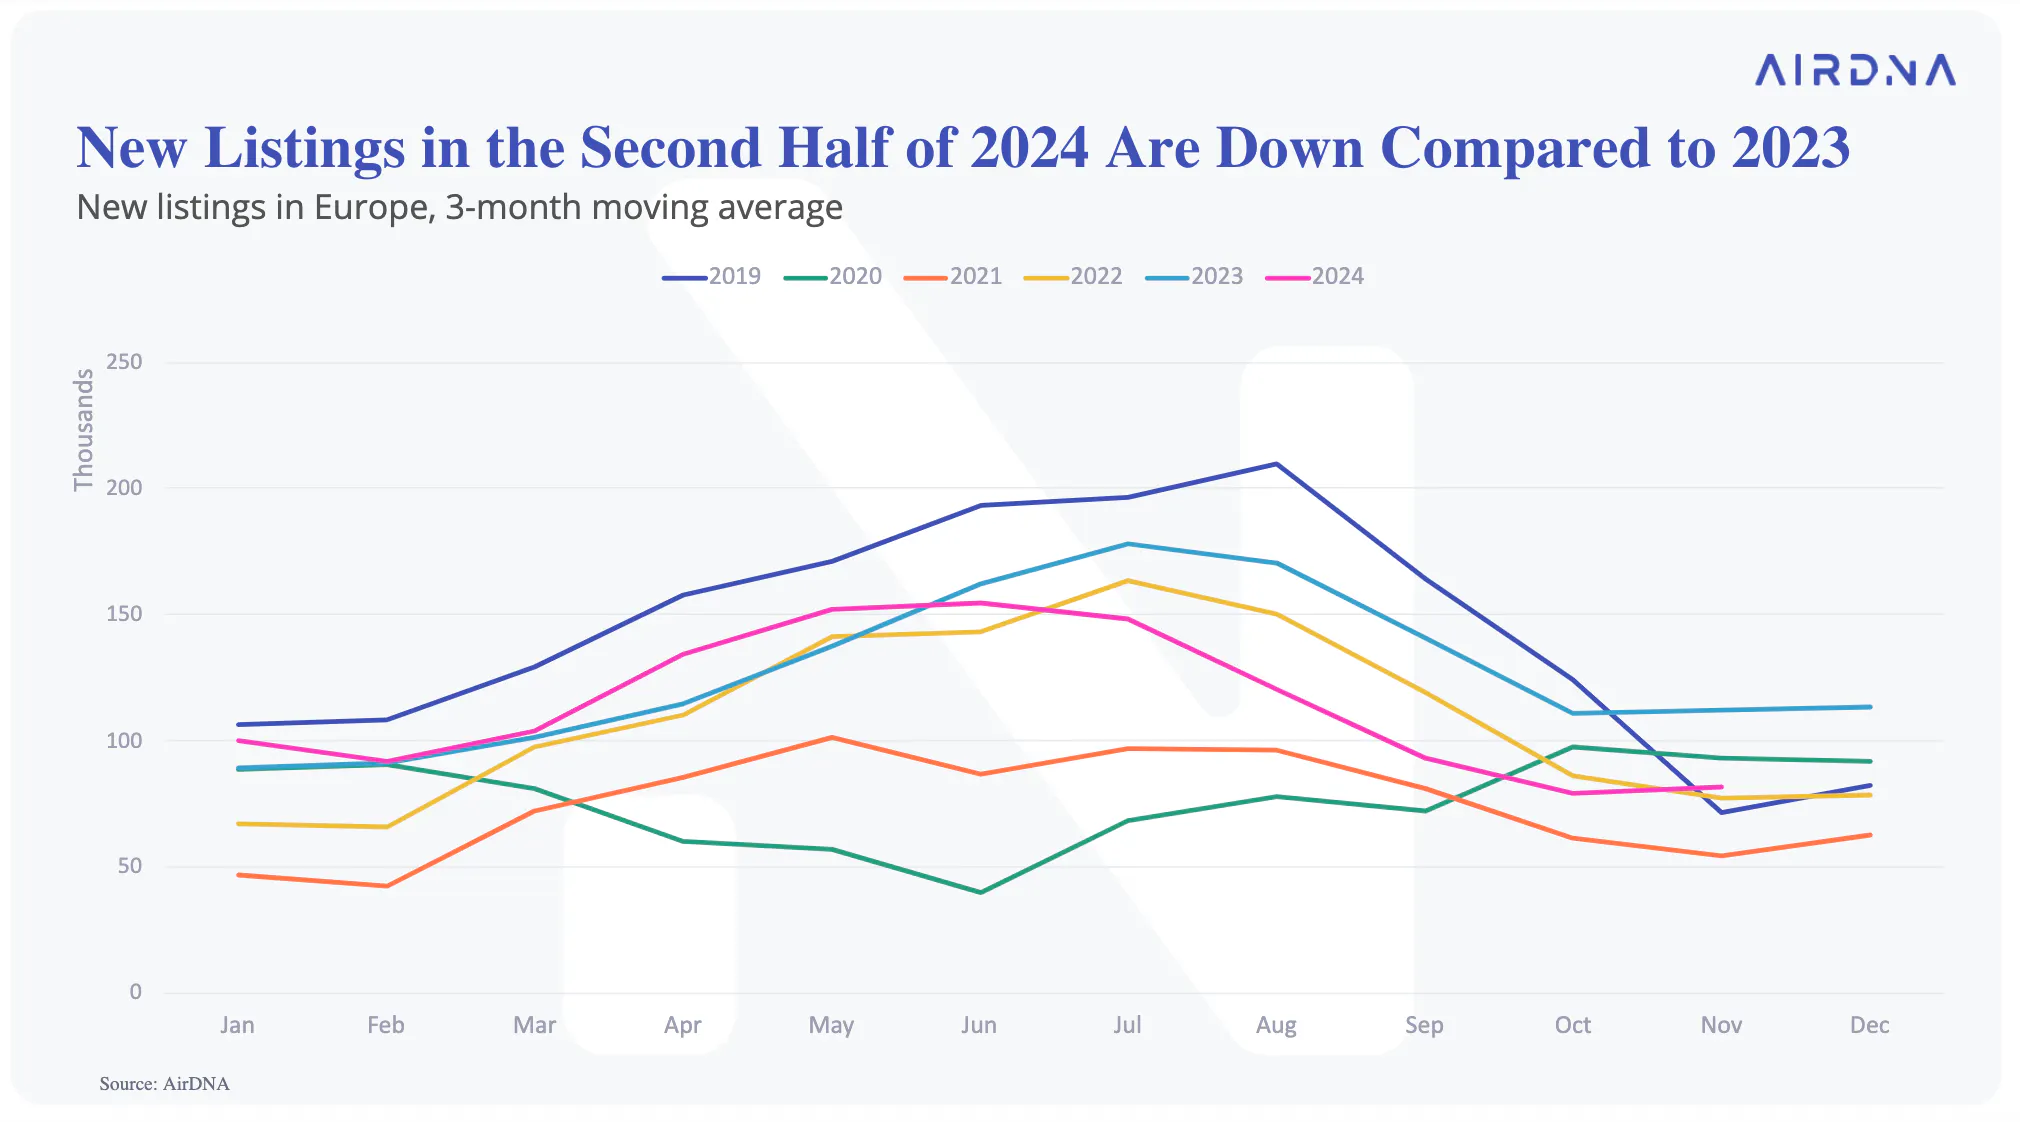
Available listing growth measures the total number of properties listed and open for bookings, while new listing growth specifically tracks properties entering the market for the first time. The deceleration of new listing growth may be contributing to the slowdown in available listings.
In the first half of 2024, new listings grew by 6% YOY. This trend reversed sharply in the second half of this year, with new listings down 26% YOY.
Notably, the second half of 2023 was a particularly strong period for new listing growth in Europe. The European continent added over 800,000 new listings between July and December of last year, a 22% increase from the year prior. The current YOY drop in new listing growth may signal a return to more sustainable levels after two years of accelerated expansion.
The composition of new listings in Europe has shifted toward smaller properties in 2024. Last year, houses led new listing growth, with the number of newly listed houses increasing by 22% year-over-year (YOY), compared to a 16% increase for apartments and lofts.
This trend reversed in 2024. New property listings overall have declined by 12% YOY, but the drop has been steeper for houses (-16%) than for apartments and lofts (-10%).
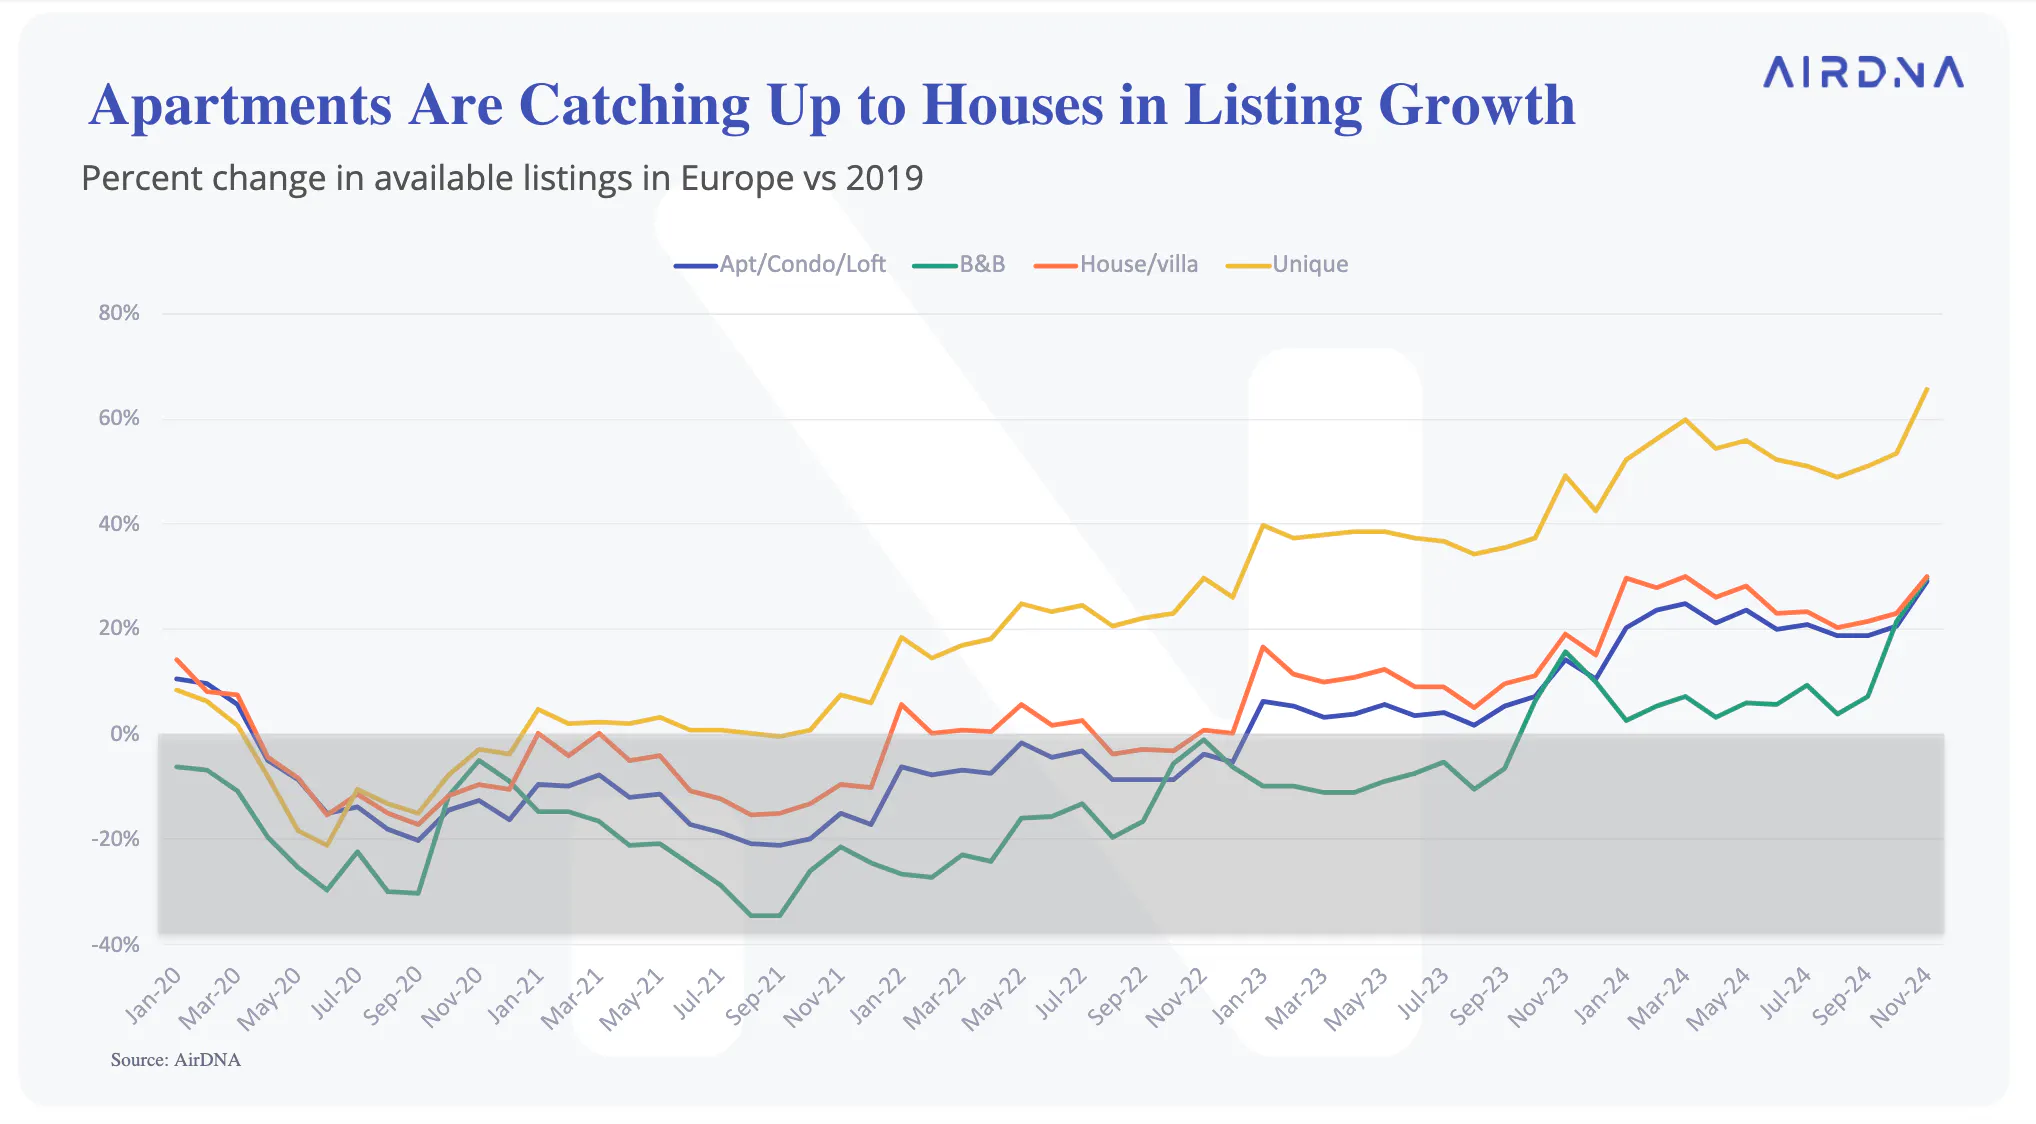
There’s been a gap in listing growth between housing and apartments since the pandemic, with houses entering the short-term rental market at a higher rate in 2022 and 2023. However, that gap is beginning to narrow as apartments steadily caught up over the past year.
Last November, house listings were up 19% compared to 2019 while apartment listings were only up 14% compared to pre-pandemic levels. Fast forward to this November, and both property types are about 30% above 2019 levels.
Unique Stays Have Led Listing Growth Over the Last Five Years
Over the past five years, unique stays have been the fastest-growing segment of the short-term rental market in Europe. In 2019, there were approximately 67,000 unique properties available for booking each month. That number has grown significantly, averaging 103,000 monthly available listings over the past year—a 54% increase.
Unique stays, which include unconventional accommodations like treehouses, yurts, and houseboats, now make up 3.0% of all available listings in Europe, up from 2.4% in 2019.
While unique stays represent a small share of total listings, they have outpaced other property types in listing growth over the past five years. Among the most common unique property types, treehouses, campers/RVs, dome houses, tents, and tiny houses have seen the strongest increases in available listings over the last 5 years. Many of these property types have also led year-over-year (YOY) listing growth.
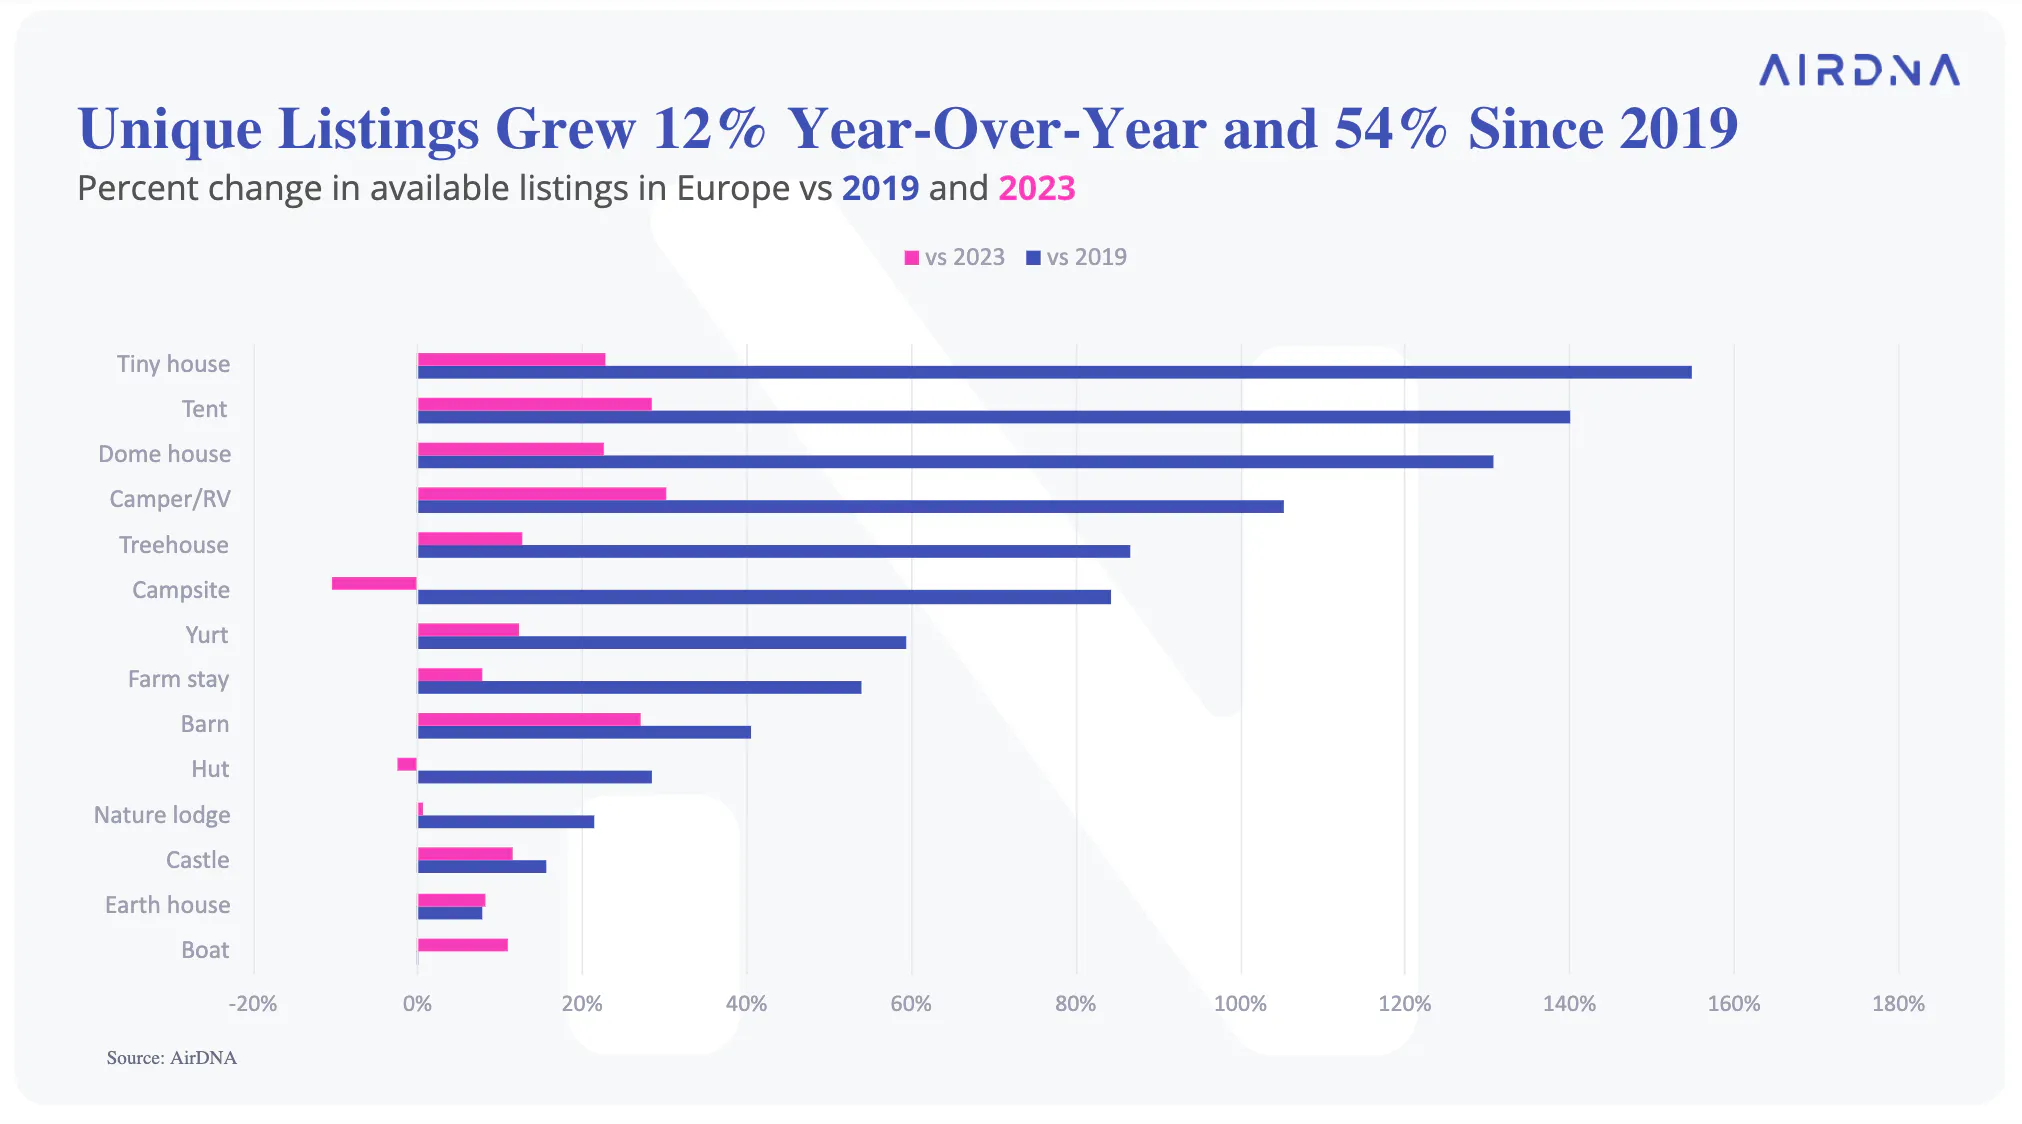
For unique listings across Europe, revenue per available rental (RevPAR) has averaged €82 over the past year, though performance varies widely by property type. RevPAR is a key performance indicator that combines occupancy and ADR to offer a clear picture of a property’s overall earning potential.
Higher-end unique stays like castles, barns, and treehouses are top revenue generators with average RevPARs exceeding €100 per night over the last year. Meanwhile, more budget-friendly options like tiny houses, yurts, tents, and campers/RVs bring in less than €60 per available night.
Overall, unique listings have seen about 2% YOY RevPAR growth in 2024. While this falls short of the 7% YOY RevPAR growth seen among apartments and houses, some standout unique property types did keep pace with traditional property types:
- Campers/RVs (+7.1%)
- Tents (+7.6%)
- Huts (+8.1%)
- Farm stays (+9.1%)

Shoulder Season Travel Boosted Demand and RevPARs Across Top Countries
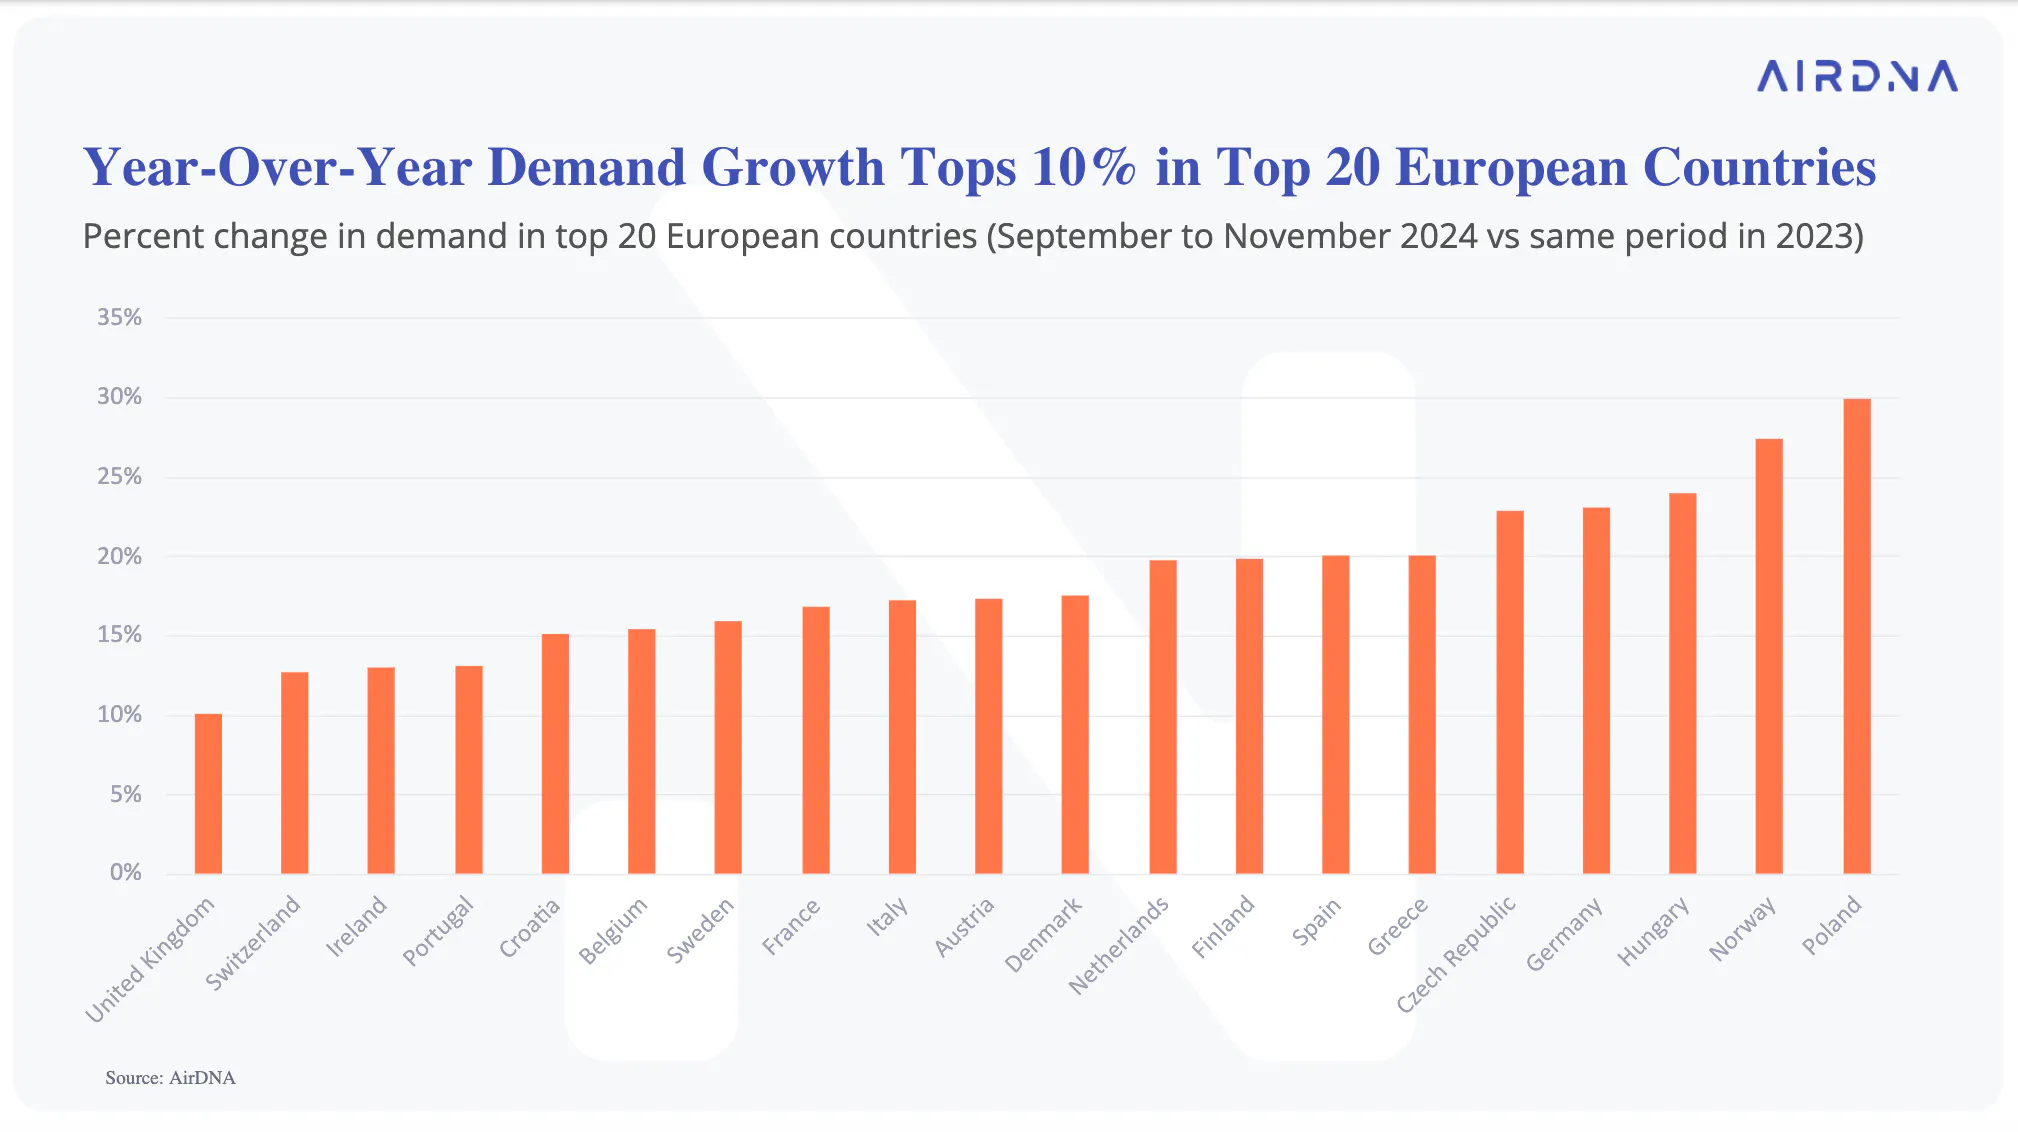
Shoulder season travel—referring to the period between peak and off-peak travel seasons—played a key role in driving double digit demand growth among all 20 of the largest STR markets in Europe this fall. Southern and eastern destinations were the most popular among travelers. The following countries boasted over 20% year-over-year (YOY) demand growth for the months of September, October, and November.
- Greece (+20.1%)
- Czech Republic (+22.9%)
- Germany (+23.1%)
- Hungary (+23.9%)
- Norway (+27.4%)
- Poland (+29.9%)
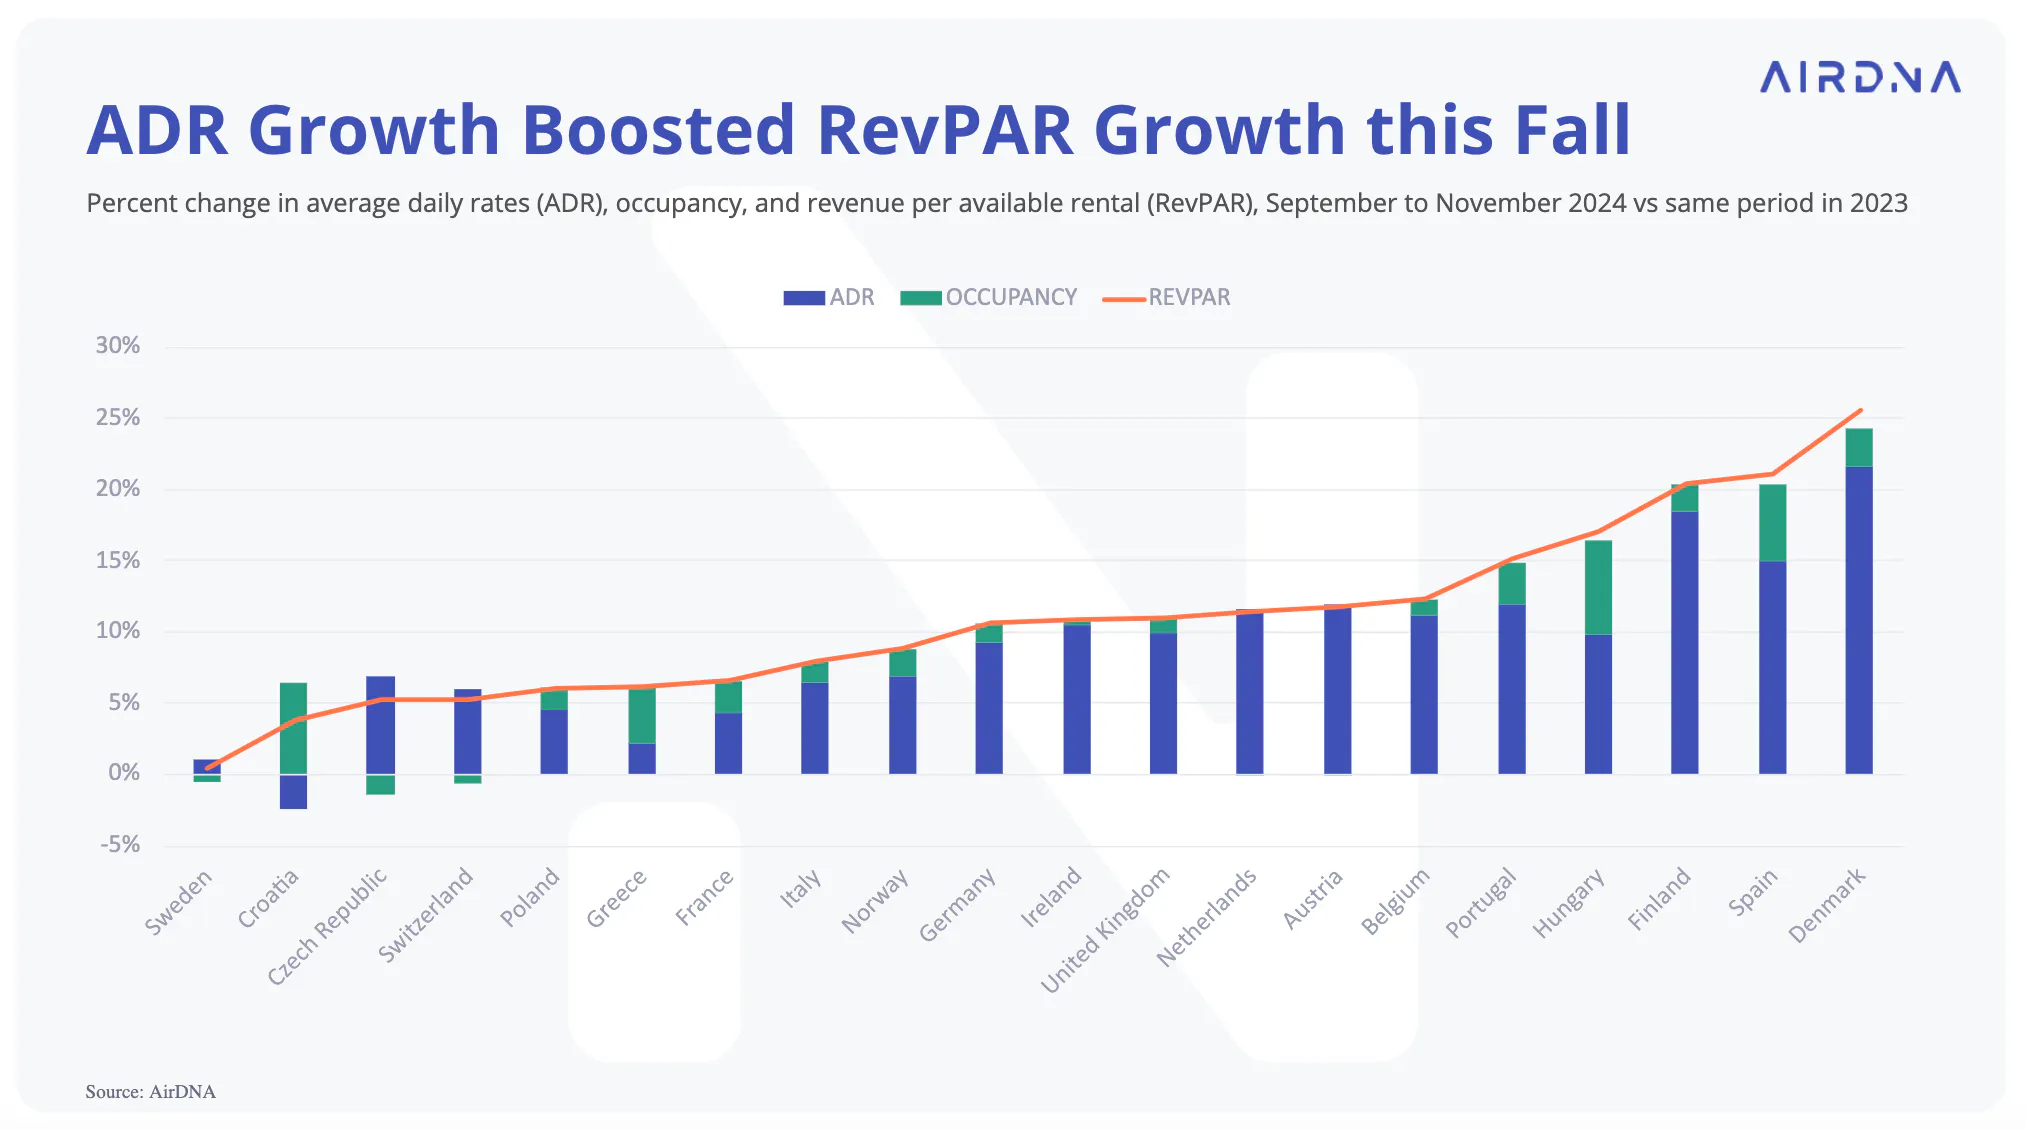
While demand growth can support higher revenues for hosts, supply growth—meaning the addition of new listings—can counterbalance the positive effects. When more listings enter the market, competition increases, making it harder for individual hosts to achieve higher occupancy rates or raise prices.
This fall, the strongest RevPAR performers were countries where demand growth outpaced supply growth. In these markets, limited competition allowed hosts to benefit from both higher occupancy and greater pricing power, enabling them to earn more revenue per available night.
Hosts in the top countries for RevPAR growth this fall experienced more than 15% YOY change, with the help of strong occupancy growth and double digit ADR growth.
- Portugal (+15.2%)
- Hungary (+17%)
- Finland (+20.4%)
- Spain (+21.1%)
- Denmark (+25.6%)
Demand for Christmas, New Years, and Ski Season
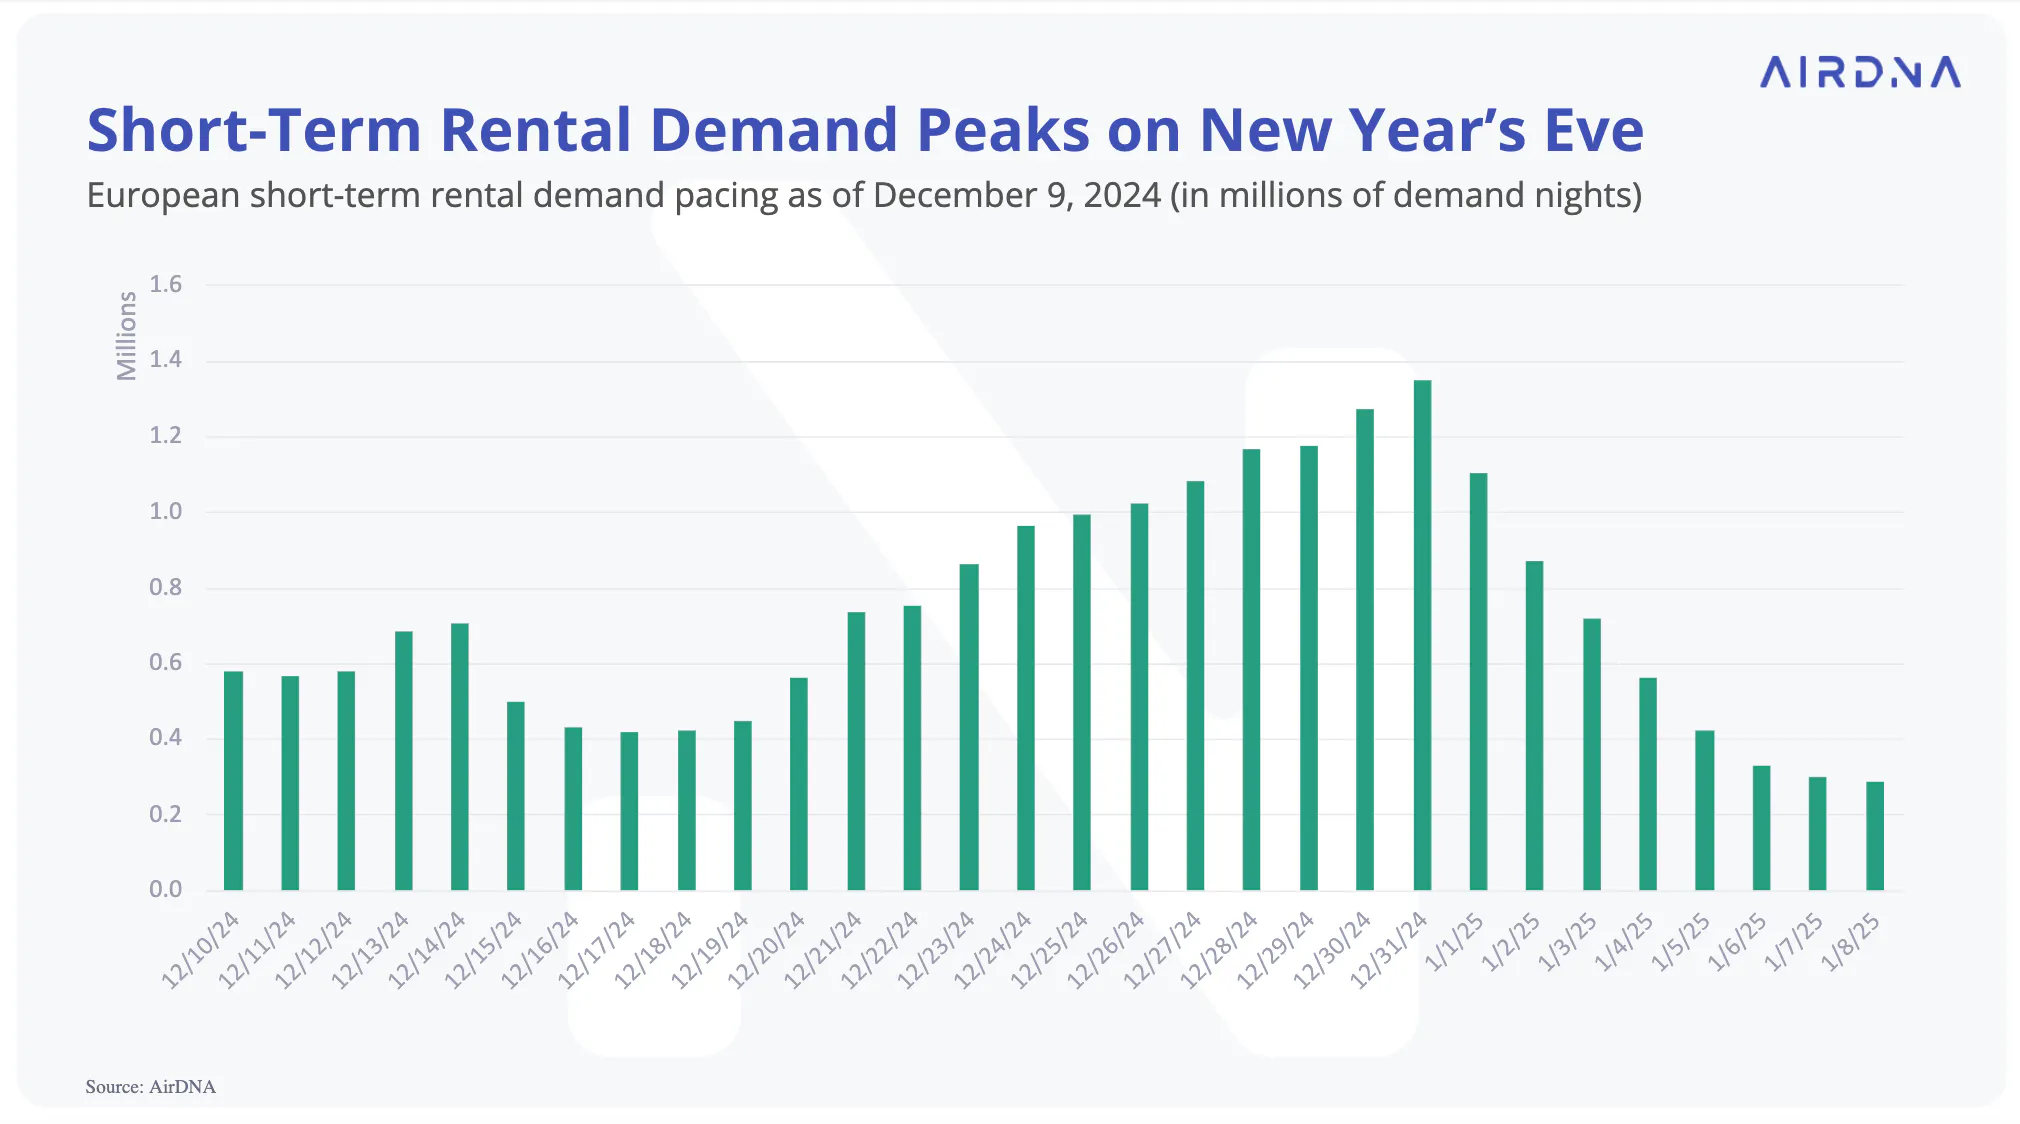
Demand for short-term rentals (STRs) over the two weeks surrounding Christmas and New Year’s (December 20th to January 2nd) is looking particularly merry. Current demand “on the books”—confirmed reservations already made—is up 21% year-over-year (YOY). Booking trends suggest travelers are easing into the season, with demand starting to pick up the weekend before Christmas and building momentum through New Years Eve.
Peak performance is set for New Year’s Eve. STR bookings hit their highest point with current bookings totaling 1.3 million nights—up 20% from demand on the books at this time last year. Whether travelers are ringing in 2025 in snowy ski chalets or sunny escapes, it’s clear that this holiday season will be one to celebrate for STR hosts across Europe.
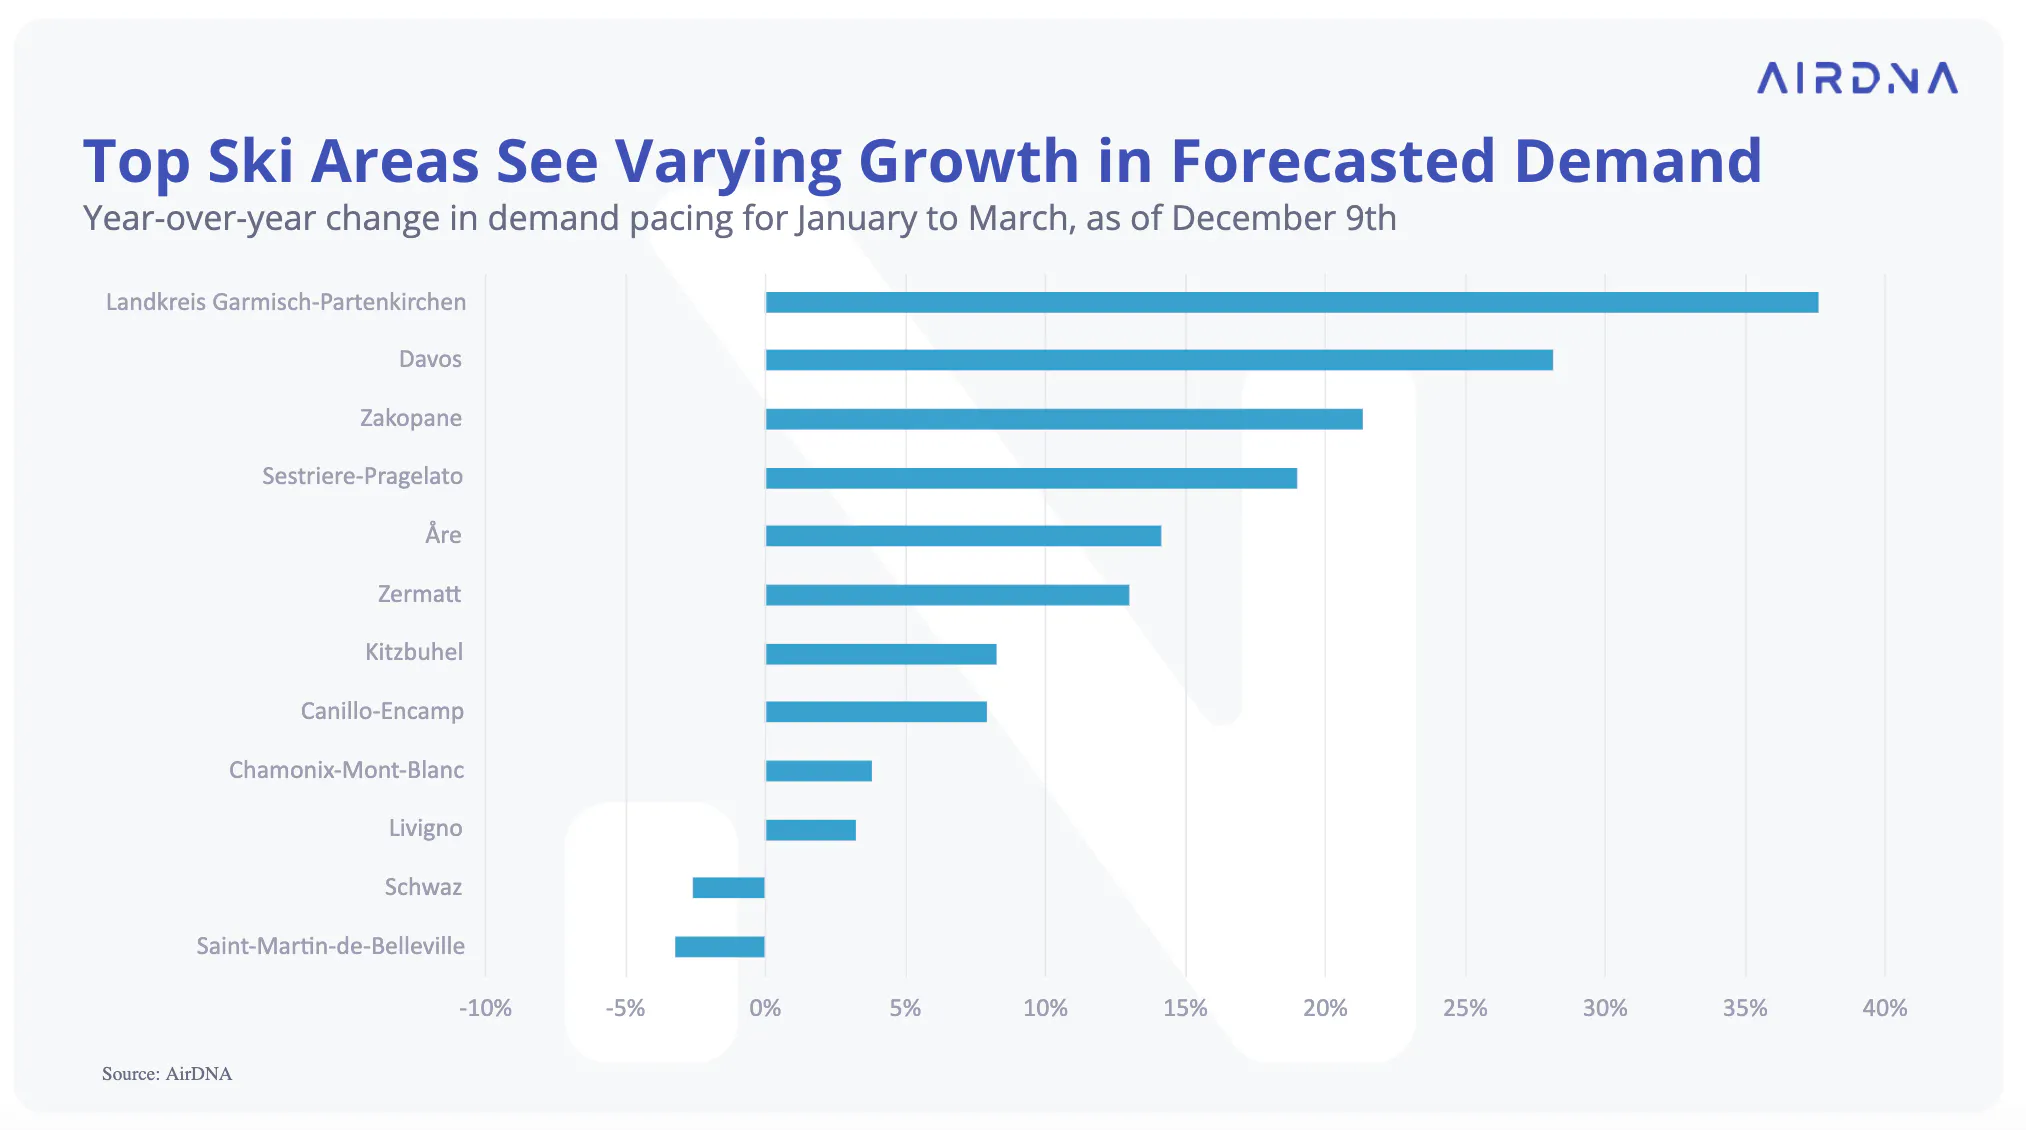
With winter upon us, ski season is also kicking off across Europe. Among the top 12 European ski destinations, demand pacing for January through March reveals standout performers and a few areas lagging behind:
- Landkreis Garmisch-Partenkirchen, German Alps: +38%
- Davos, Swiss Alps: +28%
- Zakopane, Tatras Mountains: +21%
- Schwaz, Austrian Alps: -3%
- Saint-Martin-de-Belleville, French Alps: -3%

Ski season performance is highly dependent on snowfall. A large percentage of bookings for ski areas are made in the same month as the reserved dates. Major ski resorts in the Alps have had promising early season snowfall and are seeing strong year-over-year (YOY) growth in demand on the books. However, demand performance this winter will depend on good snow conditions continuing into the new year.
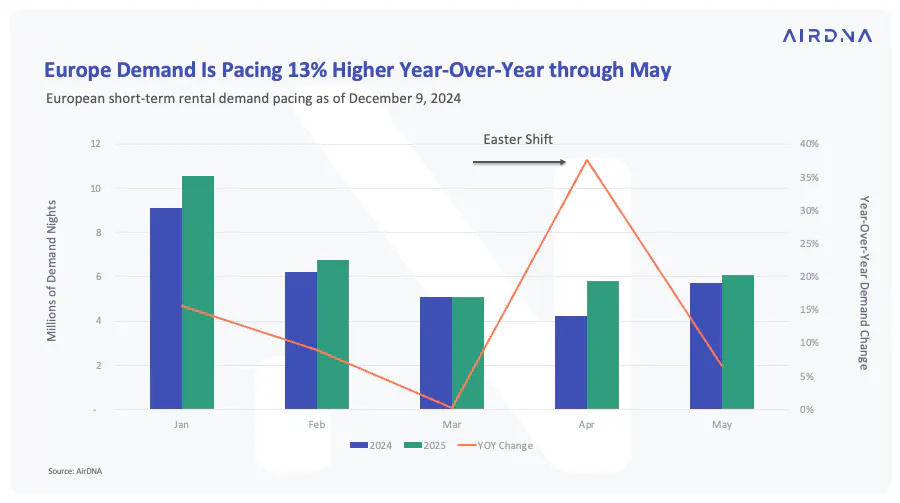
Short-term rental demand in Europe is poised to kick off the new year on a strong note. Current reservations on the books are up 16% year-over-year (YOY) for January and 9% YOY for February.
Demand growth for March is noticeably smaller, up just 0.2% YOY. This slowdown is largely due to Easter shifting back to April this year. Easter is a major travel driver in Europe, and when it falls later in the calendar, demand naturally shifts from March into April. As a result, April demand is seeing a substantial boost, up 38% YOY.

ARTICLE SUMMARY
The European short-term rental market closed out a successful fall season with strong demand growth and shifting trends towards smaller properties and unique listings. As the holiday and ski seasons approach, early bookings signal continued momentum to start the new year.
Linda Rollins
Senior Research Analyst
Linda Rollins is a Senior Research Analyst at AirDNA and a self-managing short-term rental host, which means she understands the market as both an analyst and an operator. She writes research and blogs for AirDNA and for Adapt, its revenue management tool, making her work a go-to resource for investors trying to find and size up the right opportunities, and for operators looking to understand changing market dynamics and find concrete ways to improve occupancy, rates, and guest experience. Her data is regularly cited in major news outlets, and she has a knack for bringing both the numbers and the story behind them. In her free time, Linda enjoys spending time with her family, traveling, and looking for good eats.
