Global Vacation Rental Bookings Skyrocket by 127% After Surge in Domestic Tourism
Published: May 27, 2020
Last updated: February 11, 2025

Dillon DuBois
After the multi-month lockdown brought global travel to a standstill, it now seems that -- whether or not we’re ready -- the road to economic recovery is clearly taking shape.
Despite a lack of consensus on health and safety protocols, countries and cities around the world have begun nudging their industries back to normalcy.
What does this mean for short-term rentals? After weathering a flood of cancellations and scrambling to market themselves as immaculate, virus-free stays, it seems like the suffering may be somewhat short-lived.
In this new report, we’re giving a thorough update on the status of global vacation rental markets. While some destinations are seeing V-shaped recovery curves, others are still faring far worse than ever before. One major factor at play? Each market’s reliance on international travel and the new dynamics of drive-to tourism.
Here’s our latest update on the vacation rental industry’s post-COVID recovery trends.
Global Bookings Rebound by 127% Over 6-Week Sprint
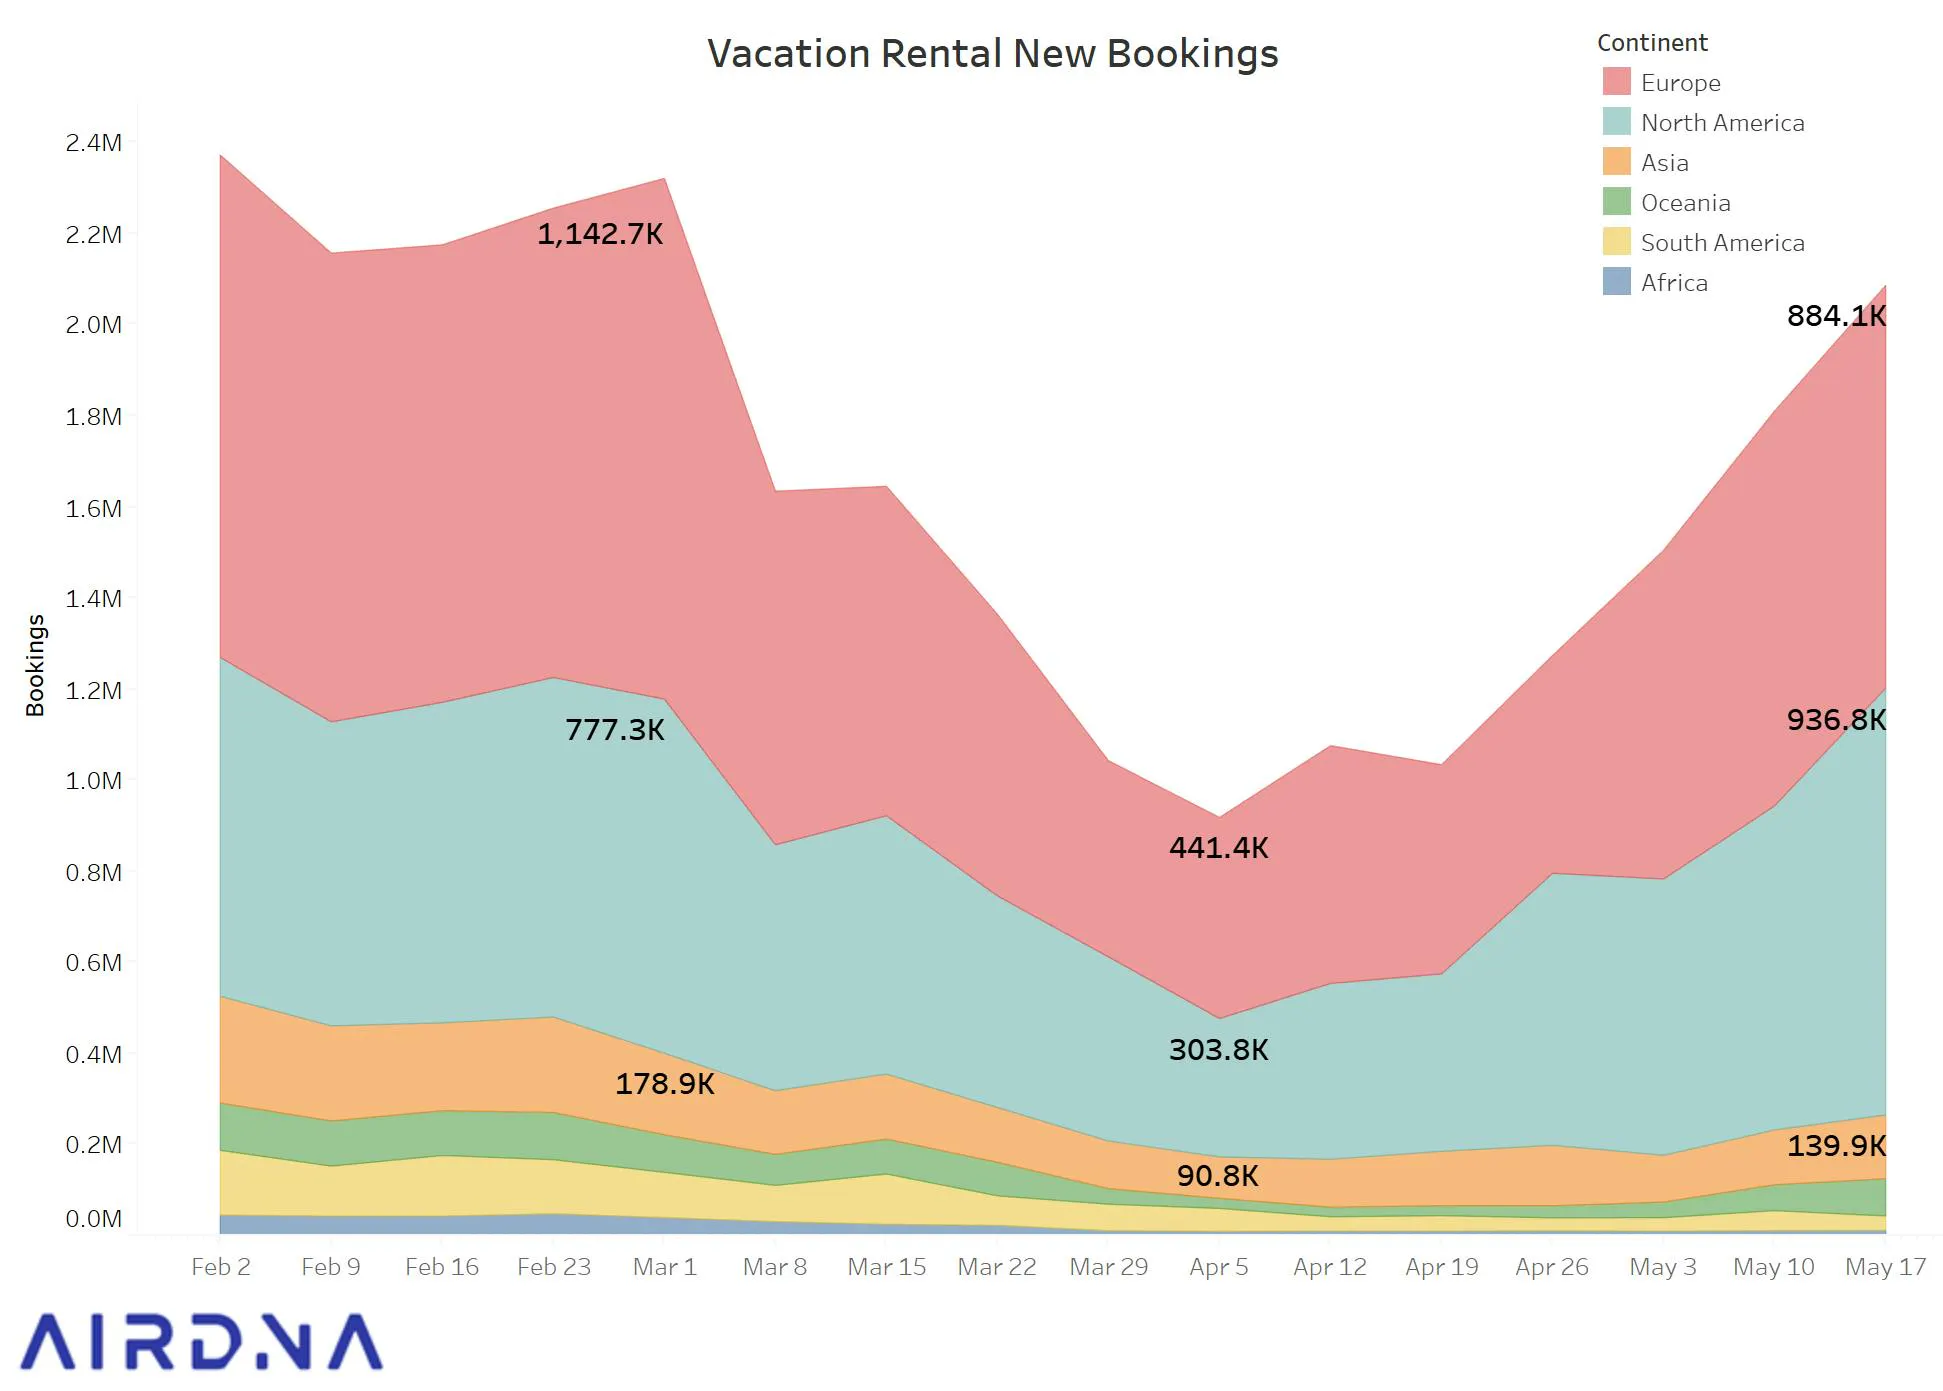
Below is a high-level chart showing the number of new bookings for all global markets since the first week of February. Without any regard for when those reservations are being made for (we'll dive into that below), here we're tracking the number of new reservations being made each week.
The data presents a clear timeline for how COVID-19 has impacted the international travel industry. After its onset in early March, vacation rental bookings found rock bottom during the week of April 5th. As of May 18th, they’d remarkably rebounded close to pre-COVID levels. Whereas there were just over 916,000 total bookings (both Airbnb and Vrbo) made during the week of April 5th, the week of May 18th saw over 2.08 million.
New Zealand, Germany, France, U.S, and Australia Lead Recovery Trajectory
The global uptick is clear, but it’s worth noticing how each country is experiencing its own unique recovery. There’s no global playbook, so governments have essentially been tasked with drawing their own line between what’s safe and what’s productive.
New Zealand leads the charge with over 465% more bookings this week than 6 weeks prior. After doing a remarkable job shutting down the country and stunting the virus’s spread, it’s seeing a huge surge in bookings even as it heads into the winter season.
Since April 6th, Germany has seen 367% more bookings, while the United States, bullish as ever, follows closely behind with over 202%. France has seen 200% over the same time frame, and Australia is also reporting a surge of over 189%.

Ranked: Markets Seeing the Fastest Rebounds
1. North America
In order to determine which markets are recovering from COVID-19 the fastest, we compared the number of bookings made this past week to those made during the week of April 6th (which is an agreeable baseline for rock bottom).
Markets Seeing the Fastest Growth
City | Bookings: Week of 4/6 | Bookings: Week of 5/18 | % Change | Population |
|---|---|---|---|---|
| Big Bear Lake | 133 | 3,147 | 2266% | 5,094 |
| South Padre Island | 249 | 3,340 | 1241% | 2,885 |
| Carolina Beach | 107 | 1,178 | 1001% | 6,033 |
| Ocean City | 190 | 1,977 | 941% | 11,089 |
| Myrtle Beach | 498 | 4,735 | 851% | 119,080 |
| Galveston | 514 | 4,745 | 823% | 49,659 |
| New Braunfels | 129 | 1,116 | 765% | 78,685 |
| Lake Havasu City | 186 | 1,501 | 707% | 55,808 |
| Corpus Christi | 394 | 2,622 | 565% | 325,733 |
| Gulf Shores | 772 | 4,922 | 538% | 12,705 |
Markets Seeing the Slowest Growth
City | Bookings: Week of 4/6 | Bookings: Week of 5/18 | % Change | Population |
|---|---|---|---|---|
| Philadelphia | 1,013 | 1,668 | 64.70% | 1,526,206 |
| Columbus | 523 | 847 | 62.00% | 783,285 |
| Vancouver | 632 | 1,005 | 59.00% | 675,218 |
| Boston | 275 | 421 | 53.10% | 694,583 |
| Chicago | 1,404 | 2,143 | 52.60% | 2,680,484 |
| San Francisco | 607 | 902 | 48.60% | 805,301 |
| New York | 2,812 | 3,935 | 39.90% | 8,201,658 |
| Dallas | 1,682 | 2,231 | 32.60% | 1,263,321 |
| Toronto | 1,920 | 2,305 | 20.10% | 2,930,000 |
| Montreal | 865 | 949 | 9.70% | 1,780,000 |
The theme here is pretty clear: markets rebounding the fastest are primarily leisure destinations in states pushing for a swift snap back to reality. Rentals near the beaches of Alabama, Georgia, Texas, and the Carolinas are the first to benefit from a travel-starved population. Average growth in new bookings for these cities is up over 968%
Meanwhile, major markets seeing the lowest growth are large urban metropolises with an average population of 2.1 million people. Average growth for these spots is a mere 44%.
2. Europe
Below are the cities in Europe seeing the most growth in new bookings. Here we’re comparing the number of bookings made this past week compared to the continent’s worst week of March 30th.
3. Asia
City | Bookings: Week of 4/6 | Bookings: Week of 5/18 | % Change |
|---|---|---|---|
| Changsha Shi | 1,284 | 3,337 | 159.90% |
| Beijing | 549 | 1,413 | 157.40% |
| Chongqing | 1,754 | 4,416 | 151.80% |
| Shanghai | 2,833 | 6,275 | 121.50% |
| Dali Baizuzizhizhou | 576 | 1,223 | 112.30% |
| Xian Shi | 1,337 | 2,737 | 104.70% |
| Chengdu Shi | 2,704 | 5,419 | 100.40% |
| Qingdao Shi | 814 | 1,600 | 96.60% |
| Tianjin | 789 | 1,411 | 78.80% |
| Huzhou Shi | 787 | 1,315 | 67.10% |
4. Oceania
City | Bookings: Week of 4/6 | Bookings: Week of 5/18 | % Change |
|---|---|---|---|
| Queenstown, NZ | 111 | 1,177 | 960.40% |
| Blue Mountains, AU | 216 | 2,226 | 930.60% |
| Wellington, NZ | 159 | 1,253 | 688.10% |
| Great Lakes, AU | 118 | 919 | 678.80% |
| Shoalhaven City Council, AU | 502 | 3,231 | 543.60% |
| The of theity of Kiama, AU | 107 | 611 | 471.00% |
| Port Stephens Council, AU | 134 | 749 | 459.00% |
| Wyong, AU | 277 | 1,229 | 343.70% |
| Christchurch City, NZ | 186 | 738 | 296.80% |
| Byron, AU | 337 | 1,246 | 269.70% |
How Travel Distance is Affecting Recovery Rates
Much of the driving force determining which cities are recovering relates to where guests are traveling from.
By drilling into guest origin data, we can pinpoint whether guests are coming from a neighboring town or boarding an international flight.
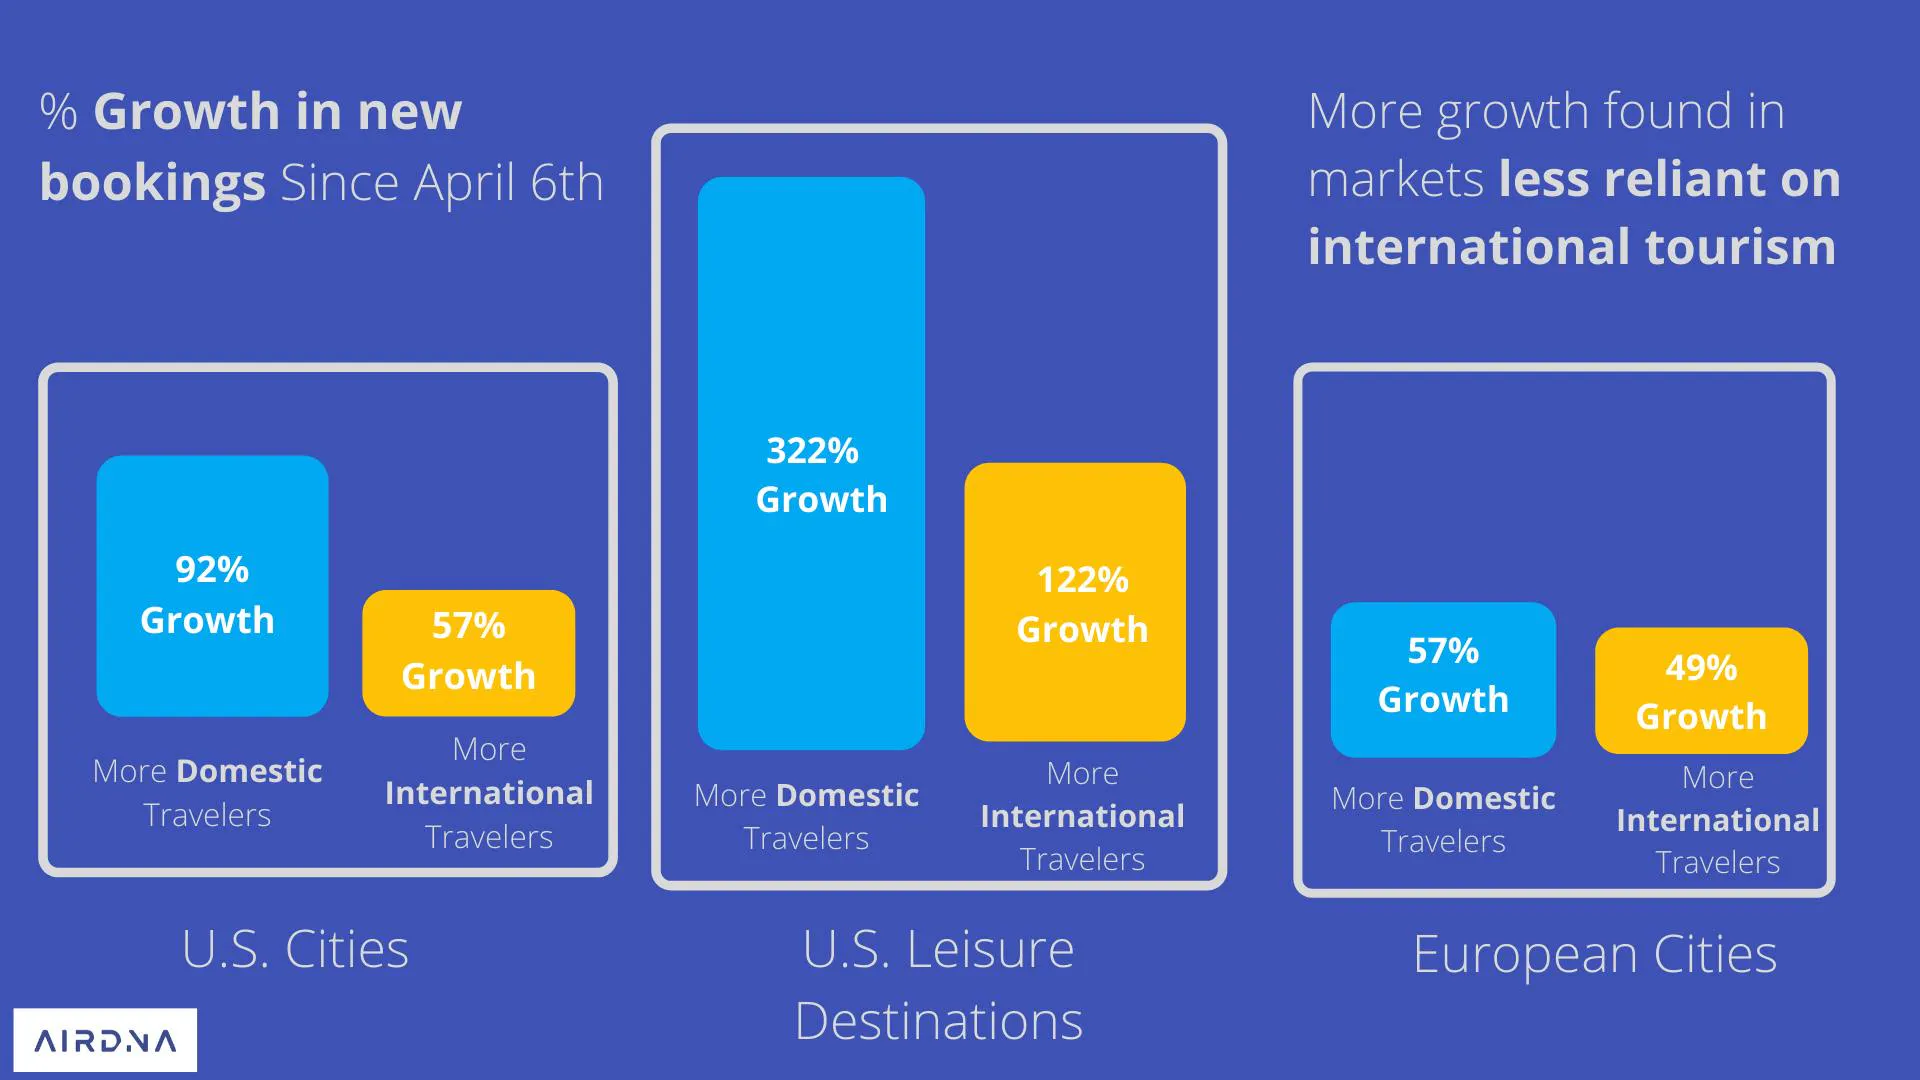
First, we determined for each city the percentage of guests traveling from international locations. We then made two categories: those more reliant on international travel, and those more reliant on domestic travel.
Urban U.S. Metro Areas
Across the board, destinations in the United States are far more reliant on domestic travel than their European counterparts. This makes sense -- with only two adjacent neighbors, border-hopping isn’t as easy as it is across the pond.
Still, we see a very considerable correlation between U.S. cities’ reliance on international travel and the rate at which they’re rebounding.
While cities with more domestic travelers are averaging a rebound rate of 92%, those more reliant on international guests are averaging just 57%.
U.S. Leisure Destinations
For leisure destinations in the U.S. -- think beaches, ski resorts, and mountain towns -- this theme is even more pronounced: domestically-driven destinations are seeing rebound rates of 322% while internationally-driven spots are seeing 122% new bookings since the depths of the crisis.
Major European Cities
In Europe, the same trend follows albeit a bit less extreme: the fewer international travelers, the better the rebound rate. For the continent of Europe it’s a difference of 57% growth versus 49%.
Reviving the Road Trip: Drive-to Destinations Becoming Safest STR Bets
Beyond the international versus domestic analysis -- it’s also interesting to study the average distance traveled to any given destination around the world. Here’s the breakdown of major U.S. and European cities by the average distance traveled.
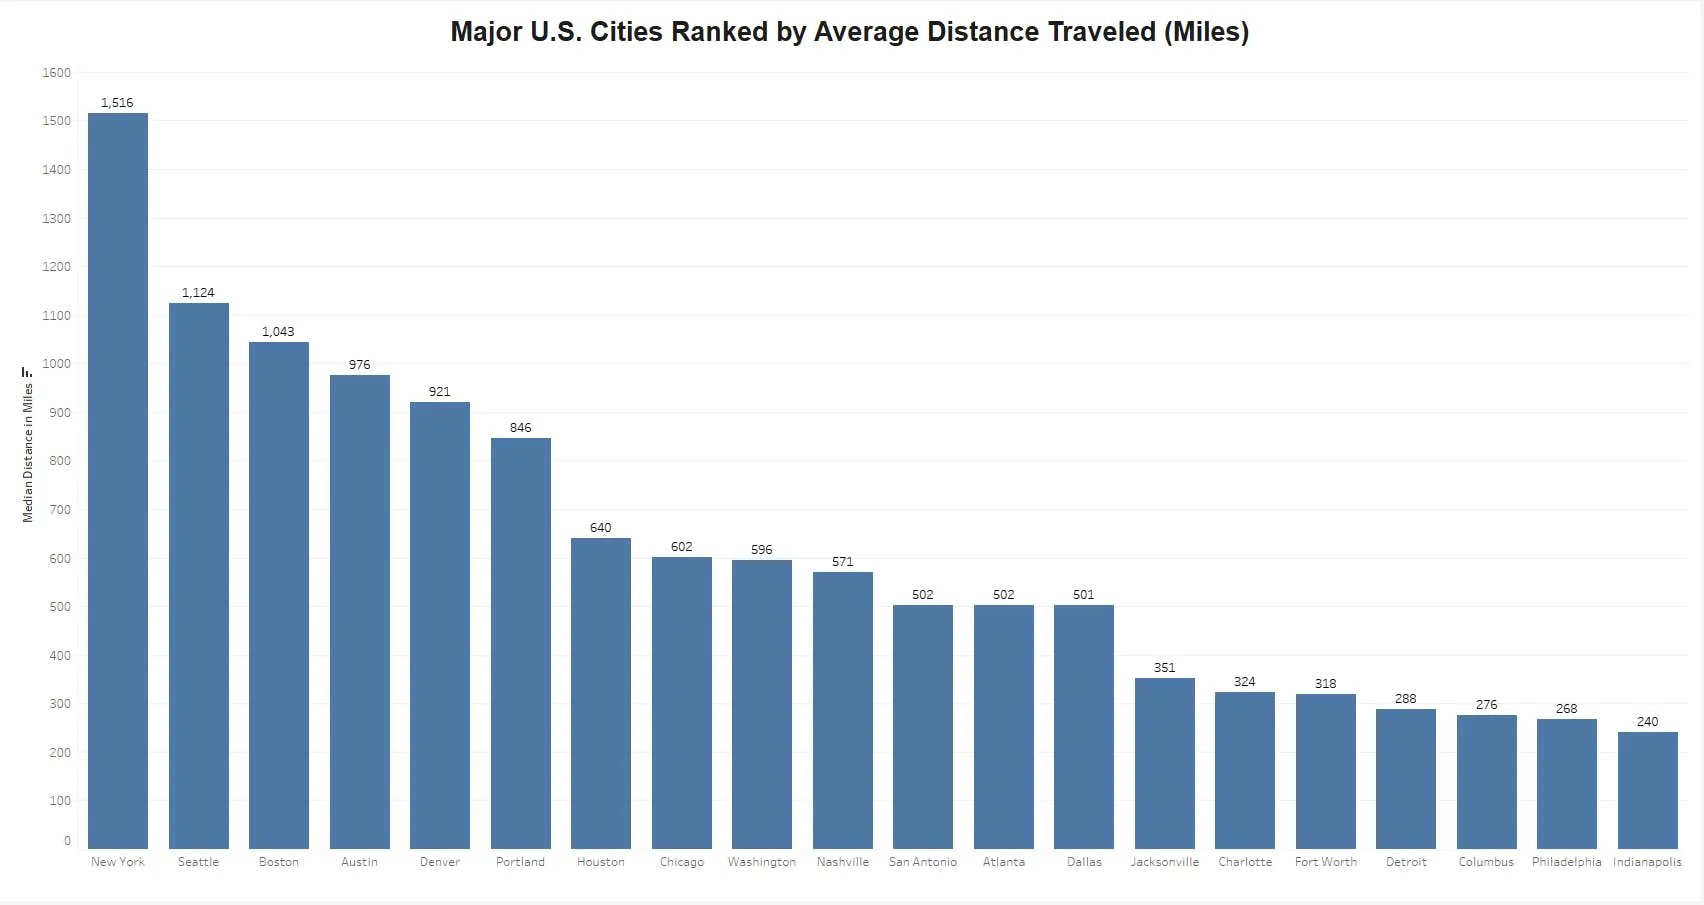
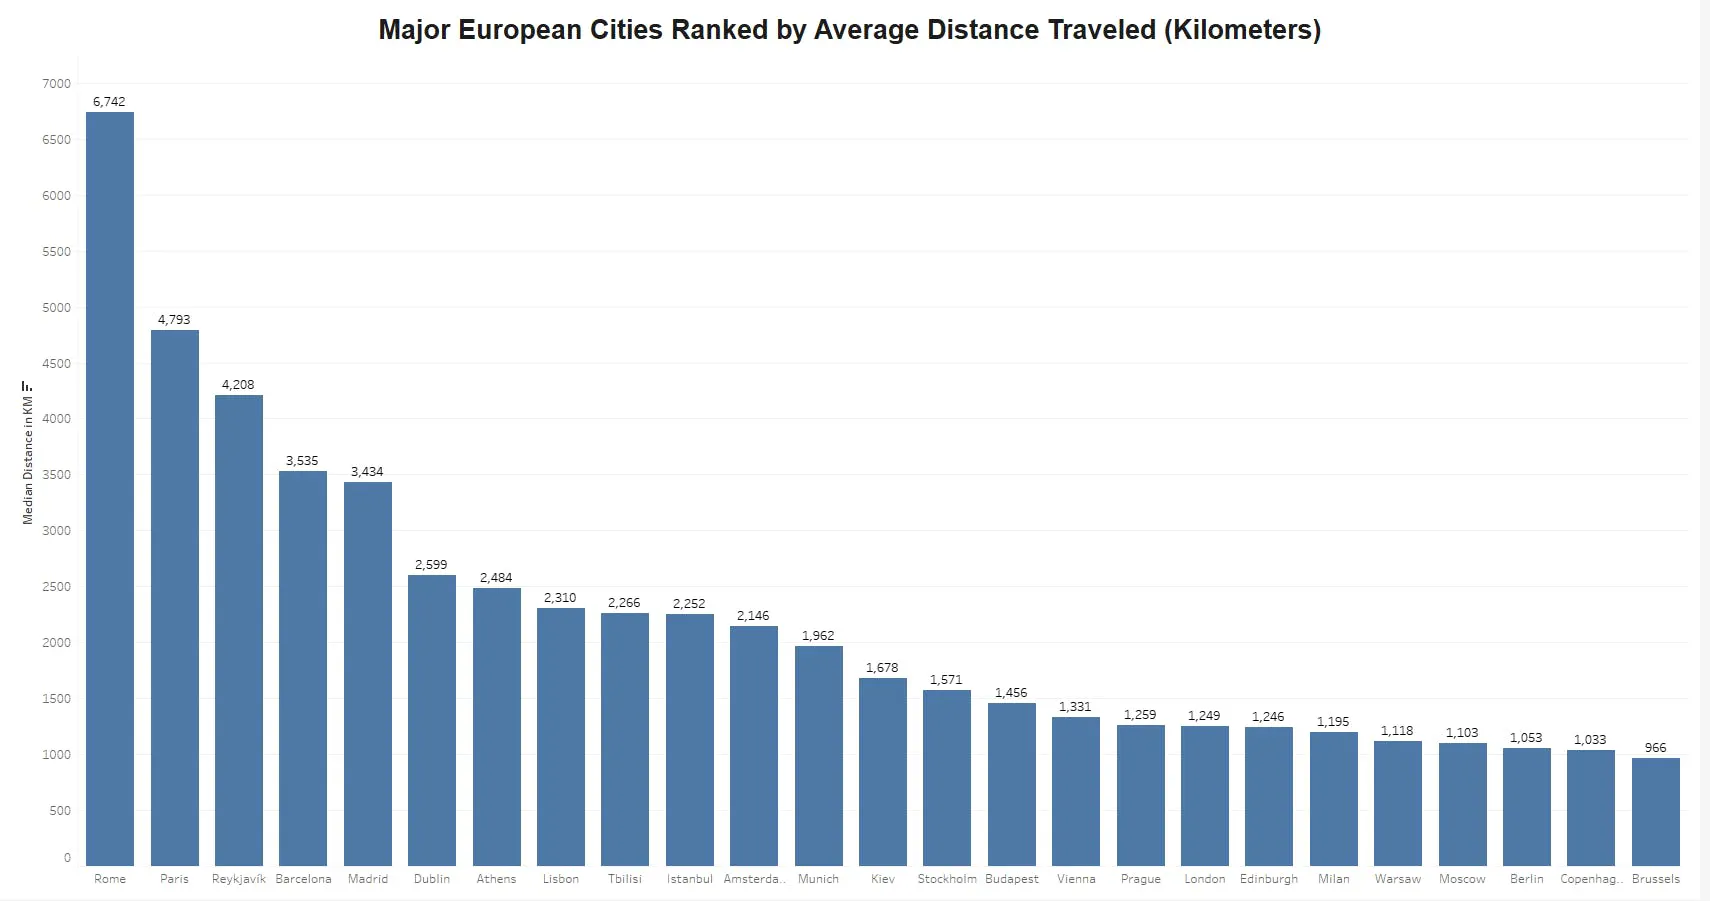
It goes without saying that New York, Seattle, Boston, Rome, Paris -- places that average well over a thousand average miles traveled -- are particularly vulnerable in the current situation.
Now -- look how the dynamics of travel have changed during the era of COVID-19. When comparing average travel distance from April and May of 2019 to April and May of 2020, the discrepancies are profound.
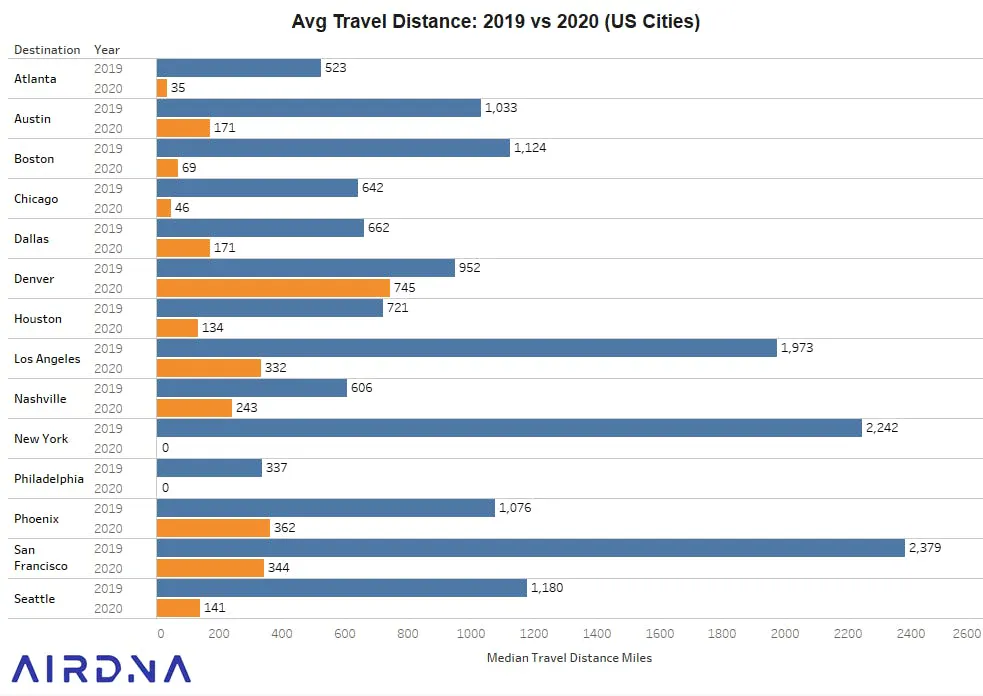
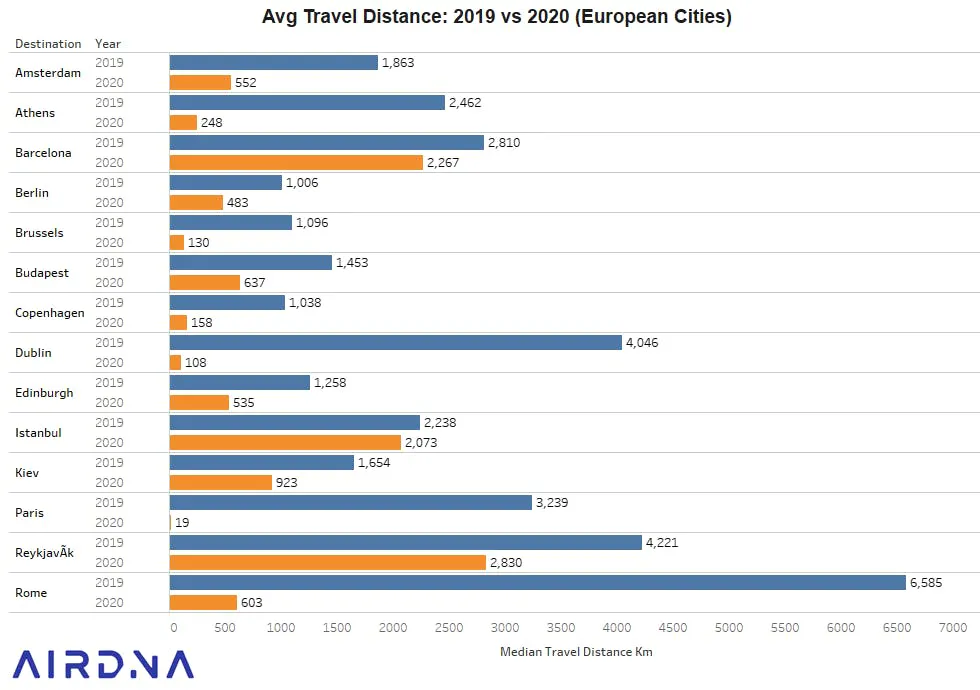
This month, guests headed to Austin are coming from destinations 83% closer than those of 2019. In Seattle -- a city to which travelers average nearly 1,500 miles to reach -- is now welcoming the average guest from just 141 miles away.
Across the board, travel distances are now a fraction of what they were before the Coronavirus. For the 40 cities shown above, the average distance traveled has decreased by 74%. Note: because we've calculated the median, cities showing "0 miles" as the distance traveled means that over 50% of travelers are coming within the city limits.
Outlook for 2020: When Are Guests Booking For?
Data on new bookings is resoundingly clear: guests are booking travel. The question then becomes, “For which dates in the future are they actually reserving?”
Below is a snapshot of the Future Pacing Trend Report for the entire United States. As a "point in time" analysis, here we’re measuring the amount of revenue currently on the books for dates through November of 2020.
We’re then comparing that metric with the same date of the prior year to see how things stood in late May of 2019. This allows us to see how far ahead (or behind) we are of last year’s numbers.
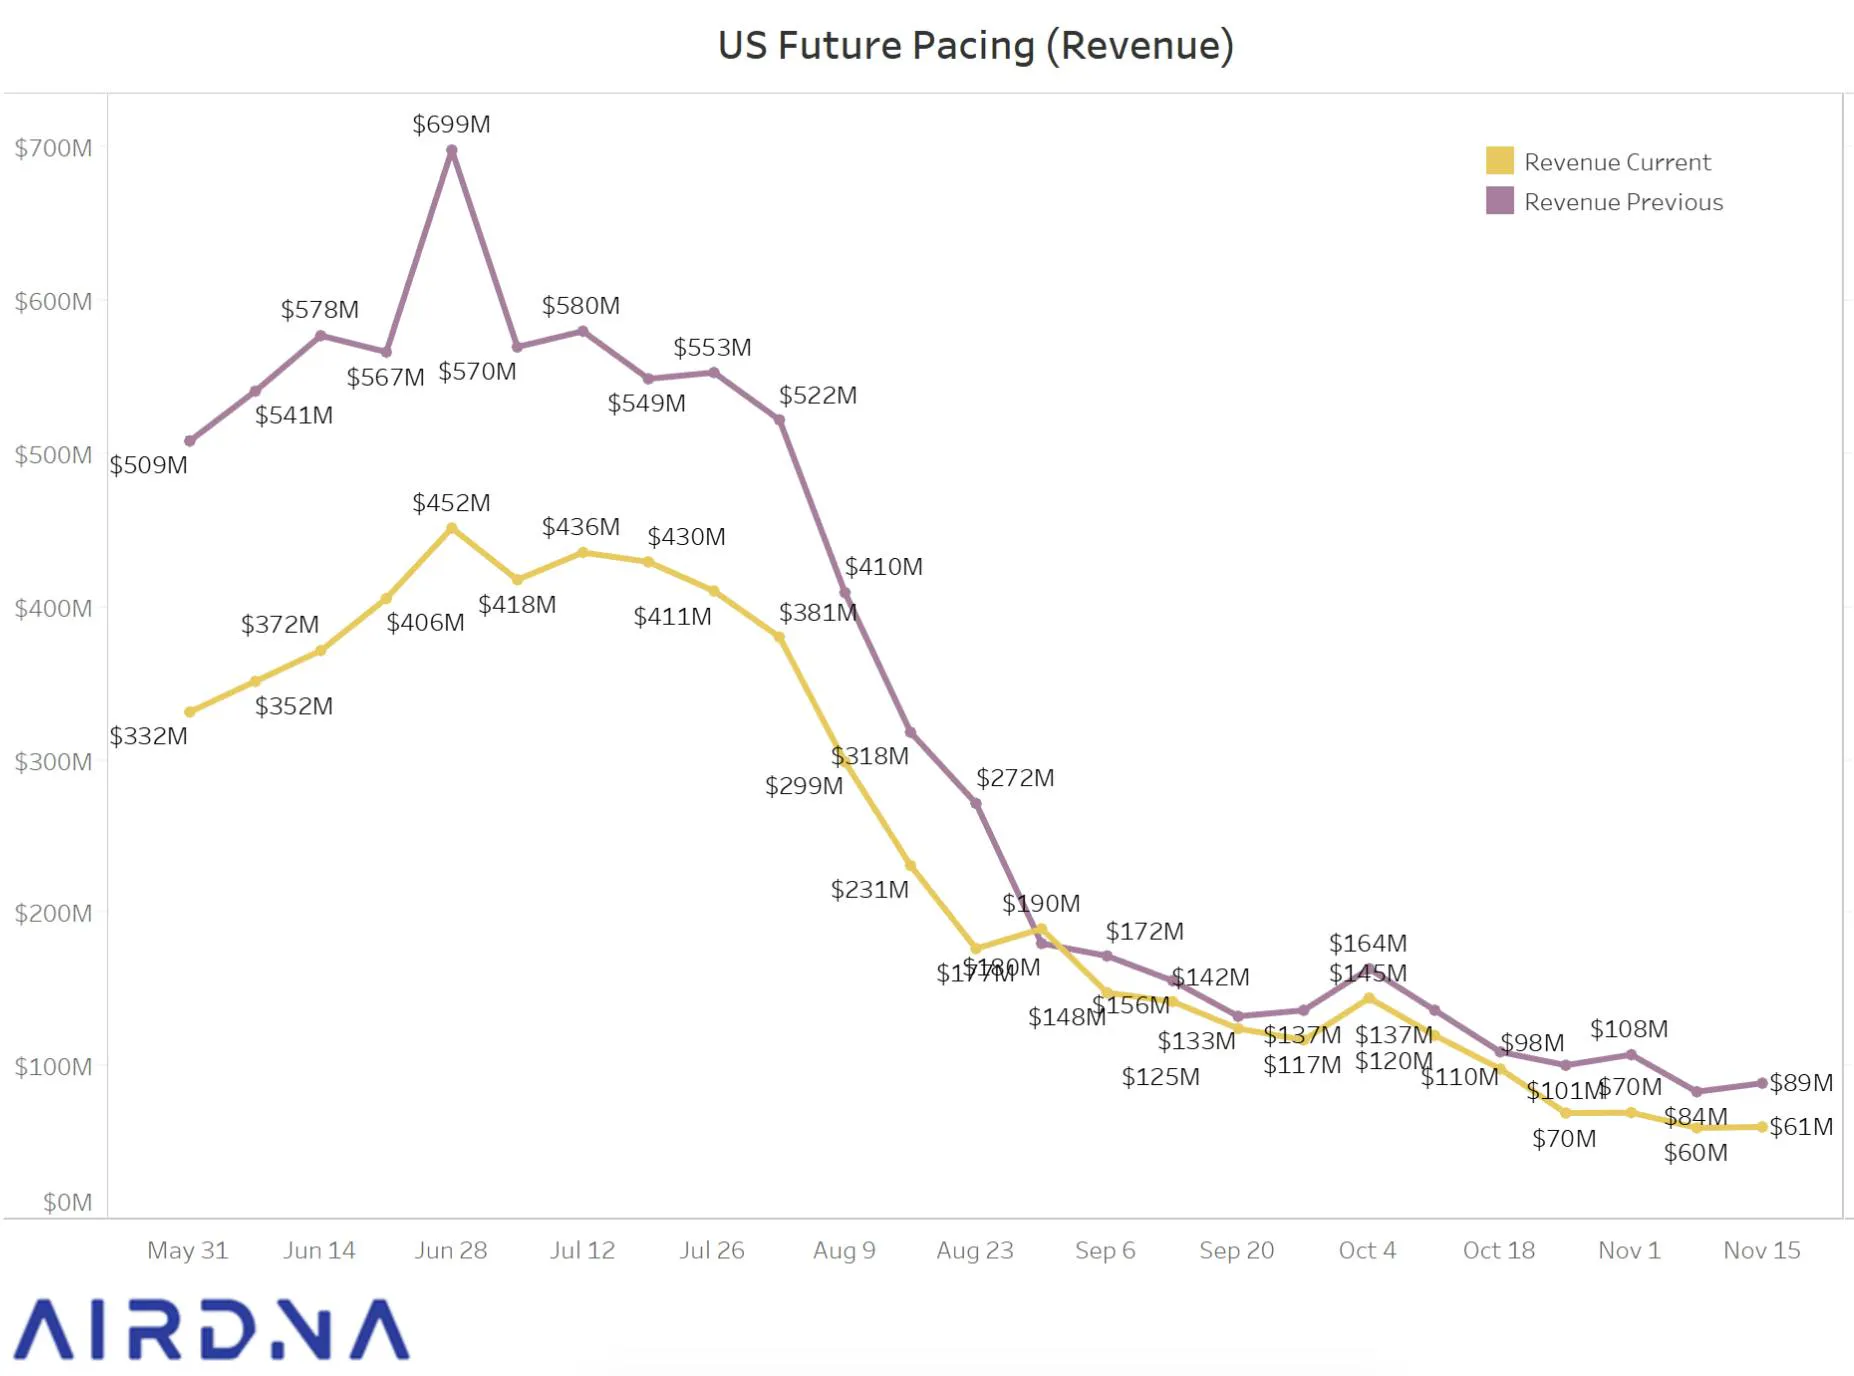
While it’s clear that summer months are receiving far fewer bookings than last year -- what’s interesting to note is a return to normalcy in early September.
At this same point (late May) of 2019, there was just slightly more revenue on the books for the final 4 months of the year. This suggests that despite lockdowns and travel restrictions, guests are actively making reservations for the end-of-year holiday season.
Wrapping Up
Despite a nightmarish start to 2020, it seems that the vacation rental industry is poised for a quick turnaround -- but it’ll likely emerge looking a bit different than the pre-COVID era.
From longer lengths of stay to shorter booking lead times, the dynamics of demand are now clearly in flux. Plus, given the newfound advantage for leisure destinations and those accessible by car, we’re seeing some dramatic shifts in what’s considered a “good” short-term rental market.
Whatever comes of social distancing protocols, it’s clear that vacation rentals have a leg up on hotels. People are looking for space, safety, and comfort, even in the most crowded of urban cities.
Our team at AirDNA will be closely tracking this recovery story over the next few months, so check back in for our follow-up report shortly.
Dillon DuBois
AirDNA Senior Product Manager
Dillon DuBois is a seasoned expert in the short-term rental space, having worn many hats at AirDNA since joining in 2019. From driving B2B marketing initiatives to shaping product strategy, Dillon’s deep understanding of both the company and the industry makes him a key player in delivering innovative solutions. Now a Senior Product Manager, he leverages his experience to bridge the gap between data and user needs. He manages his own short-term rental in Medellín, Colombia, and enjoys all things outdoor adventure, travel, cooking, & surfing.