


U.S. Review November 2024: Demand Growth Drives Pricing Power and RevPAR Recovery
Published: December 17, 2024
Last updated: November 13, 2026

Scott Sage

Key Takeaways
- November demand growth pushed occupancy up 3.4% YOY, outpacing slowing supply growth (+3.9%).
- November’s 7.0% ADR growth, the highest since early 2022, reflects strong pricing power fueled by rising occupancy.
- December bookings are up 13.5% YOY, with 21 U.S. markets already 70% booked for the holidays.
November’s data reflects the continuation of positive trends that have taken shape since a strong summer season solidified 2024 as a recovery year for short-term rentals. Demand growth accelerated enough to drive a year-over-year (YOY) increase in occupancy for November, while also nudging year-to-date occupancy slightly above last year’s levels.
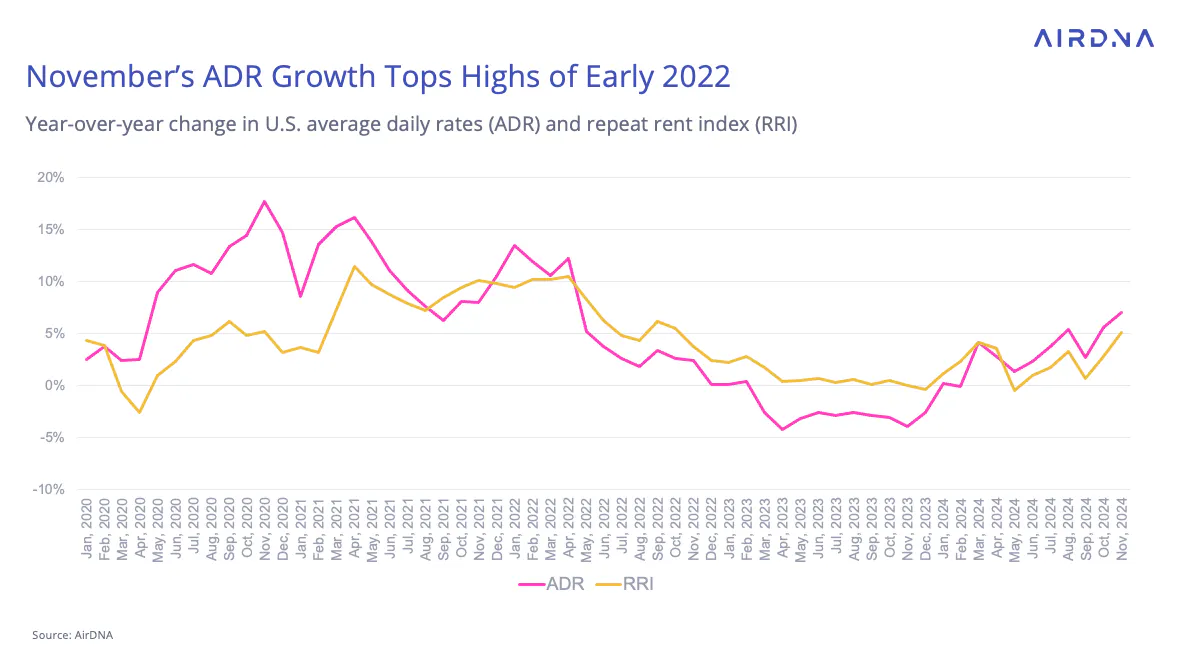
Even more encouraging for operators was the strong 7.0% increase in average daily rates (ADR). This is the largest gain in 2024’s fluctuating trend of accelerating rate growth.
Since revenue per available rental (RevPAR) is calculated by combining occupancy rates and ADR, gains in both metrics are driving a promising reversal of recent setbacks. This momentum signals a return to steady RevPAR growth after declines in 2022 and 2023.

Employment and Inflation’s Impact
Inflation increased slightly in November, driven primarily by the increased cost of shelter. The consumer price index (CPI), a widely used measure of inflation reported by the Bureau of Labor Statistics (BLS), rose 2.7% year-over-year (YOY), edging up from October’s 2.6%.
This increase isn’t ideal, but it wasn’t unexpected. Economists anticipated this uptick and it shouldn’t stop the Federal Reserve from cutting its target rates in December.
In November, the U.S. unemployment rate edged up slightly to 4.2% from October’s 4.1%. Despite this, the Fed is expected to pause additional rate changes after December’s anticipated cut to assess how previous reductions are affecting the economy.
While the Fed directly controls the federal funds rate—the overnight lending rate between banks—it takes time for these changes to ripple through the economy. Lowering the federal funds rate eventually reduces other borrowing costs, such as mortgage or business loan rates, which then take even longer to influence broader economic activity.
The newly-elected second Trump administration is introducing policies that could add to inflationary pressures. Looser fiscal policy through tax cuts and increased government spending are designed to stimulate the economy—but doing so when it’s already operating near full potential risks driving up prices.
Additionally, the president-elect’s promise to enact tariffs may further contribute to inflation by increasing the cost of imported goods. Given these factors, the Federal Reserve is likely to adopt a cautious approach to further rate cuts, balancing economic stimulation with the need to manage inflation effectively.
At a Glance: Key U.S. STR Performance Metrics for September 2024
- Revenue per Available Rental (RevPAR) increased 10.7% year-over-year (YOY) to $144.19
- Available listings were 1.68 million, up 3.9% YOY
- Total demand (nights) rose 5.8% YOY
- Occupancy was 3.4% higher YOY at 48.9%
- Average Daily Rates (ADR) increased 7.0% YOY to $294.79
- Repeat Rent Index (RRI) increased by 5.0% YOY
- Nights booked increased by 4.7% YOY

Listing Growth Accelerates Slightly But Is Still Low
Available listings grew by 3.9% in November, marking the third consecutive month of modest growth in the 4% range. Listing growth has steadily slowed since the Federal Reserve began raising interest rates in March 2022 to combat global inflation. Higher borrowing costs have created a barrier to new investments. With house prices remaining high, the development of short-term rentals (STR) has become notably more expensive compared to just a few years ago.
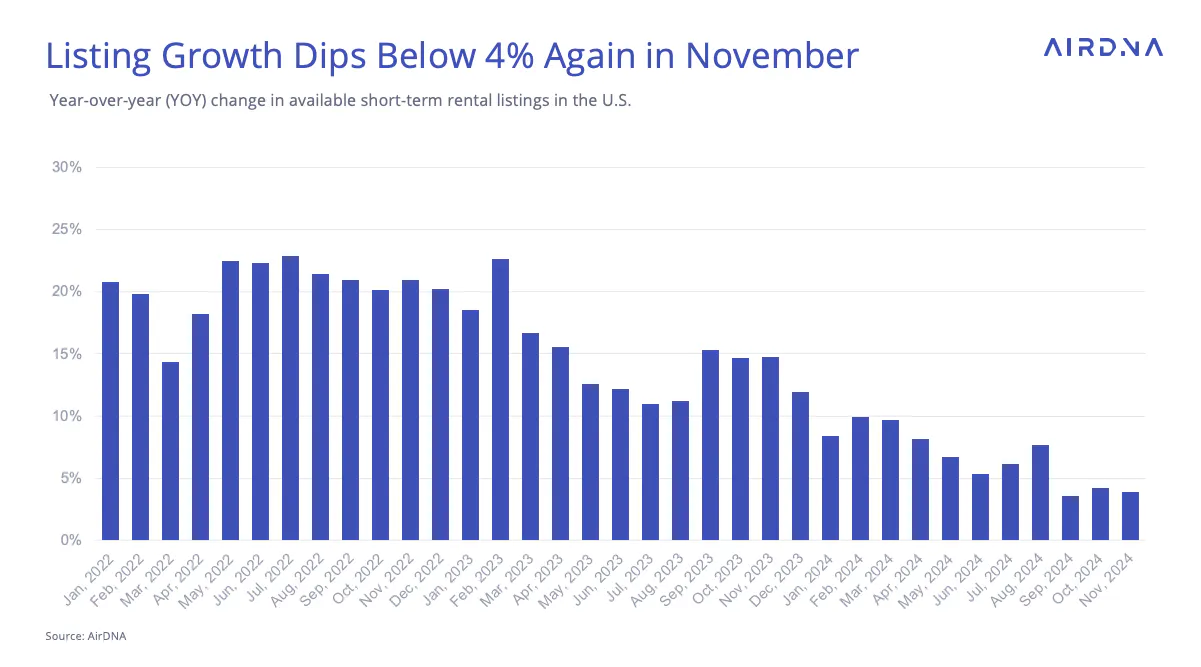
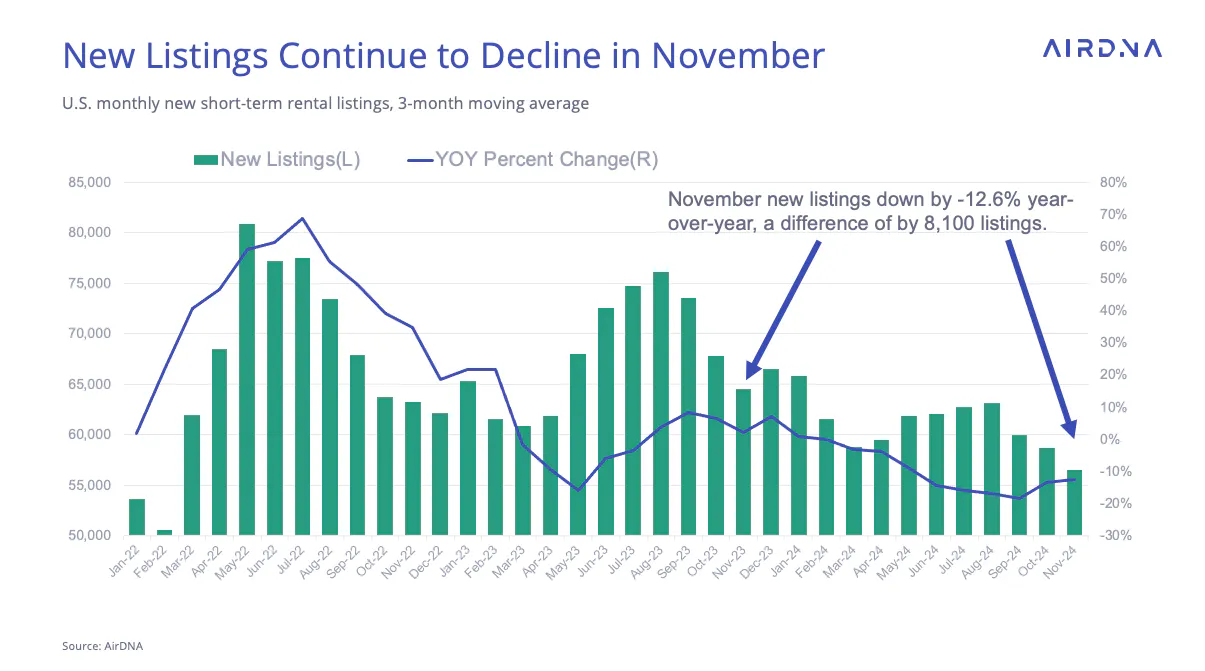
The challenges of expanding the STR market are evident in the slower growth of new listings, which have been entering the market at a significantly lower rate than last year since March.
While the growth rate of new listings has improved slightly—rising from a low of -18.5% in September to -12.6% in November—this modest recovery is largely due to a late-season surge in 2023. This surge created a high baseline for year-over-year (YOY) comparisons for June through September in 2024.
The current figures, while representing a relative slowdown in listing growth, seem especially weak when compared to the artificially high growth rates from the same period last year.
Demand Growth Surges, Boosting Occupancy
Supply nights, which can be understood as the total number of nights that STR listings are open for booking, have seen slowing growth after a brief resurgence in the second half of 2023. This metric peaked at a 10.6% growth rate in February but has since declined to 2.3% in November.
Meanwhile, demand growth is gaining momentum in response to positive economic news over the past year. As inflation declined and real incomes recovered, travelers resumed making more vacation plans. Demand growth has been generally accelerating since dropping to -1.8% in March and April of 2023.
January of 2024 saw weak demand growth, driven by low snowfall and a cold snap that discouraged travel across much of the country. April and September also faced challenges due to unfavorable calendar shifts. However, demand growth throughout the rest of this year has been significantly stronger compared to 2023.
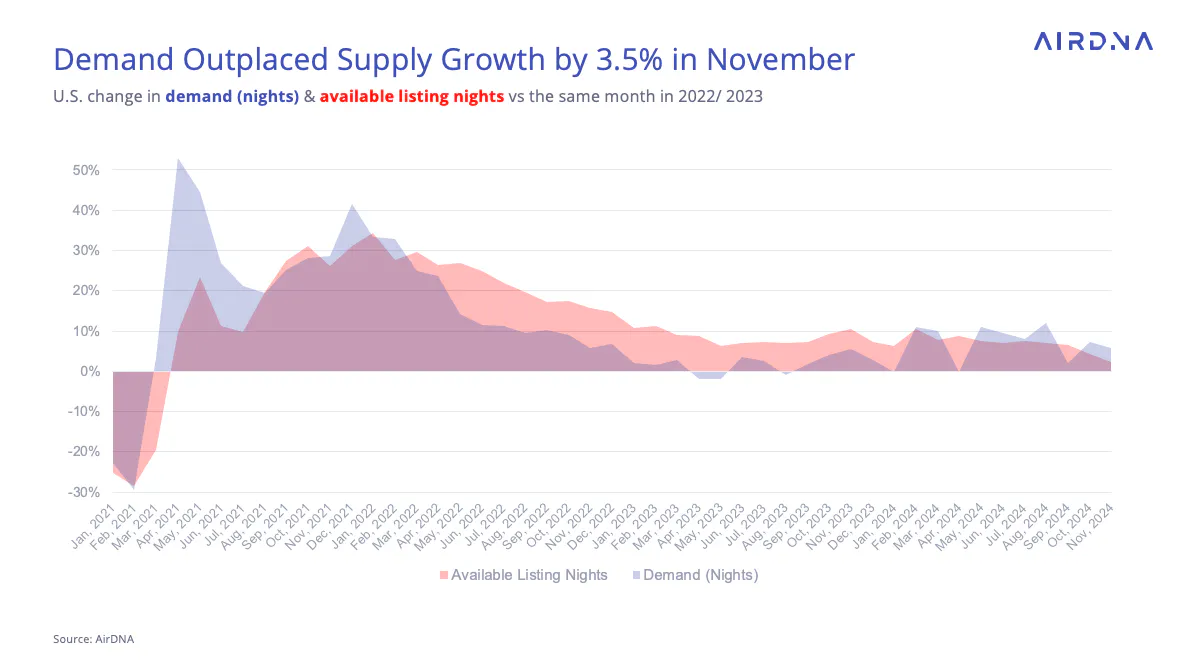
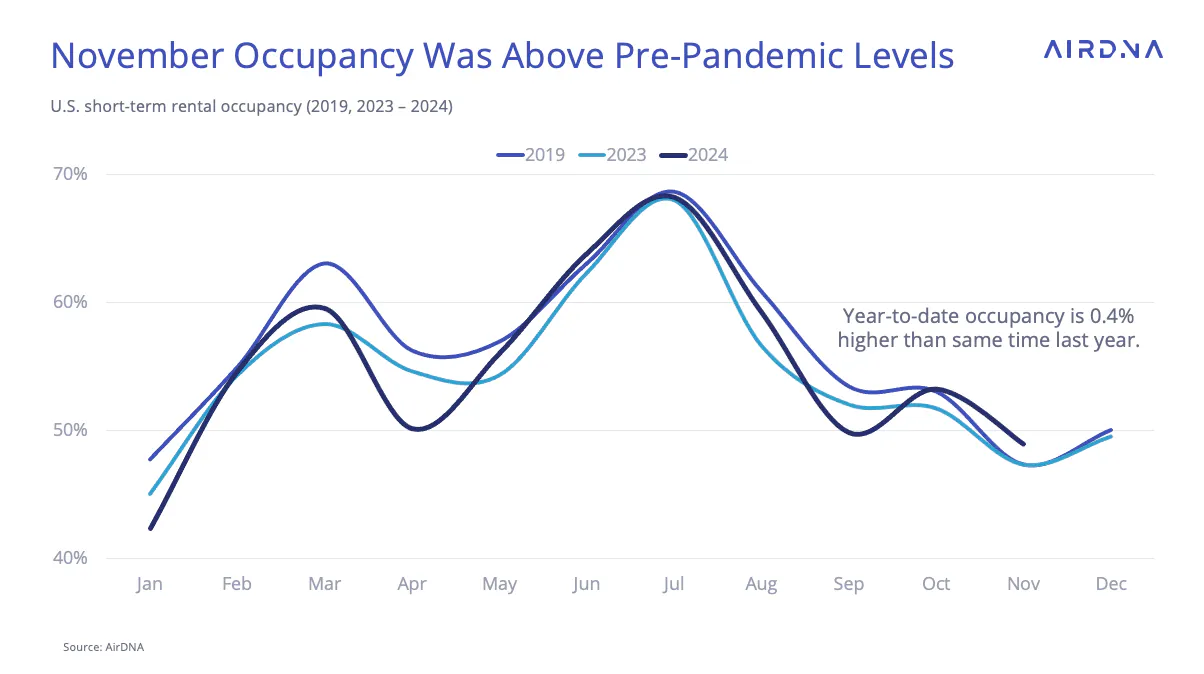
As supply night or available night growth continues to slow and demand growth accelerates, occupancy has stabilized. Due to calendar fluctuations this year, 2024’s year-to-date occupancy has alternated between slightly above and below 2023 levels. The two series were essentially neck-and-neck in October.
November saw a notable gain in occupancy, pushing it 3.4% higher year-over-year (YOY) and above 2019 levels. This increase also nudged year-to-date occupancy marginally ahead of 2023.
Hosts’ Pricing Power Increases with Occupancy
The most dramatic reversal in performance has been the recent rise in average daily rate (ADR) growth. Throughout much of 2023, ADR declined—partly due to a mix shift, which occurs when changes in the types of properties entering or leaving the market artificially raise or lower the average rate.
Mix shift pulled down overall ADR, as the composition of listings tilted toward more affordable options. By early 2024, the situation began to stabilize. ADR had fully reversed its downward trend by March, posting a 4.1% year-over-year (YOY) increase.
November’s growth of 7.0% was the strongest monthly ADR increase of 2024 and the highest growth rate since early 2022. This turnaround highlights a key dynamic for operators: stable or rising occupancy rates are critical to maintaining pricing power. When occupancy is strong, hosts have more flexibility to raise rates without sacrificing bookings.
This connection became particularly evident following the peak performance of 2021, when demand surged to unprecedented levels. At that time, ADR growth began to stall, even as inflation and broader price levels climbed. The reason? Occupancy had already maxed out in many markets, leaving little room for further price increases.
Mixed Trends in Occupancy and Rates Across Location Types
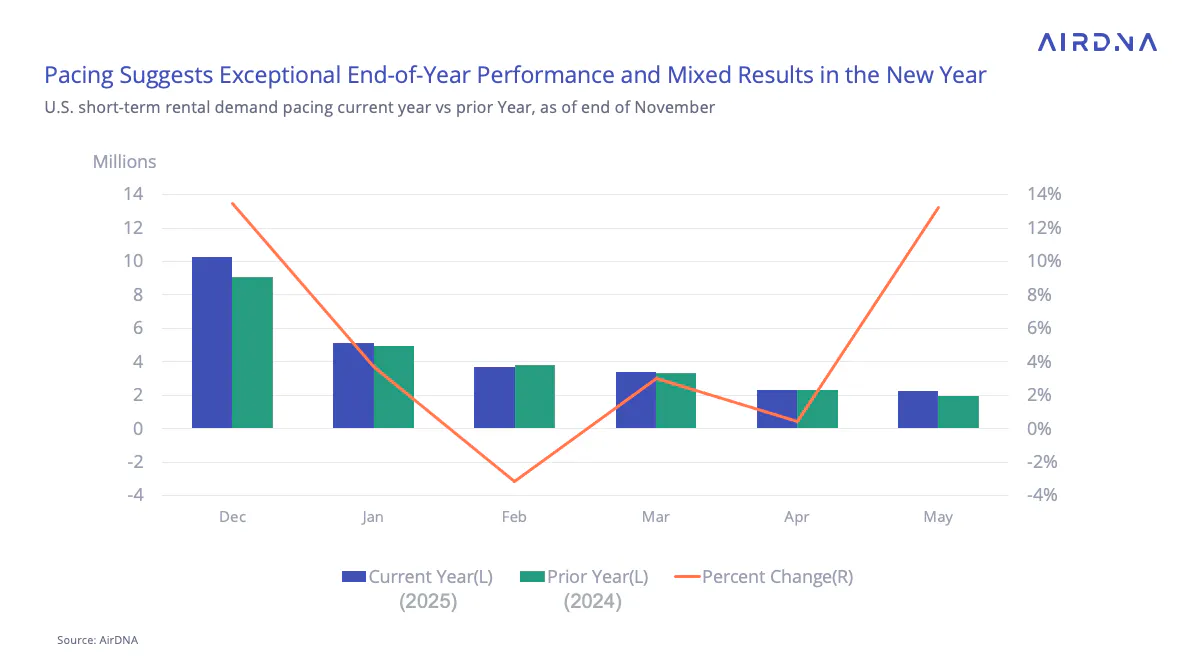
Looking ahead, the outlook for the holiday season is particularly strong. We gauge this by looking at “on the books” demand, or reservations that have already been made for future dates. This measure, also known as pacing, tracks the current rate of bookings for upcoming dates relative to the same point in prior years. Pacing serves as a leading indicator of future performance.
December pacing data shows exceptionally strong demand, up 13.5% compared to 2023. This surge could be driven by the unique timing of the holidays, with Christmas and New Year’s Day both falling on Wednesdays, which may be encouraging extended long-weekend travel. Additionally, many travelers may be looking to squeeze in one last vacation before the year ends.
In contrast, demand pacing for early 2025 is more subdued. January pacing shows a modest increase of +3.7% year-over-year (YOY), while February pacing dips to -3.2%. The decline in February is partially due to the month being one day shorter in 2025 compared to 2024. However, February demand appears flat even after accounting for this calendar difference.
These figures may ultimately hinge on several variables, including weather conditions and snowfall in winter destinations. Households may also be reassessing their budgets following the New Year holiday.
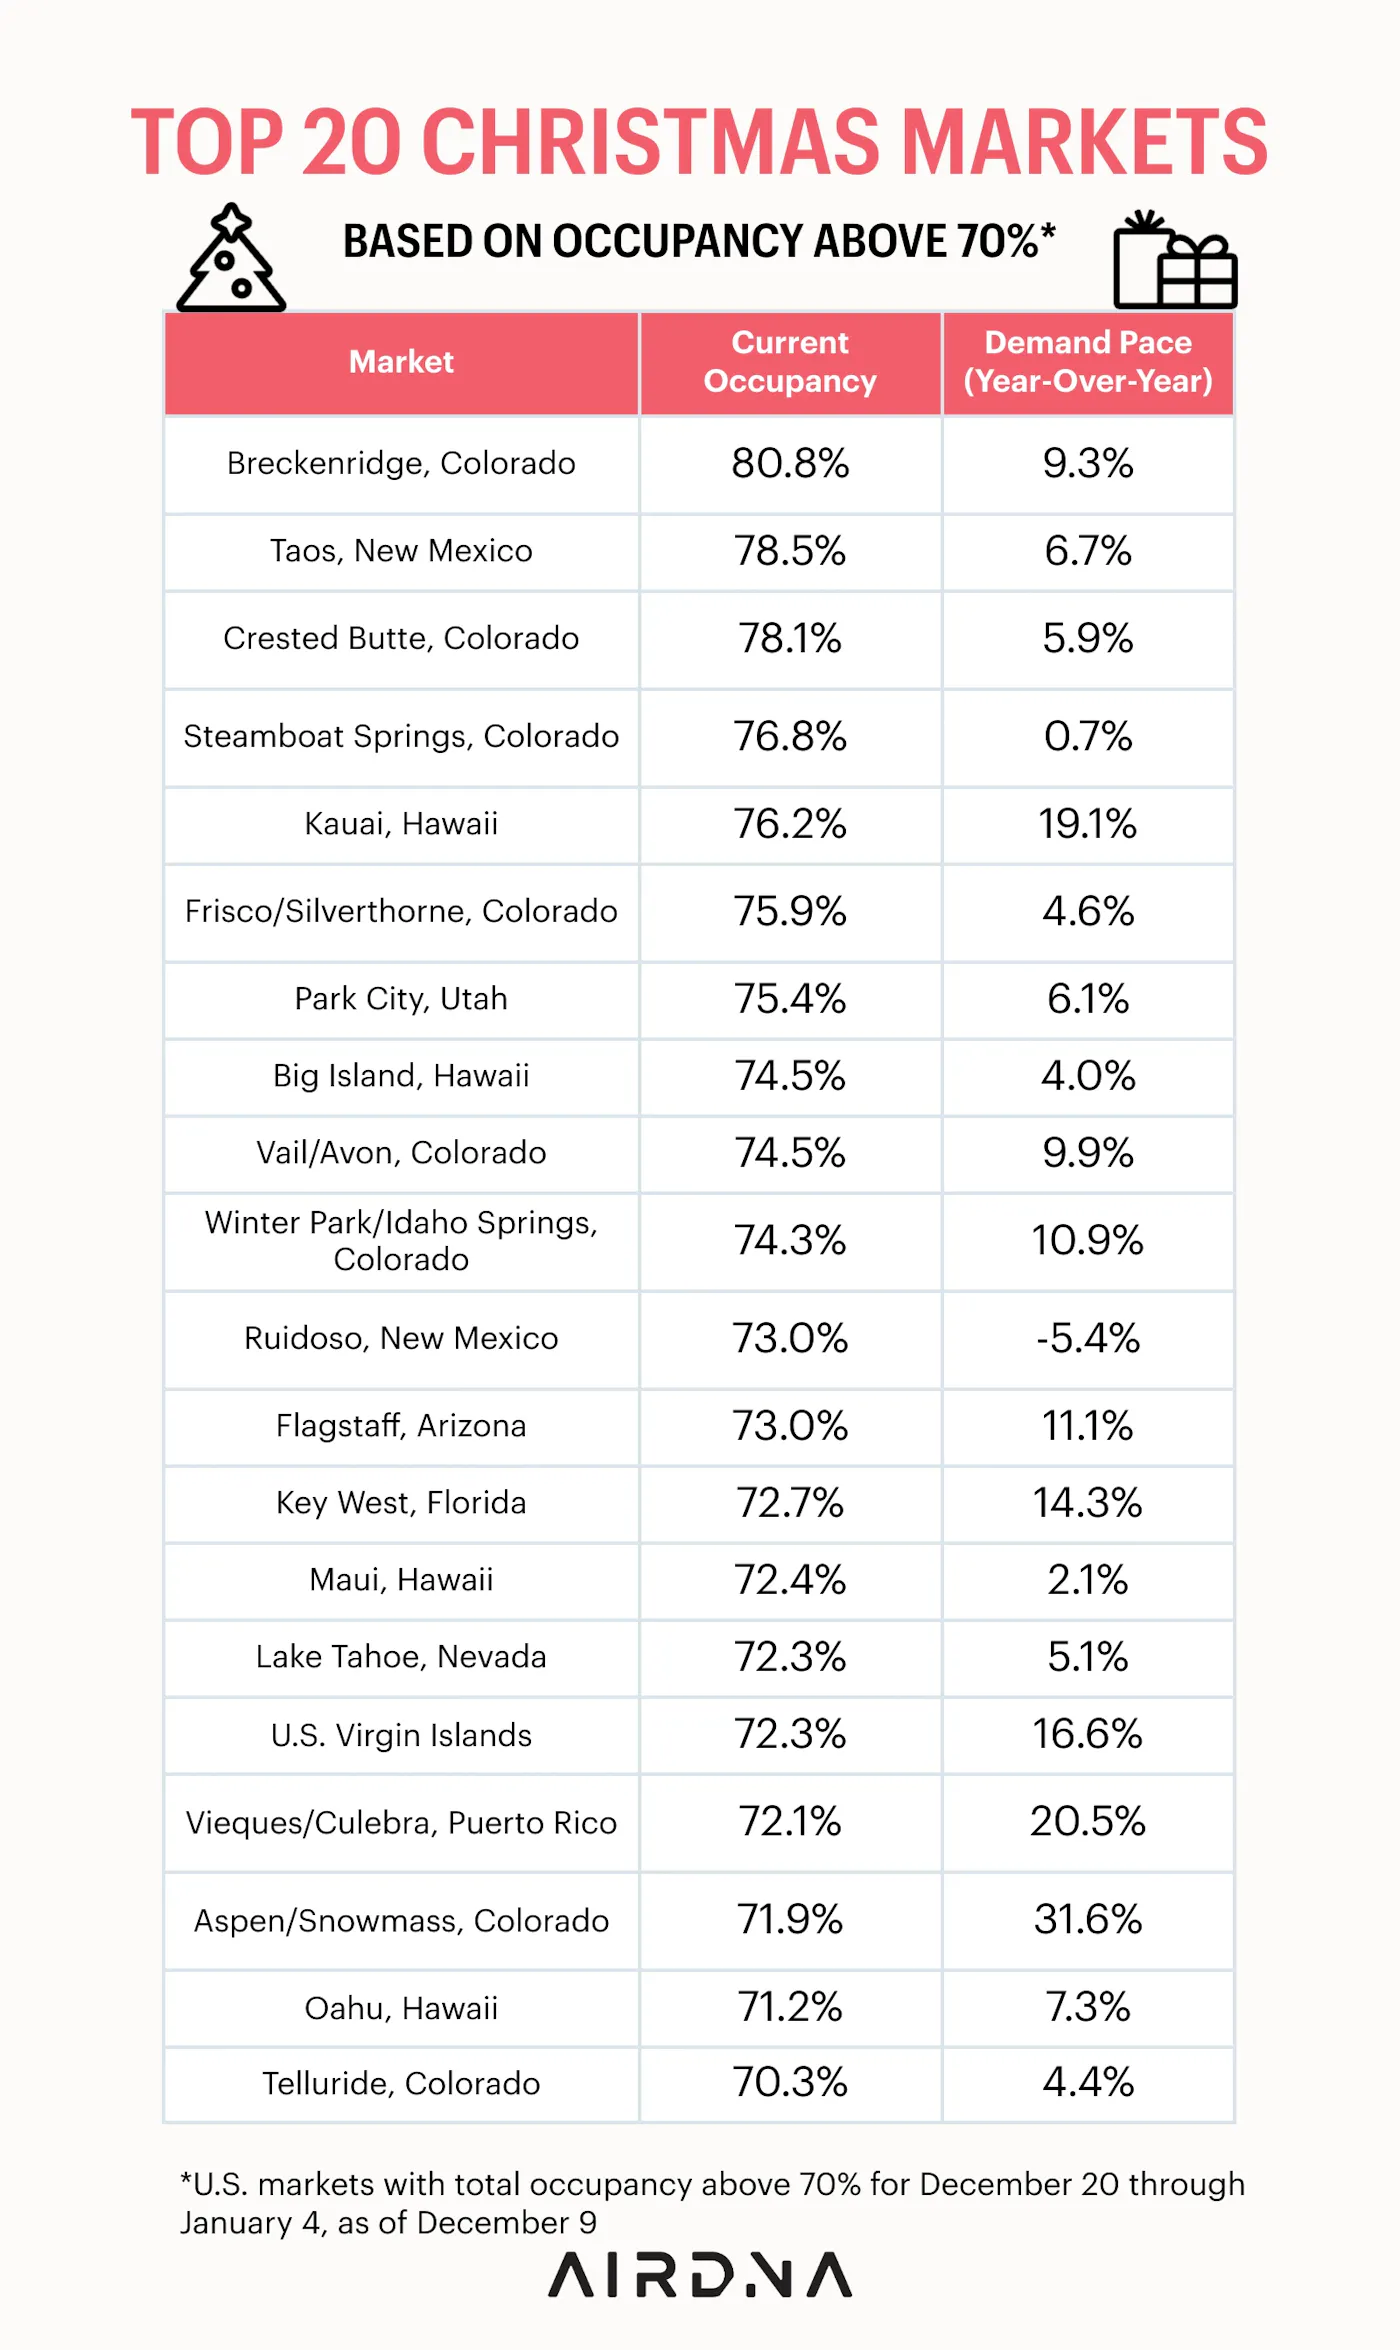
If you’re planning to spend the holidays at a top ski resort or a sunny island beach, now is the time to book—many of these popular destinations are filling up quickly. As of December 9, 21 U.S. markets already have 70% or more of their available nights booked for the holiday period spanning December 20, 2024, through January 4, 2025.

The unique timing of Christmas and New Year’s Day falling on Wednesdays this year is spreading out demand across the full 15-day period, rather than the typical 11 days seen in previous years.
This extended window is likely driving additional demand. Many of these 21 markets are also experiencing significant year-over-year (YOY) gains compared to the same period in 2023. The one exception is Ruidoso, New Mexico, where demand pacing has been slightly slower.
How is your STR performing?
Your vacation rental may be amazing, but is it better than your competition? Connect your Airbnb listing to AirDNA to see its Booking Performance Score.
See your scoreARTICLE SUMMARY
November’s STR performance highlights a market regaining momentum, with rising demand driving occupancy and pricing power higher. As the holiday season approaches, extended travel windows and strong advance bookings signal a strong finish to 2024.
Scott Sage
Senior Vice President, Marketing & Customer Experience
Scott is an Airbnb Superhost and industry pro, having founded Home Base BnBs—a short term rental management company that scaled to 200+ units. Scott combines his experience and passion for hosting to empower AirDNA customers' success. When he's not thinking about STRs, he is hiking, playing basketball, or playing pickleball.



Get started with AirDNA today.
Powerful, easy-to-use tools that help hosts and investors succeed in the short-term rental market.
Try for free