U.S. Review October 2024: Demand Surges Amid Slowing Supply Growth
Published: November 18, 2024
Last updated: February 26, 2025

Bram Gallagher
Key Takeaways
- Slowing supply growth and resurgent demand in October sets 2024 on track to exceed 2023 occupancy levels.
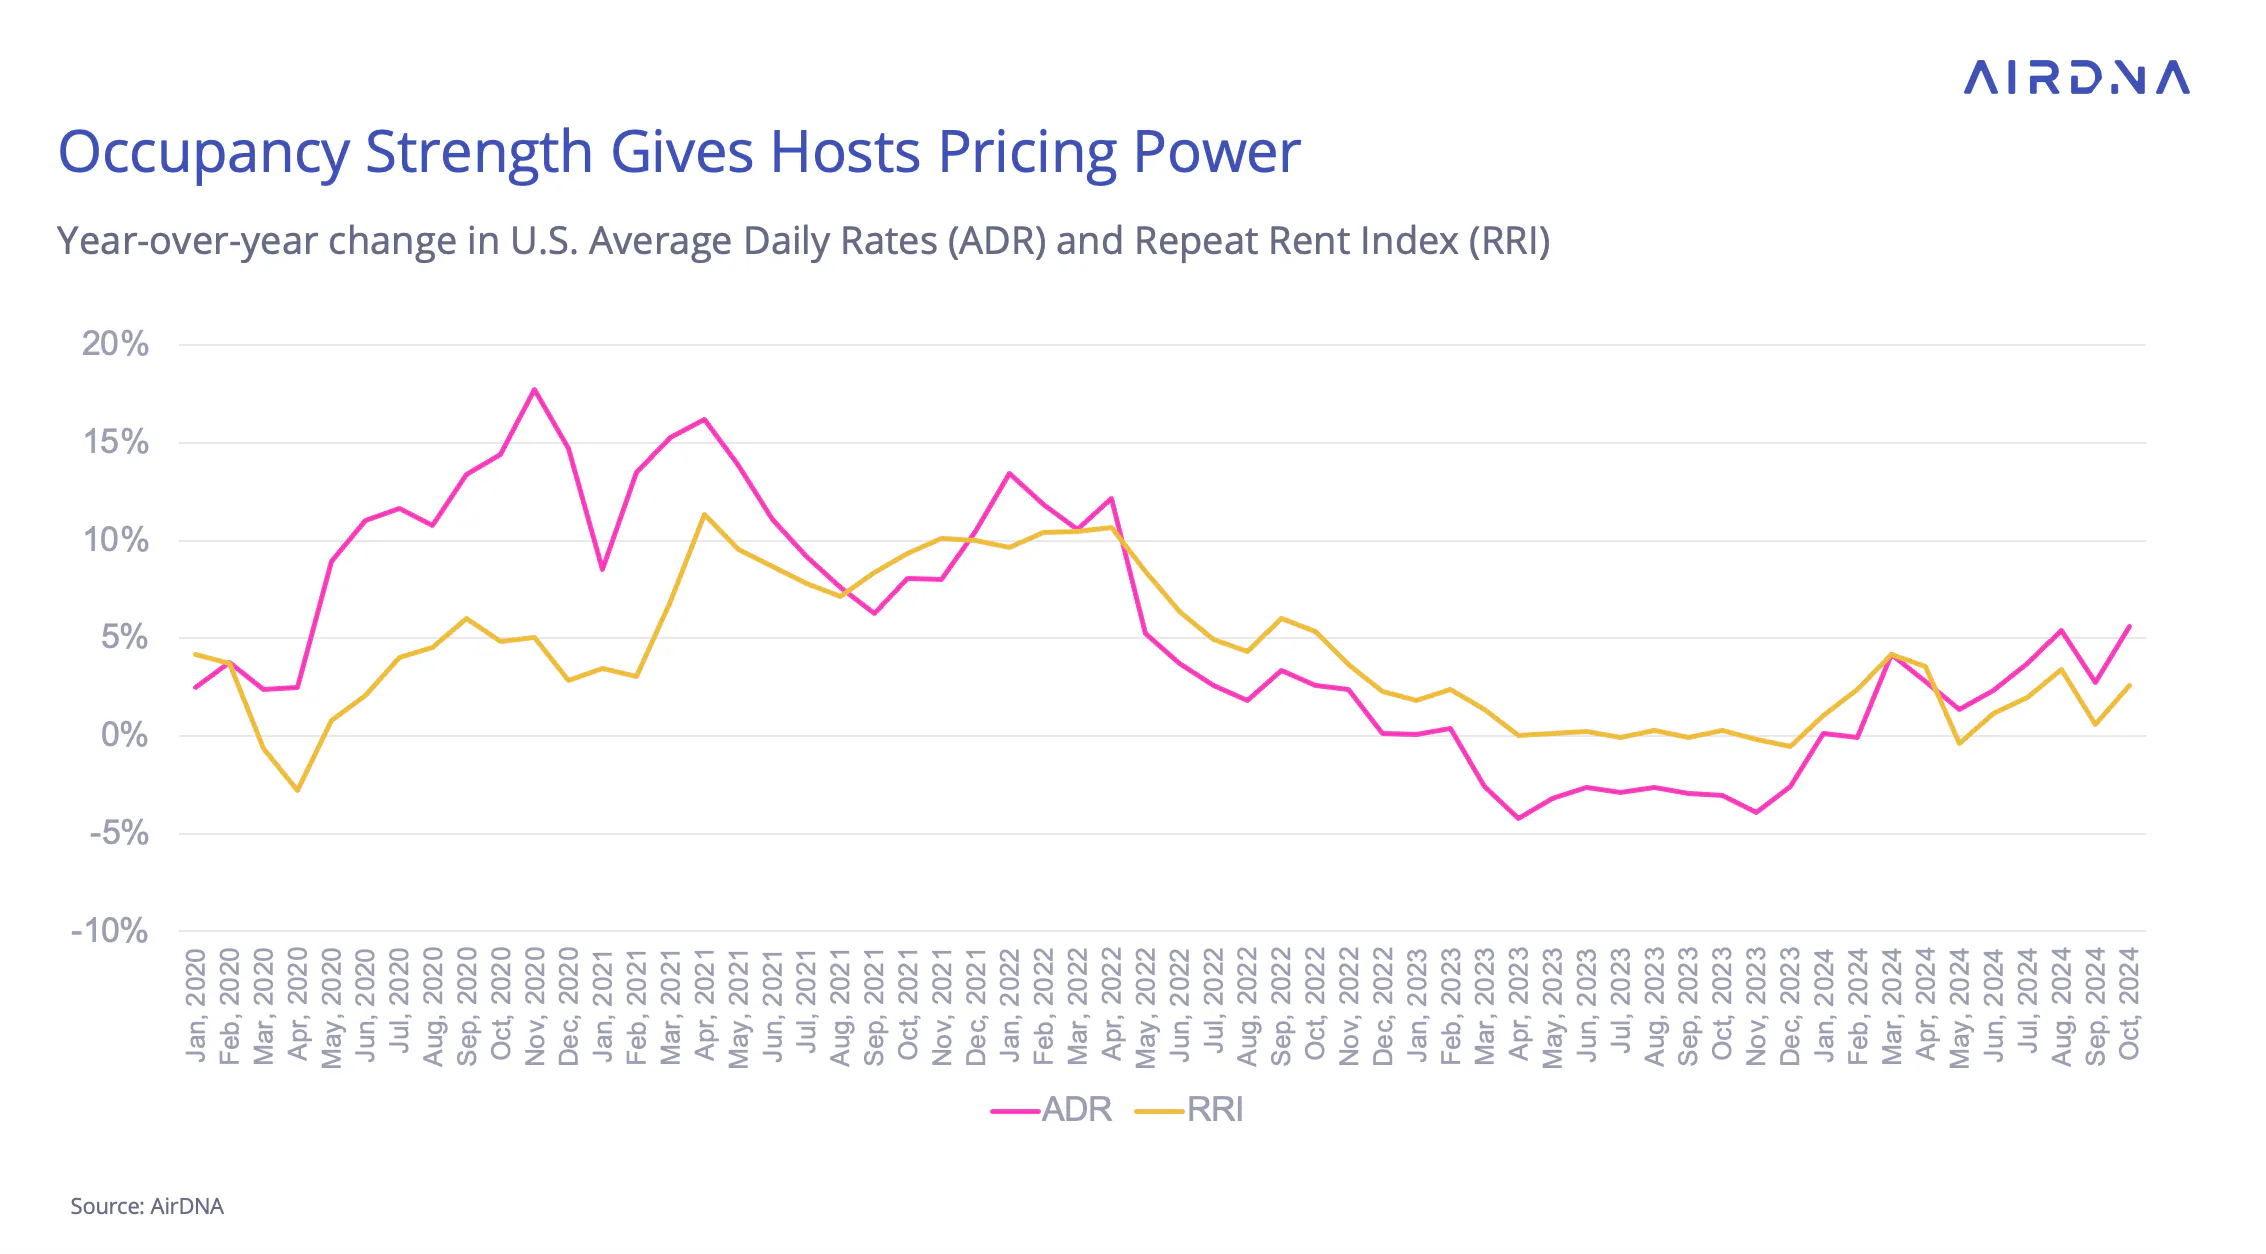
- Hosts are regaining pricing power, with ADR rising 5.6% YOY in October.
- November demand pacing is subdued due to Thanksgiving’s late date, but December shows strong momentum.
After record-breaking performance in 2021 as Covid restrictions eased, unit-level metrics—especially occupancy—have been declining for two years. This year, however, tells a different story.
Supply growth has slowed, driven by high home prices and mortgage rates, while demand growth has rebounded. October’s data now shows 2024’s year-to-date occupancy nearly matching 2023’s, and with two months of positive pacing ahead, a slight annual increase in occupancy looks likely.
Employment and Inflation’s Impact
Inflation, as measured by year-over-year (YOY) changes in the Consumer Price Index (CPI), ticked up slightly in October, rising from 2.4% in September to 2.6%. However, this modest increase wasn’t enough to prevent the Federal Reserve from issuing another rate cut in early November. Following the significant rate cut in September, it’s clear that monetary easing is well underway—and perhaps just in time.

The October jobs report from the Bureau of Labor Statistics highlighted a sharp slowdown in the labor market, with only 12,000 jobs added. This figure fell far short of the 100,000 jobs anticipated by economists and marked a big drop from the 223,000 jobs added in September.
The October jobs report was influenced by hurricane-related displacement and a high-profile strike by Boeing workers. Despite these disruptions, the unemployment rate held steady at 4.1%. The Federal Reserve continues to walk a fine line between reducing inflation and maintaining its full employment mandate.
While high interest rates have succeeded in curbing inflation, they’ve also placed pressure on businesses to scale back activity. AirDNA believes the Fed now considers its inflation goals largely achieved and is shifting its focus to preventing a sudden downturn in the labor market.
Adding to the economic uncertainty are the outcomes of the recent U.S. federal election. With Donald Trump’s return to the presidency and GOP control across all branches of government, policy changes could be on the horizon.
Potential plans, such as fiscal stimulus and increased international tariffs, may reignite inflationary pressures. While it’s too early to predict specifics, Oxford Economics projects that interest rates could remain elevated for longer to balance these factors. This would likely keep entry into the STR market more challenging and supply growth subdued.
At a Glance: Key U.S. STR Performance Metrics for September 2024
- Revenue per Available Rental (RevPAR) increased 8.5% year-over-year (YOY) to $153.97.
- Available listings were 1.71 million, up 4.4% YOY
- Total demand (nights) rose 7.5% YOY
- Occupancy was 2.9% higher YOY at 53.2%
- Average Daily Rates (ADR) increased 5.6% YOY to $289.55
- Repeat Rent Index (RRI) increased by 2.6% YOY
- Nights booked increased by 12.4% YOY
Listing Growth Accelerates Slightly, But Still Low
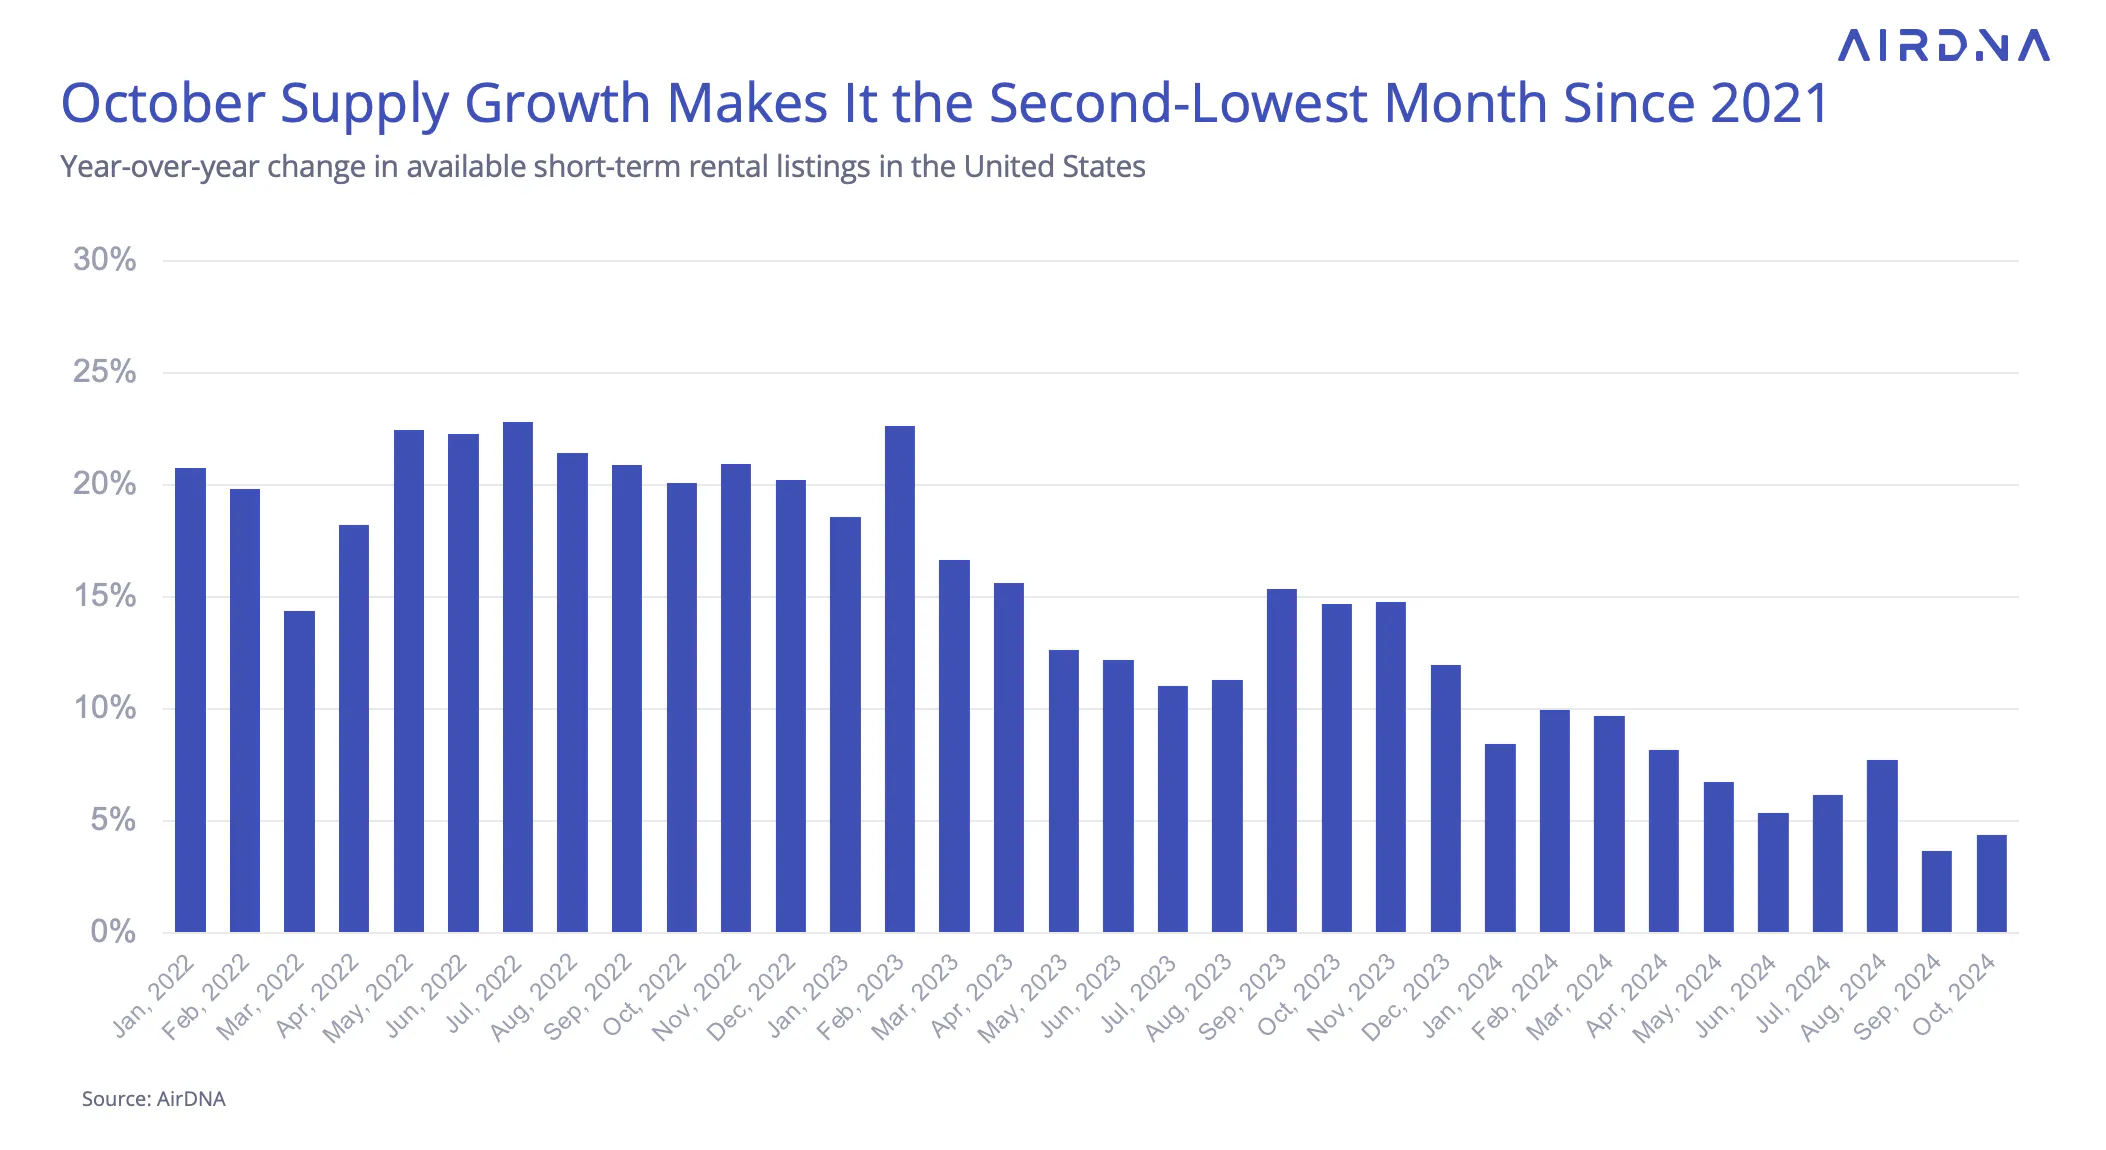
September saw the lowest growth in available listings since the onset of the pandemic, and October wasn’t far behind, recording the second-lowest growth rate. With high interest rates slowing the housing market to a near standstill, the rapid supply expansion of 2022 has cooled.
While supply growth appeared to pick up slightly in August, this was likely due to a calendar shift for Labor Day, which moved some seasonal listings from September into August. This same shift contributed to September’s particularly low growth rate. However, October’s similarly sluggish performance points to a broader, long-term trend of slowing supply growth that has persisted for nearly two years.
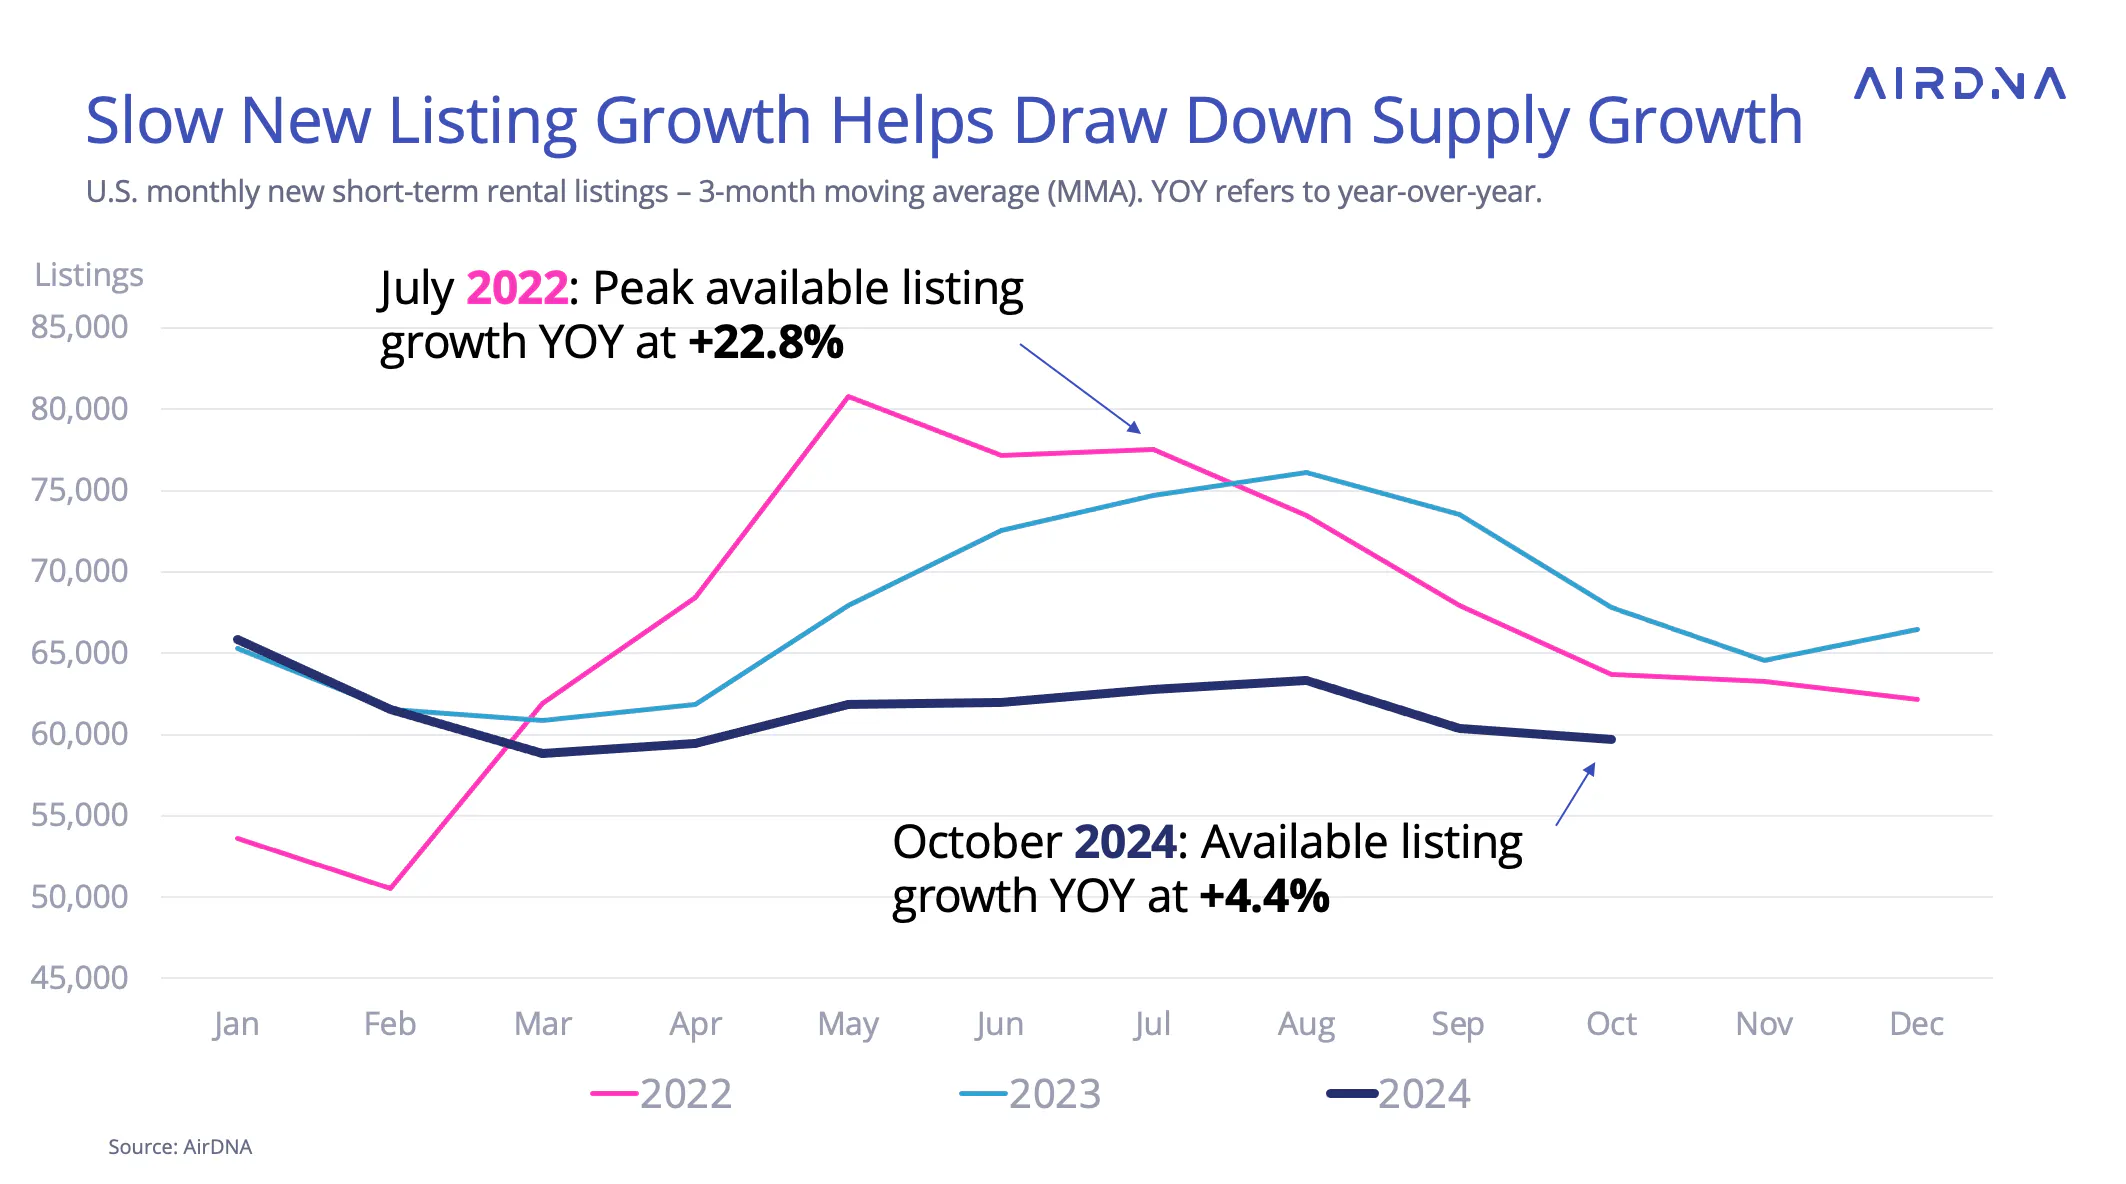
Large declines in new listings have been a key driver of the slowing supply growth in 2024. In 2023, a notable surge in new listings during late summer and early autumn briefly reignited supply growth from August through November. In fact, new listings in 2023 surpassed those in 2022 in seven out of twelve months. However, this year, that surge never arrived. For the past eight months, new supply has consistently fallen below 2023 levels—often significantly so.
Demand Growth Surges, Boosting Occupancy
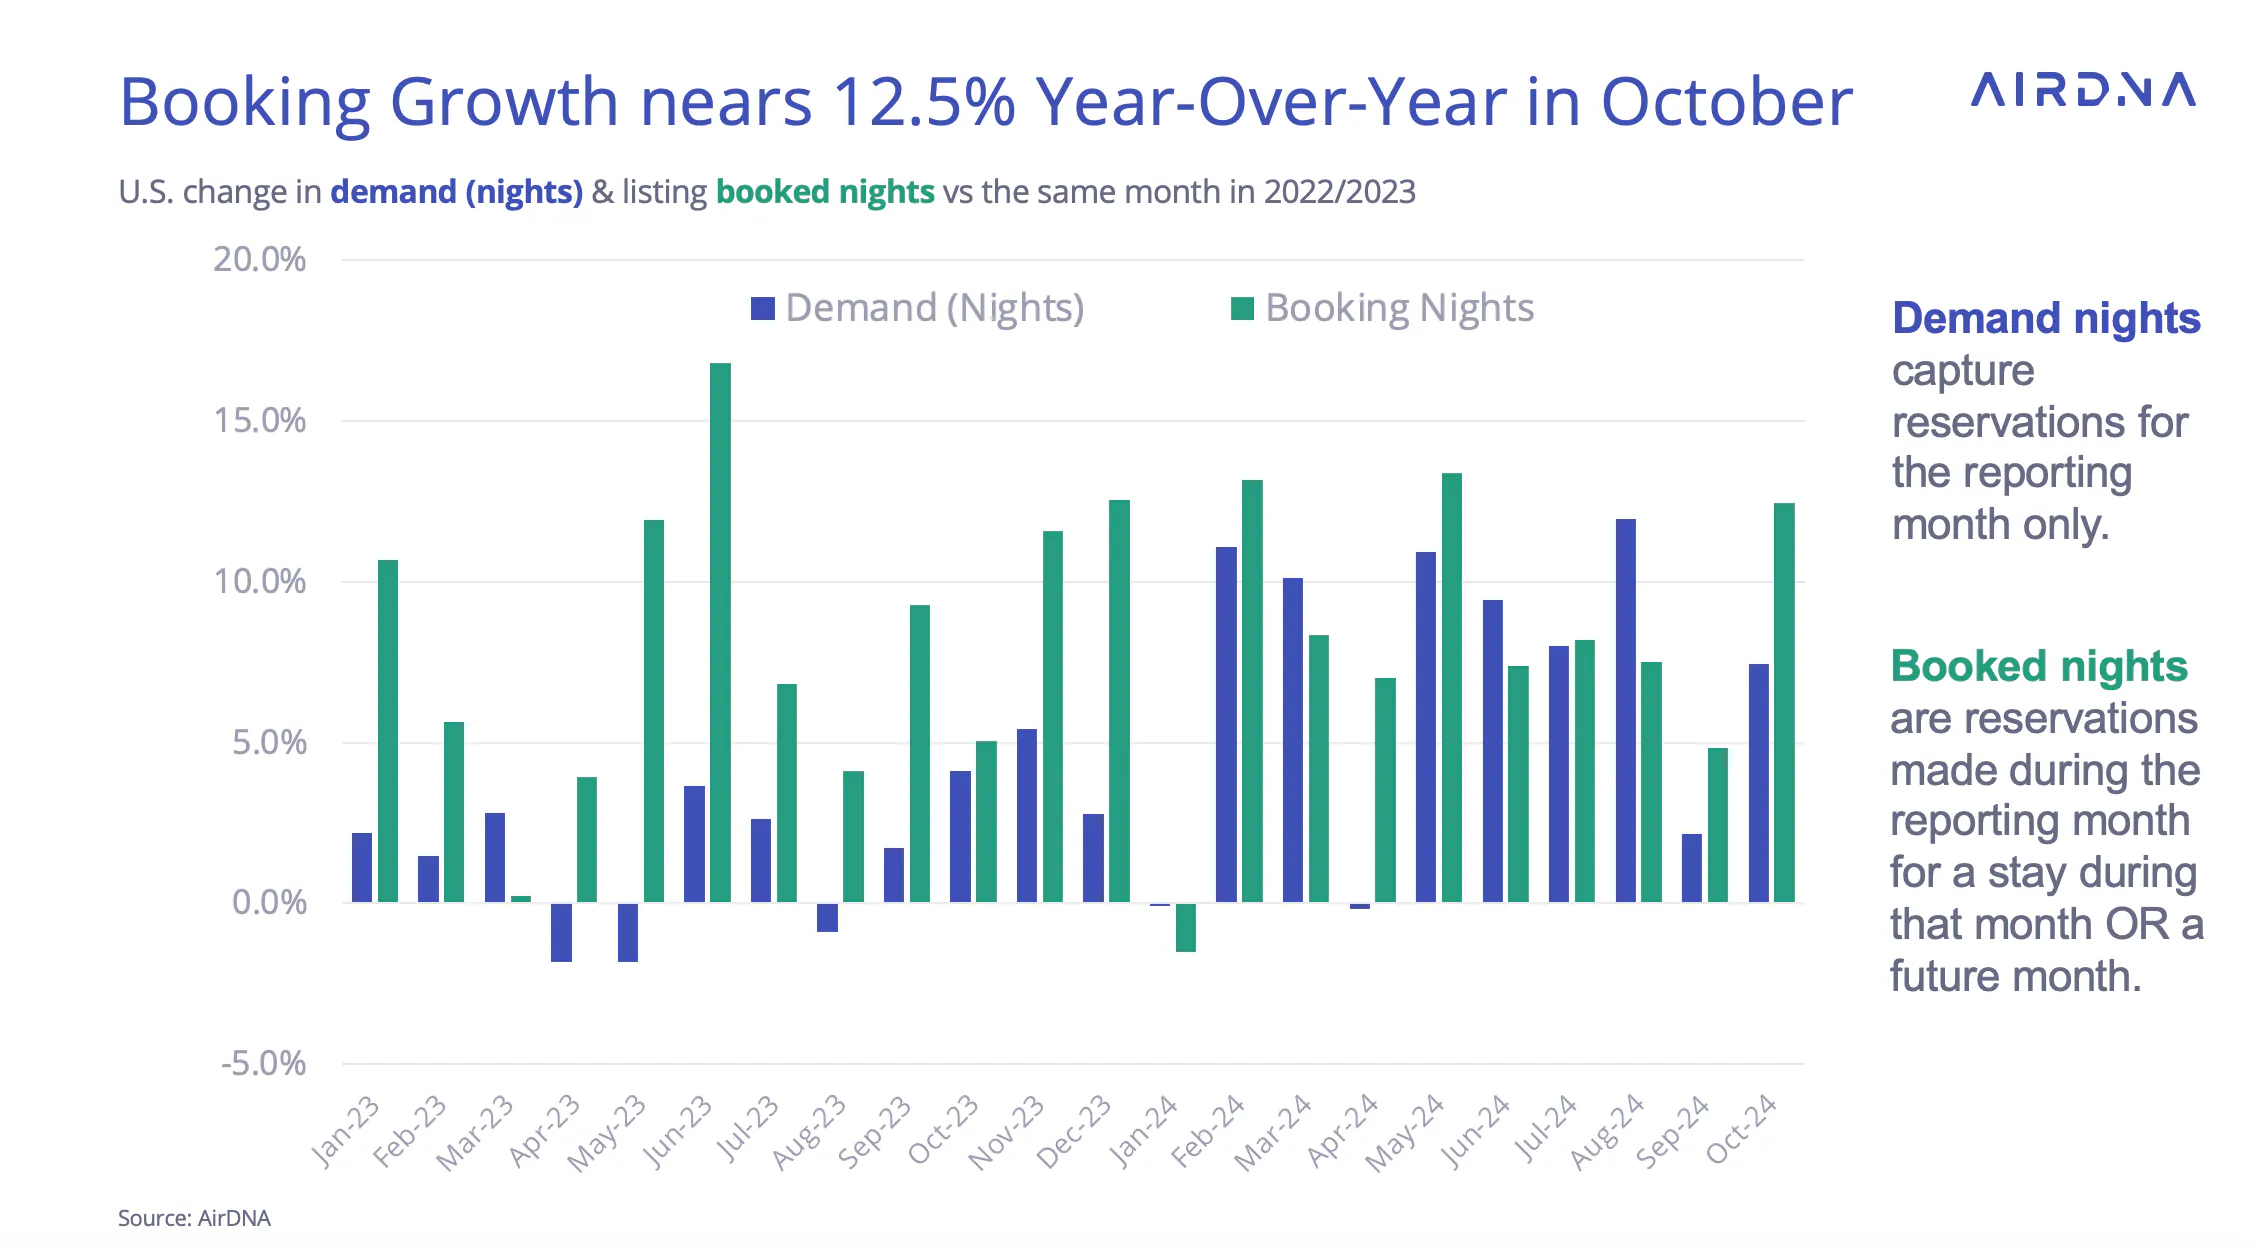
While supply growth has steadily slowed, demand in 2024 has made a notable comeback. October demand grew 7.5% year-over-year (YOY), a significant jump from September's 2.2% growth. Keep in mind, though, that September’s growth was dampened by the earlier-mentioned calendar shift.
Bookings rose even higher, surging by 12.4%. This reflects not only immediate demand but also advance bookings for the holiday season.
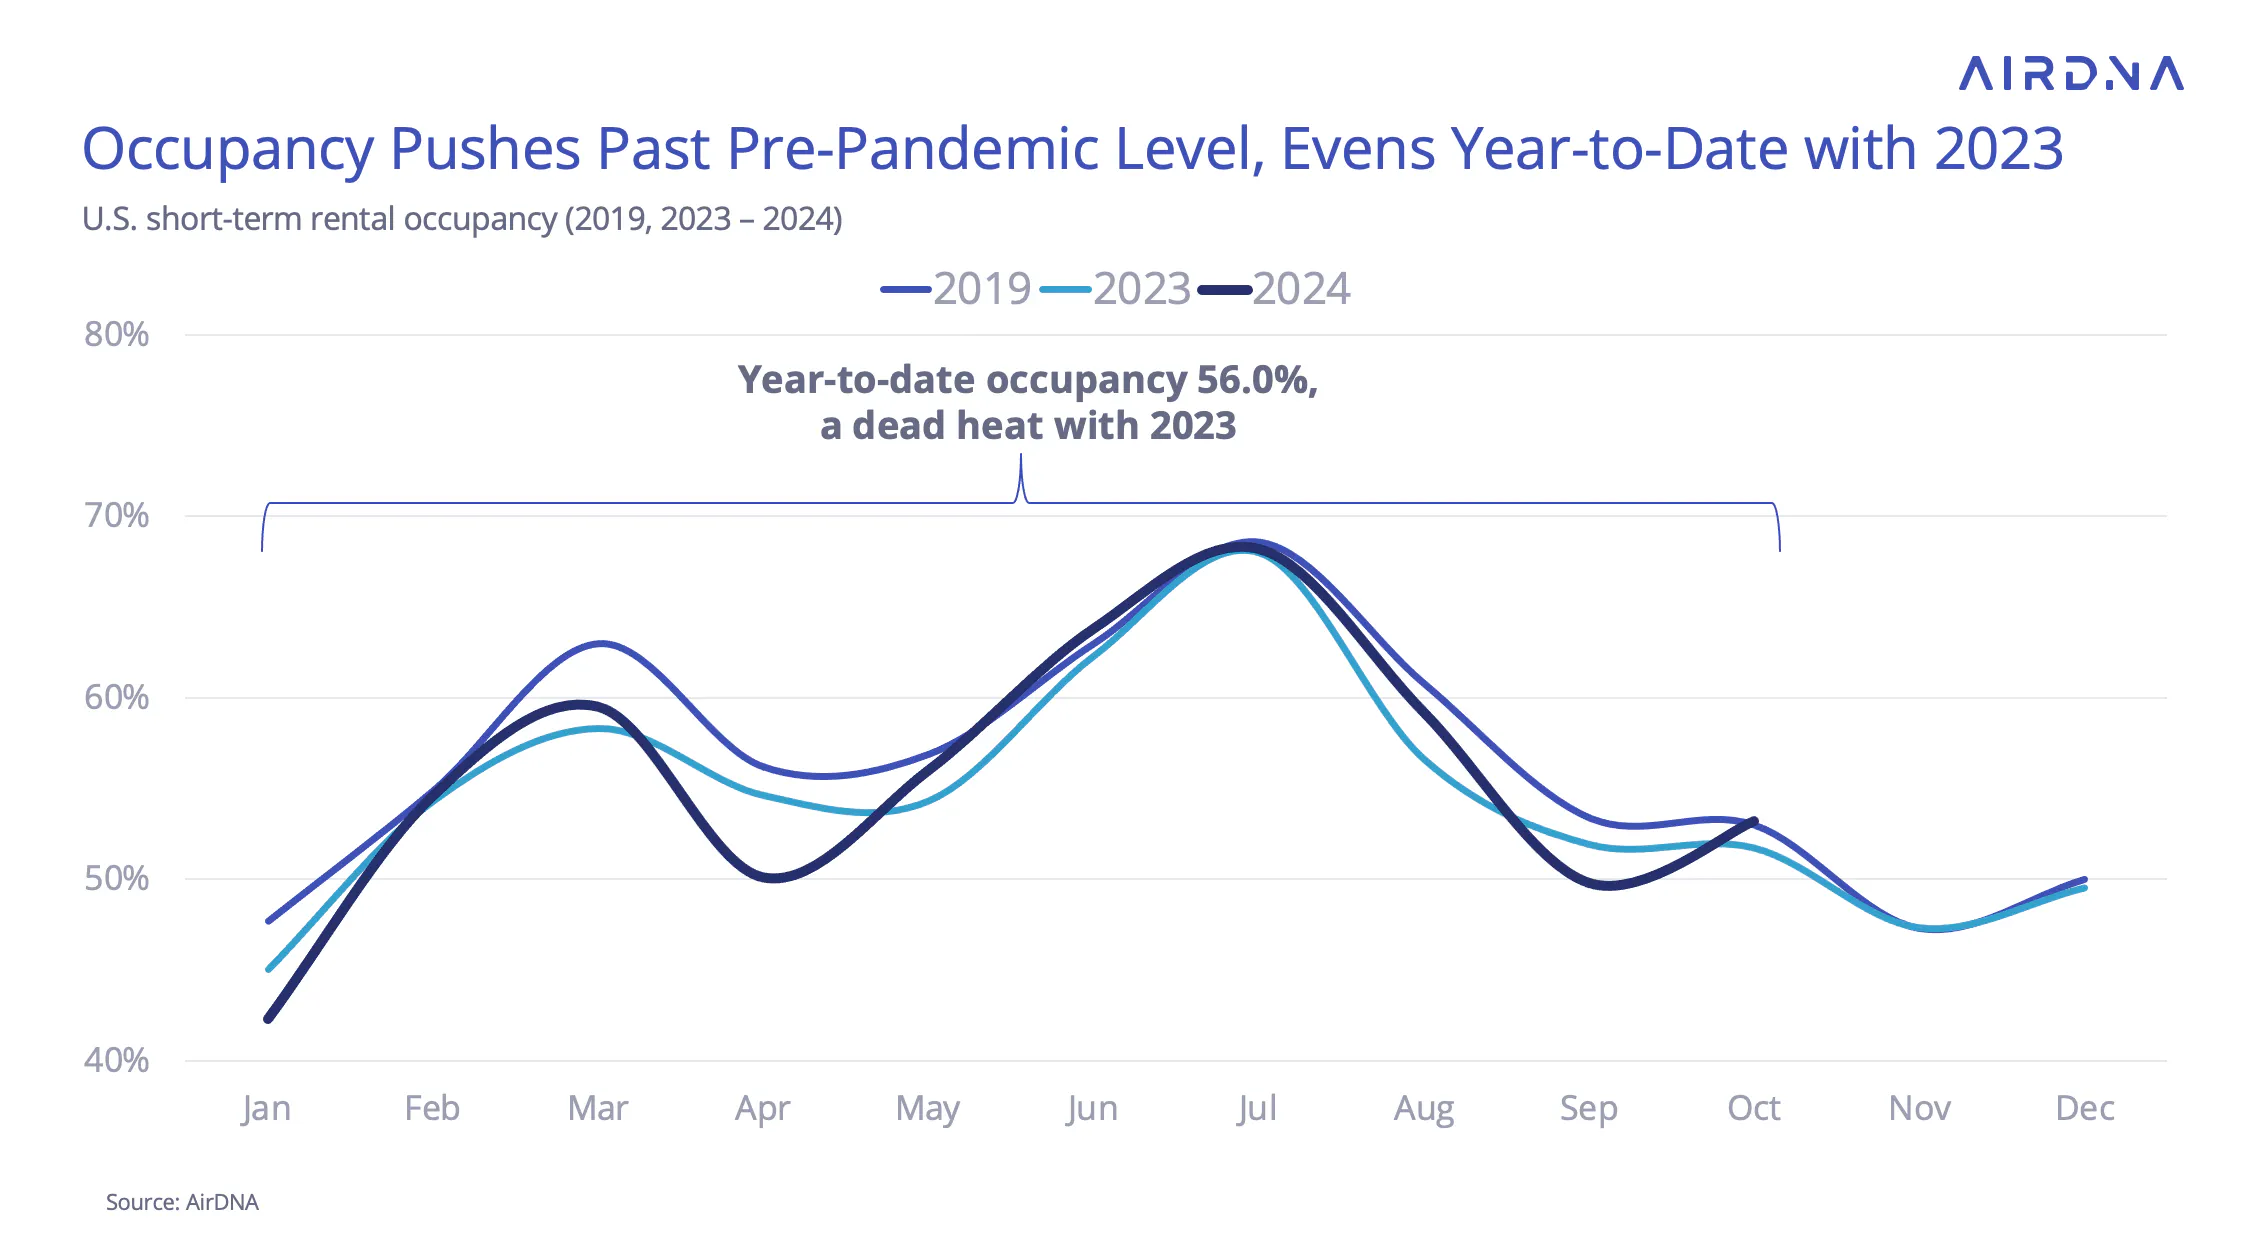
The combination of slowing supply and rebounding demand is driving positive occupancy trends. Year-to-date (YTD) occupancy has fluctuated between slightly below and slightly above 2023 levels throughout the year, influenced by unsteady early performance and calendar shifts.
However, October delivered excellent results, with occupancy rising 2.9% YOY and surpassing pre-pandemic 2019 levels for the second time this year (the first being in June). This performance tied YTD 2024 occupancy with the first ten months of 2023. AirDNA forecasts that by the end of the year, occupancy in 2024 will edge out 2023 by 0.1%, a target that now feels well within reach.
Hosts Pricing Power Increases with Occupancy
Another change in the pattern of ADR is the reversal of mix shift, or the types of properties entering or leaving the market that change the average rate. From May 2022 to March 2024, the types of properties entering or exiting the market tended to lower the average rate. Since then, however, mix shift has contributed to increasing ADR.
This implies some combination of low-priced listings leaving the market and higher-priced listings entering. This effect increased noticeably in October, accounting for more of the change in ADR than in August.
Mixed Trends in Occupancy and Rates Across Location Types
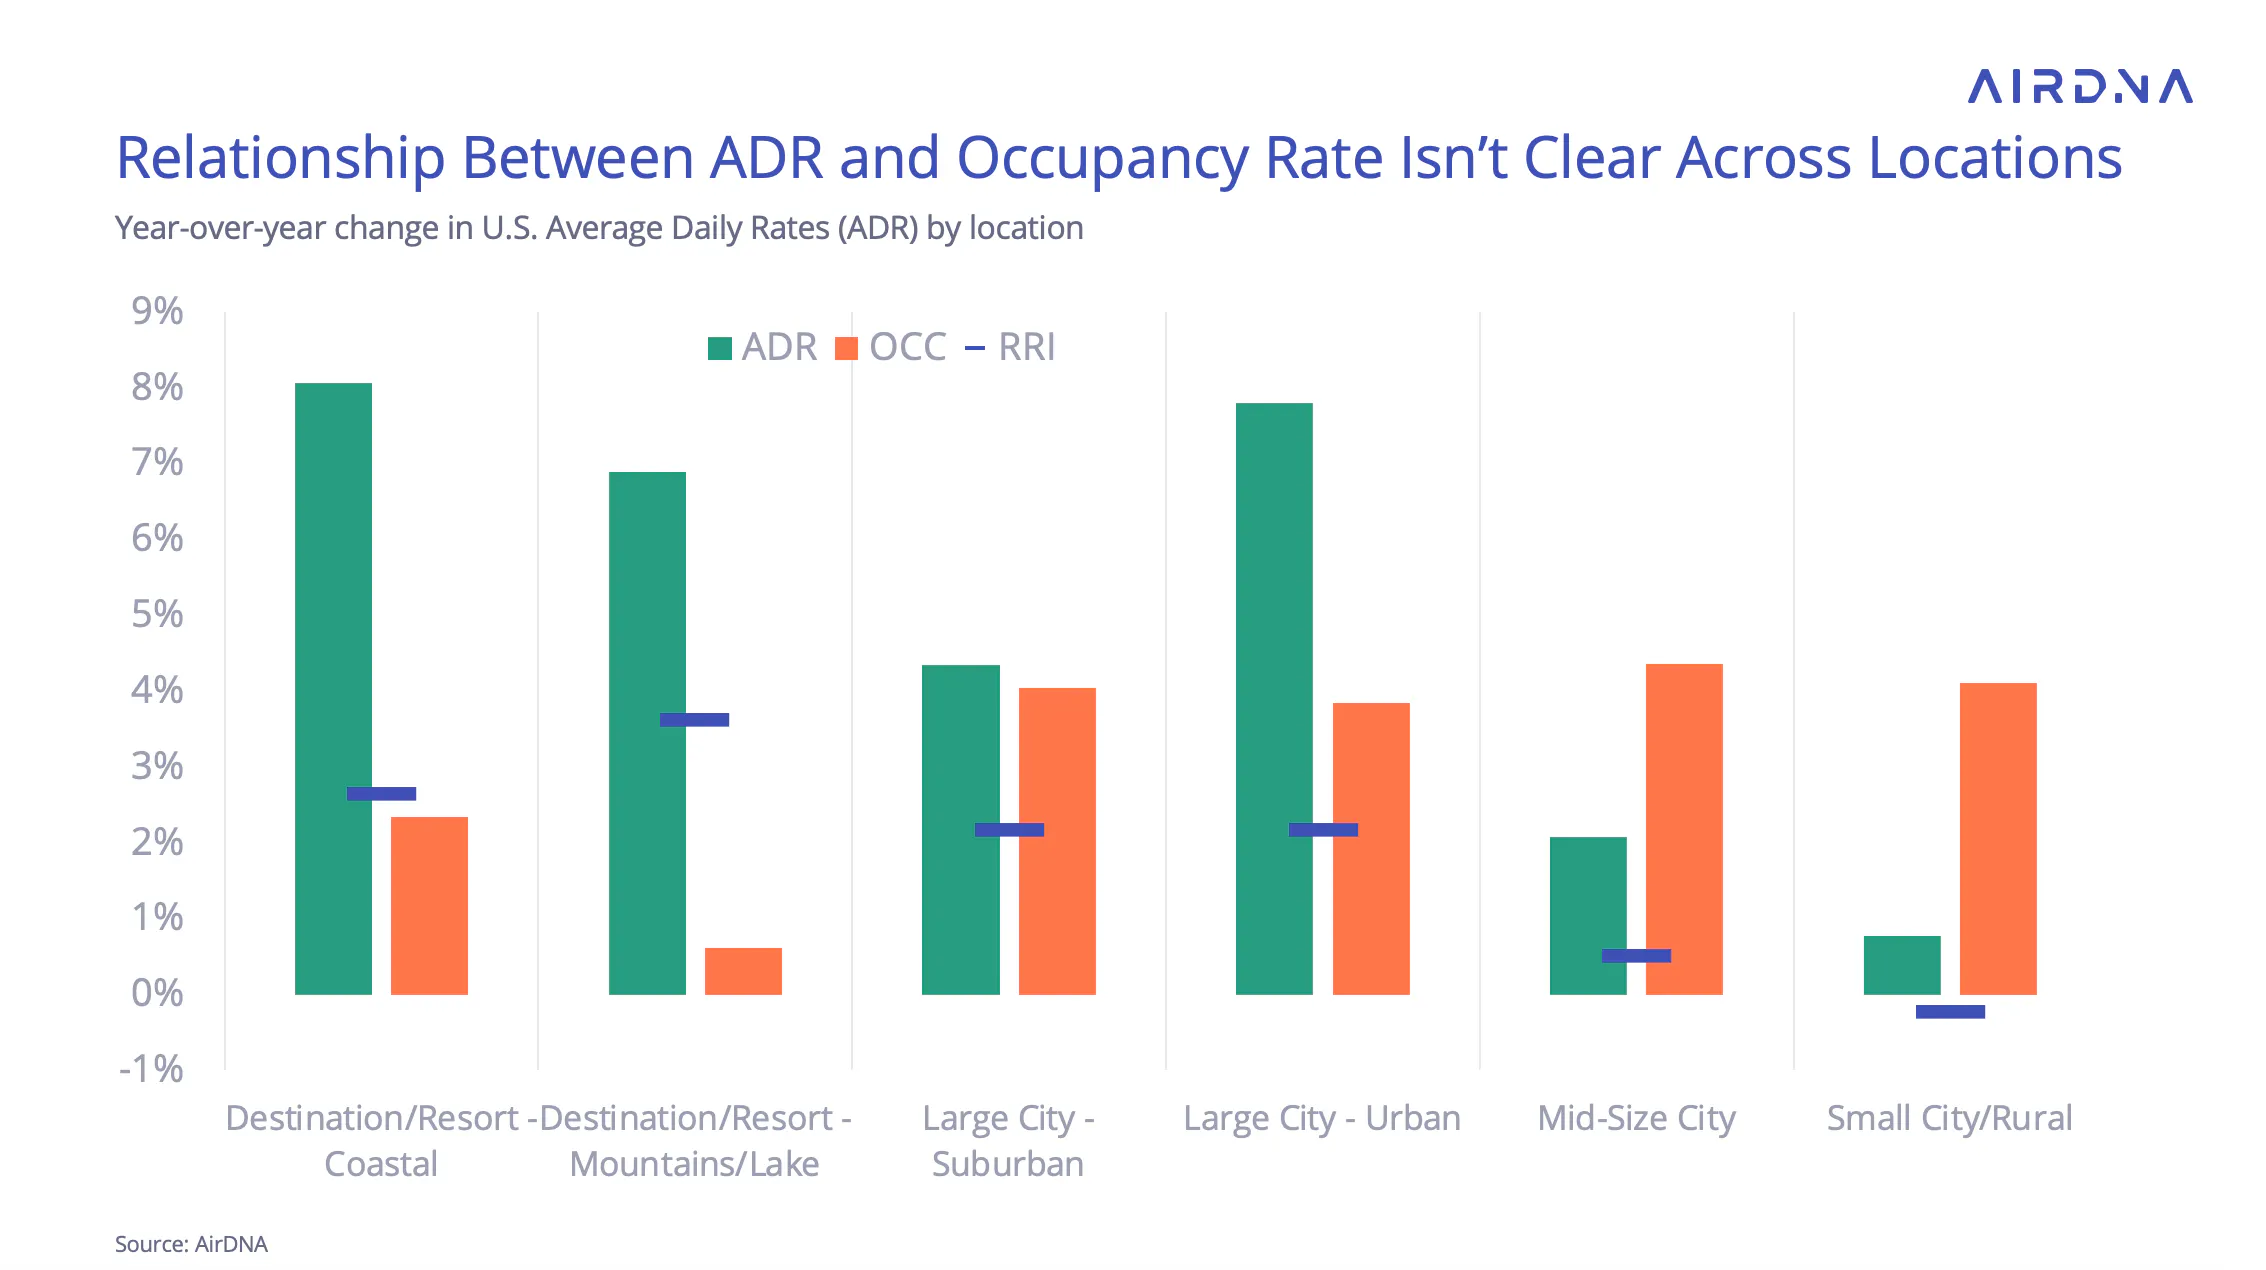
While the relationship between occupancy growth and rate increases seems clear on a national level, the picture becomes more complex when looking at specific locations and markets.
Small City/Rural and Mid-Size cities, which have seen the highest percentage growth in demand and supply this year, achieved strong occupancy growth of more than 4%. However, their ADR growth was the lowest among location types—negative, in fact, for Small City/Rural areas once mix shift effects are removed.

On the flip side, Coastal and Mountain/Lake resort markets recorded the highest ADR growth but the lowest occupancy growth. Large cities, including both urban cores and suburban areas, saw solid growth in both occupancy and ADR.
What explains this disconnect? Growth alone doesn’t tell the whole story. Resort markets, for example, still maintain occupancy levels about 6% higher than before the pandemic, giving them more pricing power in 2024. However, filling shoulder season months has proven more challenging.
Meanwhile, Small City/Rural and Mid-Size Cities enjoyed a strong October, with occupancy about 2% higher than pre-pandemic levels. Overall, though, their occupancy has hovered at or just below pre-pandemic benchmarks. This could be due to major supply increases and strategies focused on affordable ADRs to boost occupancy, ultimately weakening pricing power in these markets.
Local Events and Regulations Shape October Market Performance
Several localized events majorly impacted STR performance in October.
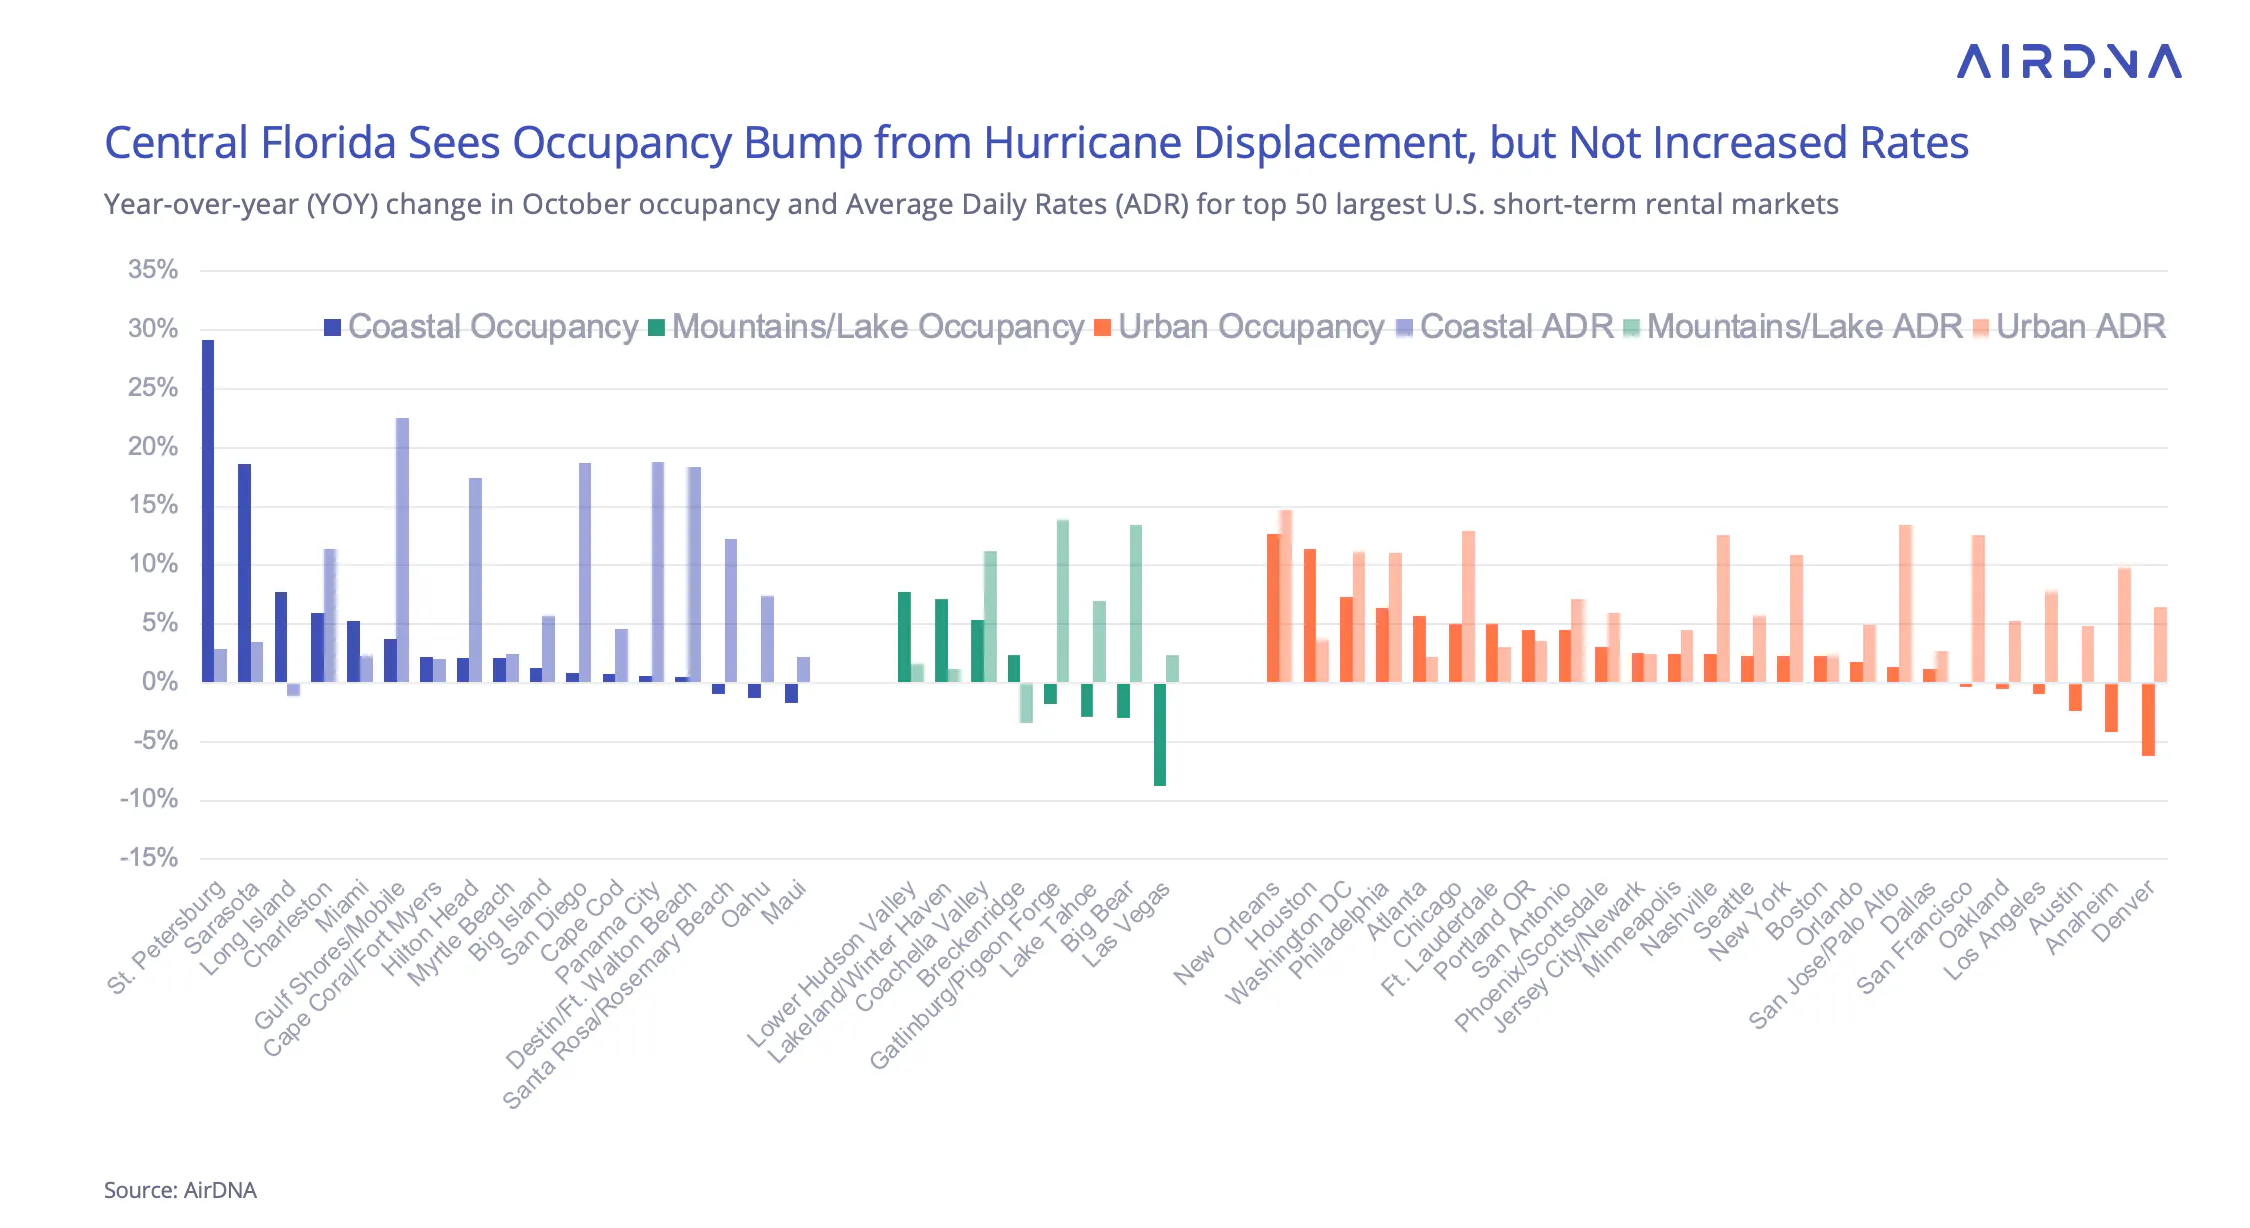
In coastal markets, Hurricane Milton led to widespread destruction but also high occupancy gains in St. Petersburg (+29.2%) and Sarasota (+18.6%). STRs in these areas may be serving as temporary housing for displaced locals, health workers, and demolition crews. ADR growth remained modest at +2.9% and +3.5%, respectively, considering the occupancy boost is from displaced locals rather than luxury vacationers .

Meanwhile, some Gulf markets experienced low occupancy growth but significant ADR increases. These markets may have capitalized on displaced tourists unable to visit central Florida during the month.
- Panama City, Florida: +0.6% occupancy, +18.8% ADR
- Destin/Ft. Walton Beach: +0.5% occupancy, +18.4% ADR
- Santa Rosa/Rosemary Beach, Florida: -0.9% occupancy, +12.2% ADR
In other markets, regulatory changes appear to have created a disconnect between occupancy and ADR growth. For example, famous California resort destinations like Big Bear and Lake Tahoe experienced declines in October occupancy but increased rates.
Similarly, Bay Area markets such as San Francisco and Oakland followed the same pattern, with higher rates despite lower occupancy.
Calendar Shifts Shape Year-End Travel Demand
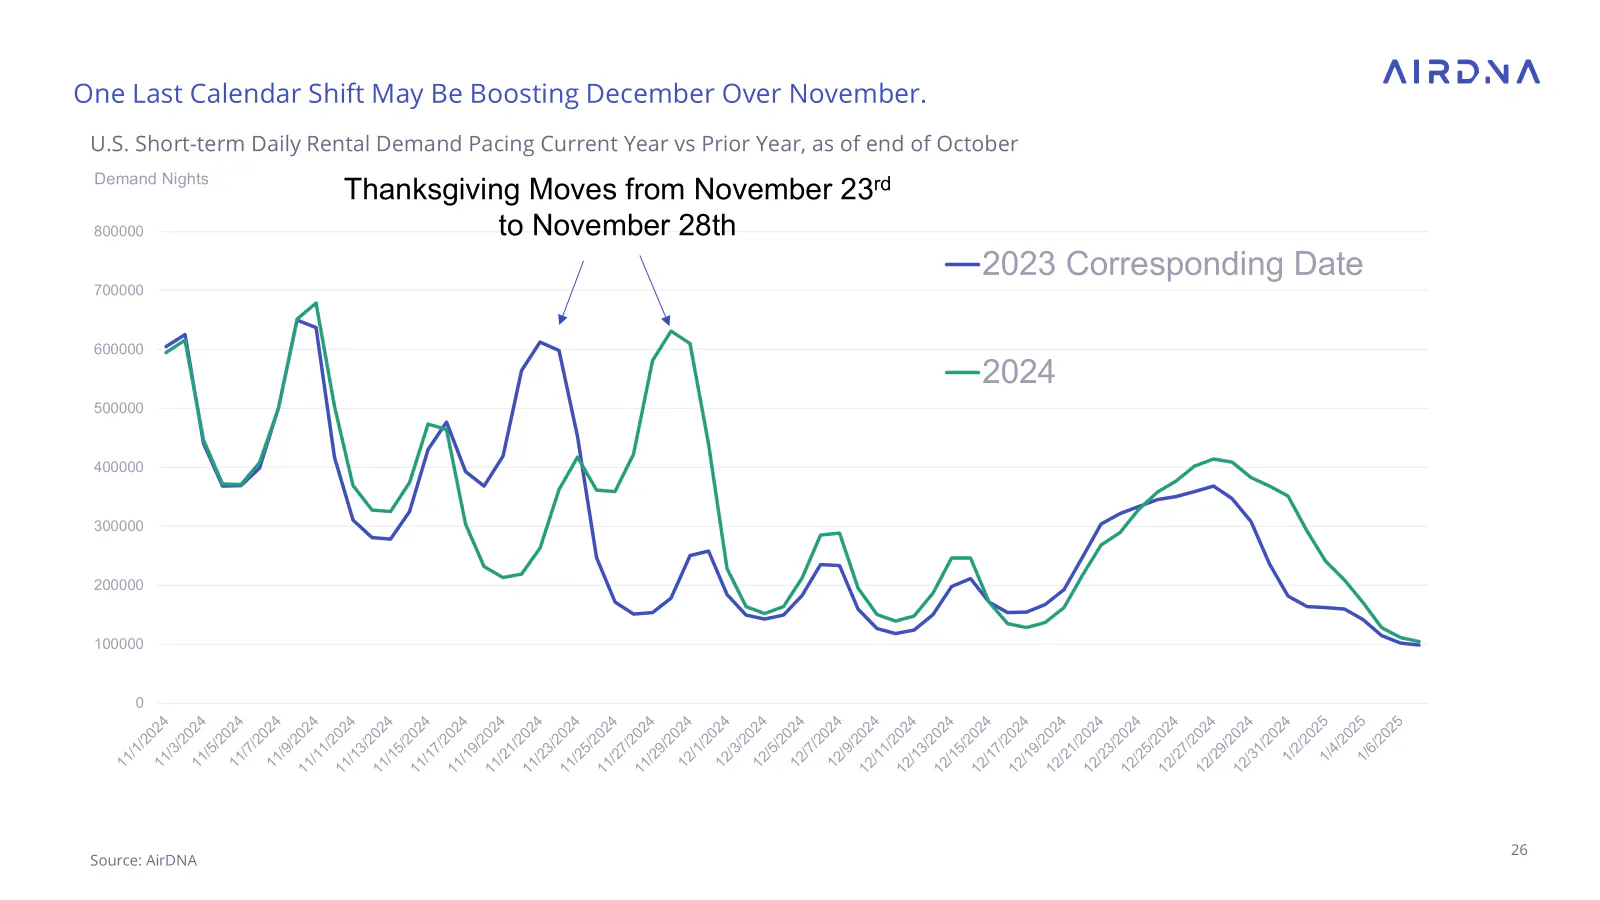
Looking ahead to the final months of 2024, November demand pacing is somewhat subdued, coming in at +4.6% by the end of October. December, however, shows stronger growth at +11.0%, with one more calendar shift likely to influence year-over-year (YOY) comparisons.
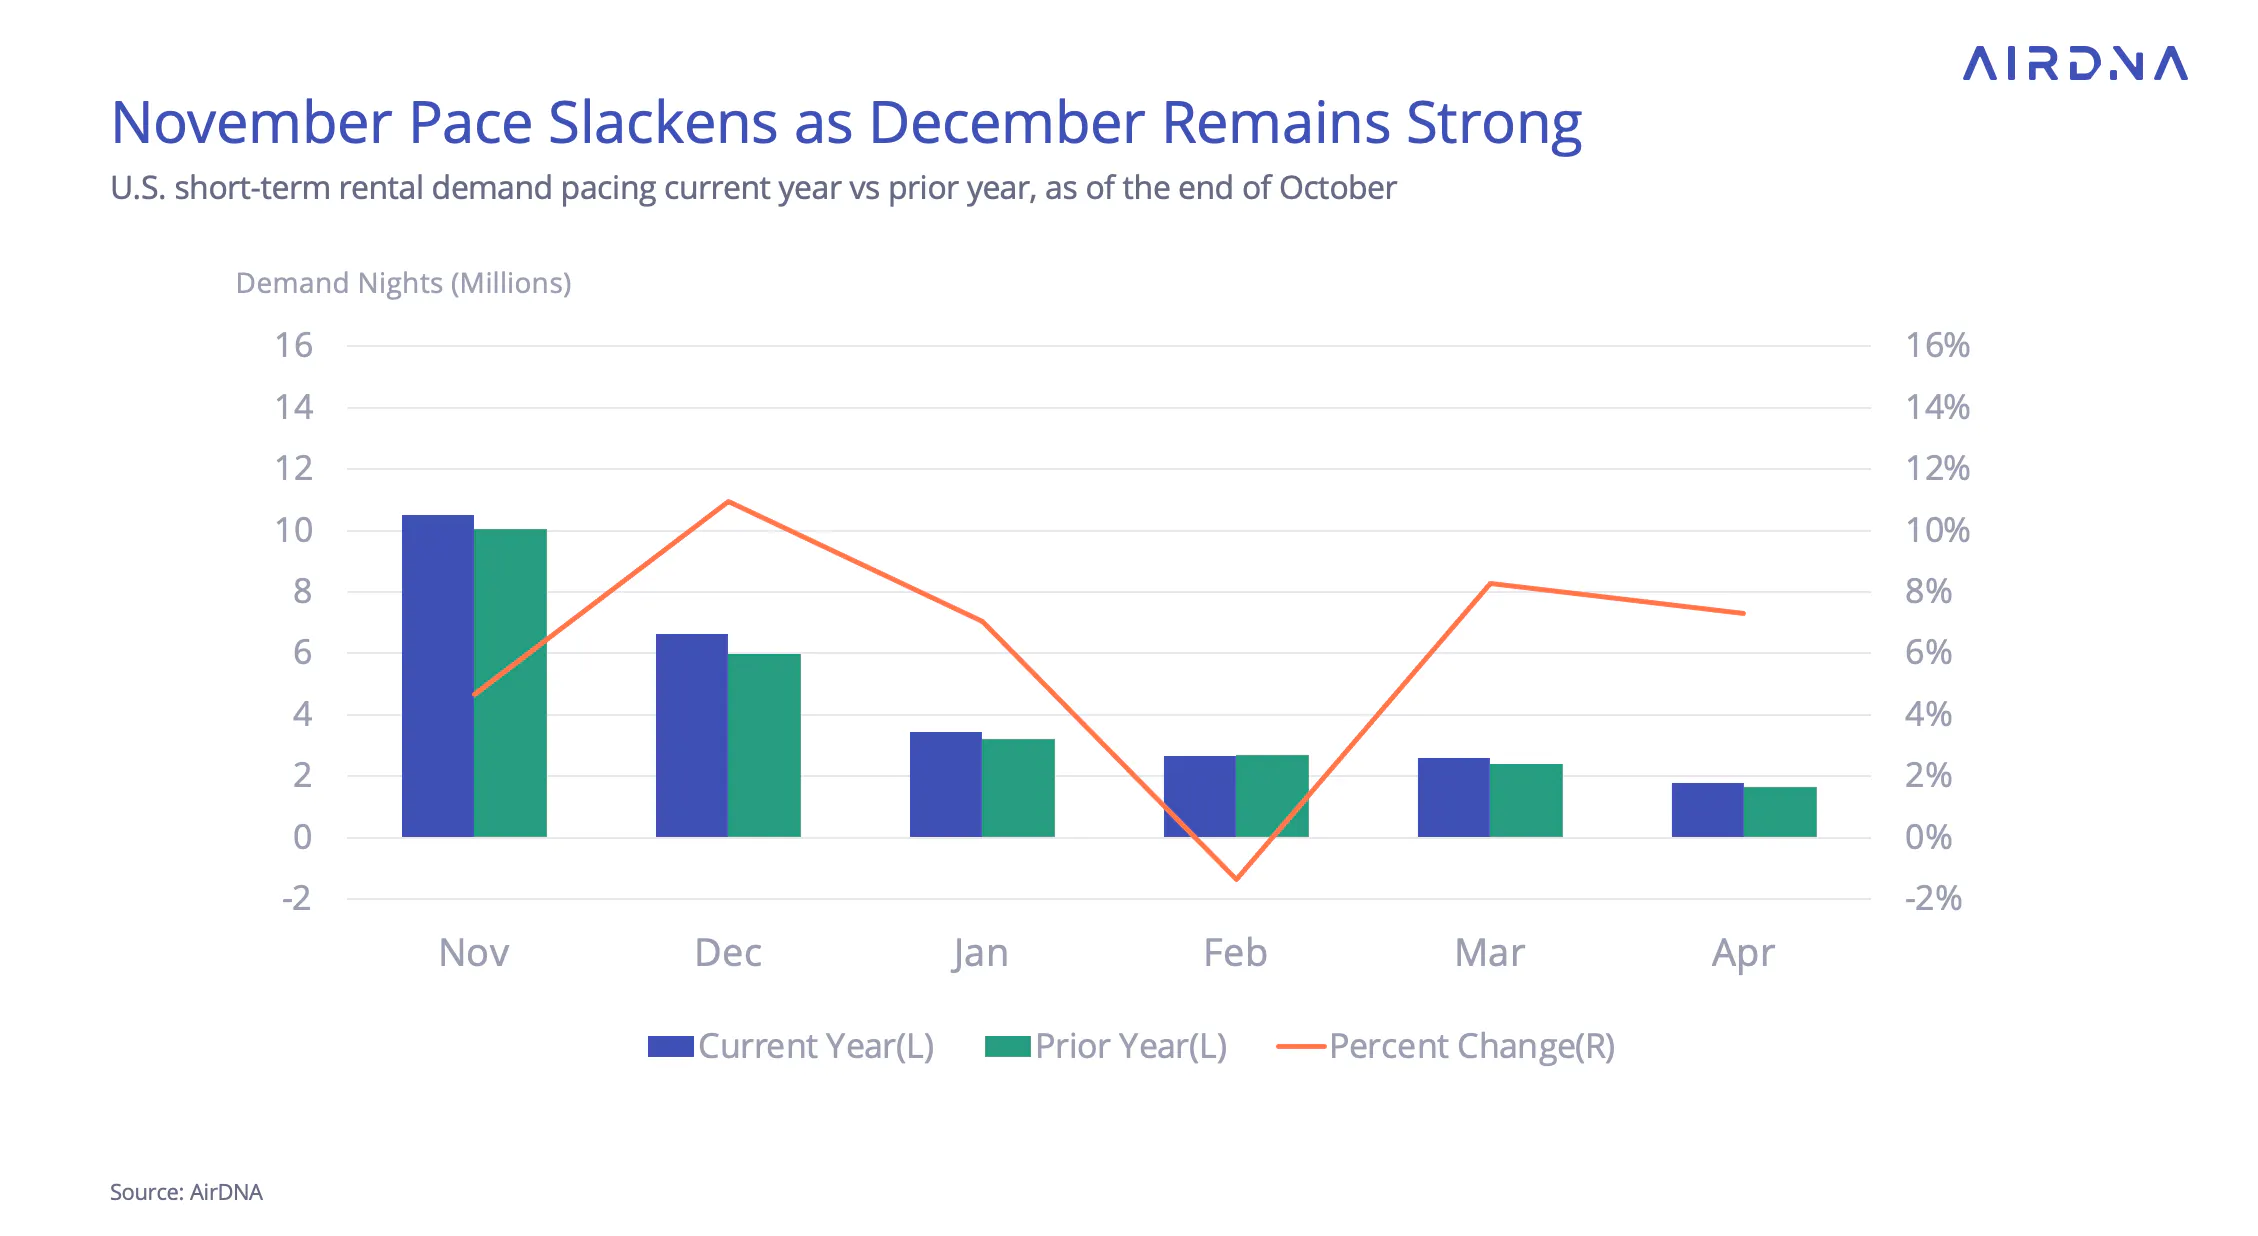
Thanksgiving, a major travel holiday for the STR market, falls on November 28th this year, compared to November 23rd in 2023. As a result, travelers are nearly a week further out from Thanksgiving now than they were at this time last year.
Given the trend toward shorter booking lead times, this could make November pacing appear weaker than the actual demand we’ll see closer to the holiday. Additionally, with Thanksgiving falling closer to the end of the month, extended weekend trips may shift into December’s demand figures rather than November’s, as was the case in 2023.
Despite these nuances, December pacing looks strong, and there’s potential for occupancy to end the year on a high note.

ARTICLE SUMMARY
October marked a pivotal month for the U.S. STR market, as stabilized supply growth and rising demand pushed occupancy closer to pre-pandemic levels. With hosts regaining pricing power and year-end demand pacing strong, the market is poised for a promising close to 2024.
Bram Gallagher
AirDNA Director of Economics and Forecasting
Bram Gallagher is an Economist at AirDNA, specializing in uncovering insights that drive smarter short-term rental decisions. He put his Ph.D. in Economics from the University of Georgia to work researching and forecasting hotel data with CBRE prior to joining AirDNA, as well as teaching economics at a number of universities. In his spare time, Bram enjoys making wooden furniture with hand tools.