


U.S. Review November 2025: Steady Supply and Improving Holiday Momentum
Published: December 18, 2025

Bram Gallagher

Key Takeaways:
- November demand grew 1.4% year-over-year, with holiday travel performing stronger than the monthly average.
- Supply growth stayed steady at around 4.0% in November, even as occupancy declined by 2.6%.
- Year-end travel is shaping up well, with combined demand for December 31st and January 1st pacing 15.8% ahead of last year.
U.S. short term rental demand growth slowed in November, rising 1.4% year over year. At face value, this marks a step down from October and reflects a month shaped by weaker early performance and continued economic uncertainty. However, headline figures understate underlying demand strength, particularly around Thanksgiving.
Thanksgiving demand grew between 3.5% and 4.0% compared to last year, outperforming the monthly average. November’s overall growth was dampened by an unfavourable calendar alignment, as the month included one fewer Friday and one additional Sunday than November 2024. When demand is compared on a matched day-of-week basis, growth improves to 2.7%, offering a clearer view of traveler behaviour.
Despite softer demand growth, pricing trends remained resilient. Average daily rates (ADR) continued the upward momentum seen in October, and year-to-date occupancy remains broadly in line with 2024. While November closed on a subdued note following a turbulent period for the broader economy, early pacing data points to a stronger December and a more positive setup heading into 2026.
At a Glance: Key U.S. STR Performance Metrics for November 2025
- Revenue per Available Rental (RevPAR) decreased -1.1% year-over-year (YoY) to $115.97
- Available listings reached 1.73 million, a 4.7% increase YoY
- Demand nights were up 1.4% in November
- Occupancy averaged 51.2%, down -2.6% YoY
- Average Daily Rates (ADR) climbed to $226.61, up 1.6% from last year
- The Repeat Rent Index (RRI) rose 1.7% YoY
- Total nights booked were up 2.3% from October 2024
Economic Outlook
The longest U.S. government shutdown to date led to the cancellation of several important economic reports just as the Federal Reserve faced crucial interest rate decisions. Nevertheless, available private-sector data and other evidence suggest that the economy has continued along much the same trajectory it was on prior to the shutdown. Both hiring and layoffs remain low, and sentiment points to a labor market that is softening, albeit only slightly. The Fed projects unemployment to reach a peak of 4.5% by the end of the year before declining thereafter.
Inflation also remains somewhat elevated. The Fed expects 2025 Personal Consumption Expenditures Price Index (PCE) inflation to be around 2.9%, above its 2% target but well below the highs seen in recent years. Consumption appears to be firming as the year draws to a close, raising questions about what, exactly, is concerning the Fed.

The housing market has proven to be a substantial source of economic weakness, with much of the decline in transactions attributable to elevated mortgage rates. Mortgage rates rose in tandem with the Federal Funds Rate beginning in 2022, peaking at around 7.8% in October 2023. Since then, rates have eased gradually and are now holding between 6.1% and 6.3%.
Meanwhile, tariffs are expected to have a limited effect on inflation. Tariff-related price increases tend to result in a one-time lift rather than sustained pressure. As a result, the balance of downside risk has tilted toward rates being too high rather than too low, prompting the Fed to order an additional interest rate cut at its December 10th meeting.
Even so, the early cut did not materially change the Fed’s interest rate outlook through the end of 2026. The additional cut in December implies one fewer cut in March 2026. Mortgage rates are also unlikely to fall in response to easing in the same way they did in 2021. Lingering inflation concerns and constrained capital conditions suggest mortgage rates will remain relatively stable for the foreseeable future. However, the combination of gradually lower rates, firming short-term rental performance, and softening home prices points to 2026 shaping up as one of the most favorable investment environments in recent years.
Supply Growth Remains Steady Despite Economic Uncertainty
Supply growth in terms of available listing nights began declining almost immediately in 2022 as interest rates started to rise. This pattern generally continued until February 2025, when supply growth fell to 4.1%. It has largely remained at that level, with slight fluctuations due to the unwinding of a calendar shift in 2024 and a brief acceleration in June to 5.1%. Afterward, growth declined again, reaching 4.0% by November.
Although low by historical standards, the steadiness of the growth rate in 2025, combined with a thawing housing market and a potential demand tailwind in the form of fiscal benefits from the recent budget bill, suggests that supply growth may have reached a bottom. In any case, supply has not collapsed completely. That’s despite considerably elevated economic policy uncertainty for much of the year.

Demand Growth Slows Amid Calendar Effects
Demand has proven to be more sensitive than supply to calendar shifts, the government shutdown, and broader budget anxiety. Although demand growth started the year on a high note (+12.9% YoY), partly due to a relatively weak comparison in January 2024, growth has since wavered and declined. November demand growth was 1.5% year-over-year. Booked nights, which include future stays, performed better, increasing 2.9% for the second consecutive month.

At first glance, the 1.5% demand growth figure suggests weaker performance than October (+2.6%), even though demand growth during most of November was notably stronger. Examining daily demand compared to the corresponding dates in 2024 shows growth rates that rarely fell below 2% and at times reached or exceeded 6%.
This discrepancy is largely explained by another calendar shift. While day-of-week effects are often less meaningful when growth rates are strong, they have had an outsized influence in the current environment. November 2024 began on a Friday and ended on a Saturday, whereas November 2025 began on a Saturday and ended on a Sunday. Although this difference appears minor, the missing Friday removed at least 212,000 demand nights from November. When comparing corresponding days of the week, November demand growth improves to 2.7%.

Occupancy Declines Reflect Supply–Demand Balance
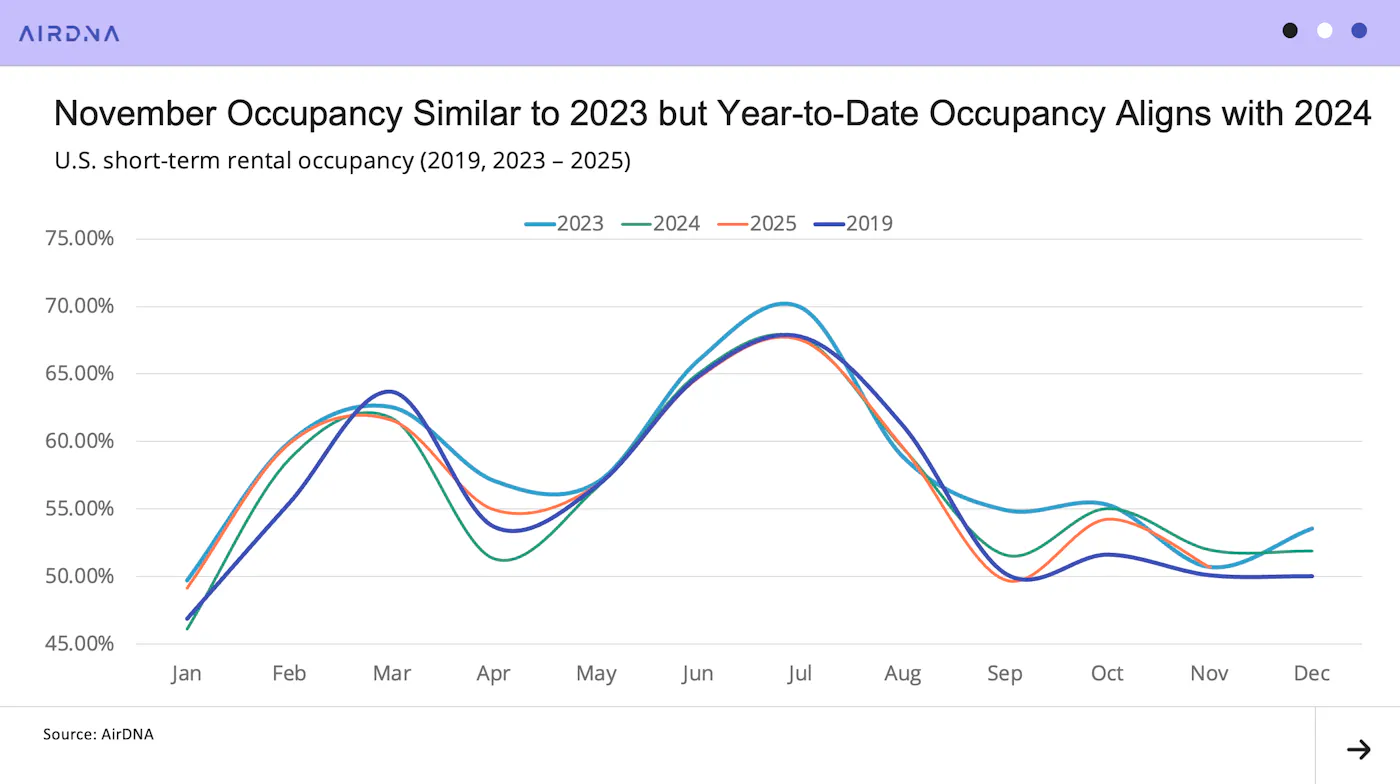
Consistently growing supply and slowing demand predictably led to a decline in occupancy in November (-2.6% year-over-year). However, the headline figure understates performance relative to recent history. November occupancy was broadly in line with 2023 levels and remained well above pre-pandemic benchmarks.
Occupancy began 2025 with a sizable lead over 2024, but this advantage gradually eroded over the course of the year. Occupancy levels converged during the summer months, before 2025 fell meaningfully below 2024 in September. Year-to-date, however, occupancy remains marginally higher than the first eleven months of 2024, averaging 57.9% compared to 57.7%.
Pricing Holds Despite Occupancy Pressure
Year-over-year declines in occupancy are typically associated with weakening pricing power, but ADR growth strengthened slightly in October, rising to 1.7%, and continued at a similar pace in November (+1.6%). While this growth remains slightly below inflation, it marks a clear improvement compared to the period of sustained declines between March 2023 and February 2024.
The AirDNA Repeat Rent Index (RRI) tracked closely with ADR growth throughout 2025, and November was no exception (+1.7%). RRI measures rate changes for existing, persistent listings, excluding the impact of new listings on the overall rate (what we call mix shift). As supply growth has slowed, the influence of mix shift on total ADR change has diminished, allowing pricing trends among established listings to more clearly reflect underlying market conditions.

Local Markets Diverge as Pricing and Occupancy Move in Opposite Directions
Across location types, available listings increased in all categories. However, only Large City Suburban and Small City/Rural markets recorded demand growth. Small City/Rural markets, which have historically led both demand and supply growth, saw demand rise 4.6% in November. However, this was outpaced by an 8.4% increase in available listing nights, resulting in continued occupancy pressure. Suburban markets experienced relatively flat demand and posted a small year-over-year decline in occupancy (-3.1%).

At the market level, occupancy and pricing continued to move in opposite directions, with stronger ADR growth often occurring in markets that experienced larger occupancy declines. Bay Area markets that have implemented regulations to limit supply growth posted some of the strongest occupancy gains, including:
- San Francisco (+8.0%)
- San Jose/ Palo Alto, California (+4.7%)
- Oakland, California (+4.4%).
These markets also recorded solid ADR growth of 2.1%, 3.8%, and 3.3%, respectively.
By contrast, the highest ADR growth rates were observed in:
- Long Island, New York (+19.6%)
- Sarasota, Florida (+16.8%)
- St. Petersburg, Florida (+12.9%)
All three of these markets also experienced some of the largest occupancy declines (-7.0%, -21.2%, and -23.3%, respectively). In Sarasota and St. Petersburg, ongoing hurricane recovery continues to complicate year-over-year comparisons, though the broader inverse relationship between occupancy and pricing holds across markets.

Holiday Pacing Improves as Year-End Travel Takes Shape
Looking ahead, demand growth appears to be picking up as the year draws to a close. Calendar effects are again influencing year-over-year comparisons, as both Christmas Day and New Year’s Day fall on a Thursday this year, compared to a Wednesday in 2024. This has had the effect of suppressing demand for Monday and Tuesday, December 22 and 23, relative to the corresponding days last year.
At the same time, there are clear signs of stronger interest in extended weekend travel around New Year’s. As of the end of November, demand for New Year’s Day was pacing 38.4% ahead of Thursday, January 2, 2024. Even when aligning by calendar date, combined demand for December 31 and January 1 was pacing 15.8% ahead of last year.


Examining performance by location type shows a broadly consistent uplift across markets during the holiday period. Demand for the two weeks surrounding the holidays is pacing 9% to 12% higher year-over-year across most location types. Resort markets and Small City/Rural locations are seeing slightly stronger gains, suggesting travellers are splitting time between traditional holiday destinations and visits to family and secondary homes.

At the individual market level, two recovery stories stand out. Cape Coral/Fort Myers, Florida continues to rebound following significant damage from Hurricane Milton, while Asheville, North Carolina remains in recovery after Hurricane Helene. Cape Coral/Fort Myers is currently posting the largest demand pacing increase among the top 50 U.S. markets (+22.3% compared to 2024), while Asheville is showing the strongest overall pacing gain nationally (+52.3%). Outside of these markets, the Dallas/Fort Worth area in Texas is also recording notable year-over-year demand gains.

ARTICLE SUMMARY
November 2025 saw slower headline demand growth for U.S. short term rentals, influenced by calendar effects and a softer start to the month. Despite this, pricing remained stable, supply growth held steady, and holiday pacing pointed to stronger travel activity heading into December and early 2026.
Bram Gallagher
AirDNA Director of Economics and Forecasting
Bram Gallagher is an Economist at AirDNA, specializing in uncovering insights that drive smarter short-term rental decisions. He put his Ph.D. in Economics from the University of Georgia to work researching and forecasting hotel data with CBRE prior to joining AirDNA, as well as teaching economics at a number of universities. In his spare time, Bram enjoys making wooden furniture with hand tools.
Related



Get started with AirDNA today.
Powerful, easy-to-use tools that help hosts and investors succeed in the short-term rental market.
Try for free