U.S. Review October 2025: Eyes On Occupancy as Uncertainty and High Costs Pervade Market
Published: November 18, 2025
Last updated: August 31, 2026

Bram Gallagher
Key Takeaways:
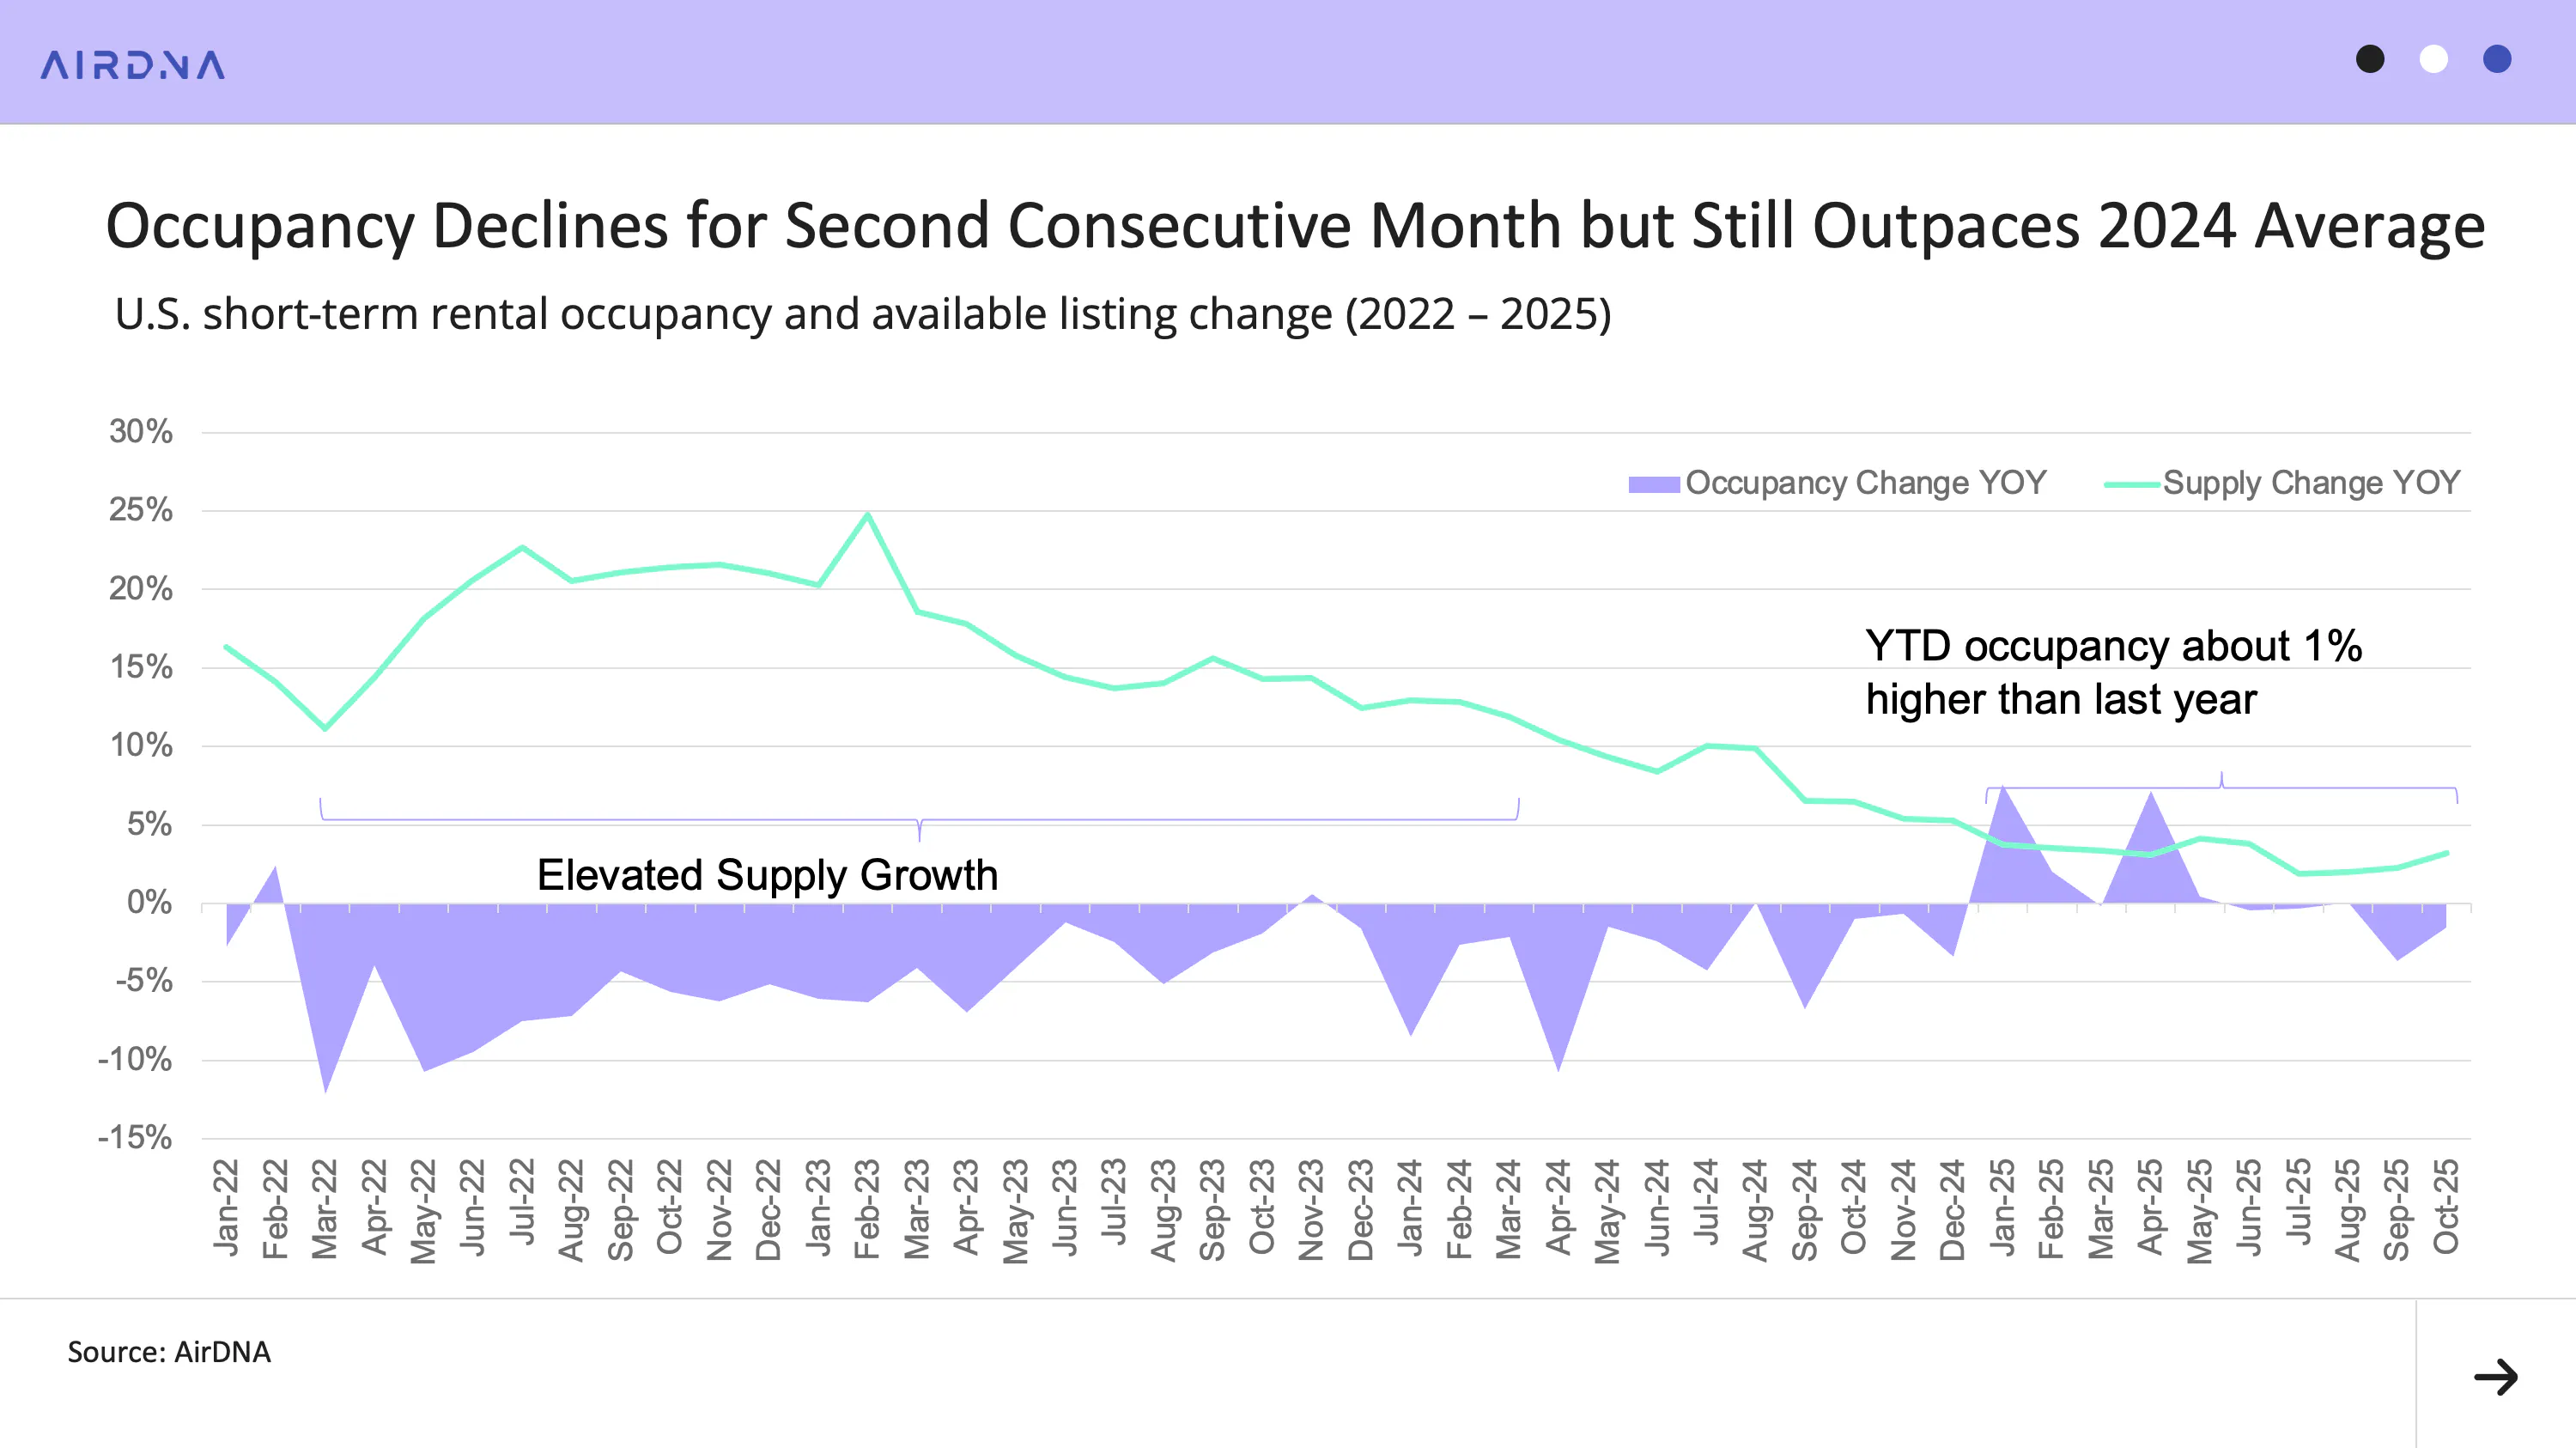
- Demand rose 2.5% in October, but an occupancy decline of 1.5% marked the second straight month of year-over-year declines.
- Supply growth remained slow at 3.2%, though new listings increased for the first time in nearly two years.
- Holiday travel is pacing strongly, with Christmas and New Year’s bookings up 12–21%.
October brought a mixed set of results for the U.S. short-term rental (STR) market. Demand returned to growth after a softer September, but occupancy continued to edge down as new supply and shifting travel patterns put pressure on performance. At the same time, the prolonged government shutdown drove economic uncertainty. Delayed federal data and a complicated inflation outlook added another layer of caution for both travelers and operators.
Even with these headwinds, pricing remained resilient and forward-looking bookings for the holiday season showed notable strength. This suggests that underlying travel fundamentals remain steady as the year draws to a close.
At a Glance: Key U.S. STR Performance Metrics for October 2025
- Revenue per Available Rental (RevPAR) increased 0.1% year-over-year (YoY) to $125.97.
- Available listings reached 1.75 million, a 3.2% increase YoY.
- Demand nights were up 2.5% in October..
- Occupancy averaged 54.0%, down -1.5% YoY.
- Average Daily Rates (ADR) climbed to $233.39, up 1.7% from last year
- The Repeat Rent Index (RRI) rose 0.5% YoY
- Total nights booked were down -2.2% from October 2024.

Economic Outlook
The U.S. government shutdown continued through October, obscuring key economic data at a time when the Federal Reserve was trying to strike a delicate balance between inflation and a weakening job market.
Oxford Economics warns that the reduced payments and missed contracts associated with a prolonged shutdown could potentially stall U.S. GDP growth in Q4. However, recent moves by Congress to end the shutdown should limit the damage to significant, but not catastrophic.
With official federal data unavailable, analysts have turned to private sources. ADP, a major payroll processor, estimates that while overall job numbers likely increased in October, companies were shedding roughly 11,000 jobs per week during the last half of the month.
Oxford Economics now expects the unemployment rate to rise to 4.4% by year-end, up from 4.3%. It’s expected to remain at this slightly elevated level through much of 2026. While the labor market is showing signs of softening, there is no evidence so far of a dramatic downturn.
Supply Strains Persist as High Rates Limit Growth
Inflation, measured by year-over-year changes in the Consumer Price Index, rose to 3.0% in September. This marks the fifth consecutive month of increases. Although October’s official numbers remain delayed, most economists assume inflation continued its slow upward trajectory. This puts the Federal Reserve in a difficult position: cutting rates to support the labor market risks fueling further inflation.
Normally, Fed rate cuts and mortgage rates move together. However, lowering rates too quickly could push mortgage rates higher as lenders seek returns that compensate for inflation risk over time. By the end of October, Freddie Mac reported that the 30-year fixed mortgage rate had fallen to 6.17%, the lowest level in a year. By November 6, rates had nudged back up to 6.22%. As a result, there is considerable uncertainty around how many cuts the Fed will make through the end of 2025 and into 2026.
Regardless of forthcoming Fed decisions, mortgage rates tend to lag changes in Fed policy. Lagged mortgage rates in turn slow the timeline between improved affordability and new short-term rental supply. The high-rate environment that began in 2022 remains firmly in place.
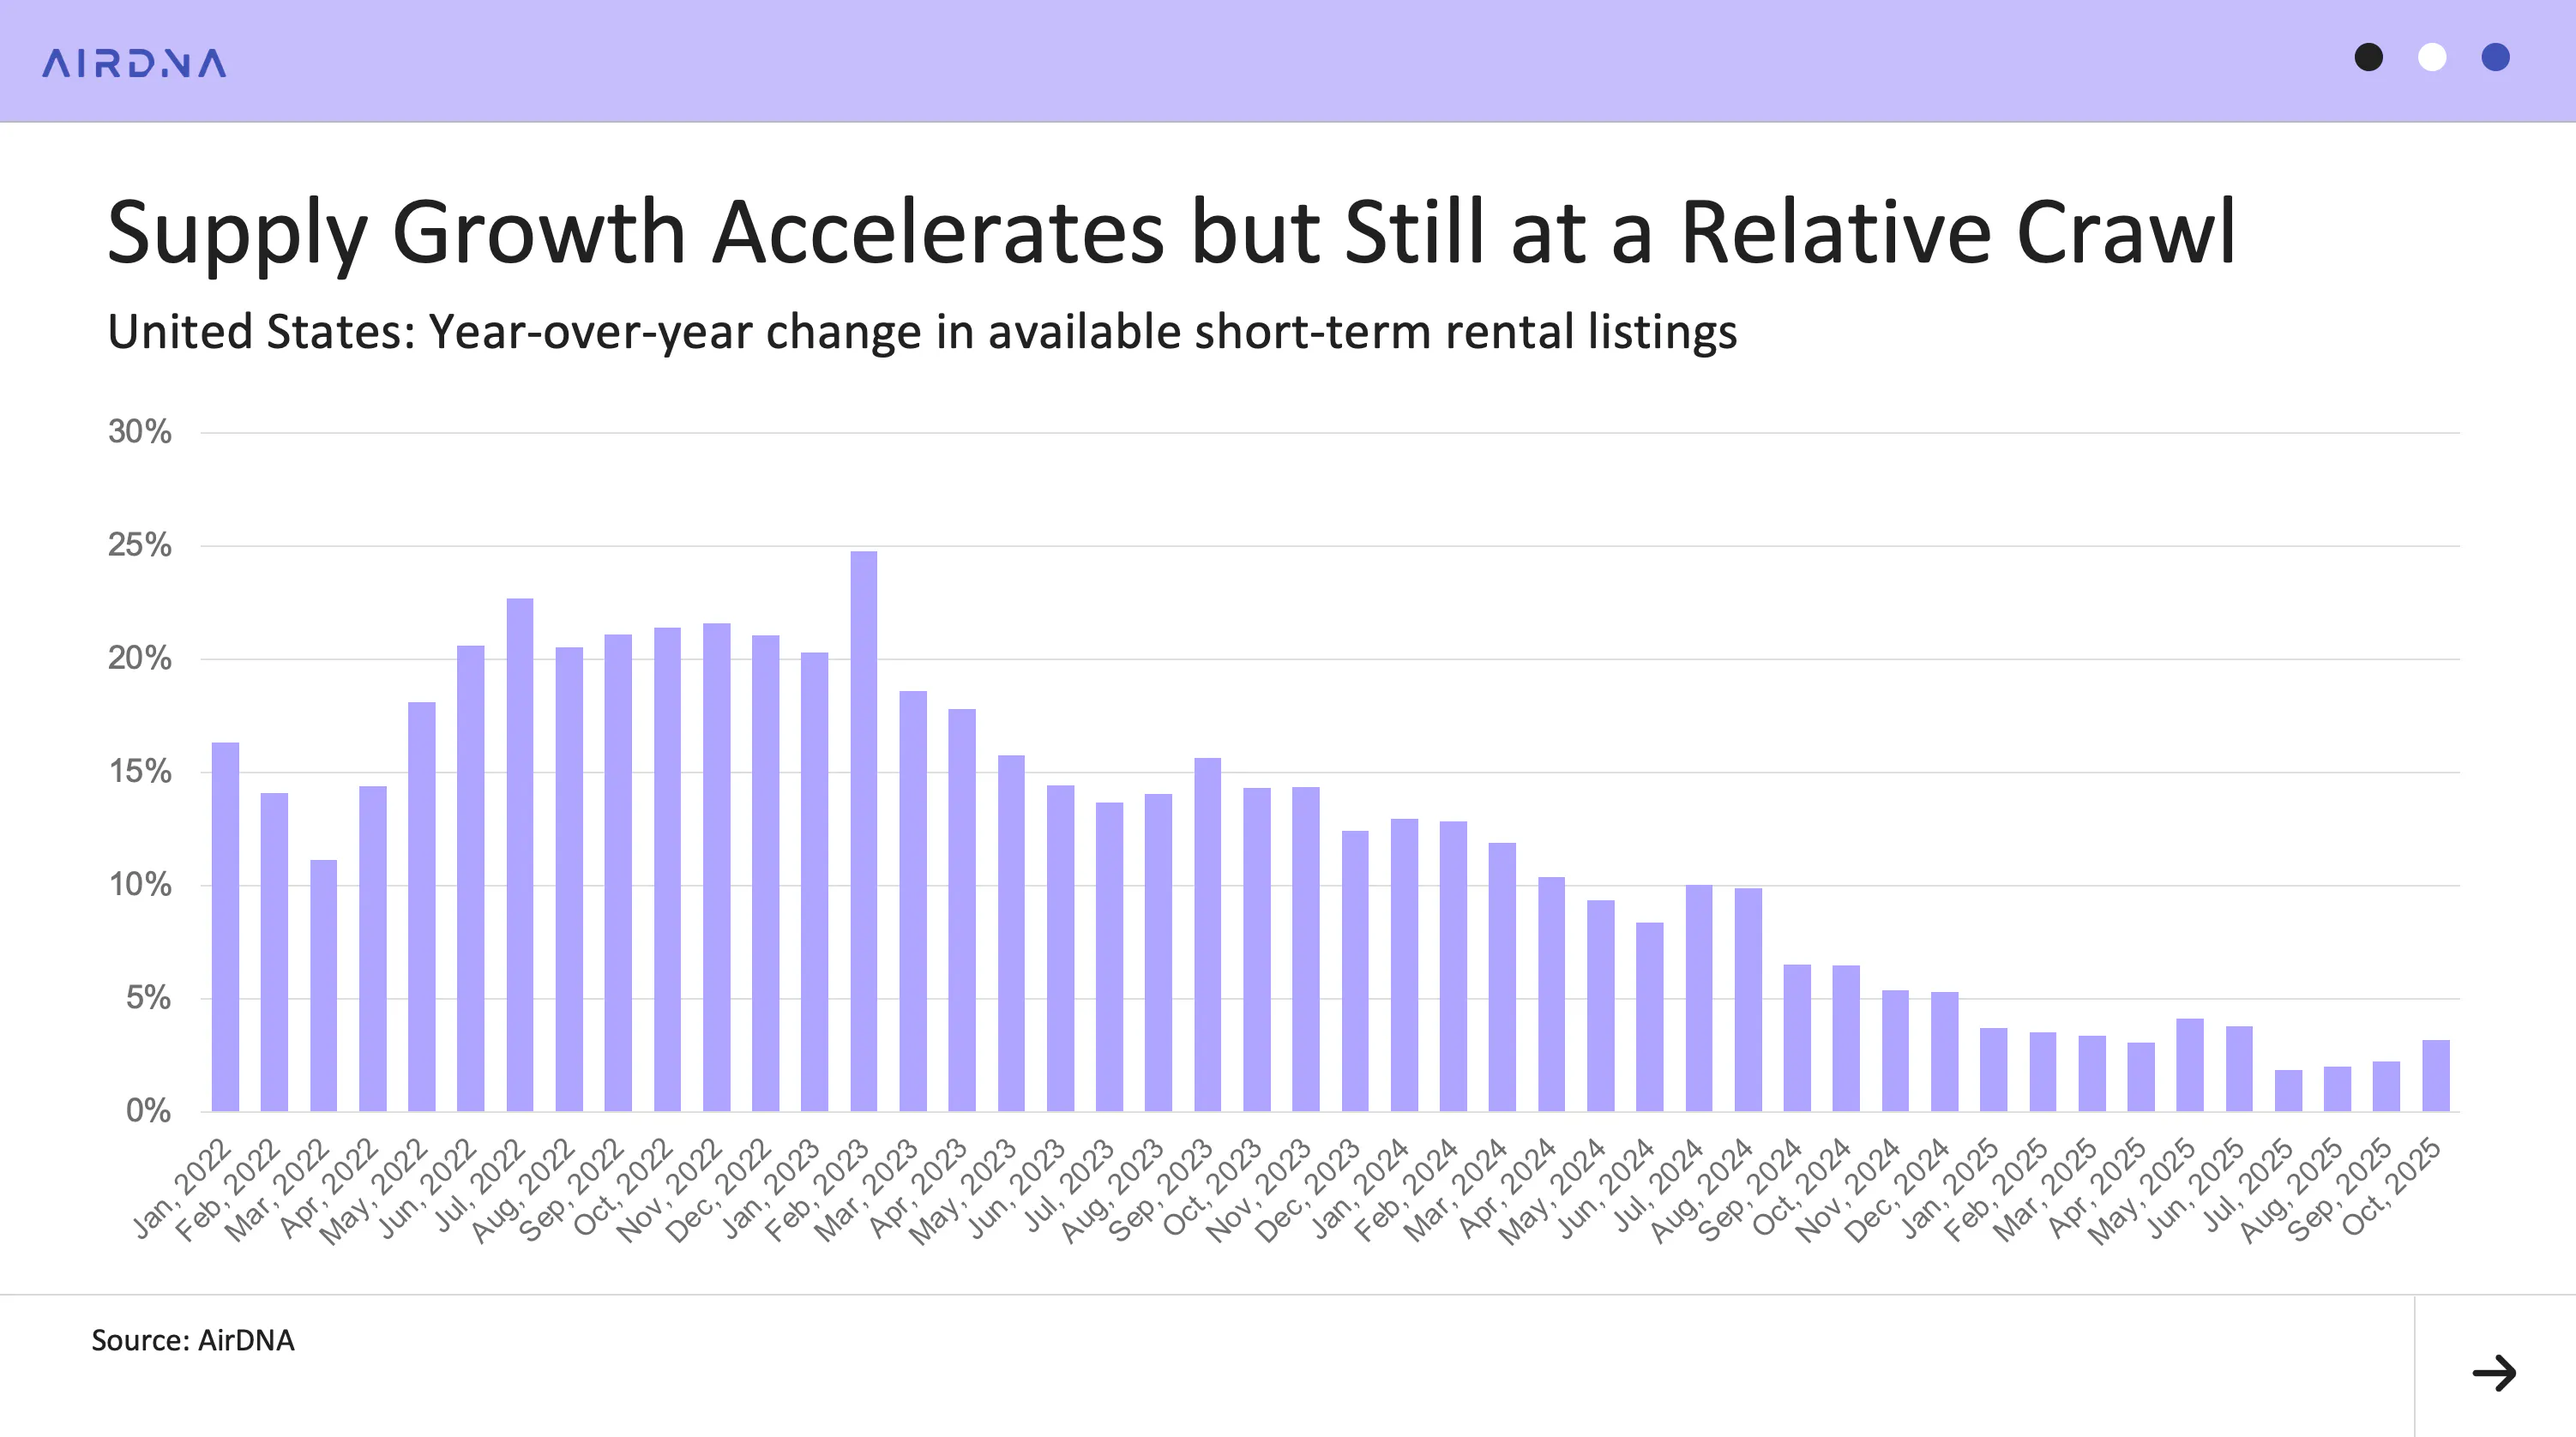
Elevated rates, combined with record high home values, have kept supply growth subdued. Year-over-year increases are at or below 4.1% throughout 2025. October’s supply growth rate of 3.2% is slightly higher than September’s 2.2%, but still far below the 20%+ gains seen as recently as early 2023.
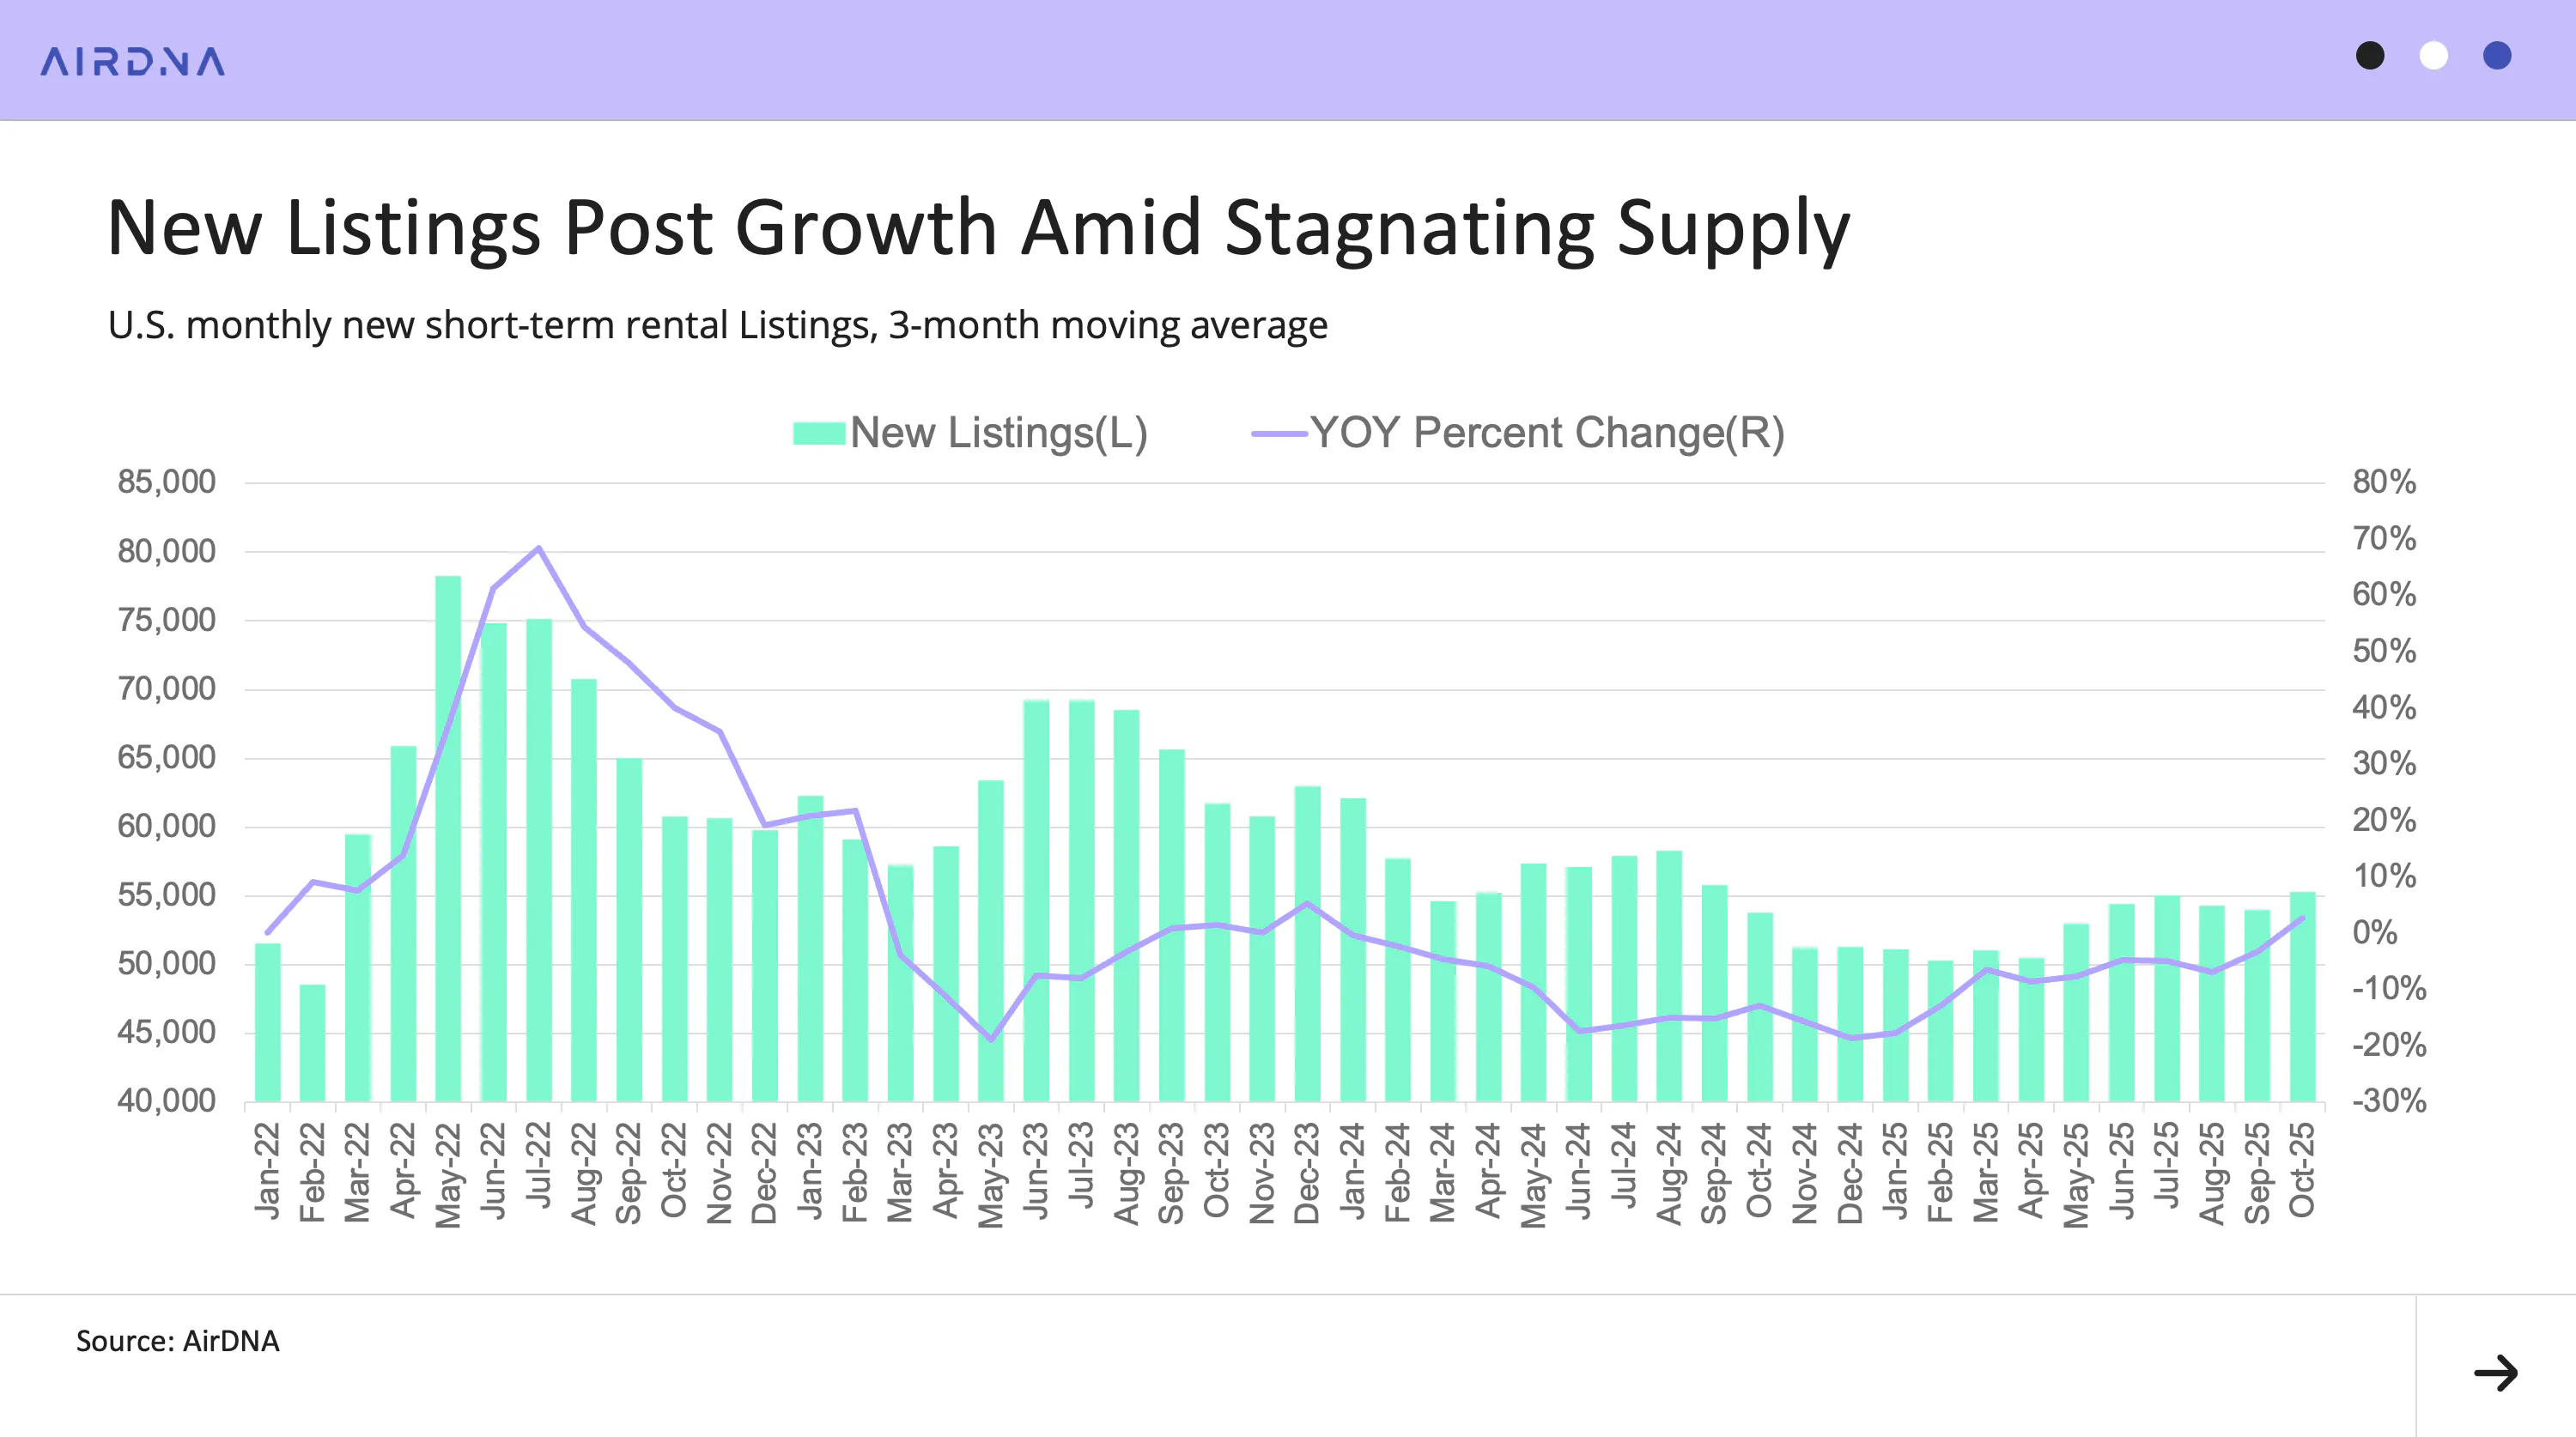
New listings drive supply growth along with attrition and reactivated listings. They began declining in early 2024 and have continued decreasing month over month. New listings finally broke a nearly two-year streak of year-over-year declines in October.
The current YoY growth figure, +2.8%, represents a major improvement from September’s –3.2%. The growth rate of new listing activity reached its lowest point in late 2024 at around -18% and has been recovering since, likely in response to demand growth and the end of a long stretch of occupancy losses.
Demand Rebounds, but Occupancy Still Slips
Demand stayed solid through most of 2025, with year-over-year growth in every month except September. The September dip was mostly due to a calendar shift. One day of the Labor Day weekend landed in August this year, so the comparison was unusually tough.
Even then, September demand looked almost identical to 2023 levels. The consistency indicates it’s always a difficult month for travel because it sits between summer and the holiday season.
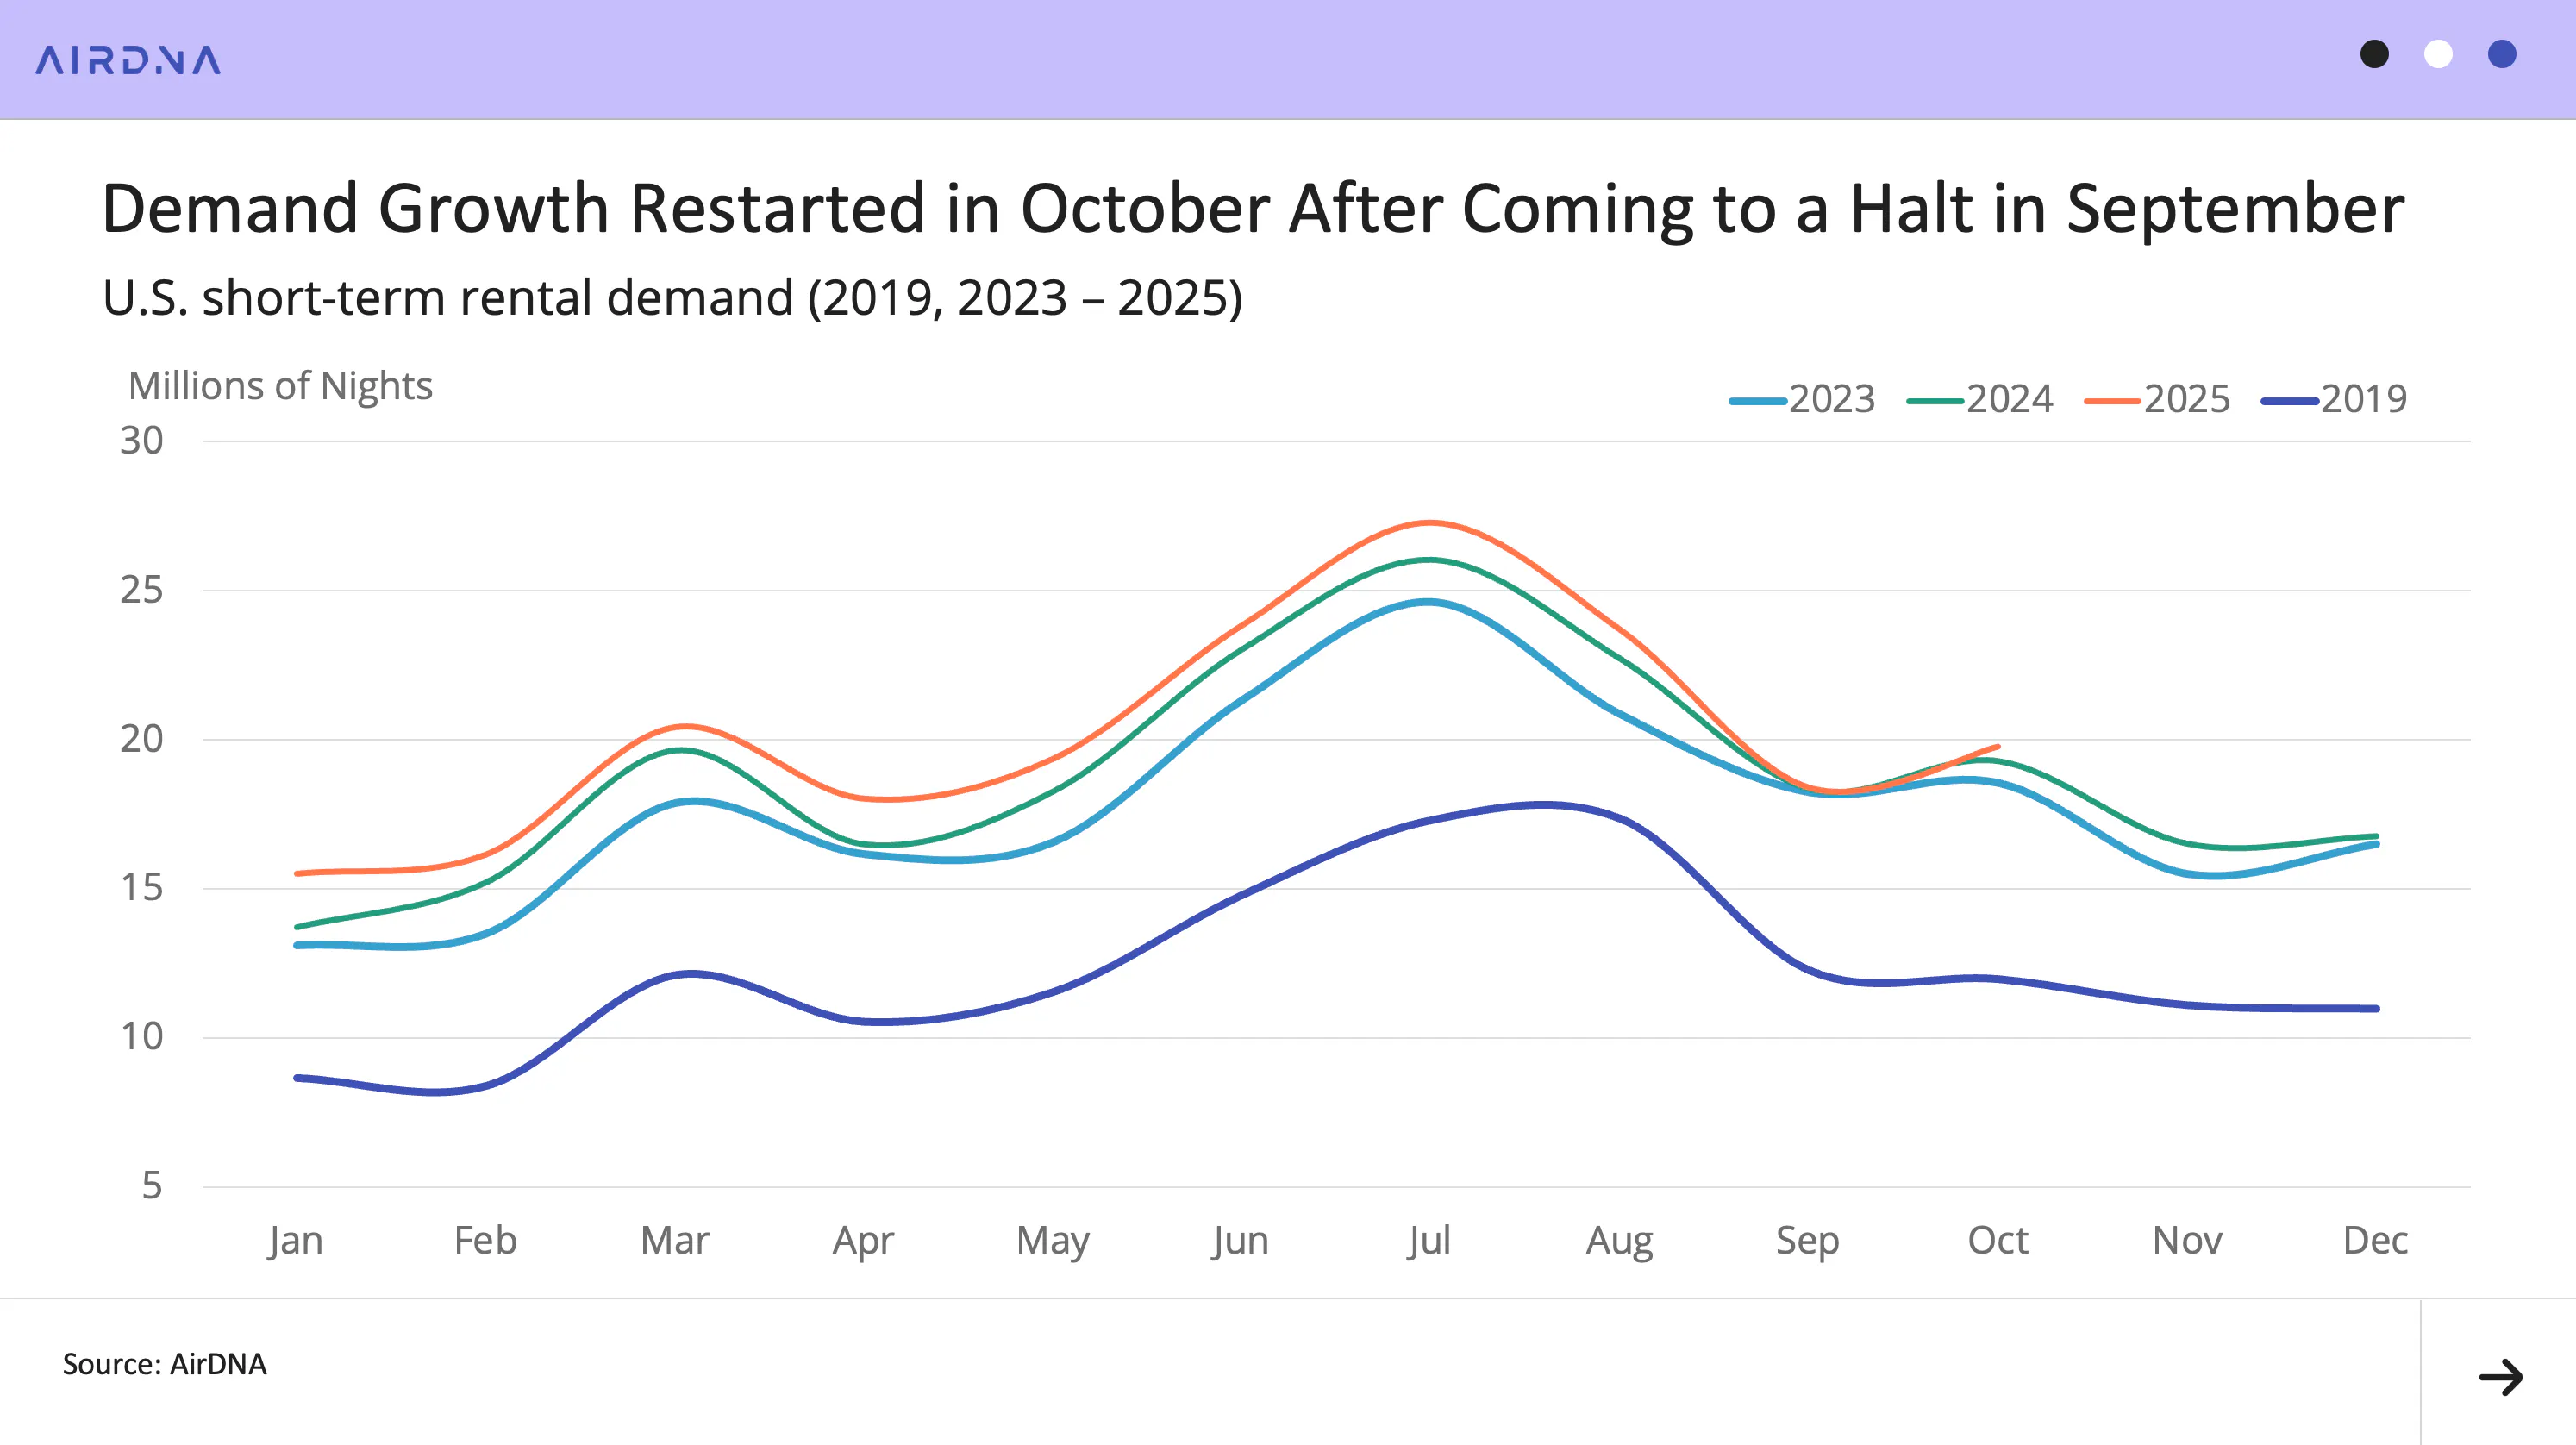
Demand returned to growth in October, rising 2.5% year-over-year (YoY). While this uptick is encouraging, it wasn’t enough to prevent occupancy from declining for a second straight month.
October occupancy fell 1.5% YoY, though this was a smaller drop than September’s –3.6%. Even with these recent declines, year-to-date occupancy for 2025 remains about one percentage point higher than during the same period in 2024.
Slower supply growth has helped stabilize occupancy after the sharp losses that followed the 2021 peak, but softer summer demand kept occupancy gains limited.
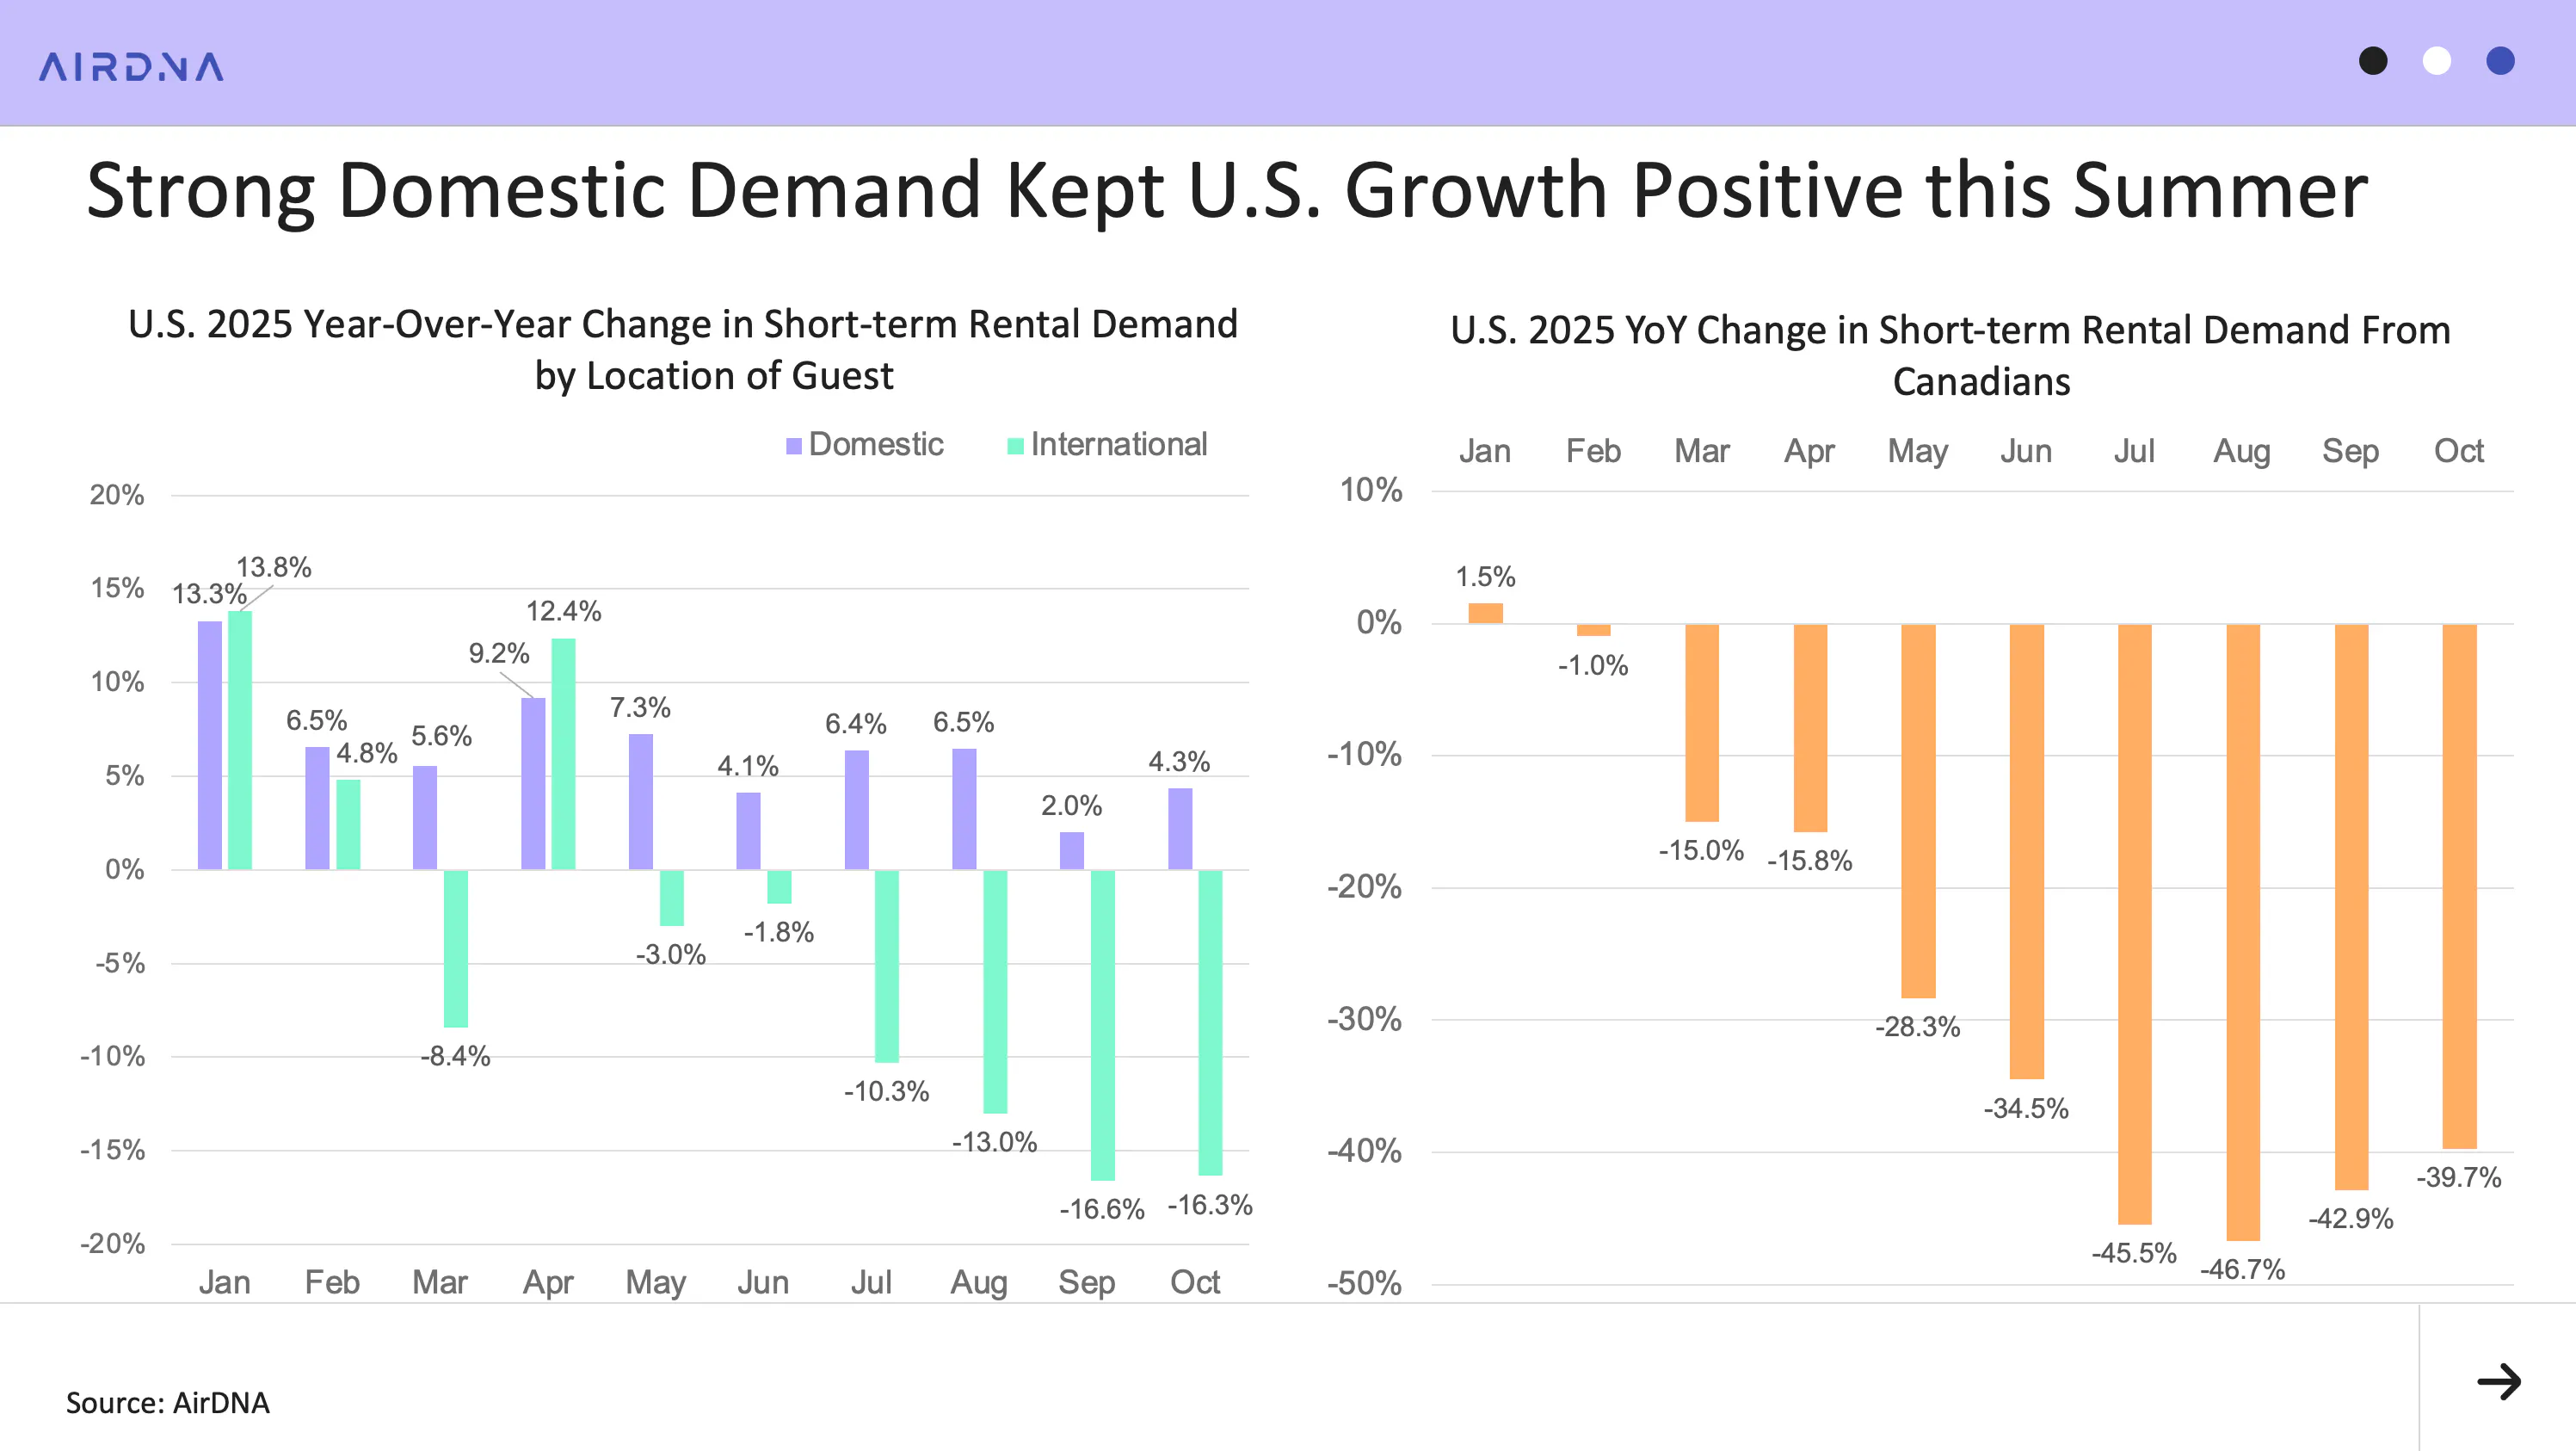
The improvement in October demand is especially noteworthy given the drop in international travel. Since tariffs were announced in April, inbound international visits to the U.S. have fallen, particularly during the summer peak.
Domestic travelers have filled much of that gap, likely helped by a weaker U.S. dollar that has made overseas trips more expensive. This shift does change where demand shows up, though. Destinations that rely heavily on Canadian visitors may feel the impact more than others.
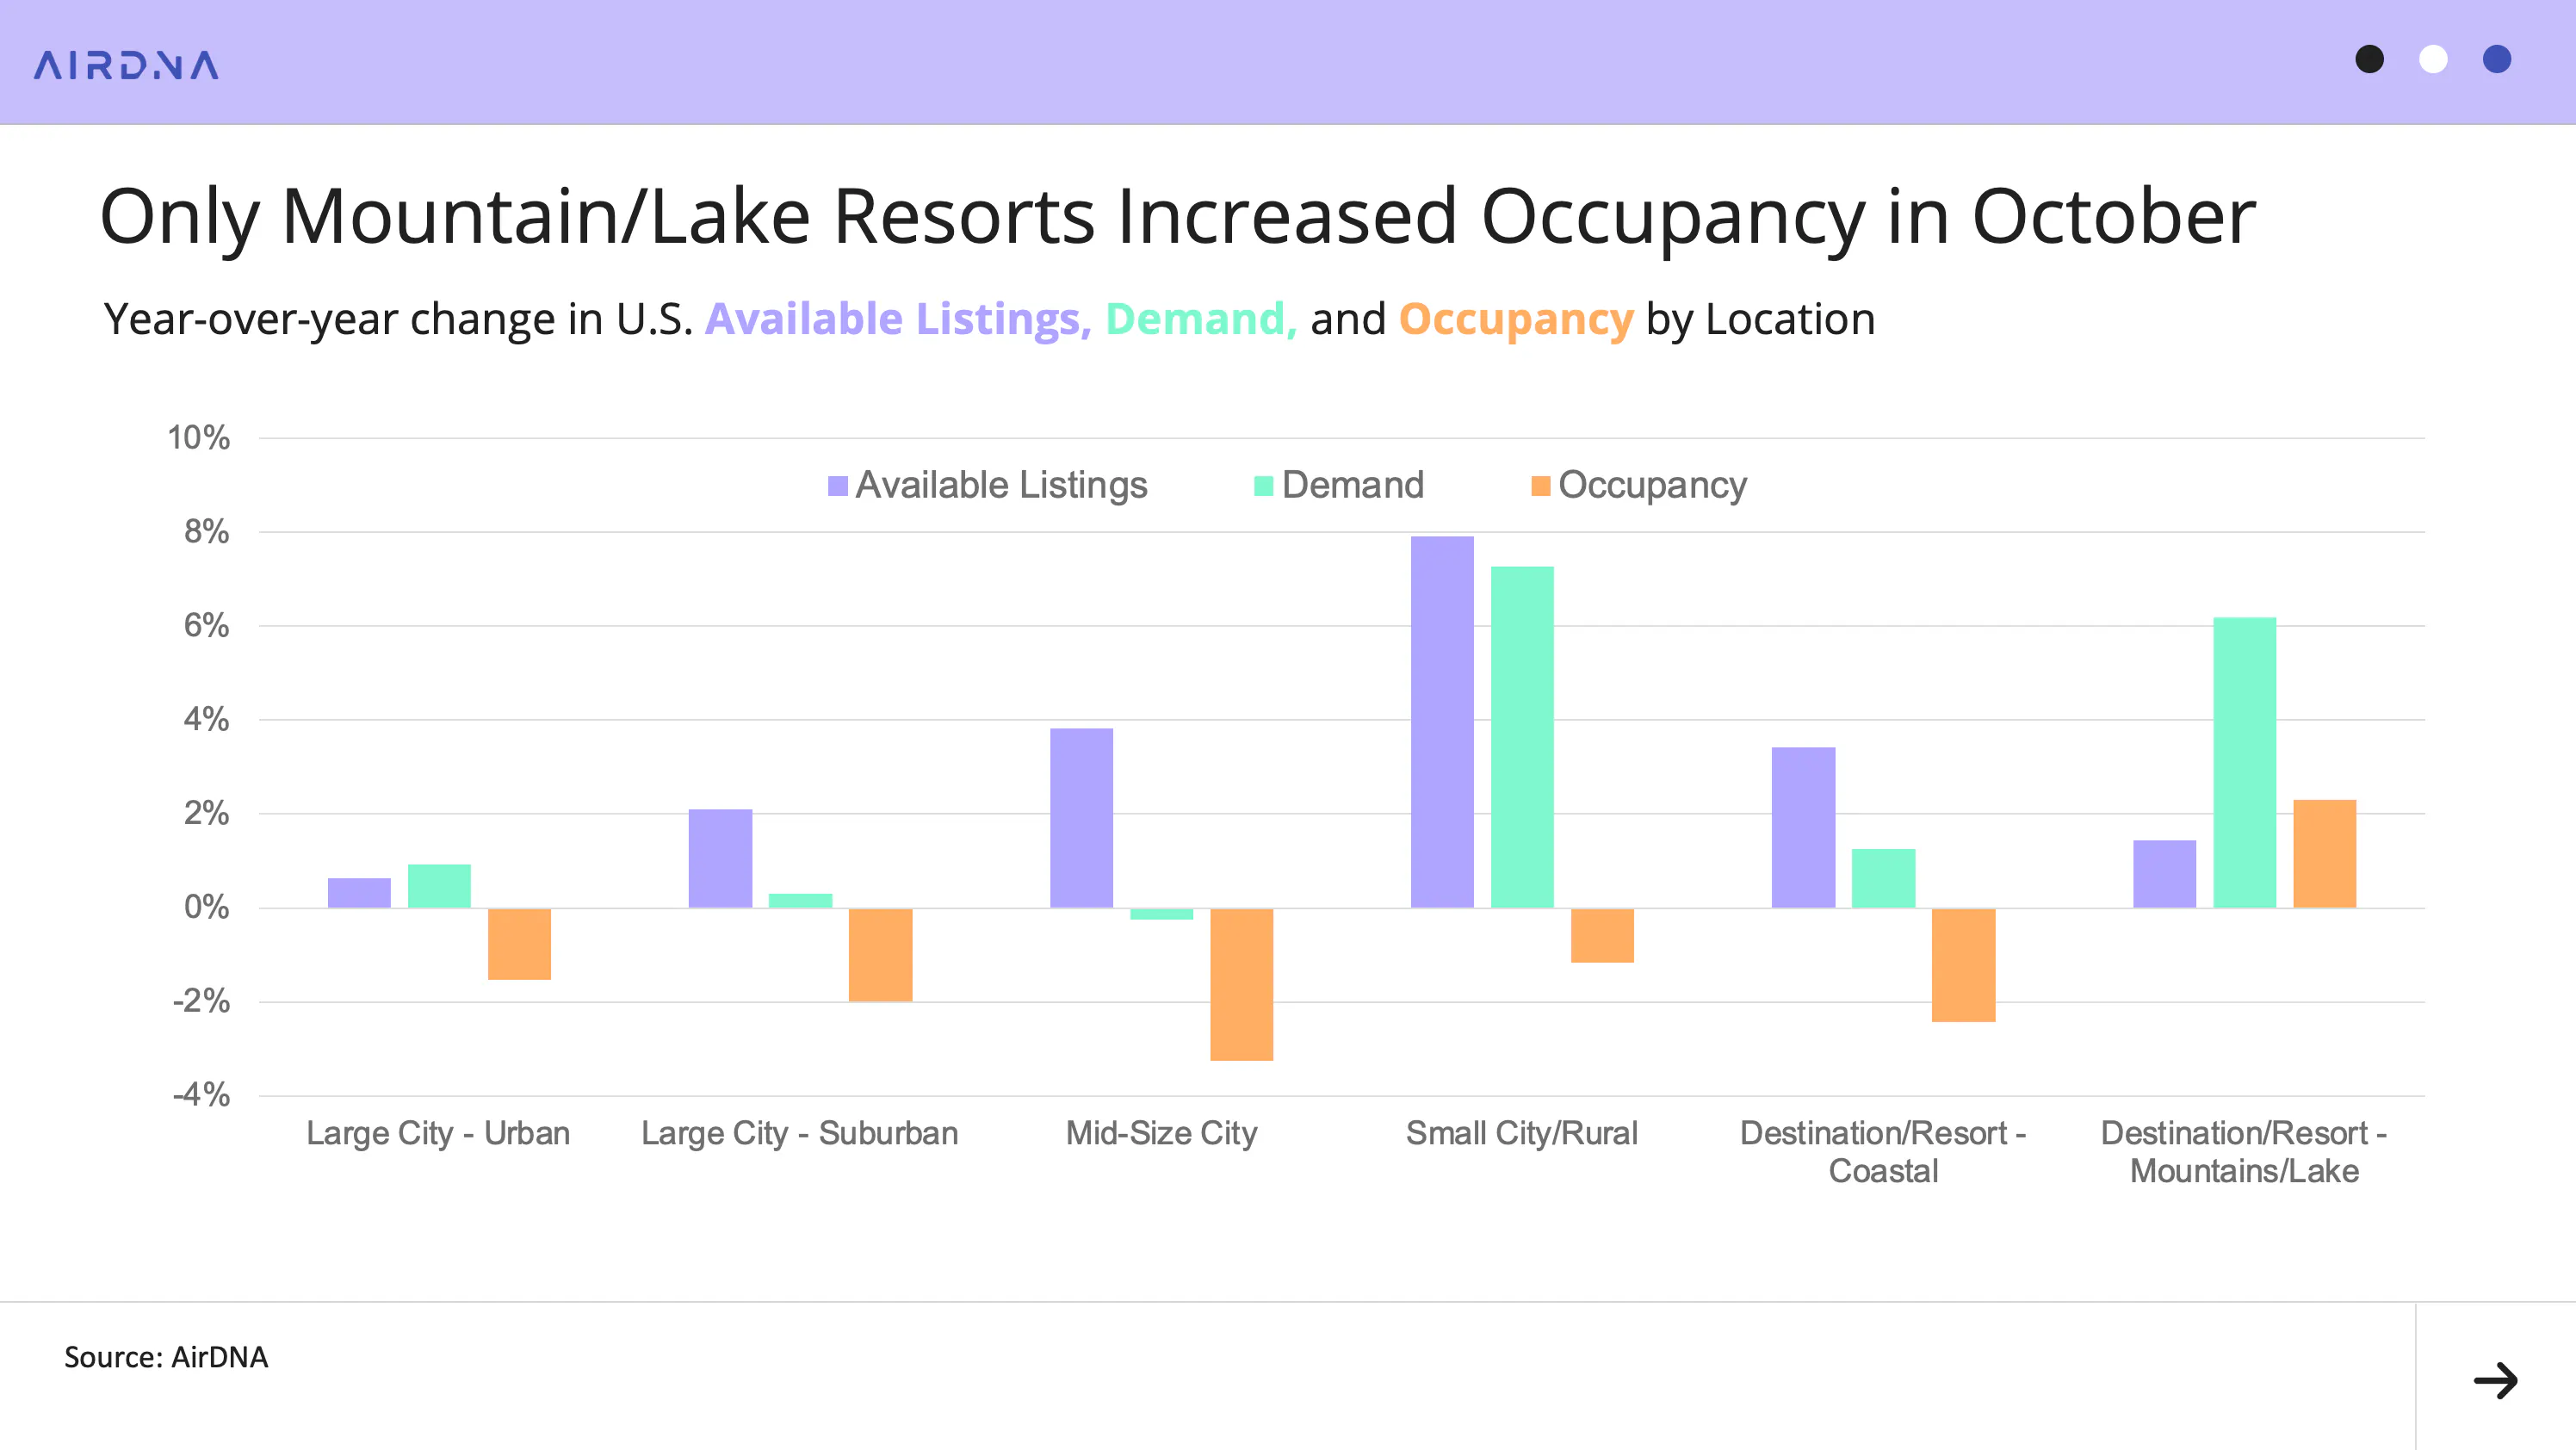
Occupancy varied by location type and price tier
Performance also varied by market type:
- Mountain/Lake Resort markets were the only segment to grow occupancy.
- Small City/Rural areas saw strong demand offset by faster listing growth, which diluted occupancy.
- Mid-Size Cities saw slight demand declines paired with the second-fastest supply growth, leading to the steepest occupancy drop of all groups.
Over the summer, only resort destinations were able to grow occupancy, highlighting the continued strength of leisure-first travel.
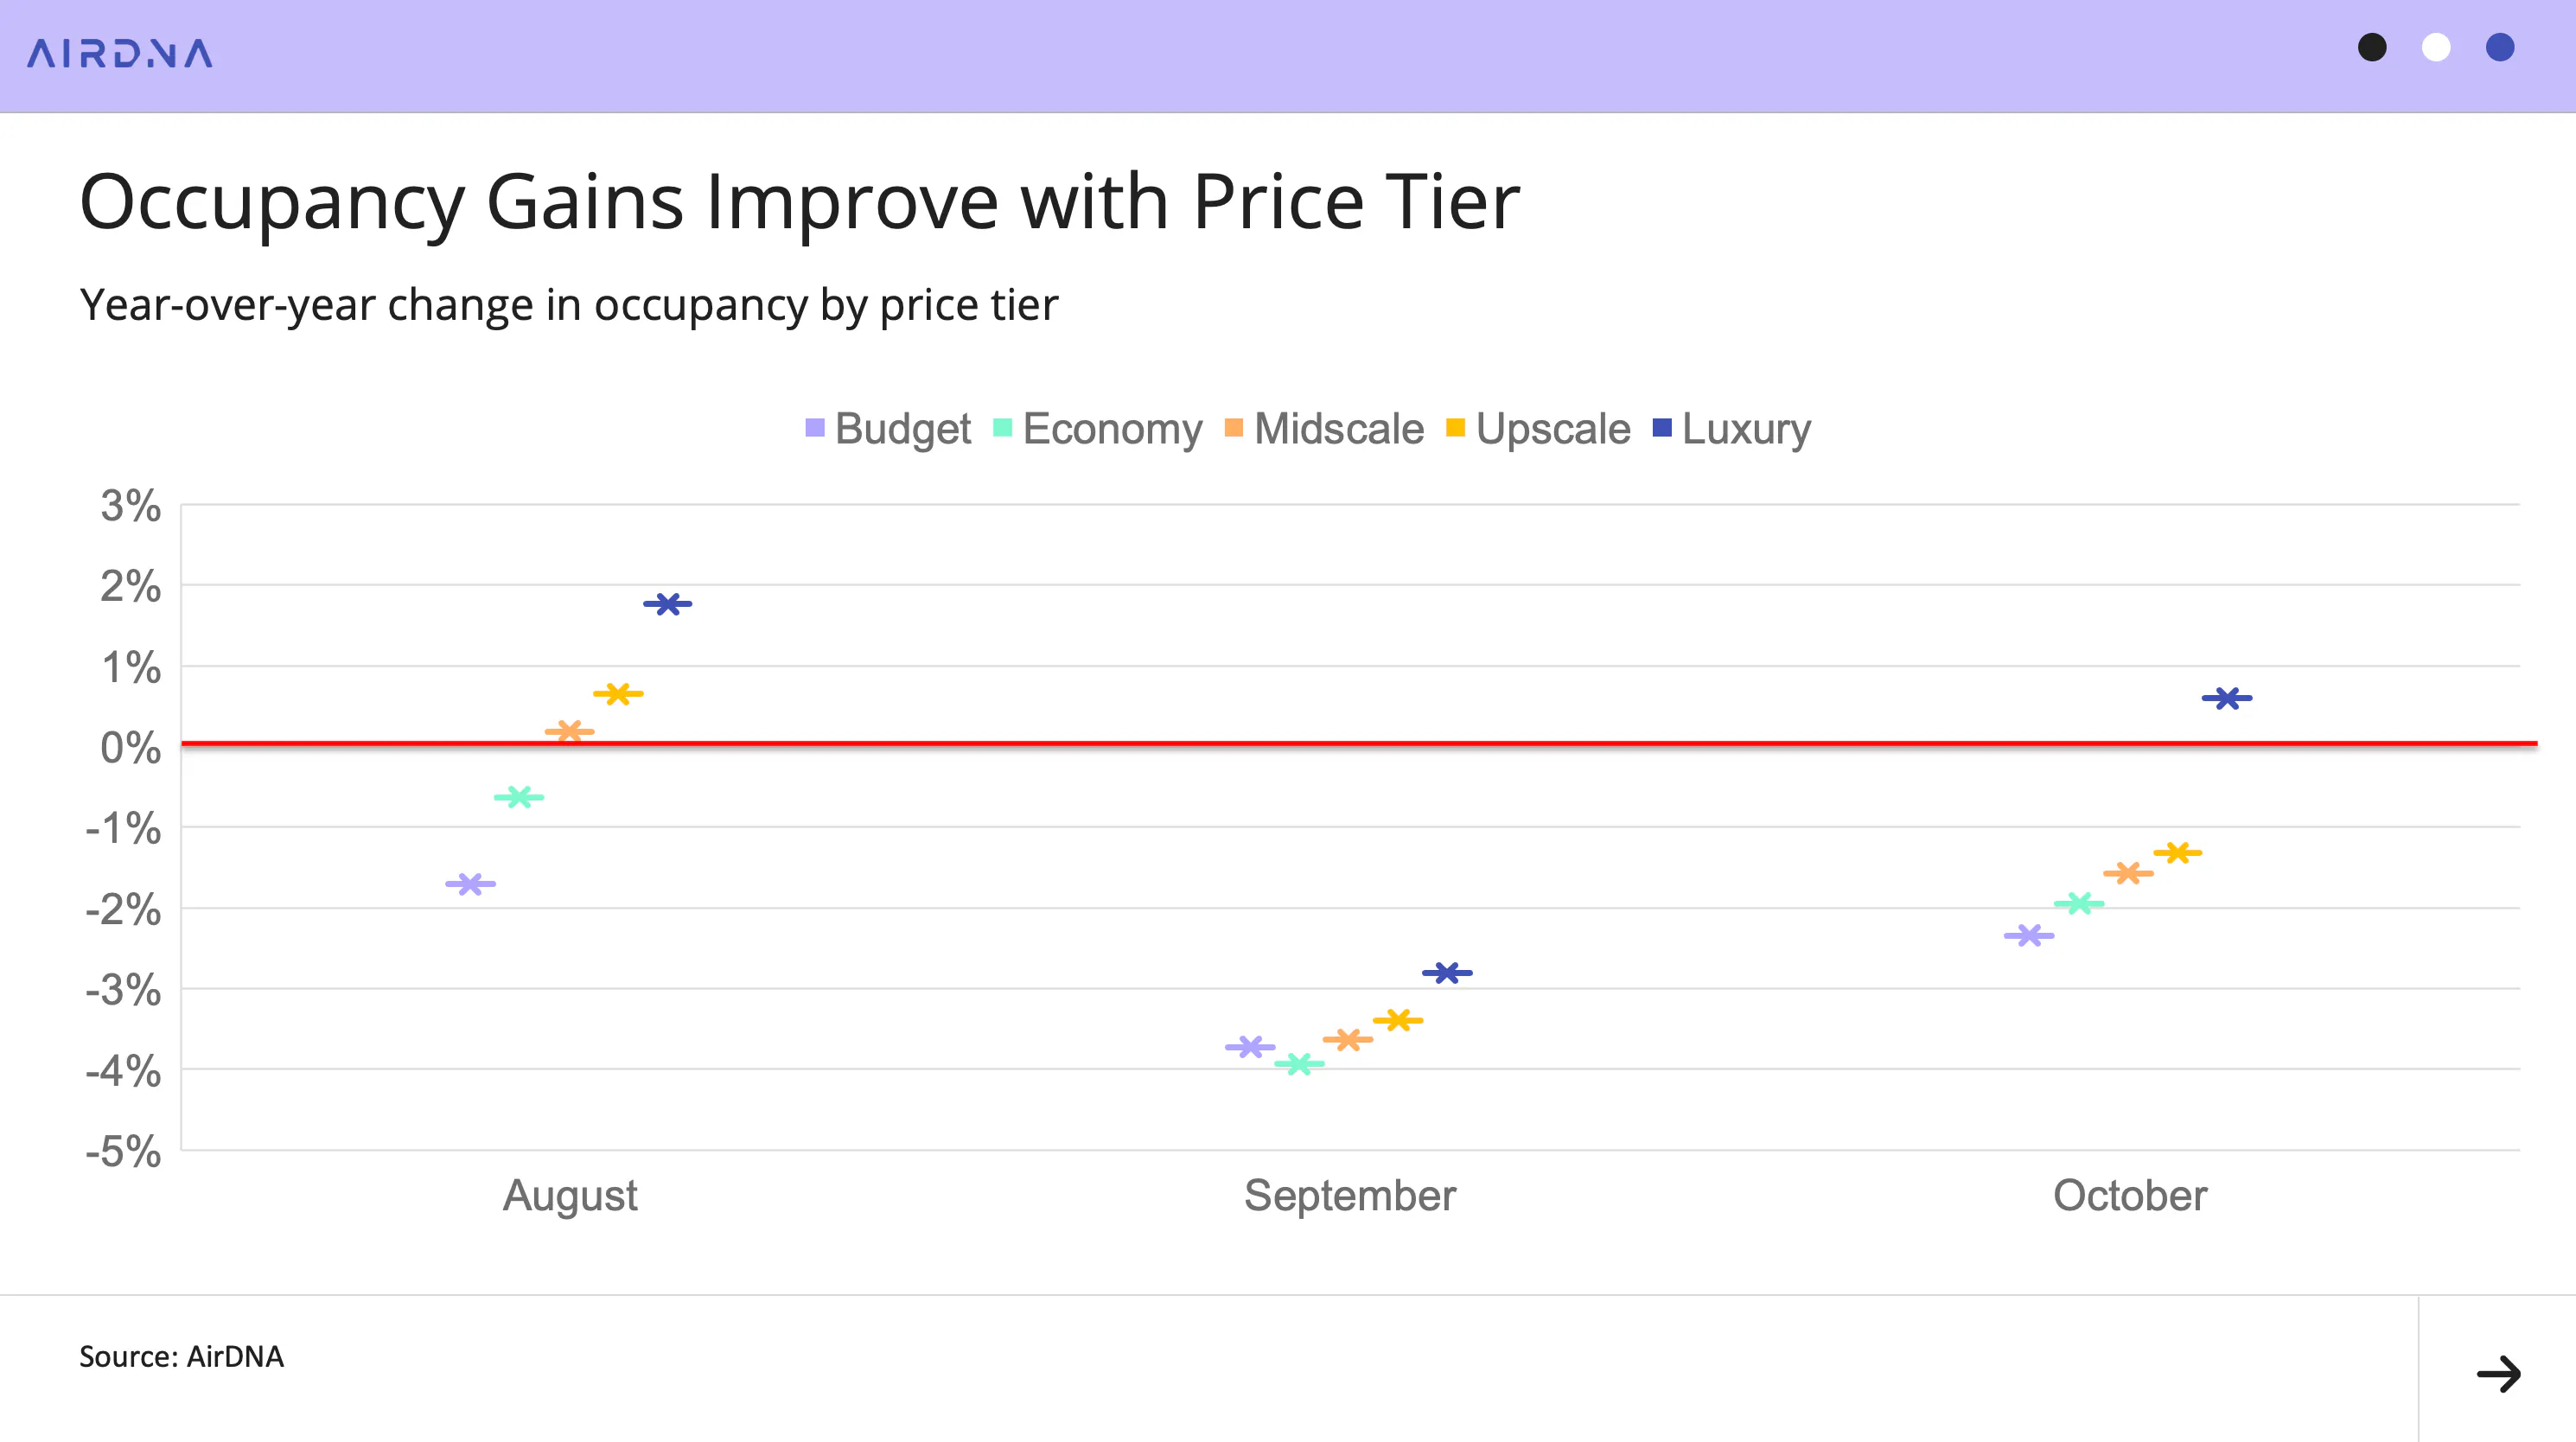
A similar pattern showed up across price tiers. Higher-priced properties continue to perform best. Luxury listings were the only tier to grow occupancy in October, while each lower tier saw progressively larger declines. This trend has been consistent since summer.
Market Performance Splinters Across Regions
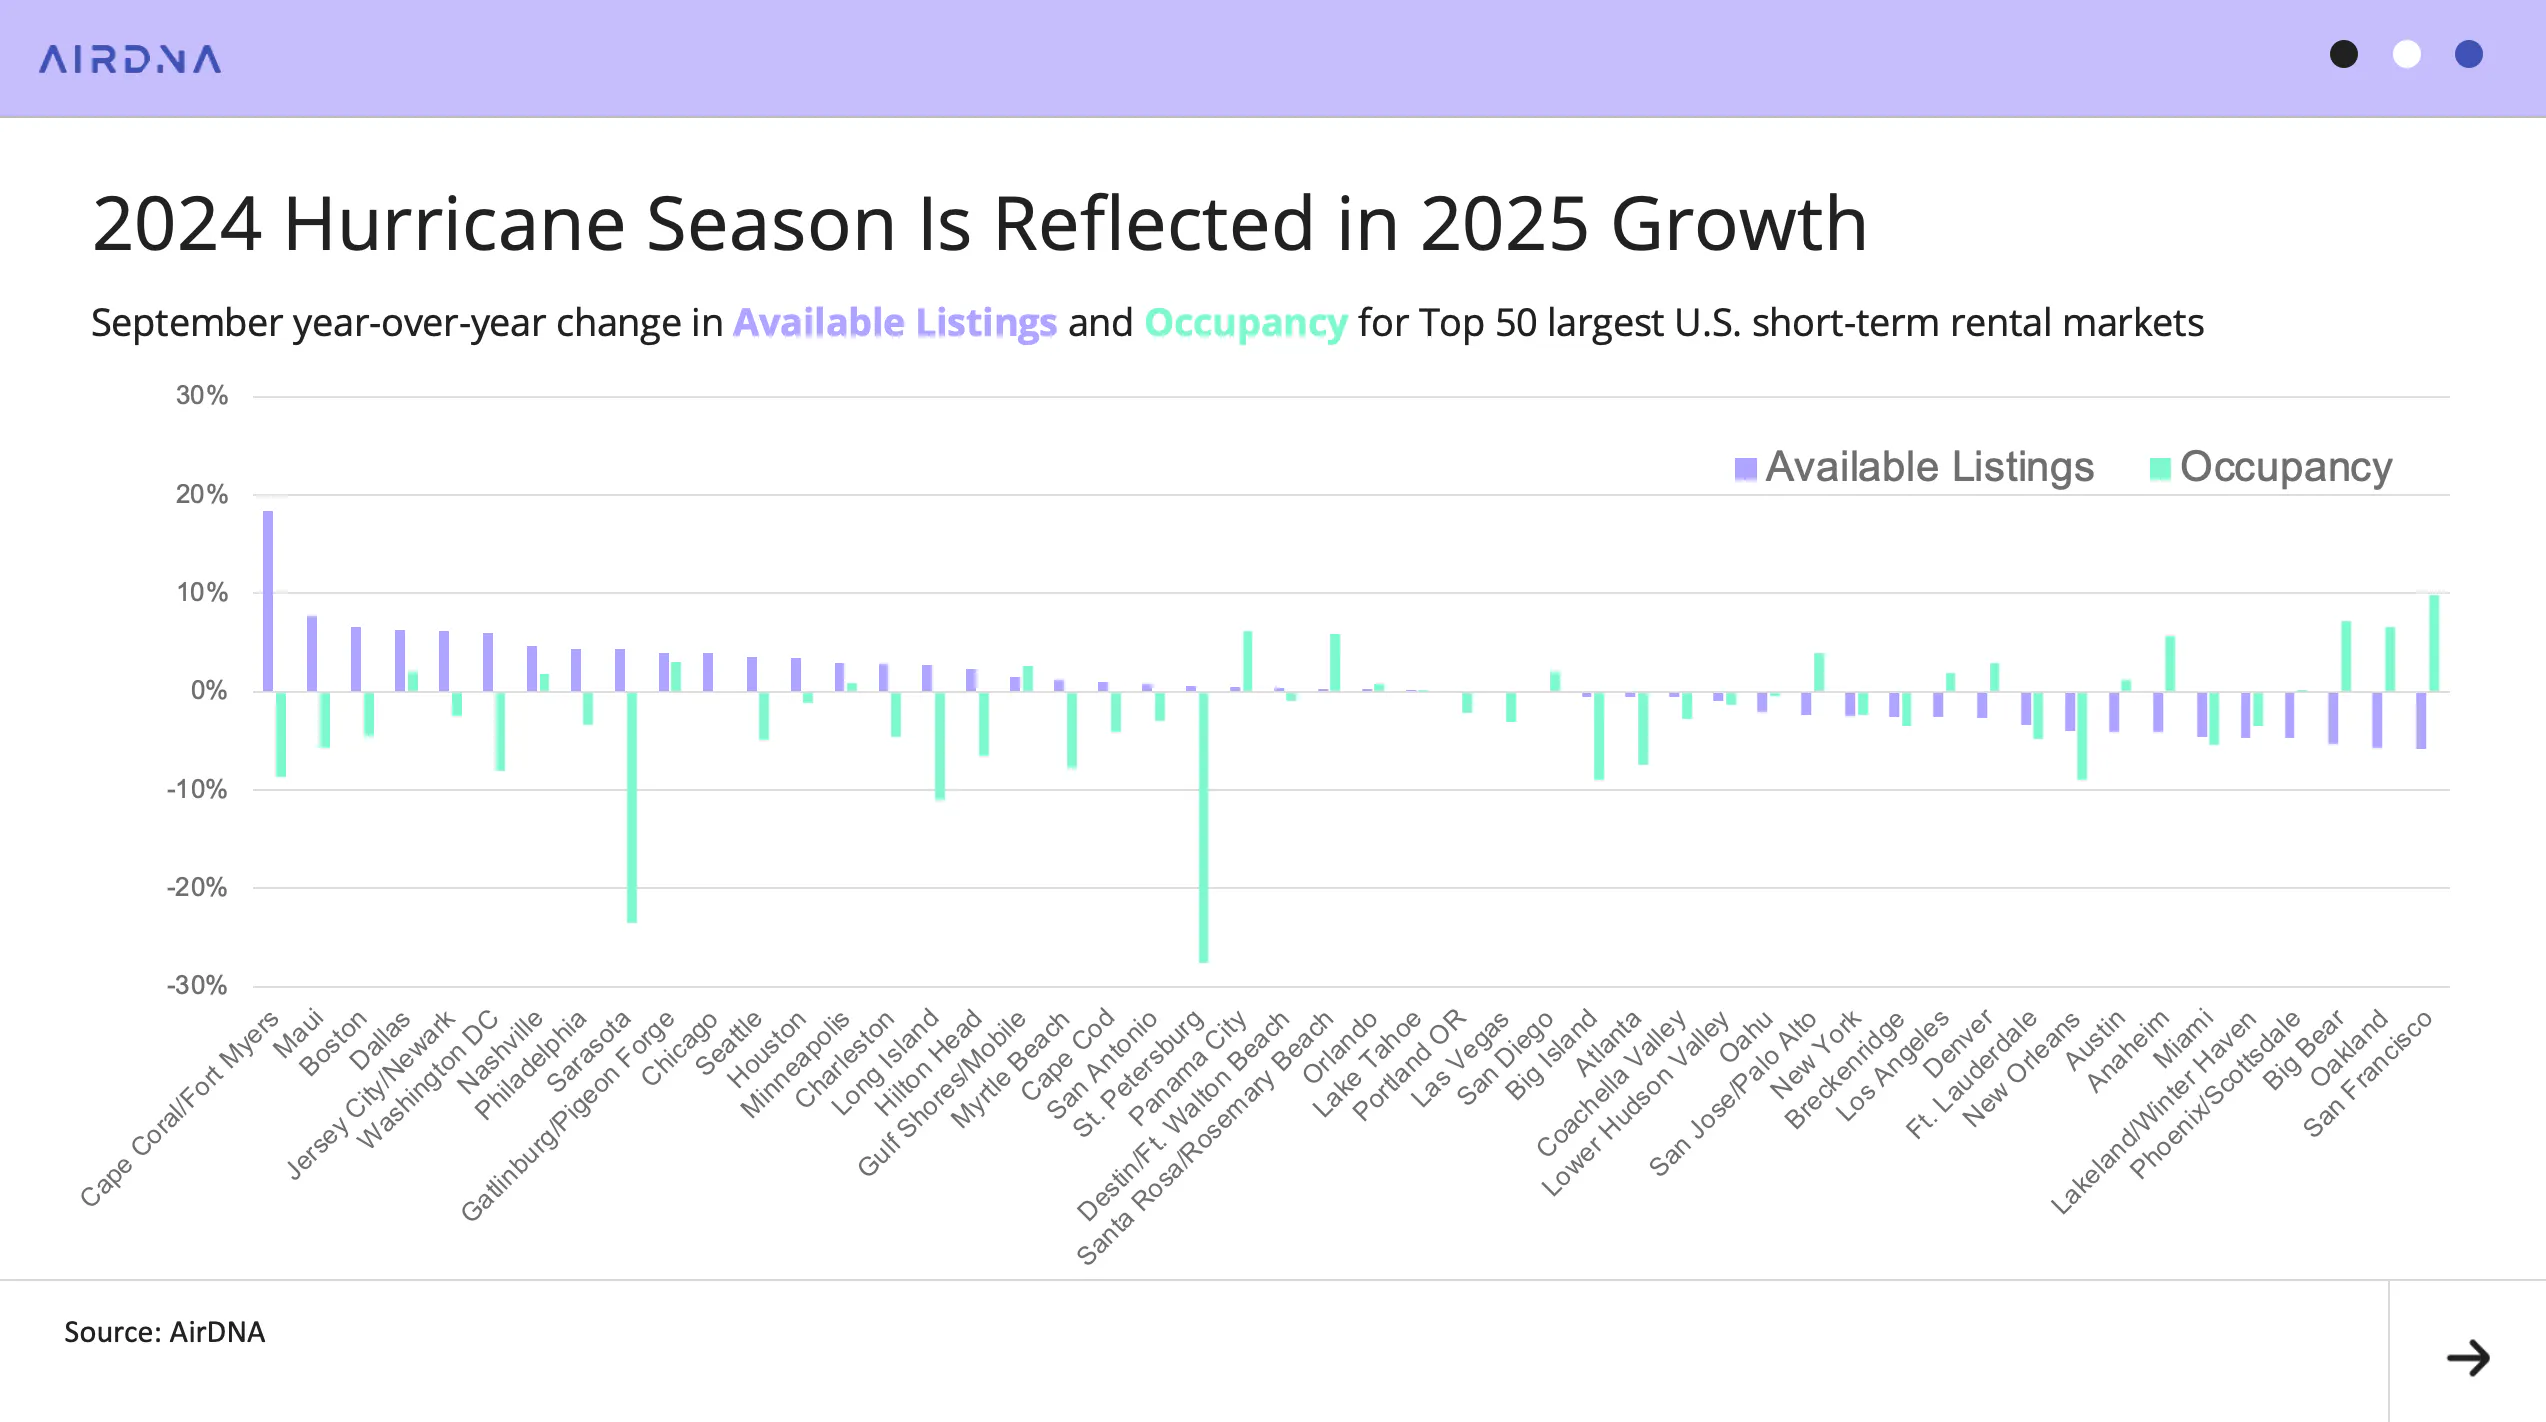
Market results varied sharply across the country in October, shaped by weather recovery, regulatory shifts, and uneven supply growth.
Two markets saw the most dramatic occupancy drops: Sarasota, Florida and St. Petersburg, Florida. Both reported declines of more than 20% year-over-year (YoY), but this reflects last year’s hurricane-driven displacement, not a sudden fall in demand. In October 2024, both markets housed people fleeing Hurricane Milton, temporarily boosting occupancy. With a quieter hurricane season this year and fewer repeat travelers in the shoulder-season months, occupancy simply normalized.
Outside these outliers, a softer pattern was visible across the Top 50 markets: areas with the fastest listing growth tended to see weaker occupancy. This was most evident in markets still recovering from natural disasters:
- Cape Coral/Fort Myers, Florida saw listings rise +18.4% YoY, while occupancy fell –8.4%. The region continues to rebuild after Hurricane Ian and inventory climbs beyond pre-storm levels.
- Maui, Hawaii posted +7.7% listing growth and a –5.8% occupancy decline as it recovers from 2023’s wildfires and works to balance tourism with environmental needs.
Regulatory pressure also shaped performance. Markets with stricter STR rules saw supply shrink and existing operators benefit:
- San Francisco, California had listings decline –5.8% YoY, with occupancy rising +9.8%.
- Oakland, California saw listings fall –5.7% YoY, with occupancy up +6.5%.
Overall, October’s results were driven less by national trends and more by localized factors, hurricanes, wildfires, rapid new supply, and regulatory crackdowns, creating a patchwork of strong and weak performers across the country.
Pricing Firms Up as ADR and RRI Move in Sync
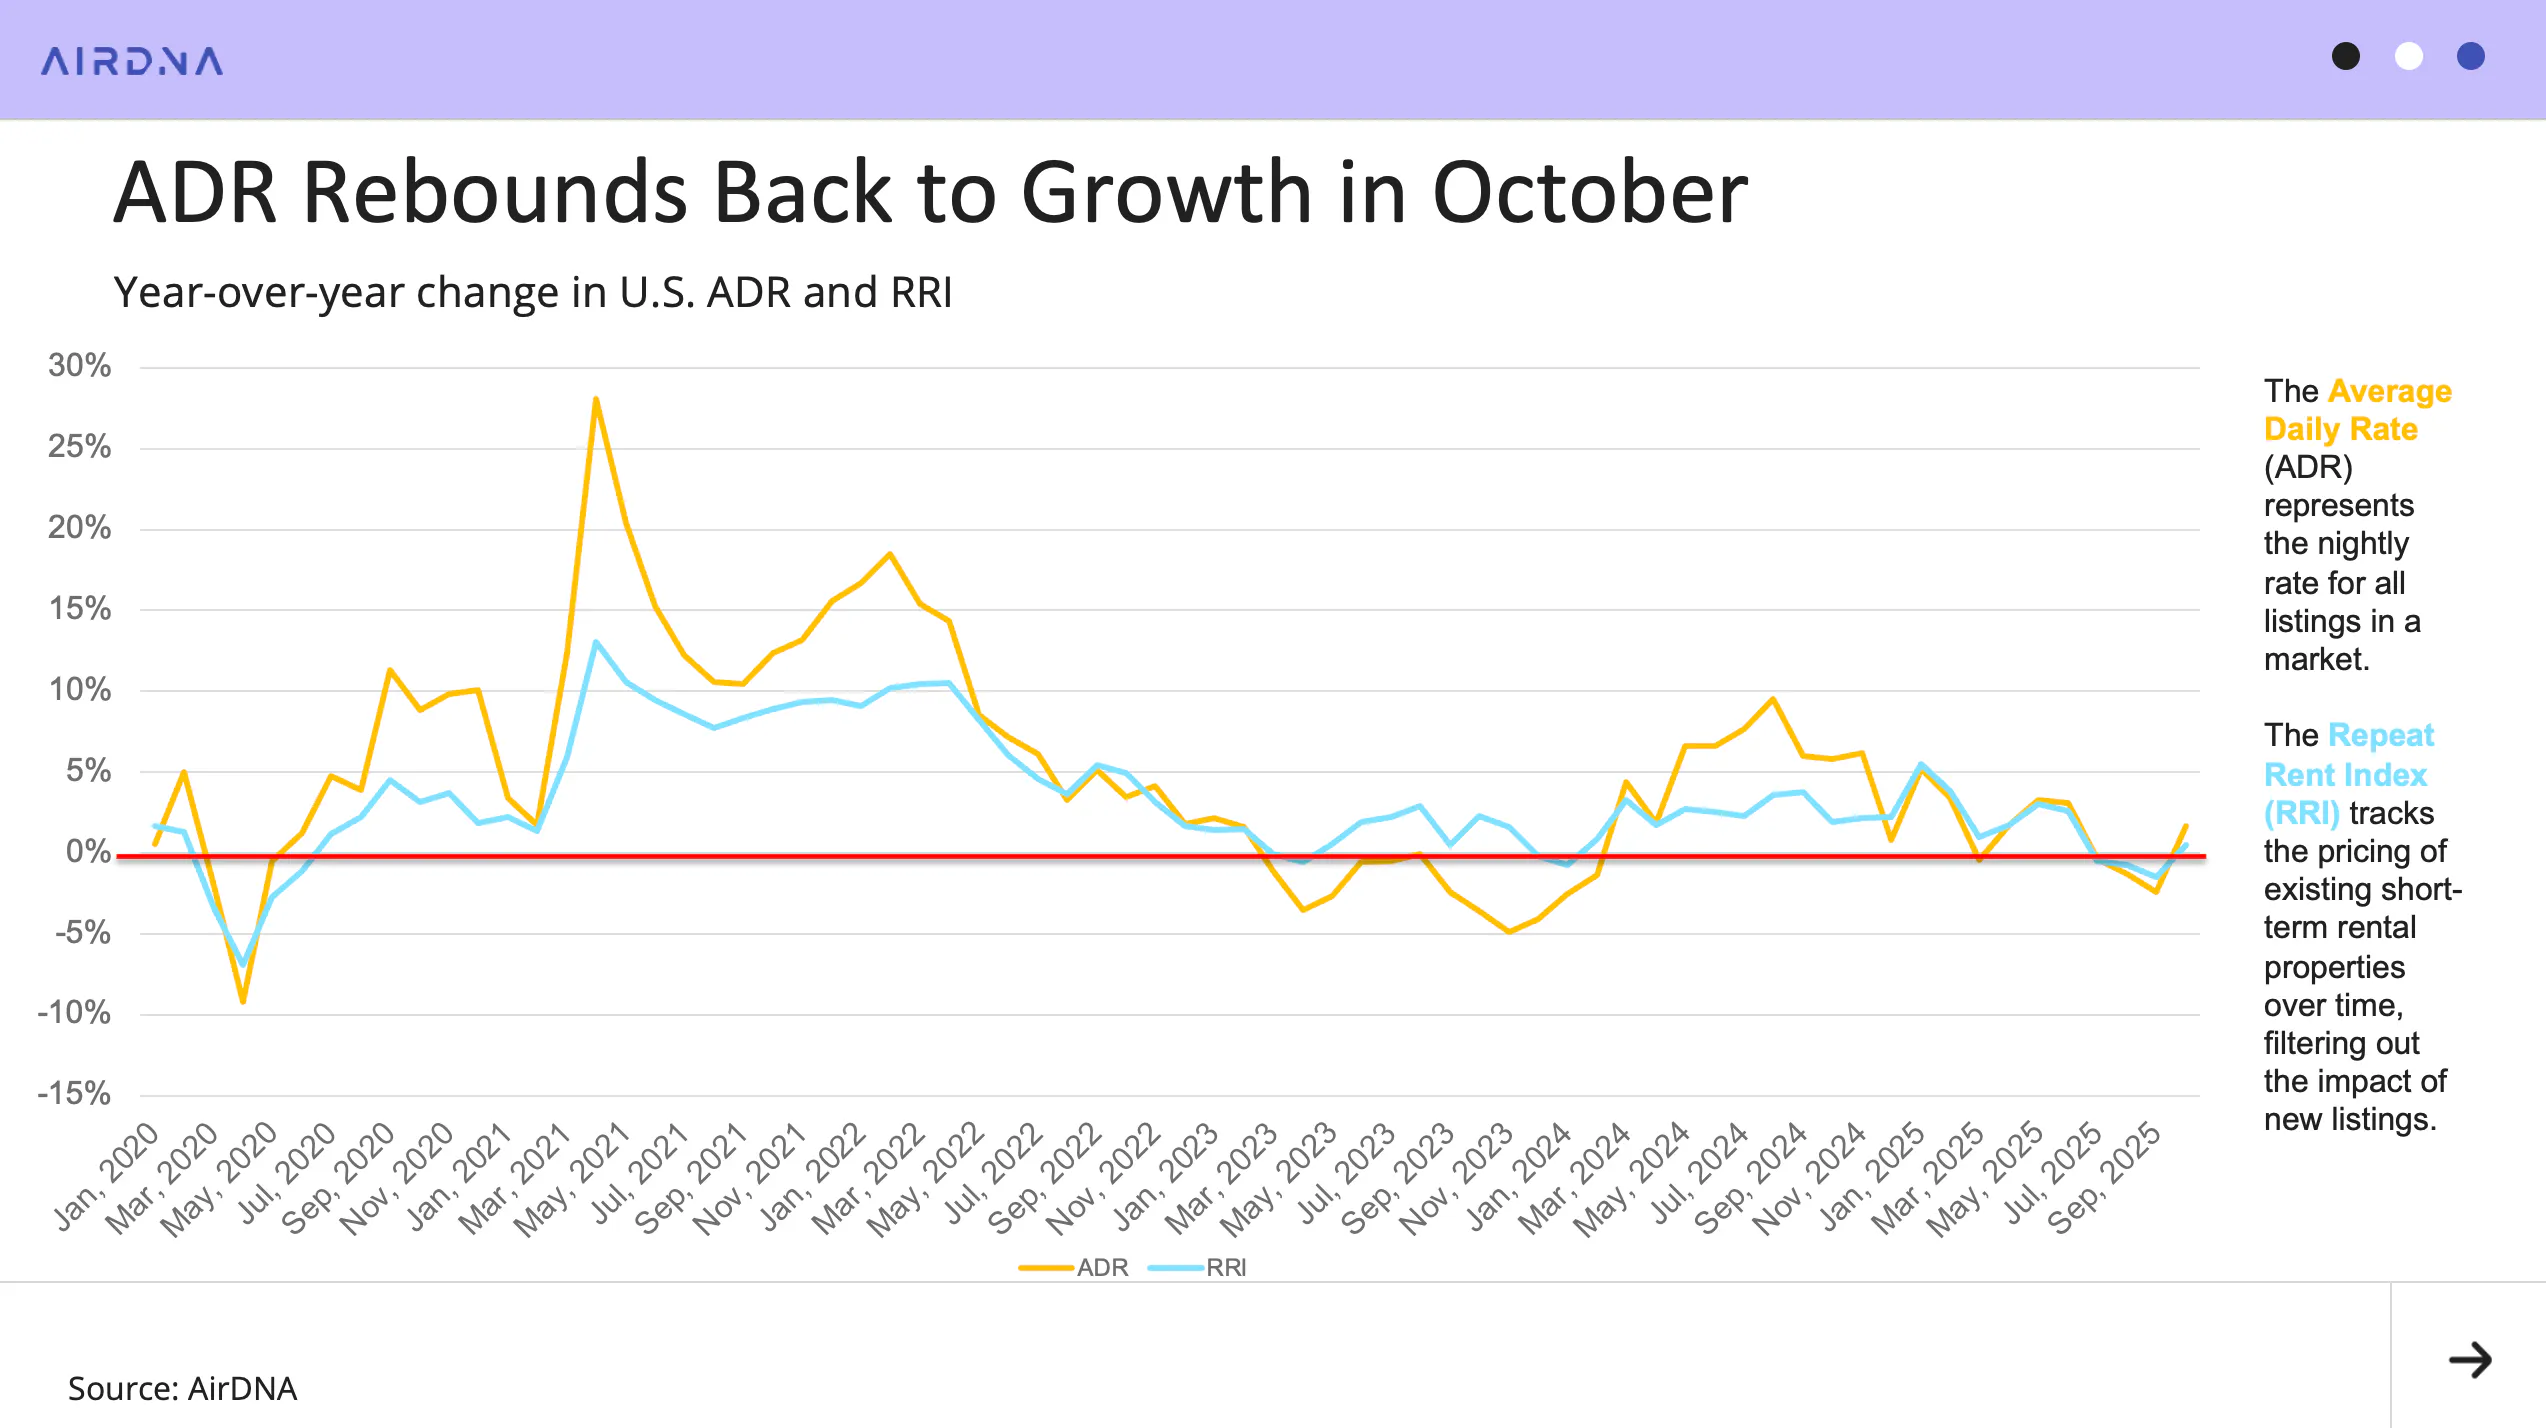
October brought a small but meaningful improvement in pricing power across the short-term rental market. After a –1.5% decline in September, ADR rose 1.7% year-over-year. Operators were once again able to lift rates heading into the end of the year. The Repeat Rent Index (RRI), which tracks nightly rates for existing operators and removes the effect of new listings, also ticked up 0.5%. This indicates that hosts were raising prices even after accounting for changes in inventory.
The relationship between ADR and RRI has shifted noticeably over the past few years. During the high-inflation period of 2022 and 2023, new listings often entered the market at lower prices to appeal to budget-conscious guests. This created a gap between newer and established properties and an accompanying gap between ADR and RRI. In 2024, that trend reversed: inflation fears cooled, and many new listings positioned themselves around premium experiences, narrowing the gap.
Throughout 2025, the two pricing measures have moved much more closely together. This suggests two things:
- New listings are now more aligned with existing stock, making overall pricing more consistent.
- Slower supply growth is reducing the room for price divergence, keeping ADR and RRI on similar trajectories.
Overall, the October data shows that, despite mixed demand signals, operators still have enough confidence (and limited enough competition) to nudge rates upward.
Holiday Pacing Strengthens Despite Short-Term Softness
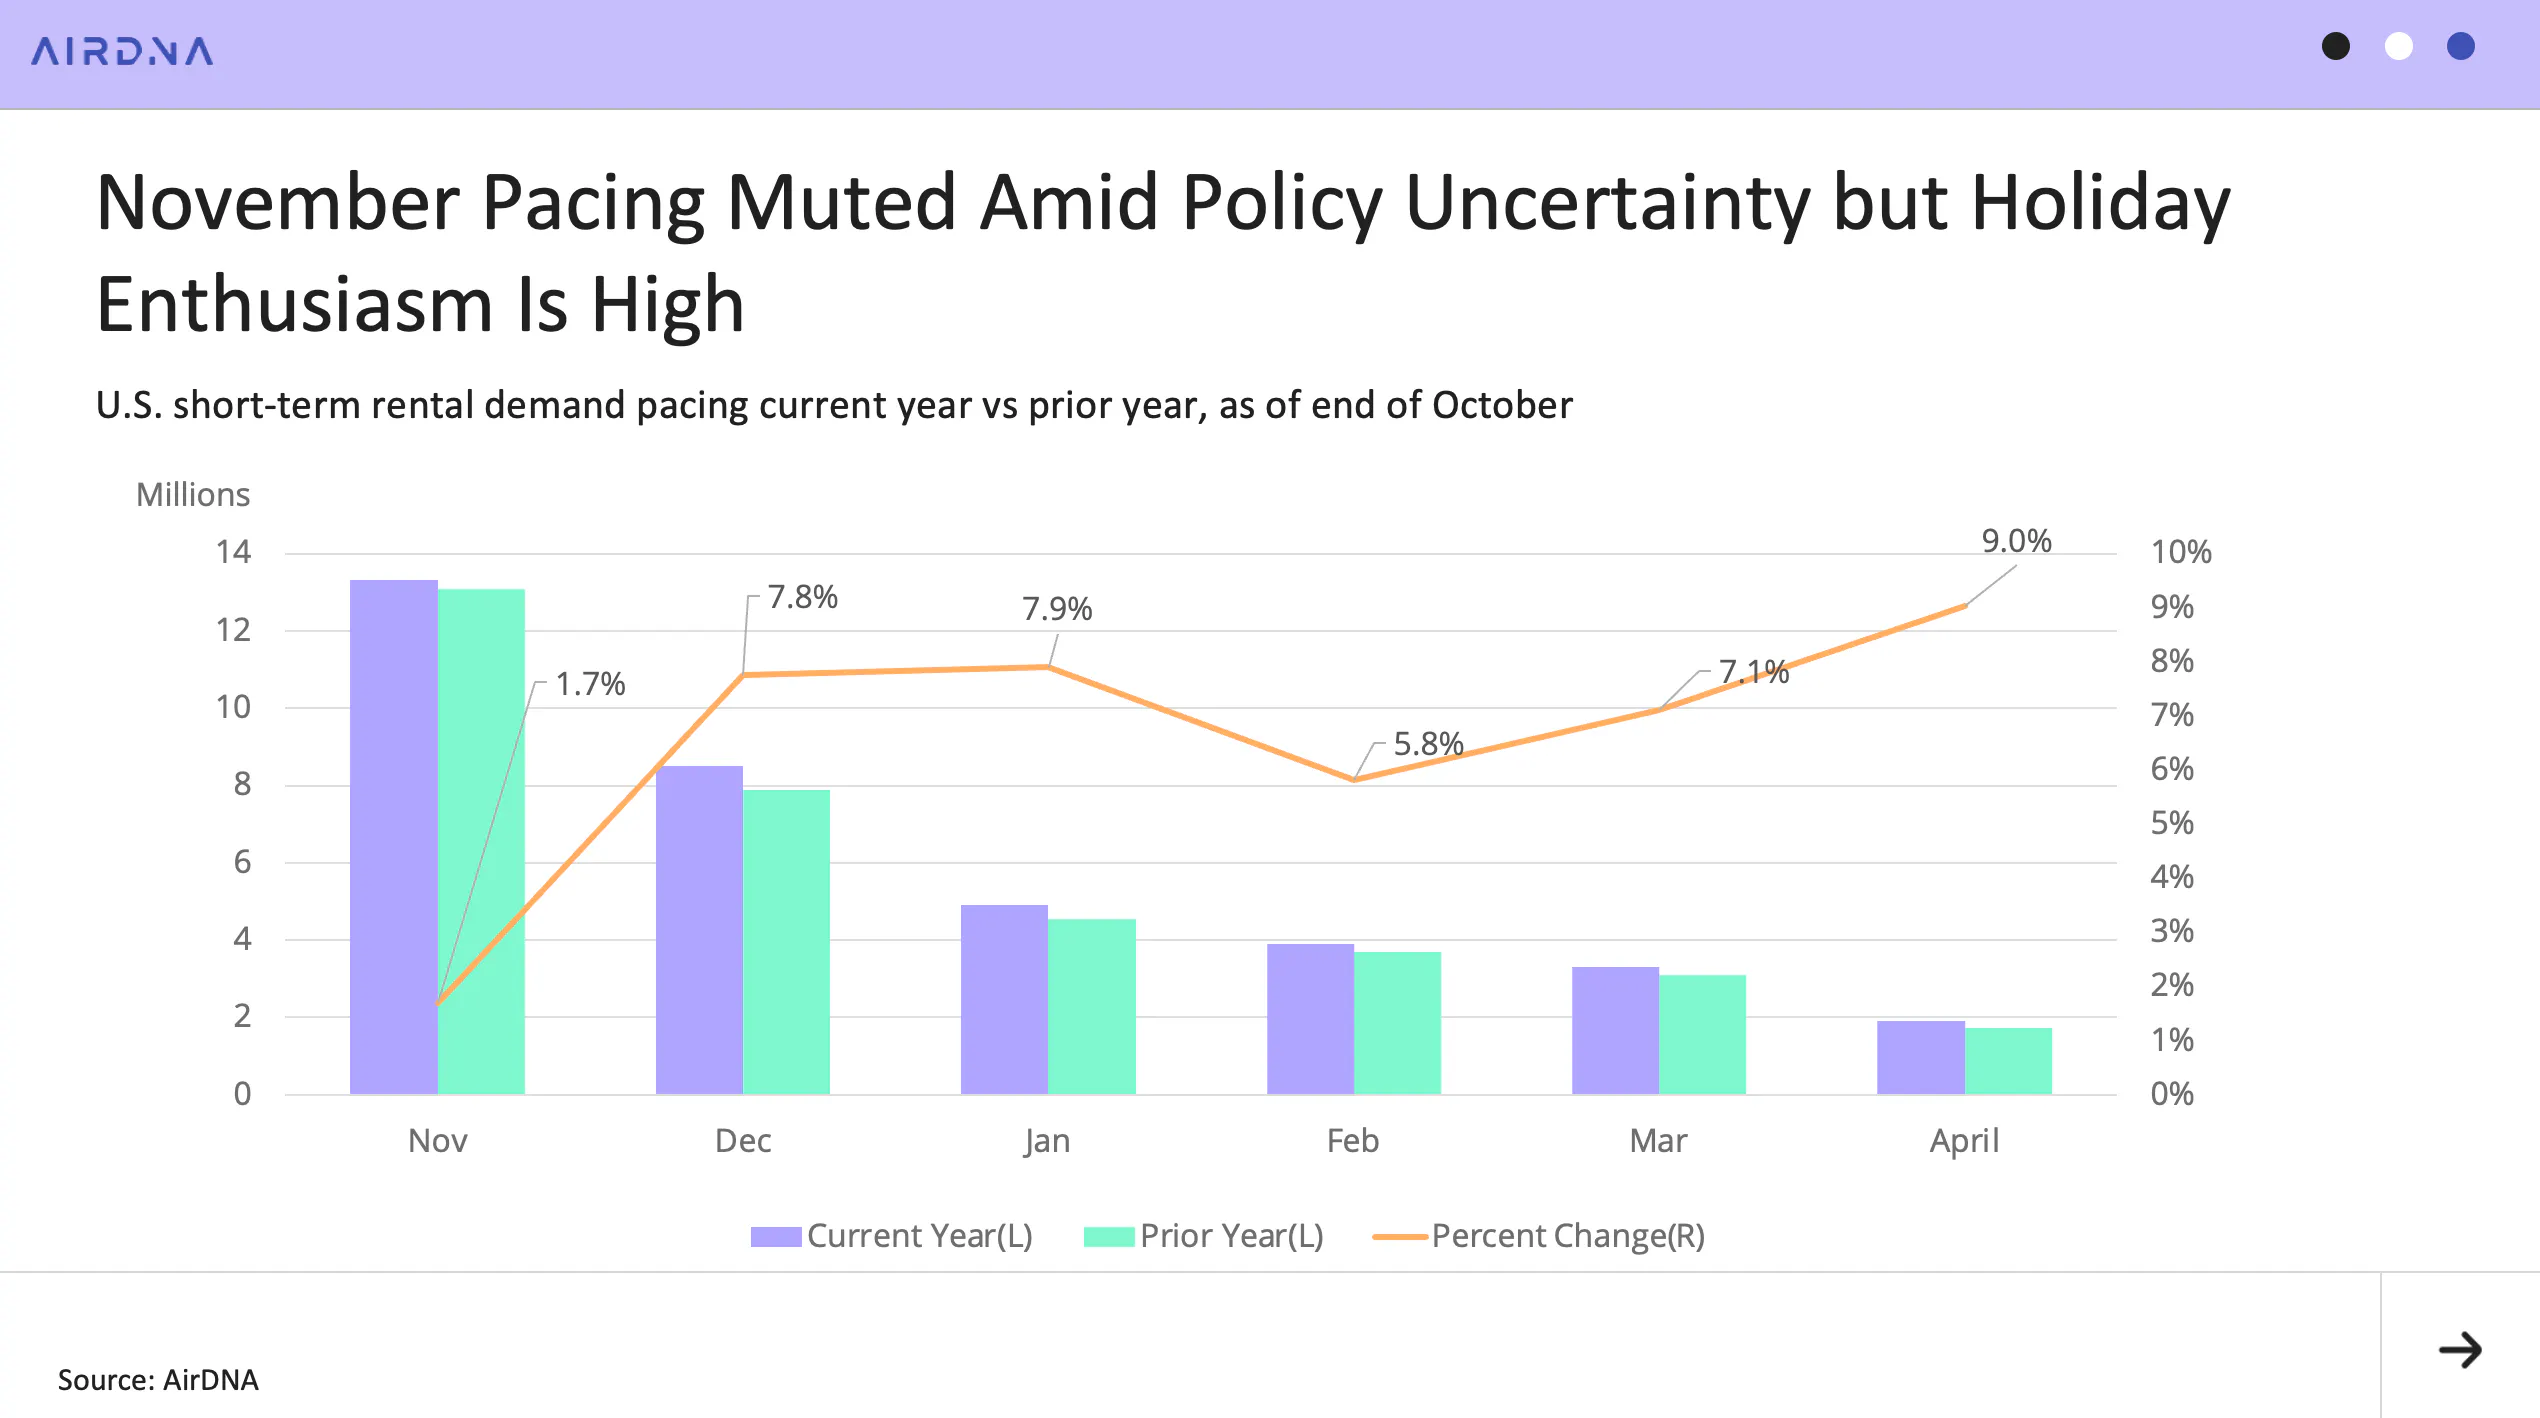
Forward-looking bookings show a mixed picture heading into the holiday season. The prolonged government shutdown, along with the air travel delays and service cuts that came with it, appears to have made some travelers more cautious about planning November trips. As a result, November pacing is currently up only 1.7% compared to this time last year.
However, the outlook improves sharply for the end of the year. Because Christmas and New Year’s fall in the middle of the week in 2025, many travelers are taking advantage of longer holiday weekends. December and January pacing are both up nearly 8% year-over-year, showing strong appetite for year-end and early-winter travel.
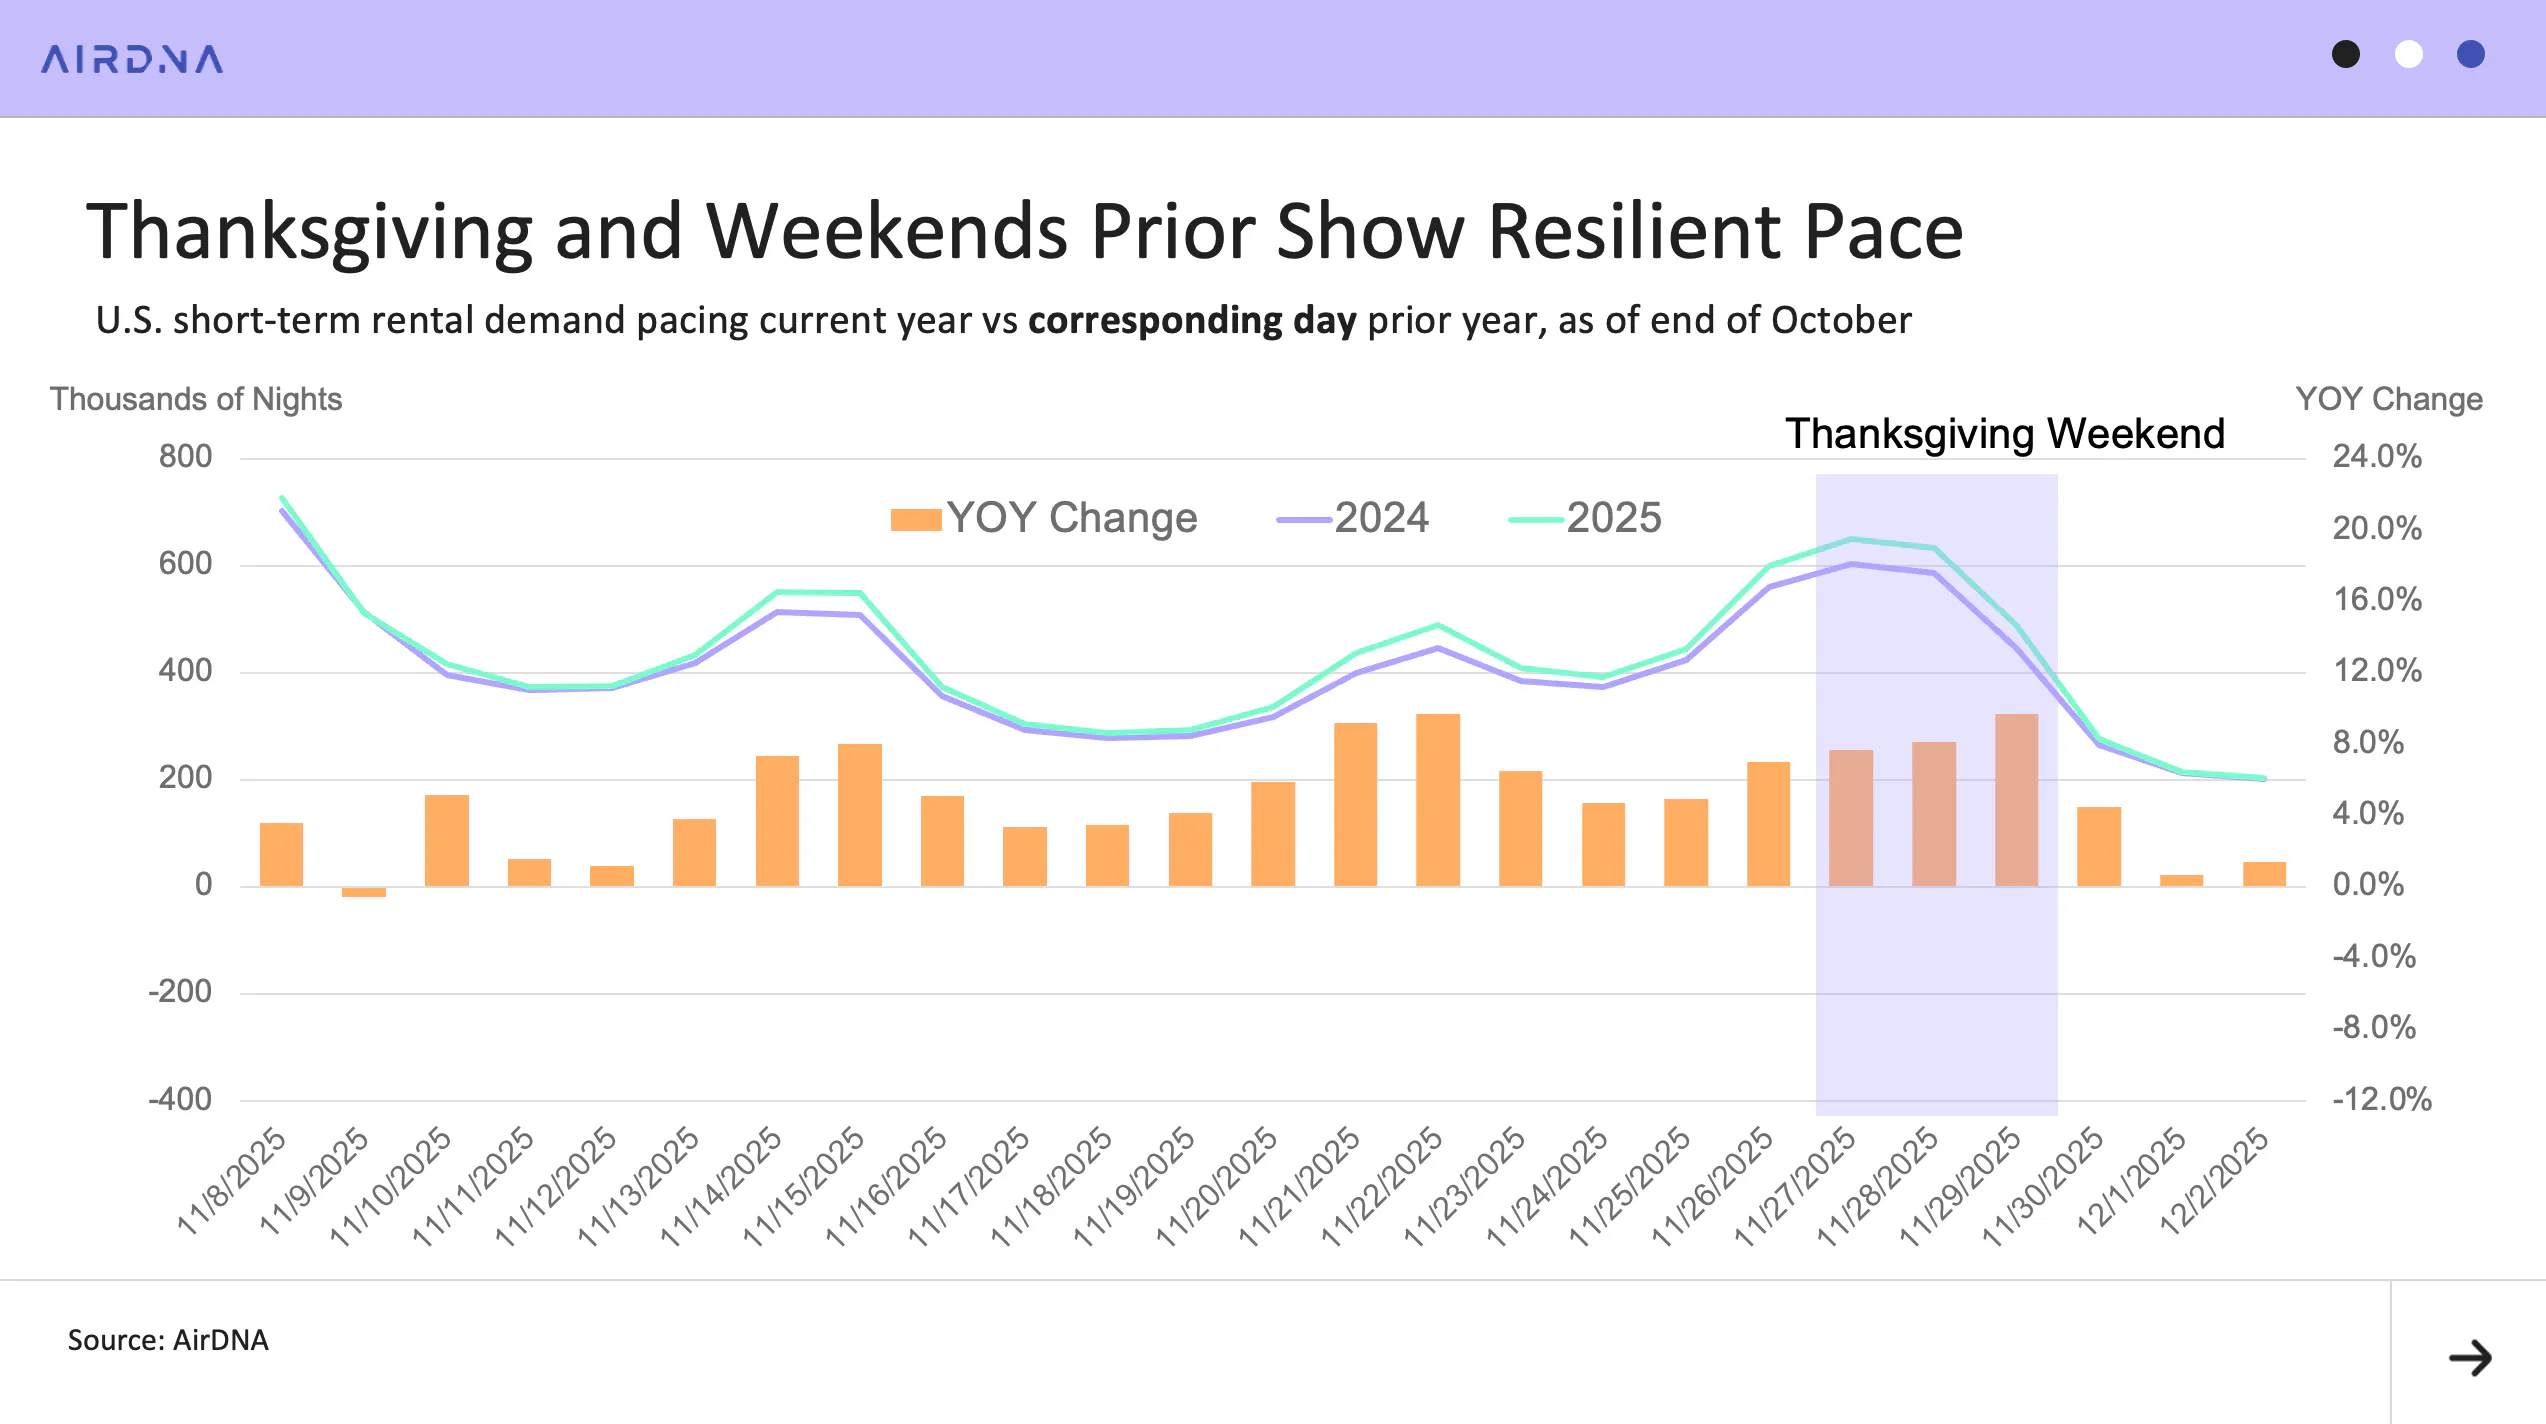
Looking specifically at Thanksgiving, pacing remains 7–9% above last year. This is lower than the approximate 15% increase seen a month earlier, suggesting that the shutdown may have softened some near-term travel sentiment. Even so, 7–9% growth on top of an already busy 2025 season still represents solid demand. The broader travel market remains stable.
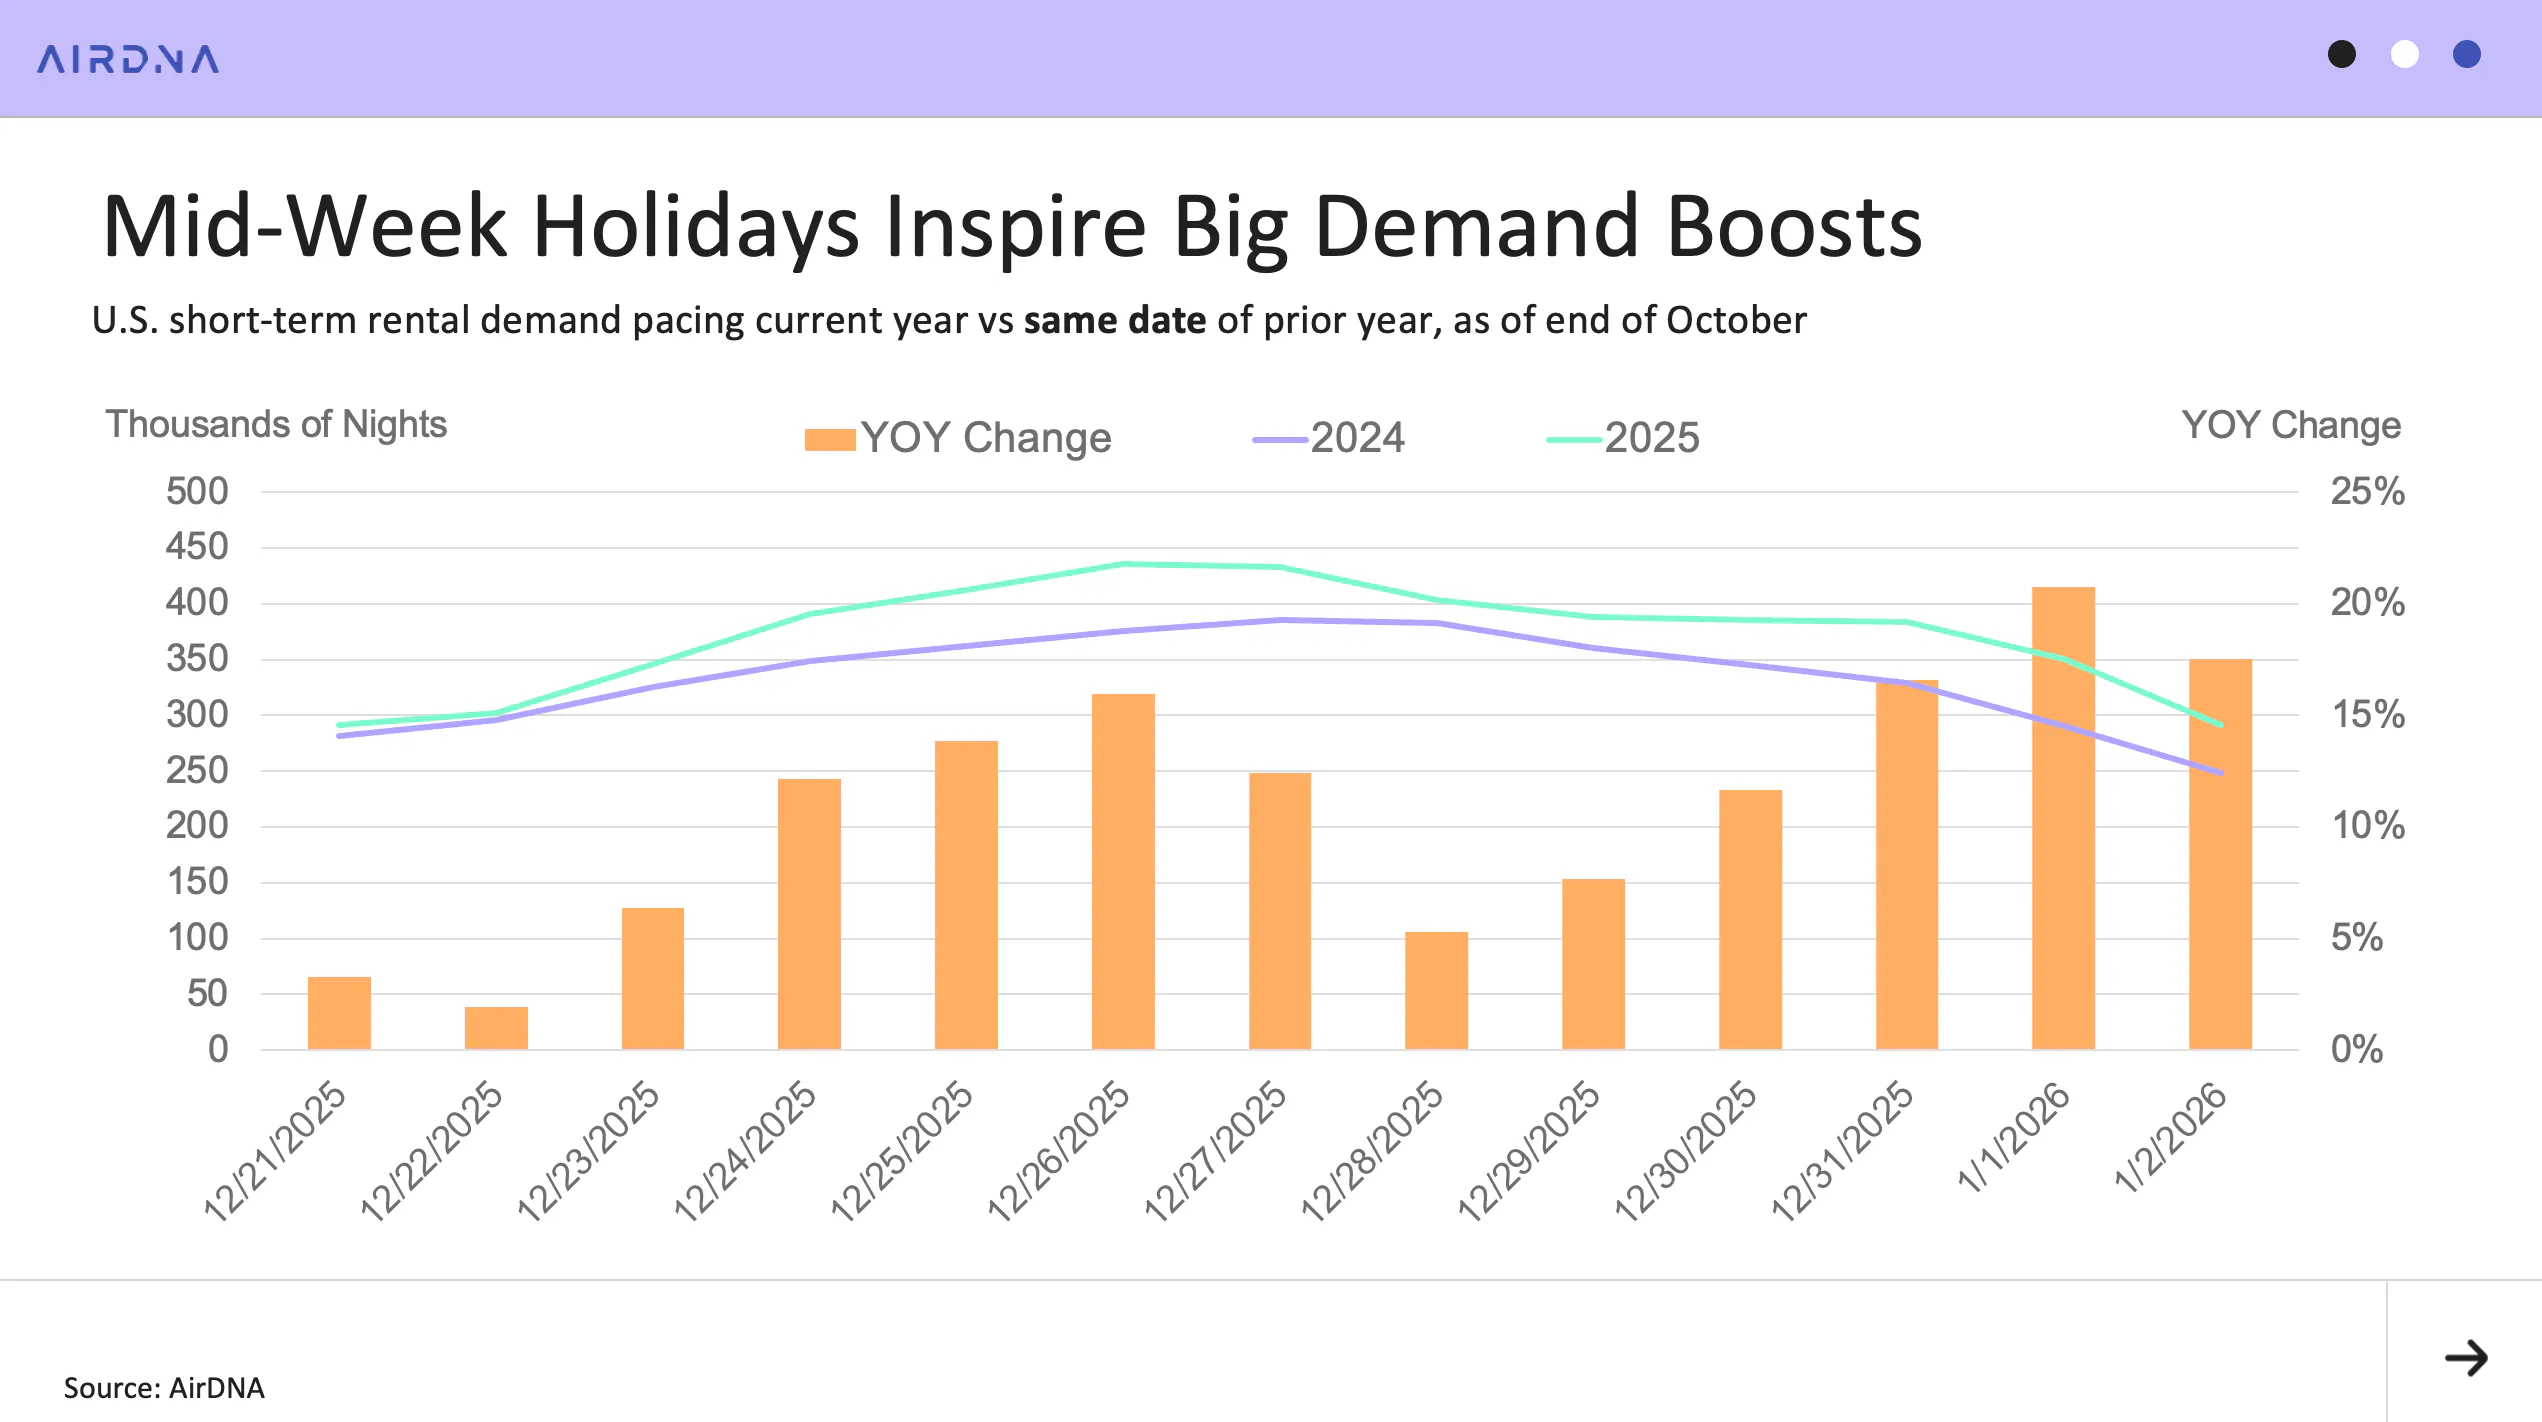
Deferred travel plans also appear to be exactly that—deferred. Holiday bookings for Christmas and New Year’s Eve are currently outperforming 2024 by a wide margin. Christmas and New Year fall on fixed dates, so comparisons are made using the same dates in 2024 and 2025 rather than days of the week. Christmas Eve and Christmas Day are up 12% and 14%, respectively, while New Year’s Eve and New Year’s Day are up 17% and 21%, respectively.
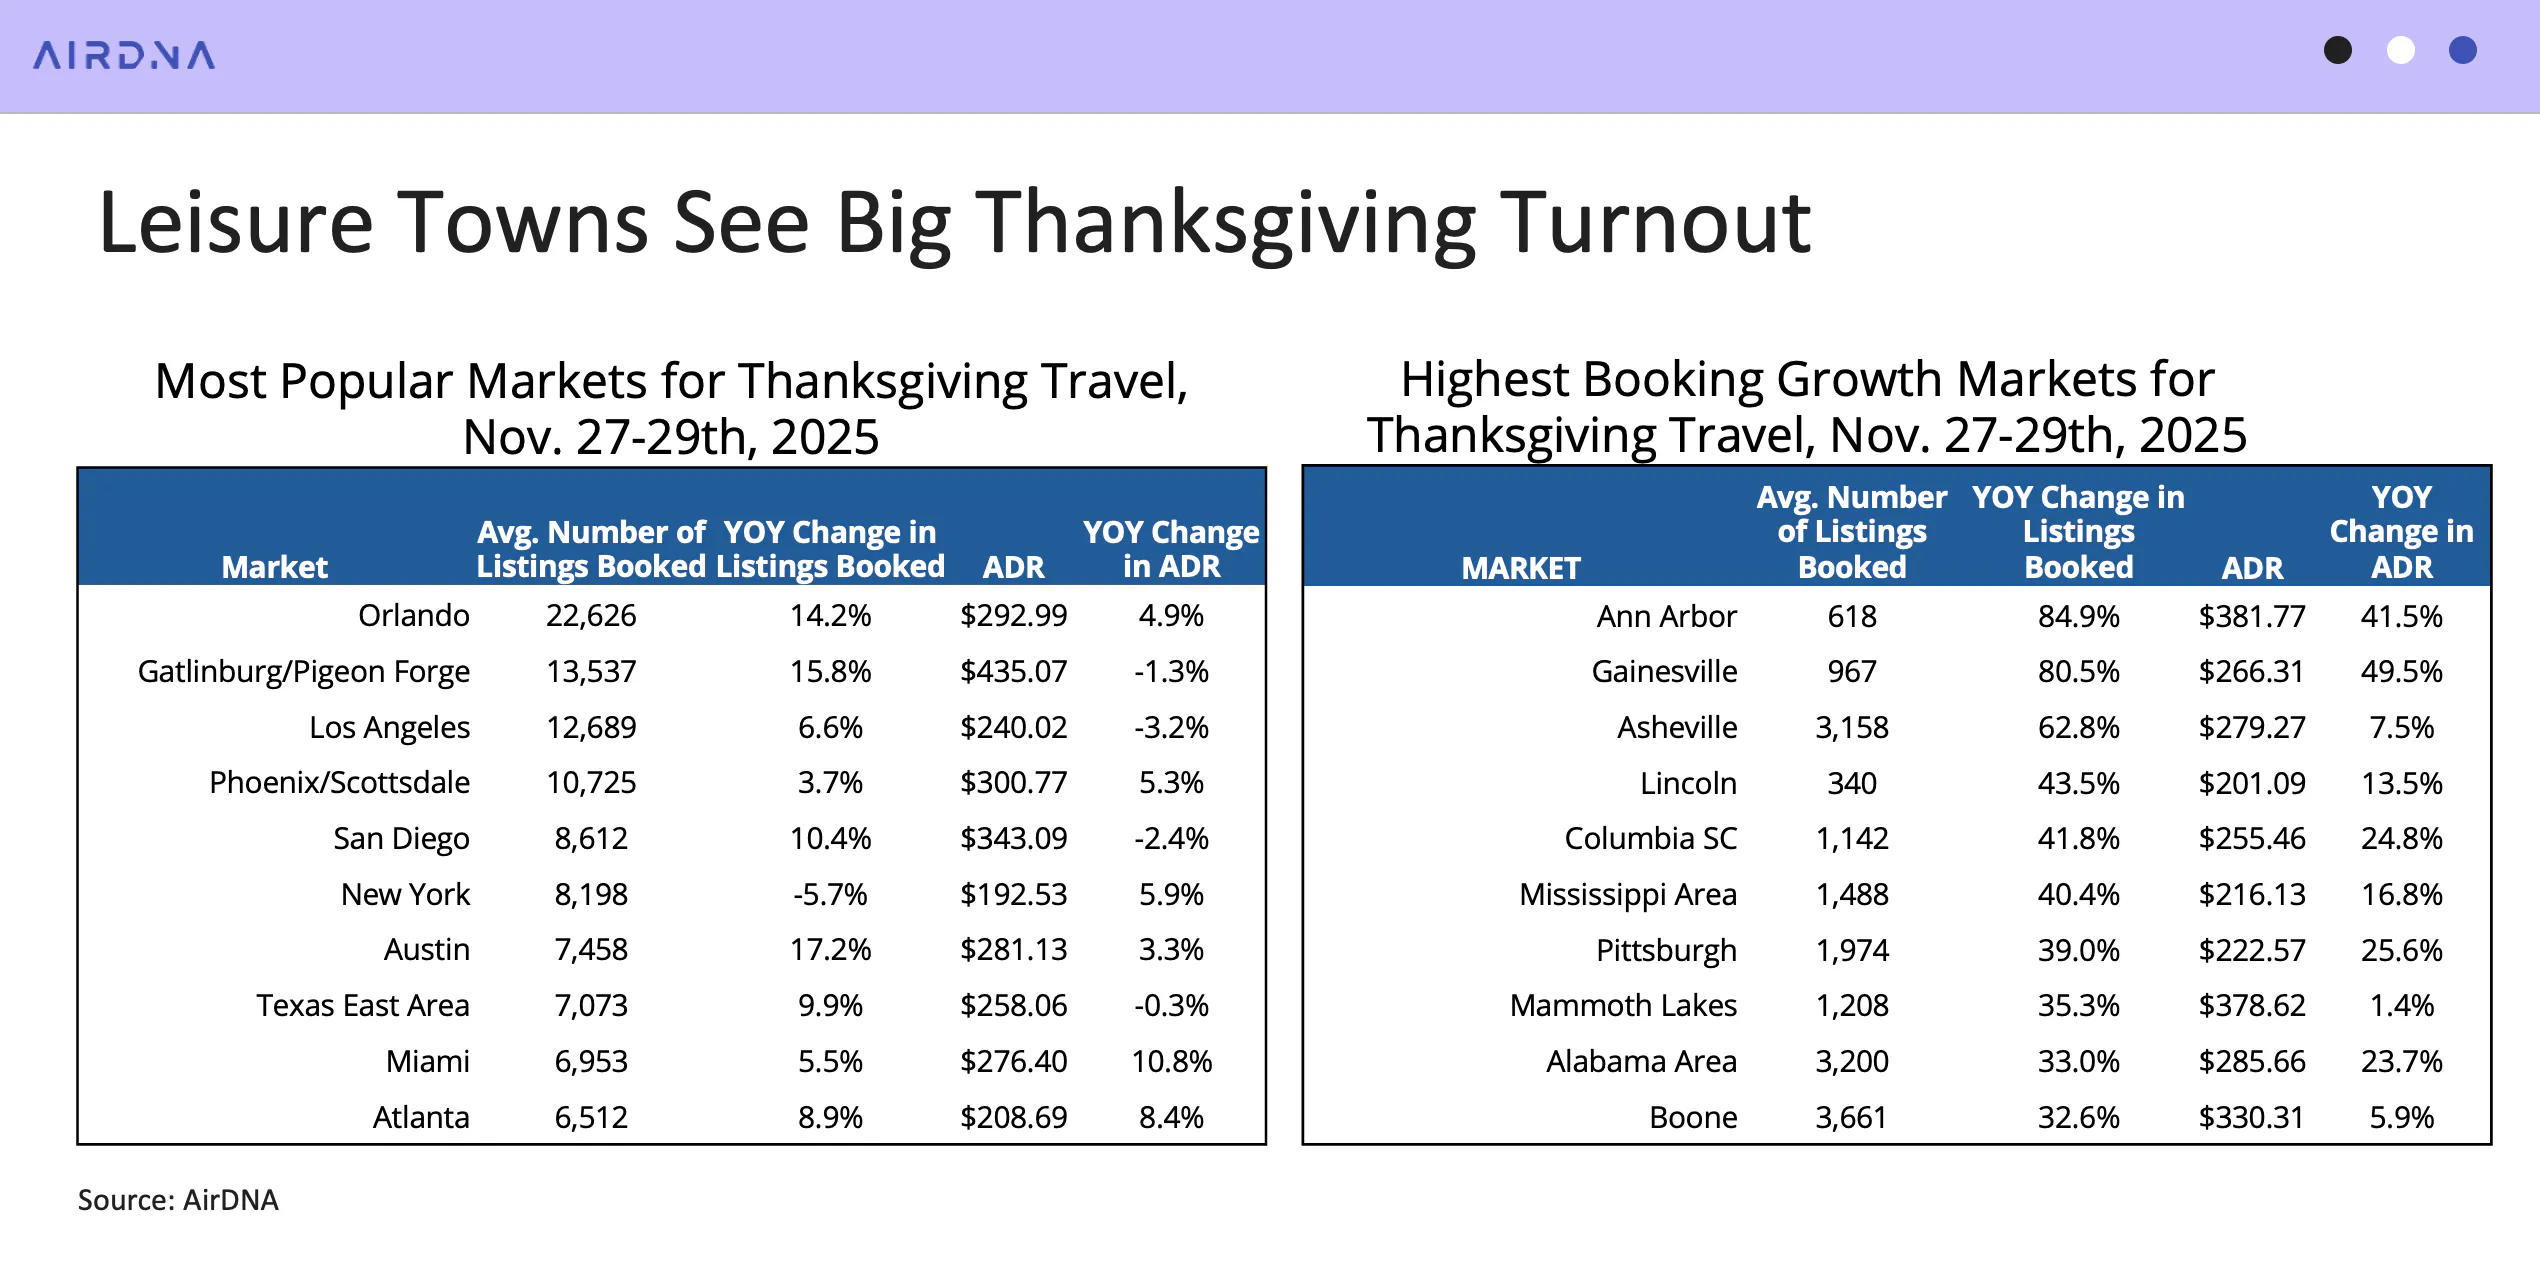
Large markets with drive-to leisure appeal are the most popular Thanksgiving destinations
Looking at the most popular Thanksgiving destinations reveals familiar patterns: large markets with strong drive-to leisure appeal dominate the list. All of these markets, with the exception of New York, are also showing strong pacing gains compared to last year.
- Orlando, Florida (+14.2%)
- Gatlinburg / Pigeon Forge, Tennessee (+15.8%)
Austin, Texas is the biggest winner for demand in the Top 10 U.S. markets by size, with the highest demand growth at +17.2% YoY. However, several markets show even larger increases driven by shifting football schedules. These include:
- Ann Arbor, Michigan (+84.9%)
- Gainesville, Florida (+80.5%)
In third place for demand growth is Asheville, North Carolina (+62.8%), which at this time last year was still recovering from the impacts of Hurricane Helene.
ARTICLE SUMMARY
In October 2025, U.S. short-term rentals saw demand return, but occupancy slipped as supply continued to expand. Pricing strengthened, with ADR and RRI both ticking up, and forward-looking bookings showed solid momentum for the holiday season despite softer November pacing.
Bram Gallagher
AirDNA Director of Economics and Forecasting
Bram Gallagher is an Economist at AirDNA, specializing in uncovering insights that drive smarter short-term rental decisions. He put his Ph.D. in Economics from the University of Georgia to work researching and forecasting hotel data with CBRE prior to joining AirDNA, as well as teaching economics at a number of universities. In his spare time, Bram enjoys making wooden furniture with hand tools.