

 Calculate Revenue
 Research Markets
 Find For Sale Properties
 Compare My Listing
 STR Revenue Calculator
 Custom Comp Sets
 Submarket Insights
 Custom Search Filters
 Rate Recommendations
 Performance Benchmarking
 Competitor Comparison
 Owner Contact Details
 Property-level performance data
 Tourism Insights
 Real Estate Investment Analytics
 About Us
 Sales
Sales Support
 Press
PressWorld Cup Newcomers Earned Better Reviews Than New Listings Usually Do
Published: October 8, 2026

Jamie Lane
Listings that went live in the run-up to the 2026 FIFA World Cup earned better guest reviews than new listings normally do. In 14 of the 16 host cities, listings that first appeared between January and June 2026 scored higher for June and July stays than the same city’s new listings did a year earlier. Established listings in those cities barely moved, and new listings outside the host cities barely moved either, so the lift belongs to the tournament cities and the hosts who showed up for them.
I expected the opposite. A wave of first-time hosts chasing one summer of demand sounds like a recipe for confusing check-in instructions and missing towels. The reviews say those hosts did fine, and the rush of new supply didn’t drag down the rest of each market either. City-wide, the share of five-star reviews rose in 15 of the 16.
Key Takeaways
- In 14 of the 16 host cities, listings that went live between January and June 2026 outscored the same city’s new listings from a year earlier.
- Kansas City and Seattle led, with new listings averaging about 4.85 stars and roughly 90% of reviews at five stars.
- Vancouver improved the most, with its new listings’ five-star share rising from 81% to 86%.
- The share of five-star reviews rose in 15 of the 16 host cities, even where supply grew as much as 76%.
- About 12,300 reviews mentioned the World Cup, up from about 150 last summer.
Kansas City and Seattle New Listings Scored Highest
Kansas City and Seattle led, with new listings averaging about 4.85 stars and roughly 90% of reviews at five stars. Boston, Monterrey and the San Francisco Bay Area followed. Philadelphia, Miami and Los Angeles sat at the bottom, though every host city’s newcomers still averaged above 4.7.
| Host city | New listings reviewed | Avg stars, 2026 | Five-star share, 2026 | Avg stars, 2025 | Change |
|---|---|---|---|---|---|
| Kansas City | 1,266 | 4.85 | 90% | 4.81 | +0.03 |
| Seattle | 1,612 | 4.84 | 90% | 4.81 | +0.03 |
| Boston | 1,186 | 4.81 | 88% | 4.79 | +0.02 |
| Monterrey | 2,036 | 4.81 | 88% | 4.78 | +0.03 |
| San Francisco Bay Area | 1,350 | 4.80 | 89% | 4.78 | +0.02 |
| Mexico City | 4,429 | 4.79 | 87% | 4.76 | +0.03 |
| Dallas-Fort Worth | 3,370 | 4.79 | 88% | 4.74 | +0.05 |
| Toronto | 2,850 | 4.79 | 86% | 4.76 | +0.02 |
| Vancouver | 2,156 | 4.79 | 86% | 4.70 | +0.09 |
| Houston | 2,821 | 4.78 | 88% | 4.73 | +0.05 |
| New York/New Jersey | 2,189 | 4.76 | 86% | 4.73 | +0.03 |
| Atlanta | 2,786 | 4.75 | 87% | 4.73 | +0.02 |
| Guadalajara | 2,405 | 4.75 | 85% | 4.76 | -0.02 |
| Los Angeles | 3,449 | 4.74 | 86% | 4.74 | 0.00 |
| Miami | 4,721 | 4.74 | 86% | 4.70 | +0.04 |
| Philadelphia | 1,154 | 4.71 | 84% | 4.68 | +0.03 |
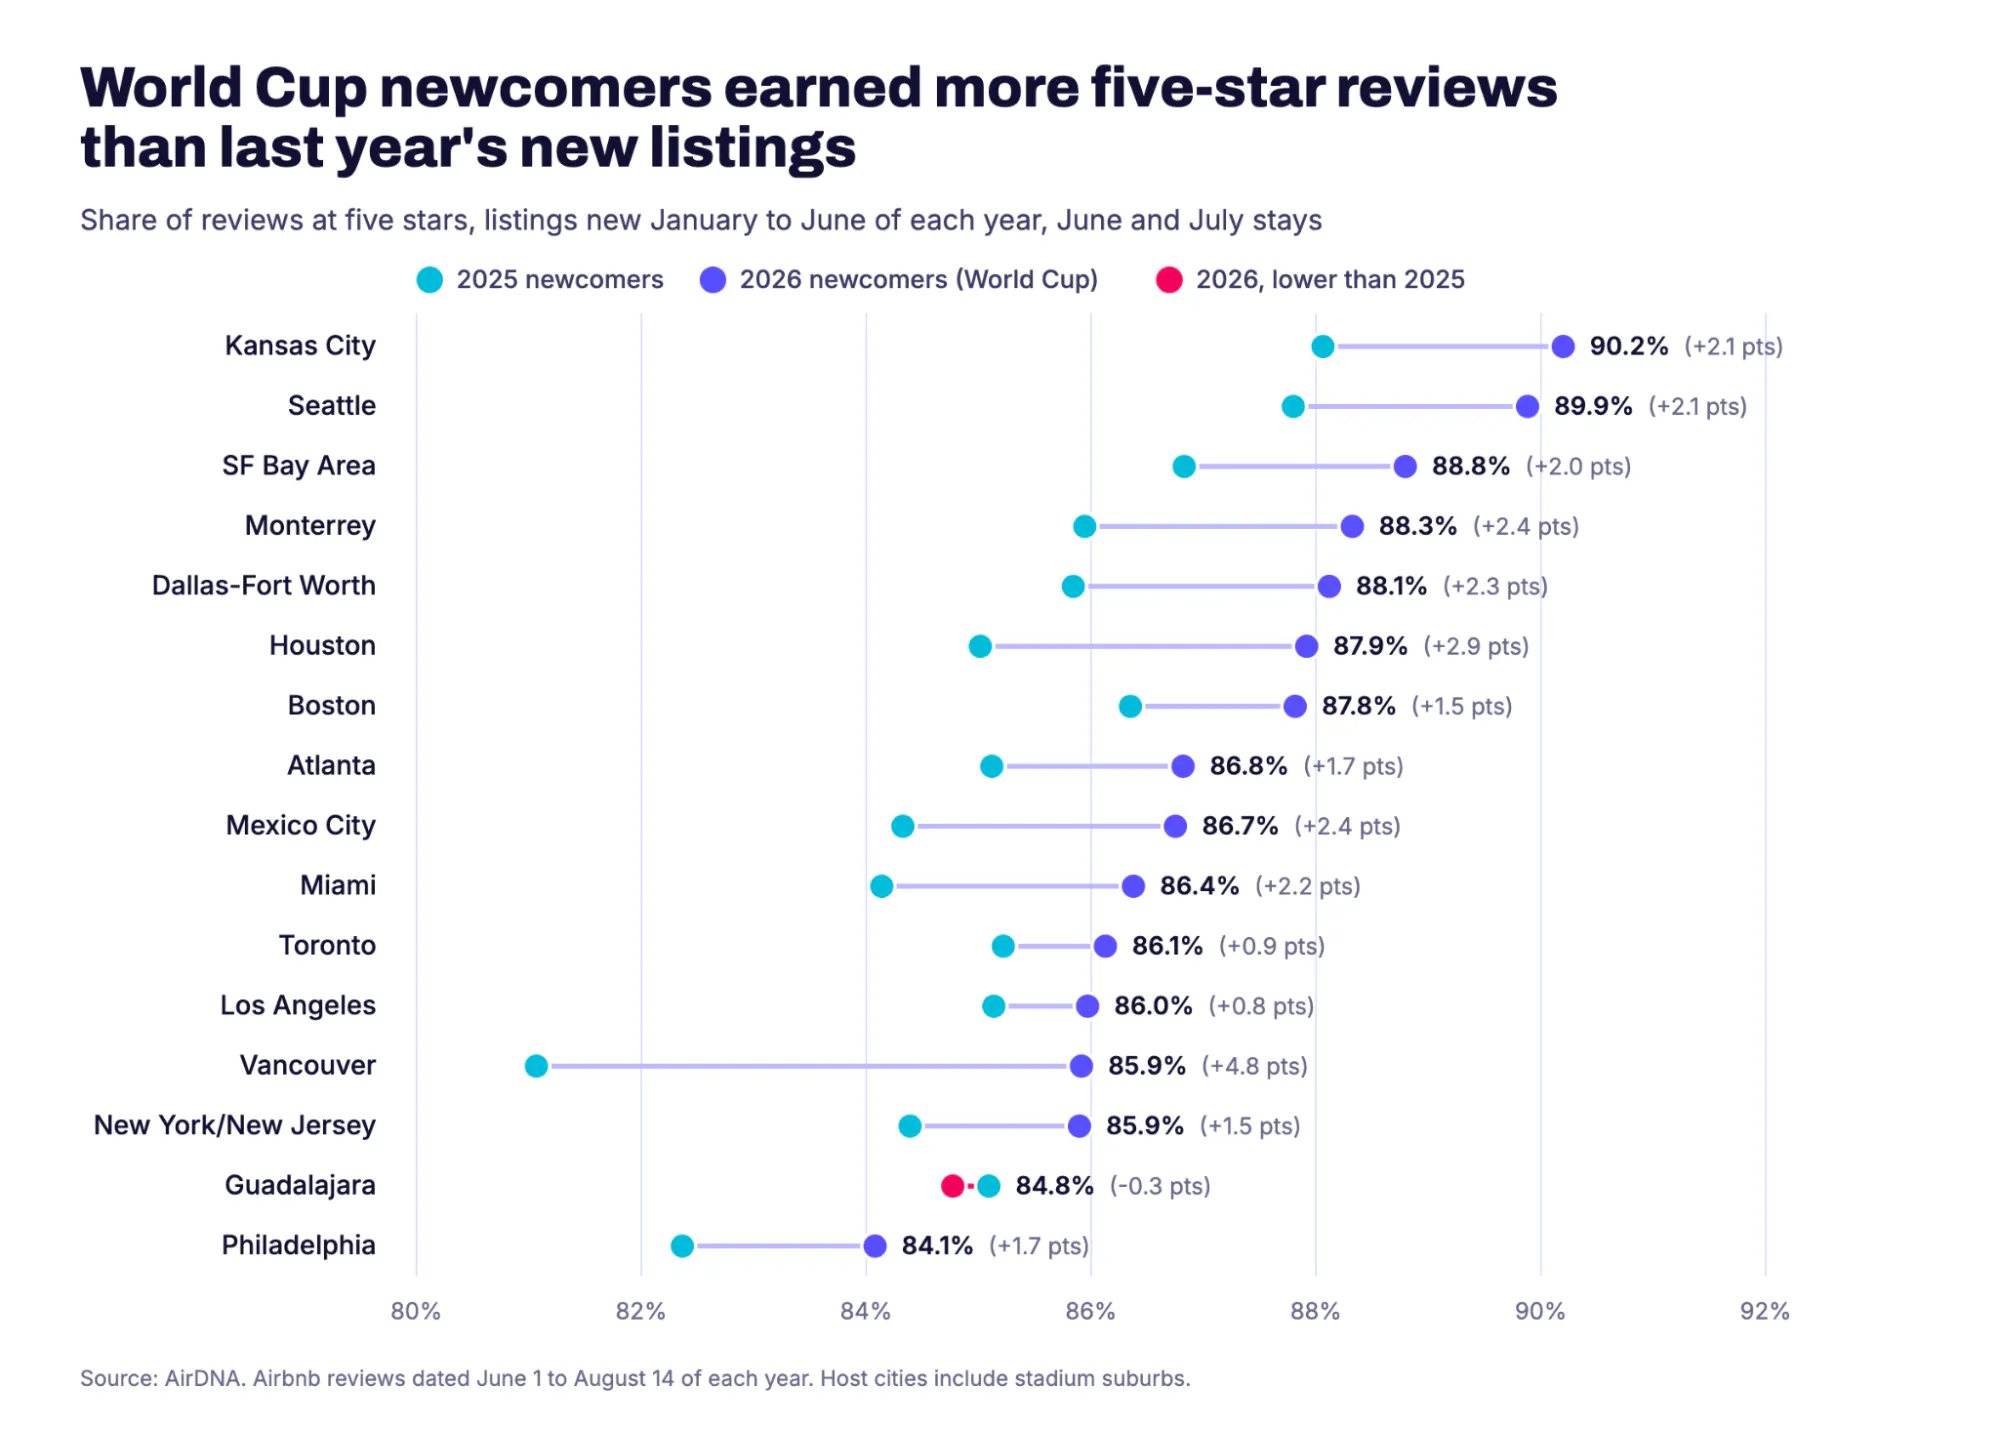
New listings first appeared January to June of each year. 2025 compares the same city’s January to June 2025 newcomers over the same review window.
Kansas City also had the biggest supply response for its size. The number of new listings that picked up a review in June or July went from about 280 last year to nearly 1,300, more than four times as many, and those newcomers scored as well as the city’s established listings.
Getting first-time hosts ready
Ahead of the tournament, AirDNA took part in several Hosting 101 sessions for people listing a home for the first time, including a crash course in Kansas City. Kansas City is also where the newcomers did best. Its new listings posted the highest average score of any host city, and they did it while the number of newcomers picking up reviews more than quadrupled.

Vancouver’s New Listings Improved the Most
Vancouver moved the most. A year ago its new listings trailed the rest of the city badly, with 81% of reviews at five stars. This summer it was 86%. Houston, Dallas-Fort Worth and Miami each added around 0.04 to 0.05 stars, which works out to two or three more five-star reviews in every hundred.
Those sound like small numbers, and on a five-point scale where the typical listing sits around 4.8 they are. They are still large relative to how much this measure normally moves. To check the gains weren’t just new listings improving everywhere, I ran the same comparison for new listings outside the host cities. They moved by almost nothing: about +0.005 stars in the US and Mexico and +0.02 in Canada. That Canadian figure matters for Toronto, because Toronto’s +0.02 is essentially the national trend. Vancouver’s gain is roughly four times Canada’s.
The clearest sign of the change is the gap between new and established listings. In 2025, new listings in most host cities trailed established ones by 0.04 to 0.11 stars, the kind of gap you’d expect while hosts are still working things out. This year the gap mostly shrank to under 0.05, and in Monterrey, Houston, Mexico City and Kansas City new listings matched or beat established ones.
Guadalajara Was the Only Host City Where Scores Fell
Guadalajara was the only host city where new-listing scores fell, down about 0.02 stars, and that is within the normal year-to-year variation for a sample its size. Los Angeles was flat, and the Bay Area’s small rise is also within that range. Los Angeles and the Bay Area were also the only two host cities with fewer newcomers this summer than last. Los Angeles’s new listings trailed its established ones by about 0.07 stars, the widest gap of any host city.
Five-Star Reviews Rose Even as Supply Surged
The obvious worry with a supply rush is that quality slips across the whole market. Across all listings, new and established, the share of five-star reviews rose in 15 of the 16 host cities this summer, and the cities that added the most listings tended to see the biggest gains. Kansas City had about 76% more available listings in June and July than a year earlier, and its five-star share still rose from about 88% to 90%. Vancouver added about 27% more listings and went from 85% to 87%. Los Angeles, where supply grew about 2%, was the only city where five-star share slipped, and only by a tenth of a percentage point.
| Host city | Supply growth, Jun-Jul | Five-star share, 2025 | Five-star share, 2026 |
|---|---|---|---|
| Kansas City | +76% | 87.8% | 89.7% |
| Monterrey | +49% | 85.2% | 86.2% |
| Guadalajara | +33% | 84.1% | 84.3% |
| Vancouver | +27% | 85.0% | 86.9% |
| Dallas-Fort Worth | +24% | 87.3% | 87.9% |
| Mexico City | +24% | 84.8% | 85.6% |
| Atlanta | +21% | 85.9% | 87.2% |
| Seattle | +17% | 88.7% | 89.4% |
| Houston | +13% | 85.8% | 86.7% |
| Toronto | +12% | 86.2% | 86.5% |
| Boston | +9% | 87.4% | 87.9% |
| Philadelphia | +6% | 85.0% | 85.4% |
| New York/New Jersey | +5% | 84.7% | 85.6% |
| Miami | +5% | 85.2% | 85.7% |
| Los Angeles | +2% | 87.9% | 87.8% |
| San Francisco Bay Area | -5% | 89.3% | 89.7% |
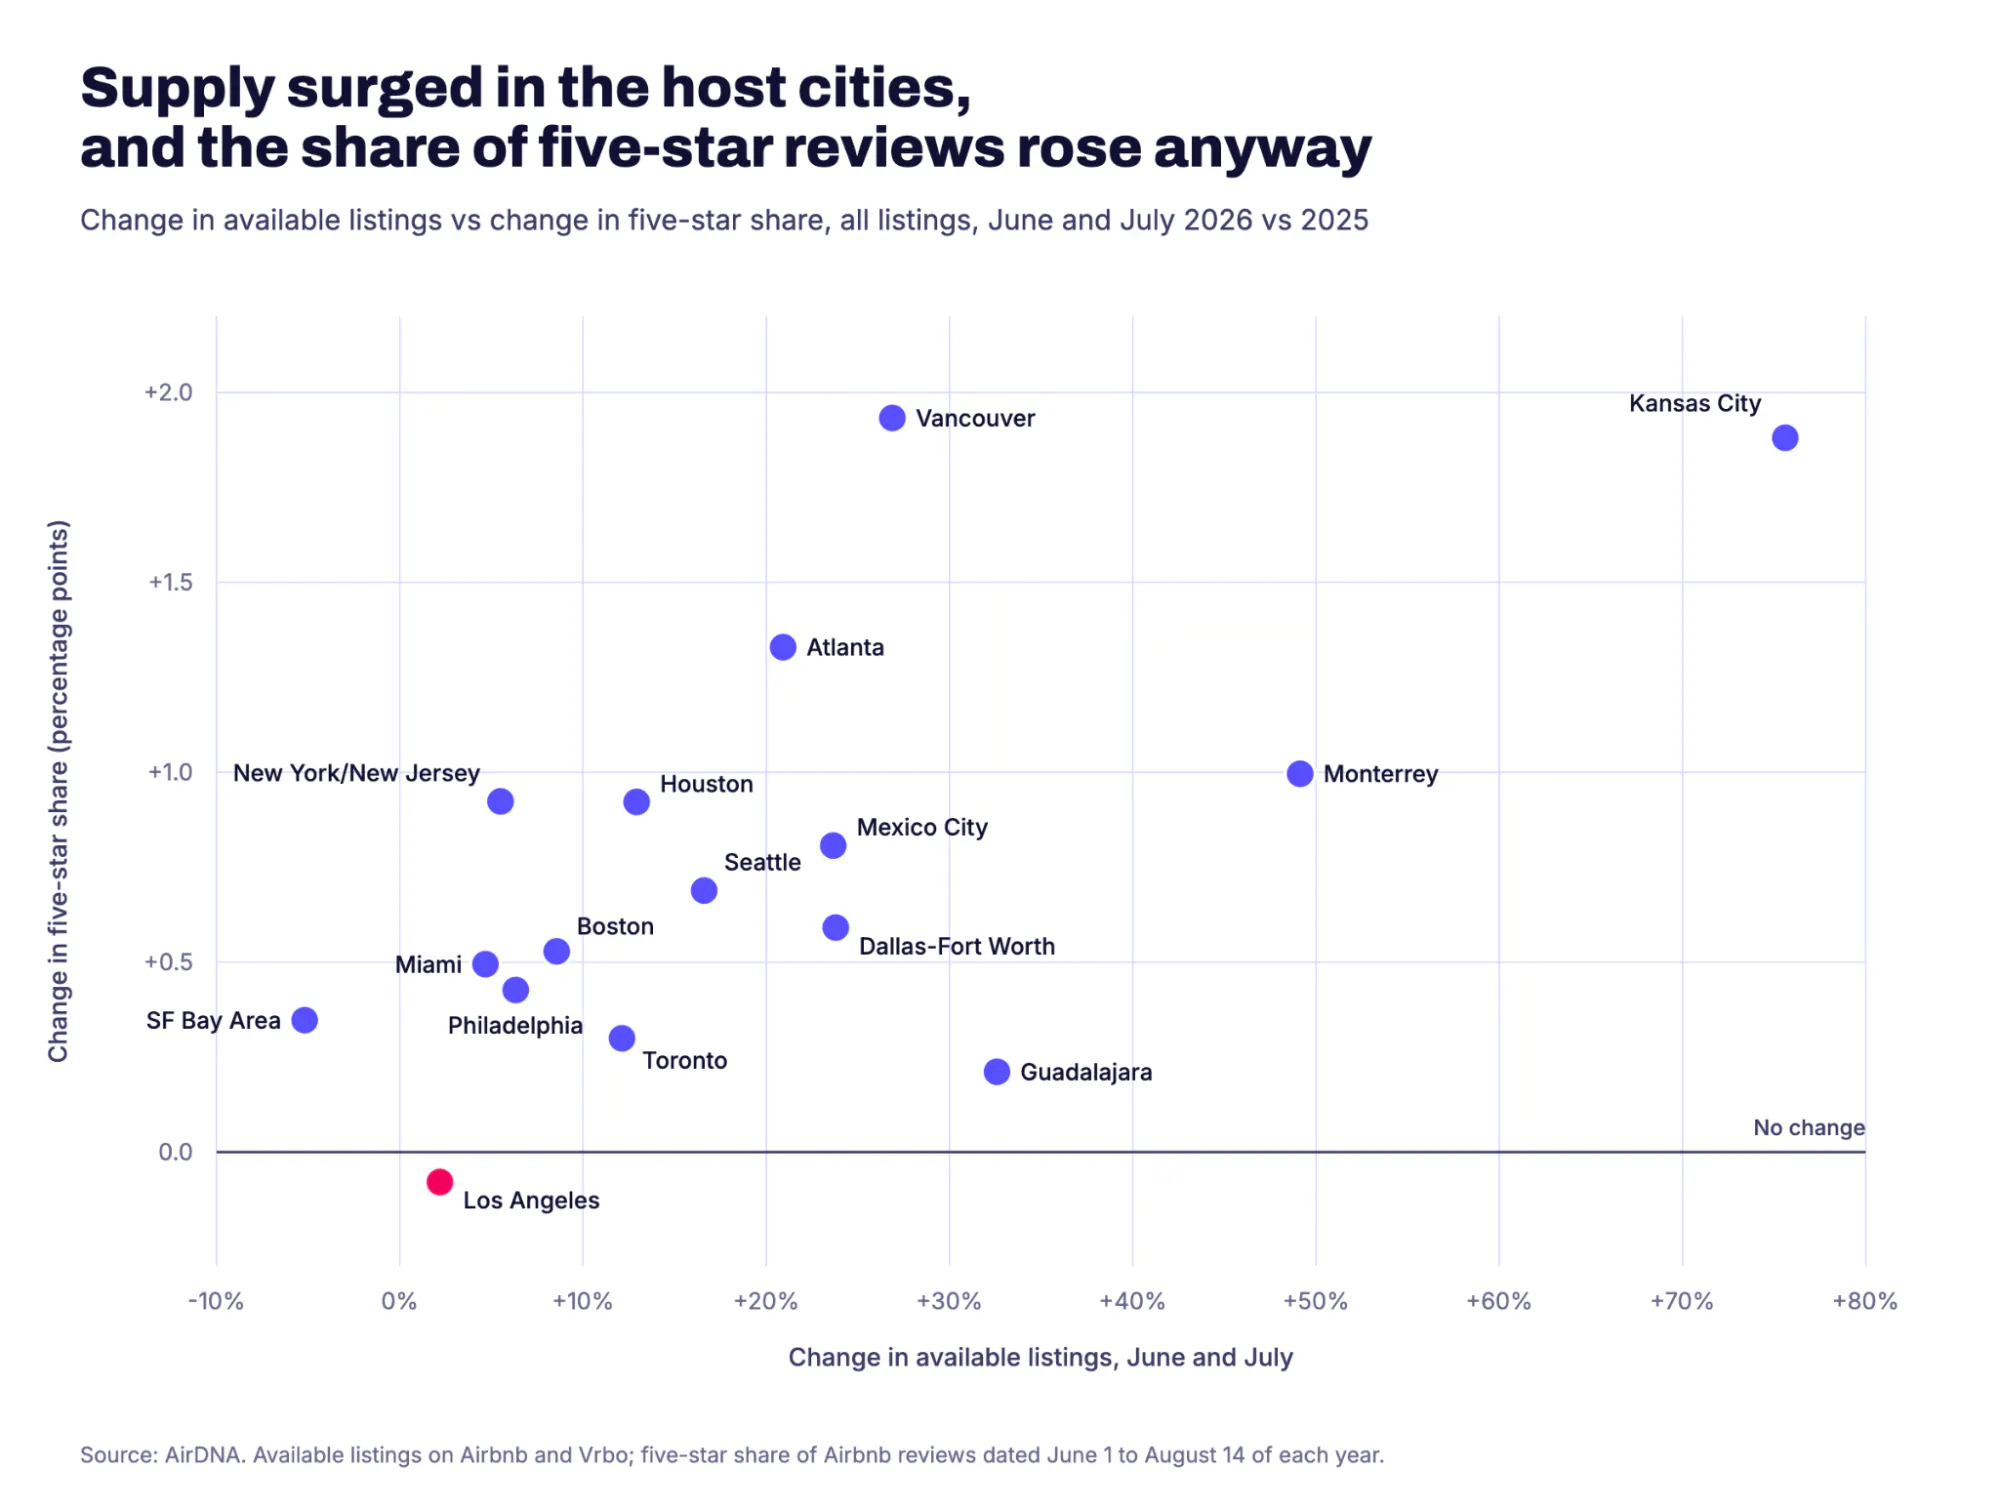
Supply growth is the change in available listings across Airbnb and Vrbo, averaged over June and July. Five-star share covers all Airbnb reviews for June and July stays, new and established listings.
Build Your Comp Set
Pick the properties that match yours and benchmark against real competitors, not city averages.
Guests Praised Location, and 12,300 Reviews Mentioned the World Cup
The most common phrases in host-city reviews were the ones you’d find anywhere: “highly recommend”, “great location”, “great stay”. Toronto guests leaned hardest on location, with “great location” in about 9% of reviews. In the Mexican host cities, “excellent location” and “always attentive” (about the host) were near the top.
The phrase that grew most since last summer was the same in all 16 cities: “world cup”. About 12,300 reviews mentioned the tournament, roughly 1.2% of the total, up from about 150 last summer. Kansas City had the highest share, about one review in 20. Guests also named the venues: Arrowhead in Kansas City, the Azteca in Mexico City, Estadio Akron in Guadalajara and Estadio BBVA in Monterrey. “Fan fest” rose in Houston, Kansas City, Guadalajara and Monterrey.
Reviews that mentioned the World Cup scored within about 0.05 stars of everyone else in 14 of the 16 host cities. Monterrey and Guadalajara were the exceptions, at about 4.66 stars against 4.78 for all Monterrey reviews and about 4.68 against 4.75 in Guadalajara. Guadalajara’s reviews also picked up more complaints than last year, with “unpleasant odor” and mentions of small rooms rising, which fits it being the one city where new-listing scores slipped. Those are small counts, a few dozen reviews each, so I’d treat them as something worth checking with local hosts.
UK and US Guests Gave the Highest Scores
Across all listings in the host cities, new and established, guests from the UK and the US gave the highest scores among the larger groups, both averaging about 4.82 to 4.83 stars. Guests from China and Taiwan scored a touch higher still, about 4.84, on smaller samples. Canadians and Australians were close behind at around 4.80.
At the other end were Italy, Ecuador, Colombia, Spain and Argentina, averaging roughly 4.69 to 4.73. Chile was lowest of all at about 4.65, on fewer reviews.
| Guest home country | Reviews | Avg stars, 2026 | Five-star share, 2026 | Avg stars, 2025 |
|---|---|---|---|---|
| United Kingdom | 8,086 | 4.83 | 88% | 4.82 |
| United States | 189,906 | 4.82 | 88% | 4.82 |
| Australia | 3,662 | 4.80 | 86% | 4.79 |
| Canada | 18,613 | 4.79 | 86% | 4.79 |
| Brazil | 2,305 | 4.79 | 87% | 4.80 |
| Germany | 3,251 | 4.77 | 84% | 4.78 |
| Mexico | 22,173 | 4.76 | 85% | 4.75 |
| France | 3,773 | 4.75 | 84% | 4.76 |
| Argentina | 2,756 | 4.73 | 84% | 4.75 |
| Colombia | 2,457 | 4.71 | 81% | 4.67 |
Countries with at least 2,000 reviews in the 16 host cities, June and July 2026 stays. Home country is known for about 28% of reviews.
These countries rated lower in the same cities last summer too, so what separates them is mostly how guests from different countries use a five-star scale. Colombia is the clearest example. Colombian guests left twice as many reviews in the host cities this year as last, with the World Cup the obvious reason, and their average score went up, from about 4.67 to 4.71. Italy was the one country whose score fell noticeably, by about 0.06 stars. The top and bottom of the ranking hold after adjusting for which cities each group stayed in, so it isn’t a side effect of where they went.
How We Measured This
Every figure here is the star rating on an individual Airbnb review, from 1 to 5, averaged across reviews. June and July stays are reviews posted between June 1 and August 14, since Airbnb closes the review window 14 days after checkout. A new listing is one that first appeared in AirDNA’s data between January and June of that year, and each city’s newcomers are compared with the same city’s newcomers from January to June 2025, reviewed over the same window in 2025. Hotels and listings we identify as non-vacation-rental inventory are excluded. Phrases come from the review text, using Airbnb’s English translation for reviews written in other languages, and count each phrase once per review.
Host cities are metro areas that include the stadium towns: Arlington in Dallas-Fort Worth, East Rutherford in New York/New Jersey, Santa Clara in the Bay Area, Foxborough in Boston, Zapopan in Guadalajara and Guadalupe in Monterrey. The 2025 comparison window included the Club World Cup and Gold Cup, both played in several US host cities, so those markets already had some tournament traffic last summer.
If you want the numbers for a specific host city, or a cut I didn’t run here, get in touch.
Create a Free Account
Free access to market data, Rentalizer estimates, and your listing’s performance. No credit card.
FAQs
How did new Airbnb listings perform during the 2026 World Cup?
Better than new listings usually do. In 14 of the 16 host cities, listings that first appeared between January and June 2026 scored higher for June and July stays than the same city’s new listings did a year earlier, and every host city’s newcomers averaged above 4.7 stars.
Which World Cup host city had the best Airbnb reviews for new listings?
Kansas City and Seattle led, with new listings averaging about 4.85 stars and roughly 90% of reviews at five stars. Boston, Monterrey and the San Francisco Bay Area followed.
Did the surge of World Cup listings hurt review quality?
No. Across all listings, the share of five-star reviews rose in 15 of the 16 host cities, and the cities that added the most listings tended to see the biggest gains. Kansas City had about 76% more available listings and its five-star share still rose from about 88% to 90%.
What is a typical Airbnb star rating?
On a five-point scale, the typical listing sits around 4.8 stars. In the 2026 World Cup host cities, new listings averaged between 4.71 (Philadelphia) and 4.85 (Kansas City) for June and July stays.
Which guests leave the highest Airbnb ratings?
Among the larger groups in the host cities, guests from the UK and the US gave the highest scores, averaging about 4.82 to 4.83 stars. Guests from Italy, Ecuador, Colombia, Spain and Argentina averaged roughly 4.69 to 4.73, and they rated lower in the same cities last summer too, so the gap mostly reflects how guests from different countries use a five-star scale.
ARTICLE SUMMARY
AirDNA’s Jamie Lane analyzed Airbnb reviews from June and July 2026 stays in the 16 FIFA World Cup host cities. Listings that joined Airbnb for World Cup 2026 outscored last year’s newcomers in 14 of 16 cities, led by Kansas City and Seattle, and the share of five-star reviews rose in 15 of 16 even as supply surged.
Jamie Lane
AirDNA Chief Economist
He is responsible for data analysis, thought leadership, and leveraging advanced analytical techniques to provide new insights into short-term rental market trends. Native to Atlanta and an Airbnb host himself, Jamie enjoys cycling, mountain biking, backpacking, running, and playing in a dart league in his free time.
