


U.S. Market Review May 2022: Supply Grows to Meet Demand
Published: June 14, 2022
Last updated: May 5, 2026

Jamie Lane
U.S. Short-Term Rental Supply Growth Surges to Meet Rising Demand
U.S. short-term rental (STR) demand showed no weakness in May, with nights stayed up another 17.9% compared to last year (+26% vs. 2019). New bookings were also healthy in May, topping 17.1 million nights booked during the month, which were up 2.6% compared to last year after two consecutive months of being below 2021 levels.
The hospitality industry is benefiting from a strong labor market and a shift in consumer spending towards services like hotels, STRs, and flights. U.S. employment increased by another 390,000 jobs in May, with 20% of them (84,000) added in the leisure and hospitality sector. Consumer spending growth has slowed in recent months, mostly from a lack of spending on goods, where spending has fallen for two consecutive months. Spending on services like travel, however, has remained strong and was up 5.9% in April, which was the last month of reported data.
Oil prices have been increasing rapidly over the past month and surpassed $120 per barrel over the last week. Further increases in oil prices could slow the growth of the summer travel season as high gas prices combined with high inflation reduce consumers' ability to further spend on trips. The strong dollar could also impact travel in the U.S. this summer as it makes travel to the U.S. more expensive (curtailing inbound travel to the U.S.) and travel overseas cheaper (increasing outbound travel from the U.S.).
At a glance: Key U.S. Short-Term Rental Performance Metrics for May 2022:
- Available listings reached 1.34 million, up 24.7% YOY (+11.8% vs. 2019)
- Demand is up 17.9% YOY (+26.1% vs. 2019)
- Occupancy was down 8.6% YOY to 60.2% (+8.6% vs. 2019)
- Average daily rates (ADRs) are up 4.6% YOY (+31.5% vs. 2019)
- Revenue is 23.3% higher YOY (+65.8% vs. 2019)
- Nights booked were up 2.8% YOY to 17.1 million
Occupancy Plunges as New Supply Additions Come Online
In May, hosts in the U.S. added 84,000 new listings, and after subtracting properties that left, saw a net increase of 57,000 listings. There were 1.34 million unique listings available for rent on Airbnb and Vrbo, which is up by 24.7% over the previous year and marks a new record high for listings in the U.S.
Supply growth substantially outpaced demand growth for the month, though, with occupancy falling by 8.6% in May to 60.2%. Listings growth could be slowing in coming months, though, as Redfin reports that their home buyer demand index was down by 12% YOY over the past month after a very strong start to 2022.

The number of listings is up throughout the entire U.S., but there are some common themes uniting the markets that have added the most new listings over the past year. All of the markets are located in the southern half of the U.S., with the largest cities in Florida, Texas, and Arizona reeling the biggest net increase in short-term rental listings over the past year.
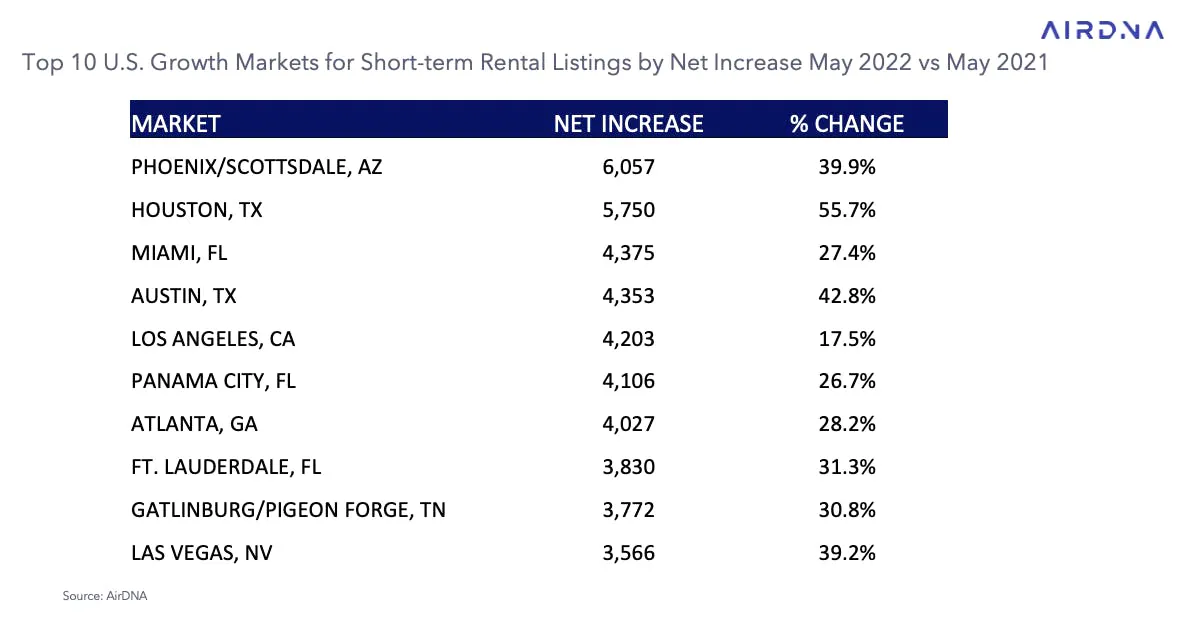
Phoenix/Scottsdale, AZ, had the highest increase, with over 6,000 additional listings available this year, marking a 39.9% increase from last year. Of these markets, Houston, TX, had the highest proportional growth the past year, growing its supply from 10,000 listings in May of 2021 to over 16,000 listings available last month, a 55.7% increase in just one year. In addition to those markets, Miami, FL, Austin, TX, Los Angeles, CA, Panama City, FL, and Atlanta, GA all added more than 4,000 new listings.
Occupancy declines were common throughout the country in May as the U.S. returned to more typical seasonality patterns. In a normal year, occupancy is lower in May than April, but 2021 bucked that trend as demand leaped forward last May thanks to vaccinations and lifting of pandemic restrictions.
The largest YOY occupancy declines were in Puerto Rico, where occupancy in the territory declined by 20.7% YOY. Other notable areas for large YOY occupancy declines include Joshua Tree, CA (-23.5%), Pocono Mountains, PA (-21.8%), Coachella Valley, CA (-21%), Lake Tahoe, CA (-20.5%), and Broken Bow, OK (-19.7%), which all saw record high occupancy last year as popular pandemic drive-to destinations.
ADR Growth at Slowest Rate since April 2020
Average daily rates increased by 4.6% YOY in May, averaging $263.75 for the month. This was the lowest YOY increase since April 2020 and was significantly lower than the 11.3% increase last month. As with occupancy, ADRs also appear to be reverting back to more normal seasonality patterns as hosts lower prices during softer months of demand. ADRs were 31.5% higher than 2019 levels in the same month, down slightly from 33.9% in April.

As demand returns to the cities, higher pricing is returning as well. Demand grew the fastest in urban locations in May, up 31.8% YOY, which seems to have also helped ADRs, as they grew by 9.9% for the month.
Of the largest 50 short-term rental markets, ADRs grew the most in Destin, FL (+29.4%) followed by Santa Rosa/Rosemary Beach, FL (+28.9%) and Maui, HI (+22.7%). Other notable markets with high growth include New York, NY (+19.1%), Boston, MA (+18.7%), and Chicago, IL (+15.1%), all of which were in the top 10 markets for fastest-growing ADRs over the past year.
Heading to the Beach: Occupancy Heating Up this Summer
As we look to the summer, many markets have strong booking activity and high occupancy levels already on the books. All of the top markets for occupancy this summer, as of early June, are located on the coast. The increased numbers of listings will help with the industry's ability to continue to grow demand in peak travel times during the summer months where the lack of availability constrained growth last year. Homes are already over 70% occupied in the Outer Banks, NC, Downeast Maine, and Pawleys Island, SC.

As of early June, overall demand is up by 12.8% for this coming summer when compared with demand booked for summer 2021, and it is up 21.8% compared with the summer of 2019. ADRs continue to push higher, and the average nightly rate for a trip booked this summer is $351, an 8% increase from last year.
There are significant headwinds as we head into the summer travel season with uncertainties around economic growth, high gas prices, steadily rising interest rates, and stubbornly high inflation. So far, short-term demand has persisted and continued to grow. We expect that to continue throughout the next year. While industry trends may vary, the outlook remains strong for the short-term rental industry for the time being.

2022 Outlook Report
Mid-year outlook report coming soon

Occupancy down?
Deepen your market understanding to price more competitively
Market Insights
Check out AirDNA to get specific insights for your area
ARTICLE SUMMARY
Occupancy came down in May 2022 as supply increases outpaced demand growth. Available listings hit an all-time record high of 1.34 million, up 24.7% from last year, with 84,000 new listings added in May 2022.
Jamie Lane
AirDNA Chief Economist
He is responsible for data analysis, thought leadership, and leveraging advanced analytical techniques to provide new insights into short-term rental market trends. Native to Atlanta and an Airbnb host himself, Jamie enjoys cycling, mountain biking, backpacking, running, and playing in a dart league in his free time.


