

 Calculate Revenue
 Research Markets
 Find For Sale Properties
 Compare My Listing
 STR Revenue Calculator
 Custom Comp Sets
 Submarket Insights
 Custom Search Filters
 Rate Recommendations
 Performance Benchmarking
 Competitor Comparison
 Owner Contact Details
 Property-level performance data
 Tourism Insights
 Real Estate Investment Analytics
 About Us
 Sales
Sales Support
 Press
PressInvesting In a Short-Term Rental: The 10 Best Places to Invest in the United Kingdom
Published: July 8, 2026

Camilo Schmid Rivas
Key Takeaways
- The United Kingdom offers numerous attractive locations characterized by resilient demand and a steadily growing market.
- The strongest markets combine healthy demand, pricing power, and reasonable property prices to deliver long-term investment potential.
- Choosing the right neighborhood is just as important as choosing the right market. Well-connected areas outside the city center can offer excellent returns at lower entry prices.
Seaside resorts, cathedral cities, national park gateways, and post-industrial towns on the rebound. The United Kingdom gives travelers plenty of reasons to book a stay, and investors plenty of markets to choose from.
That diversity makes the U.K. one of Europe's most attractive short-term rental markets. From year-round city breaks and business travel to coastal holidays and national park escapes, successful investments come in many forms.
The question isn't whether to invest in a short-term rental, but where. Choosing the right market is one of the biggest factors in long-term success.
In this report, we use AirDNA data to identify the ten best places to invest in a short-term rental in the U.K. and explain what makes each market stand out.
Our Methodology
Our methodology builds on AirDNA's Best Places to Invest framework, which has already been used to rank investment opportunities across the United States, Germany, and France.
To estimate investment potential in the U.K., we combined median house and apartment prices from the Office for National Statistics (ONS) with AirDNA market data on occupancy, pricing, seasonality, and revenue. Using census data, we also weighted each market to reflect the local mix of apartments and houses, giving us a more realistic picture of property values and investment returns.
Revenue estimates are based on the performance of comparable short-term rentals operating year-round. In practice, most properties are not available 365 days a year, so actual revenues are typically lower than these full-time projections.
You'll notice that some entries combine neighbouring locations, such as Perth and Dundee or Lancaster and Blackpool. That's because AirDNA defines markets geographically rather than by local authority boundaries. In these cases, treating the locations as a single market provides a more accurate picture of demand, supply, and revenue across the wider region.
Our expected market return is calculated by comparing projected annual revenue with local property prices, then weighting those returns based on the area's housing mix.
Some of the markets on this list may come as a surprise. They're not traditional holiday hotspots, but places where demand comes from universities, business travel, sporting events, and cultural attractions as much as leisure tourism. That diversity often creates more resilient, year-round demand, while keeping property prices and competition lower than in more established vacation markets.
The decisive factor is the data, not assumptions about where people choose to vacation. AirDNA's Best Places to Invest (BPTI) Score identifies markets where demand, revenue growth, and property prices combine to create attractive investment opportunities.
Three Key Metrics

Demand
Demand measures how often short-term rentals are booked and whether interest in a market is growing. We look at two key indicators:
- Trailing 12-Month (TTM) Occupancy Rate: The percentage of available nights booked over the past year. For example, a 70% occupancy rate means seven out of every ten available nights were booked.
- Booked Listing Growth: The year-over-year change in the number of listings receiving bookings, showing whether demand is expanding over time.
Together, these metrics show both the strength and direction of demand in a market.
Revenue
Revenue measures whether properties are becoming more profitable over time. We track year-over-year growth in Revenue Per Available Rental (RevPAR), which combines occupancy and Average Daily Rate (ADR) into a single measure of earning potential. By looking at both pricing power and booking performance, RevPAR provides one of the clearest indicators of market health.
Investability
Investability measures how attractive a market is for buyers today. We calculate gross yield by comparing a property's estimated annual revenue with its purchase price, then aggregate those figures at the market level to identify locations offering the strongest balance of affordability and income potential.
What About Regulations?
Regulations weren't included directly in this year's BPTI Score, but they played an important role in our methodology. Markets with the most restrictive Airbnb regulations, such as designated or proposed short-term let control areas where planning permission for a change of use is uncertain, were excluded to ensure the rankings reflect markets with viable investment opportunities.
This matters more in the U.K. than in many other countries because there is no single rulebook. Each of the four nations regulates short-term rentals differently, and those rules continue to evolve. Scotland operates a nationwide licensing scheme and allows councils to establish short-term let control areas. Wales combines licensing with second-home council tax premiums and occupancy thresholds that determine how properties are taxed. England currently has the lightest regulatory framework, although a national registration scheme is planned. Northern Ireland follows its own tourism certification system.
If you're considering a specific market, research the local regulations before you buy. In many cases, the rules are set by individual councils rather than national governments, so requirements can vary significantly between neighboring markets.
BPTI Score vs Market Score
If you've used AirDNA before, you're probably familiar with our 0–100 Market Score, which measures the overall health of every market and submarket in our database. While the two metrics may seem similar, the BPTI Score serves a different purpose.
The BPTI Score is designed to identify today's best investment opportunities. It focuses on properties that are actively for sale, helping investors compare purchase price, revenue potential, and expected returns.
The Market Score, by contrast, provides a broader view of long-term market health. It incorporates additional factors, including seasonality and regulation, making it a valuable benchmark for both prospective investors and existing hosts.
Together, the two scores provide different perspectives: the BPTI Score helps answer "Where should I invest today?", while the Market Score helps answer "How healthy is this market overall?"
How to Use This Report
This report is designed to be a starting point, not just a ranking of the best markets to invest in. Use it to identify opportunities, compare locations, and narrow your search before exploring individual markets in more detail.
Explore featured markets
Each market featured in this report links to its AirDNA Market Overview, where you can:
- Browse active short-term rental listings and assess the competitive landscape.
- Generate property-specific revenue projections.
- Explore key performance metrics, including occupancy, revenue, and RevPAR.
- Filter listings by bedroom count, amenities, and other property characteristics.
- Use AirDNA's interactive maps to identify high-performing neighborhoods within each market.
Looking beyond the headline rankings will help you understand how each market aligns with your investment goals.
Apply the framework to other markets
The value of this report extends beyond these ten locations. The same framework can be applied to any market you're considering.
Evaluate demand, revenue growth, investability, and seasonality to compare opportunities across different locations. Whether a market appears in this year's rankings or not, these metrics provide a consistent way to assess its long-term investment potential.
The Top 10 Best Places to Invest in a Short-Term Rental Property In The United Kingdom
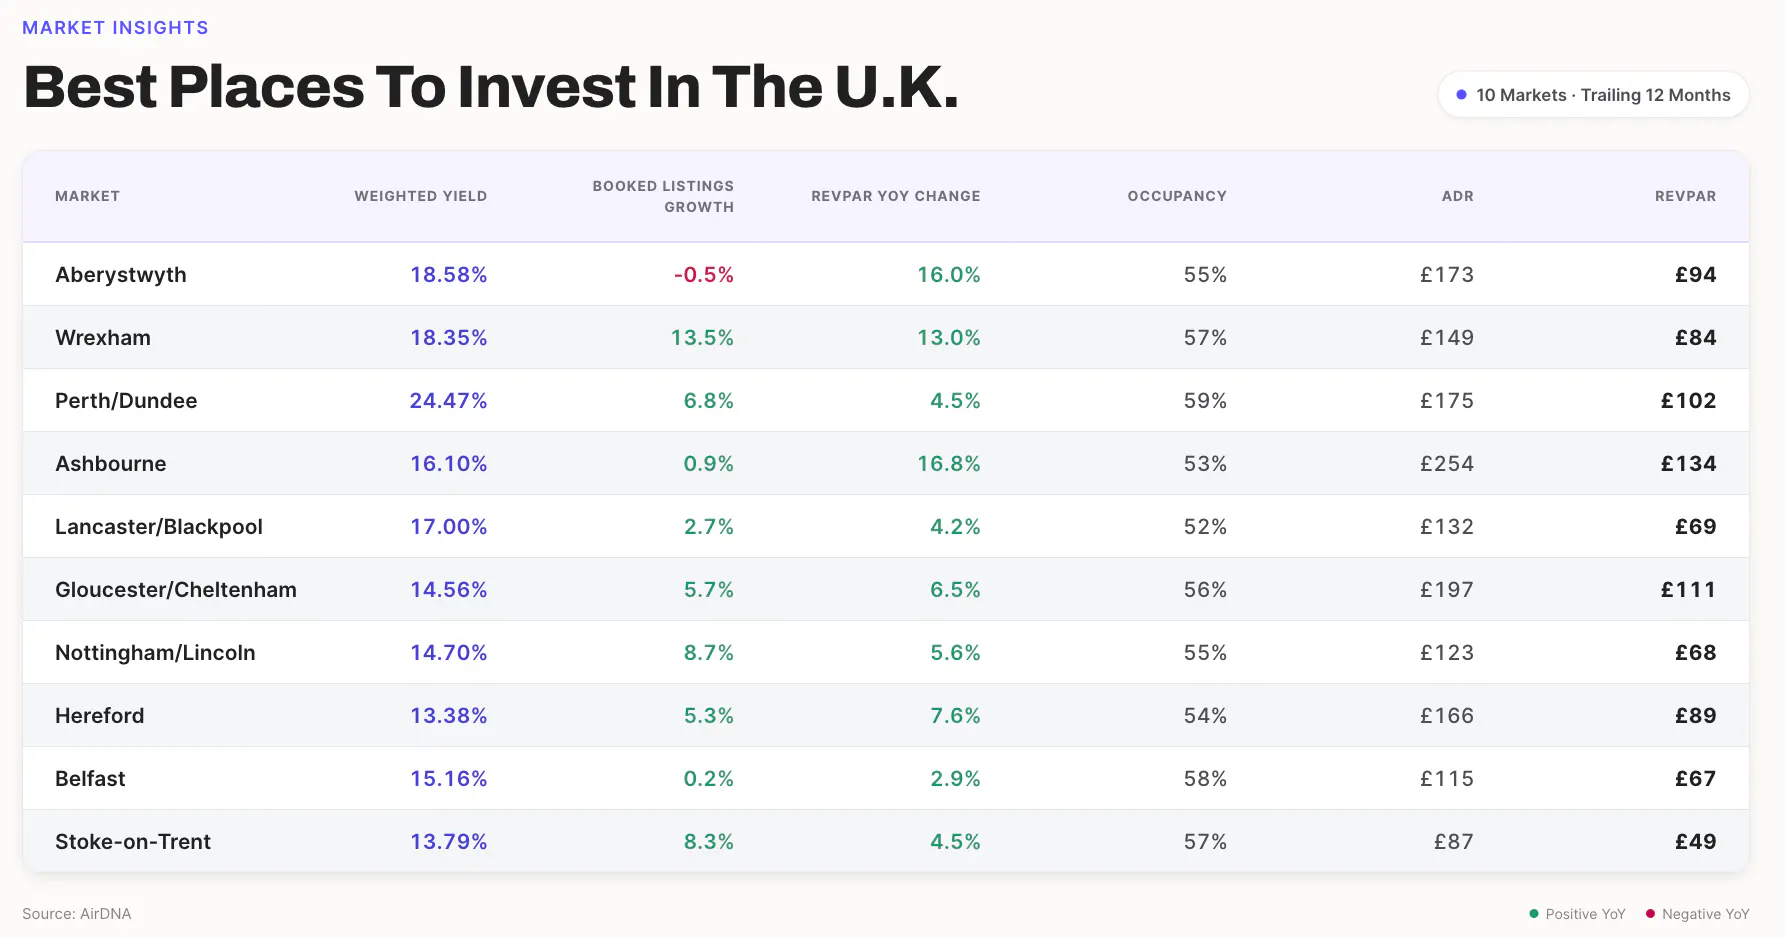
Understanding the metrics in the table below will help you compare each market at a glance.
- Booked Listing Growth: Measures the year-over-year increase in listings that received at least one booking. It shows whether demand is expanding and whether more properties are attracting guests.
- Gross Yield: Calculated by dividing a property's estimated annual revenue by its purchase price. Higher yields indicate stronger income potential relative to the cost of investment.
- RevPAR Growth: Measures year-over-year growth in Revenue Per Available Rental (RevPAR), combining the impact of occupancy and ADR. Positive growth signals improving revenue performance, while modest declines aren't uncommon in more mature markets.
- Occupancy Rate: The percentage of available nights booked over the past year. Higher occupancy generally reflects stronger, more consistent traveler demand.
1. Aberystwyth

- Occupancy Rate: 54.6%
- Average Daily Rate (ADR): £ 173
- Revenue Per Available Rental (RevPAR): £94
- Weighted Yield: 18.6%
Aberystwyth is a Victorian seaside town on the Cardigan Bay coast and the largest town in Mid Wales, which makes it the commercial and cultural anchor for a wide rural stretch of the country.
It's best known as a university town and the home of the National Library of Wales, one of the U.K.'s legal deposit libraries, and that institutional weight gives it a steady, year-round demand base that most coastal resorts simply don't have. The seafront promenade, the Victorian cliff railway up Constitution Hill, and the Vale of Rheidol heritage railway pull in leisure visitors through the summer, while the university draws a constant stream of students, visiting families, open-day attendees, and conference traffic across the rest of the calendar.
Aberystwyth takes the top spot in the BPTI U.K. ranking. With an occupancy rate of 55% and an ADR of £173, the town achieves a RevPAR of £94, combined with a weighted yield of 18.58%, one of the strongest on the list. RevPAR climbed 16.0% year over year while the number of booked listings held essentially flat, a sign that demand is strengthening faster than supply rather than the market simply adding rooms. That mix of a genuine tourism season, a resilient academic-year demand floor, and accessible property prices is what lifts Aberystwyth above larger, better-known markets.
2. Wrexham

- Occupancy Rate: 57%
- Average Daily Rate (ADR): £149
- Revenue Per Available Rental (RevPAR): £84
- Weighted Yield: 18.4%
Wrexham is the largest urban area in North Wales and, since 2022, a city, sitting just inside the Welsh border near Chester and the gateway to the Dee Valley. It has become one of the U.K.'s most talked-about places over the past few years, as the rise of its football club under high-profile new ownership turned a working town into an international visitor draw. That attention sits on top of an existing base of business and family travel, university demand, and proximity to both the Snowdonia fringe and the Cheshire cities, giving the market a mix of leisure and year-round demand that's unusual for a place its size.
Wrexham stands out for momentum. Booked listings grew 13.5% year over year, the strongest growth among the top 10, while RevPAR rose 13.0%, a combination that signals demand and supply climbing together as the market matures rather than one outpacing the other. With an occupancy rate of 57%, an ADR of £149, and a RevPAR of £84, Wrexham delivers a weighted yield of 18.4%, among the highest on the list. For investors, the appeal is a market still early in its visibility curve, with accessible property prices and demand drivers that look structural rather than fleeting.
3. Perth/Dundee

- Occupancy Rate: 59%
- Average Daily Rate (ADR): £175
- Revenue Per Available Rental (RevPAR): £102
- Weighted Yield: 24.5%
Perth and Dundee are two neighbouring cities in eastern Scotland, set roughly 35 minutes apart along the River Tay and treated here as a single market. Perth, the historic "Gateway to the Highlands," anchors the western side with its medieval heritage, nearby castles, and an affluent surrounding region. Dundee provides the contemporary draw. V&A Dundee, which opened in September 2018 as the first Victoria and Albert museum outside London, sits at the centre of a waterfront regeneration that has reshaped the city's profile, and Dundee is recognised as the U.K.'s first UNESCO City of Design. Between them, the two cities pair Highland-gateway tourism with cultural and waterfront visitor demand, plus a steady base of university and business travel.
Perth and Dundee deliver the standout investability figure on the list. The weighted yield of 24.5% is the highest in the top 10 by a clear margin, signaling a strong ratio between property prices and revenue potential. With an occupancy rate of 59%, an ADR of £175, and a RevPAR of £102, the market combines the top RevPAR on the list with that leading yield, a rare pairing of strong current performance and accessible entry pricing. Booked listings grew 6.8% year over year, confirming demand is still building rather than plateauing. It's also the largest single-market entry near the top of the ranking, with 2,423 active listings, which gives investors more liquidity and comparable data than the smaller markets above it.
4. Ashbourne

- Occupancy Rate: 60.2%
- Average Daily Rate (ADR): £121.36
- Revenue Per Available Rental (RevPAR): £73.01
- Weighted Yield: 17.1%
Ashbourne is a historic market town on the southern edge of the Peak District National Park, widely known as the "Gateway to Dovedale" and a natural base for exploring the limestone valleys of the White Peak. The town has more than 200 listed buildings, a medieval street pattern, and a calendar anchored by the centuries-old Royal Shrovetide Football game each February. Its appeal is built on outdoor tourism: the traffic-free Tissington Trail starts on the northern edge of town, and Dovedale's river, stepping stones, and hills draw walkers and cyclists through the warmer months. It also sits within easy reach of Alton Towers and the wider Derbyshire stately-home circuit, broadening the visitor base beyond pure hiking traffic.
Ashbourne stands out for revenue strength. Its ADR of £254 is comfortably the highest in the top 10, and at a 53% occupancy rate it still produces a RevPAR of £134, also the strongest on the list, well ahead of any other market here. The weighted yield of 16.1% reflects solid return potential against that high revenue base, and a 16.8% year-over-year RevPAR rise, one of the largest in the ranking, shows pricing power is still climbing. The lower occupancy reflects the town's seasonal, outdoor-led rhythm, but the exceptional daily rates more than compensate, making Ashbourne a high-revenue, premium-nightly-rate play rather than a high-volume one.
5. Lancaster/Blackpool

- Occupancy Rate: 52%
- Average Daily Rate (ADR): £132
- Revenue Per Available Rental (RevPAR): £69
- Weighted Yield: 17.0%
Lancaster and Blackpool sit on the Lancashire coast in northwest England and form one of the largest markets on this list by listing count. Blackpool is the headline draw and one of Britain's defining seaside resorts, anchored by the Blackpool Tower, the Pleasure Beach theme park, the piers along the Golden Mile, and the autumn Illuminations. It draws around 20 million visitors a year, and tourism supports roughly one in five jobs in the town. The resort has worked to extend its season beyond summer with events like the Illuminations and winter programming. Lancaster adds a different layer, a historic university city with a castle and a year-round student and institutional base that tempers the pure seasonality of the coast.
Lancaster and Blackpool offer scale and accessibility rather than chart-topping performance. The weighted yield of 17.0% is healthy and reflects low entry prices relative to revenue, but an occupancy rate of 52% is the lowest in the top 10, and a RevPAR of £69 sits near the bottom of the list, both a function of the resort's pronounced seasonal rhythm and high-volume, value-priced stock. With 5,520 active listings, this is a deep, liquid market with abundant comparable data, which lowers the entry risk for a first investment even if the headline returns are more modest. The appeal here is affordability, volume, and a nationally recognised demand engine rather than premium nightly rates.
6. Gloucester/Cheltenham
- Occupancy Rate: 56%
- Average Daily Rate (ADR): £197
- Revenue Per Available Rental (RevPAR): £111
- Weighted Yield: 14.6%
Gloucester and Cheltenham are neighbouring Gloucestershire cities, around ten minutes apart by train, that together sit on the western edge of the Cotswolds. Cheltenham is the demand engine, a Regency spa town that brands itself "The Festival Town" and hosts a packed annual calendar, including the Cheltenham Festival horse-racing meet and the Cheltenham Literature Festival, one of the oldest literary festivals in the world, alongside jazz, music, and science festivals. Gloucester adds a complementary draw with its medieval cathedral and historic docks. Crucially, both function as a base for the Cotswolds, postcard villages such as Bourton-on-the-Water and Bibury sit within a 45-minute drive, with Oxford and Stratford-upon-Avon around 45 minutes away. Strong rail links to London, Birmingham, and Bristol widen the market further.
Gloucester and Cheltenham stand out for demand quality and scale rather than headline yield. The weighted yield of 14.6% is more modest than the markets above, but this is one of the largest entries on the list at 5,998 active listings, and it carries one of the strongest Market Scores in the ranking, a reflection of healthy rental demand, revenue growth, and a relatively even seasonal spread. With an occupancy rate of 56% and a high ADR of £197, the market produces a robust RevPAR of £111, second only to Ashbourne here. The festival calendar is the differentiator: it concentrates premium-priced demand into repeatable, bookable peaks across the year, giving operators clear pricing-power windows rather than a single summer season.
7. Nottingham/Lincoln

- Occupancy Rate: 55%
- Average Daily Rate (ADR): £123
- Revenue Per Available Rental (RevPAR): £68
- Weighted Yield: 14.7%
Nottingham and Lincoln are two East Midlands cities treated here as a single market, and together they form the largest entry on this list by some distance. Nottingham is the regional hub, a lively university city with two large universities, a compact shopping core, a strong arts and nightlife scene, and a tourism identity built around Robin Hood, Nottingham Castle, and the nearby Sherwood Forest. Lincoln provides a heritage counterweight: a historic cathedral city whose cathedral dates to 1072, anchored by Lincoln Castle, which holds one of the four surviving copies of the 1215 Magna Carta. Between them, the two cities pair a year-round student and business base in Nottingham with steady heritage and city-break demand in Lincoln, and both sit within easy reach of the Peak District for outbound visitors.
Nottingham and Lincoln stand out for scale and momentum. At 7,879 active listings, this is comfortably the deepest market in the top 10, which means abundant comparable data and the easiest entry and exit of any market here, a meaningful risk reducer for a first investment. Booked listings grew 8.7% year over year, the strongest growth of any English market on the list, signalling demand that's still expanding rather than topping out. With an occupancy rate of 55%, an ADR of £123, and a RevPAR of £68, the headline returns are modest, and the weighted yield of 14.7% reflects an urban market where entry prices are higher relative to nightly revenue. The appeal here is liquidity, a diversified year-round demand base, and rising booking activity rather than premium yields.
8. Hereford
- Occupancy Rate: 54%
- Average Daily Rate (ADR): £166
- Revenue Per Available Rental (RevPAR): £89
- Weighted Yield: 13.4%
Hereford is a historic cathedral city on the River Wye in the west of England, close to the Welsh border and at the heart of a rural county known for its countryside, cider, and Hereford cattle. Its anchor attraction is Hereford Cathedral, which holds two genuinely world-class draws: the Mappa Mundi, made around the year 1300 and the largest medieval map of the world to survive, and the Chained Library, the largest surviving library of its kind in the world. The cathedral also co-hosts the Three Choirs Festival, the world's longest-running classical music festival, on its rotation through the city. Beyond the cathedral, Hereford serves as a base for the Wye Valley, a region often described as a birthplace of British tourism, with riverside walking, cycling, and canoeing drawing year-round outdoor visitors.
Hereford offers stability rather than standout returns. The weighted yield of 13.4% is the most modest in the top 10, and an occupancy rate of 54% with a RevPAR of £89 places it mid-to-lower on the performance metrics. What earns Hereford its place is demand quality: it carries one of the strongest Market Scores in the ranking, reflecting healthy rental demand, steady revenue growth, and a relatively balanced seasonal profile rather than a single tourist peak. A 7.6% year-over-year RevPAR rise shows the market is still gaining ground. For investors, Hereford reads as a lower-volatility, heritage-anchored market with consistent year-round demand, the kind of steady performer that complements higher-yield, more seasonal options elsewhere on the list.
9. Belfast

- Occupancy Rate: 58%
- Average Daily Rate (ADR): £115
- Revenue Per Available Rental (RevPAR): £67
- Weighted Yield: 15.2%
Belfast is the capital of Northern Ireland and the only capital city on this list, a compact, walkable city that has reinvented itself as a year-round city-break destination over the past decade. Its flagship draw is the regenerated Titanic Quarter, built on the former Harland & Wolff shipyard where the Titanic was constructed. The quarter has attracted over £650 million in investment and now draws more than 3.6 million visitors a year, anchored by Titanic Belfast, billed as the world's largest Titanic visitor attraction. The city's appeal is broad and largely weatherproof: maritime heritage, a thriving Cathedral Quarter food and nightlife scene, screen-tourism tied to productions filmed in and around the city, and a substantial university and business base that sustains demand outside the summer peak.
Belfast stands out for demand quality and balance rather than headline returns. The weighted yield of 15.2% is solid mid-table, and at 58%, it posts one of the higher occupancy rates in the top 10, reflecting steady, year-round city demand rather than a sharp seasonal spike. With an ADR of £115 and a RevPAR of £67, the nightly economics are modest, and booked-listings growth was essentially flat year over year, a more mature, settled market than the fast-climbing entries above. What lifts Belfast is its strong overall Market Score, supported by healthy rental demand and the most favourable regulation reading on the list. For investors, the appeal is a stable capital-city market with diversified, all-season demand and a deep, established visitor economy.
10. Stoke-on-Trent

- Occupancy Rate: 57%
- Average Daily Rate (ADR): £87
- Revenue Per Available Rental (RevPAR): £49
- Weighted Yield: 13.8%
Stoke-on-Trent is a city in Staffordshire in the West Midlands, known the world over as "The Potteries" for the ceramics industry that shaped it. That heritage is now its core visitor draw: factory tours and workshops at famous names like Wedgwood and Emma Bridgewater, the Gladstone Pottery Museum, and the Potteries Museum and Art Gallery, which houses the Staffordshire Hoard, the largest collection of Anglo-Saxon gold ever discovered. Beyond ceramics, the city pulls family and leisure demand from the Trentham Estate and Monkey Forest, and crucially sits as the nearest city to Alton Towers Resort, one of the U.K.'s largest theme parks, a significant year-round overnight-stay generator. Its central location and motorway links also place the Peak District within easy reach.
Stoke-on-Trent rounds out the list as a value-and-momentum play. With an ADR of £87 and a RevPAR of £49, it has the most affordable nightly economics in the top 10, a direct reflection of low entry prices that underpin its weighted yield of 13.8%. The headline figures are modest, but the direction of travel is positive: booked listings grew 8.3% year over year, among the strongest growth on the list, and a 57% occupancy rate is mid-table and steady. For investors, Stoke offers the lowest cost of entry of any market featured here, paired with rising booking activity and a diversified demand base spanning ceramics tourism, theme-park visitors, and proximity to the Peak District, the classic profile of an early-stage, accessible market.
Why Invest In a Short-Term Rental in the United Kingdom?
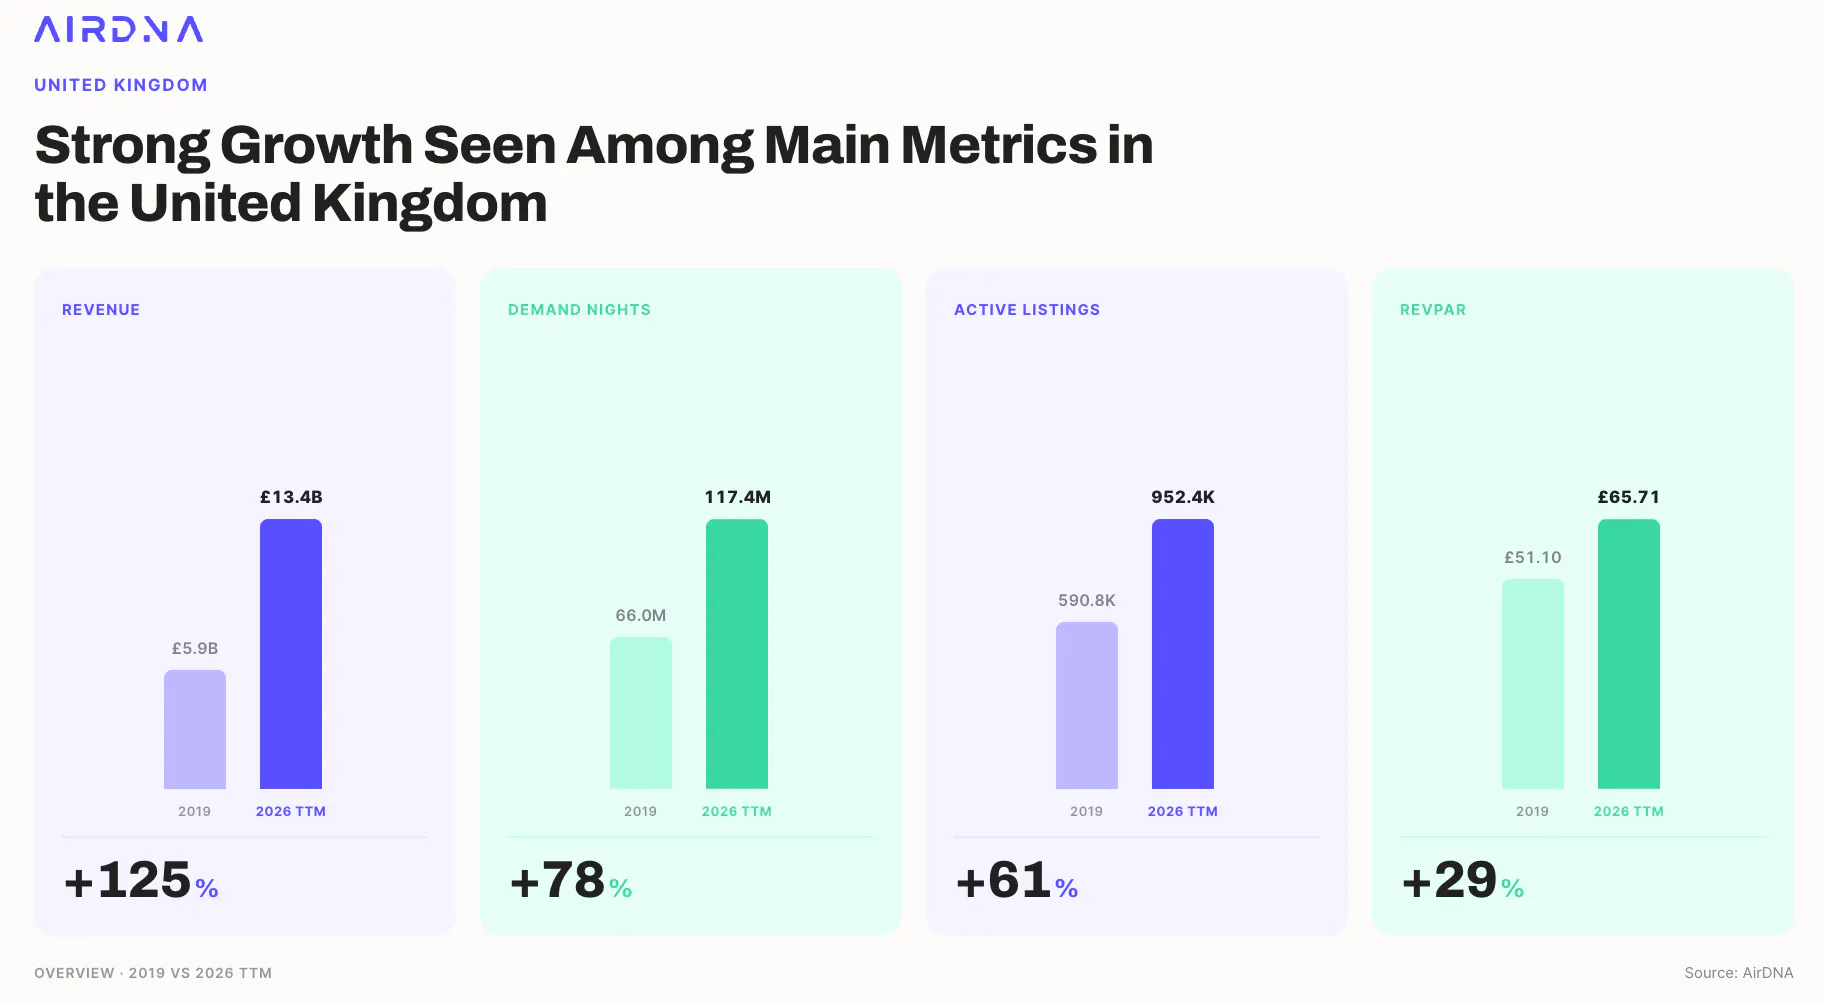
The U.K. short-term rental market has changed significantly over the past several years. Demand has continued to grow, operators have gained pricing power, and revenue has more than doubled since 2019.
- Revenue has more than doubled since 2019: Total short-term rental revenue reached approximately £8.13 billion in the twelve months to May 2026, up from £4.02 billion in 2019, an increase of 102%.
- Pricing power is driving growth: Revenue per available rental (RevPAR) climbed 46% over the same period, from £60.84 to £89.08, while average daily rates (ADR) rose even faster, increasing 53% from £100.73 to £153.87.
- Demand continues to grow: Booked nights increased 32% since 2019, from approximately 39.9 million to 52.8 million. Although listings grew slightly faster, occupancy has remained healthy, reflecting a market that continues to attract travelers at scale.
- Supply growth has remained measured: Active listings increased 34% over the same period, from roughly 283,500 to 380,400. With pricing growing faster than supply, the market's revenue gains have been driven by stronger earning potential rather than a flood of new inventory.
Choosing the Right Location
Finding the right market is only the first step. Success often comes down to choosing the right neighborhood within that market.
When evaluating a location, consider the fundamentals that drive long-term performance:
- Rental demand
- Revenue growth
- Seasonality
- Regulations
- Competitive intensity
- Property prices
Just as importantly, don't assume the best investment sits in the heart of the tourist district.
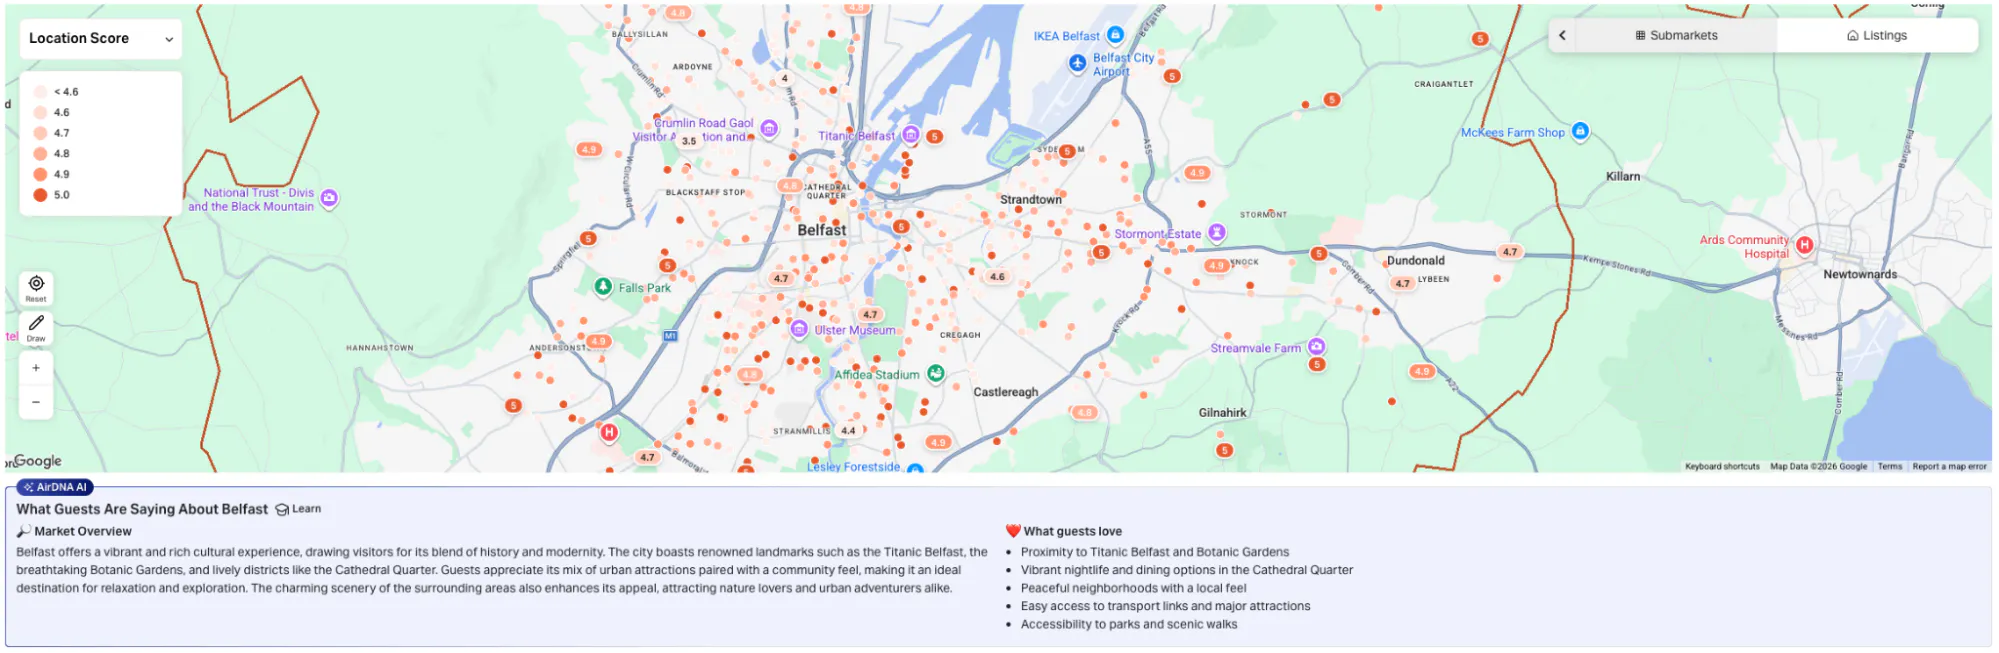
Take Belfast as an example. The Cathedral Quarter and the waterfront around Titanic Belfast are obvious starting points, but AirDNA's Location Scores show that strong investment opportunities extend well beyond the city center. Residential neighborhoods such as Strandtown and Stranmillis also earn high scores, demonstrating that guests value more than proximity to major attractions.
Our AI analysis of guest reviews tells the same story. Alongside easy access to Titanic Belfast and the Cathedral Quarter, travelers consistently praise peaceful neighborhoods, a local feel, and convenient transport links. For investors, that creates an opportunity to secure lower entry prices outside the city center without sacrificing demand.
FAQs
What are the best places to invest in a short-term rental in the U.K.?
The best locations combine strong occupancy, growing demand, attractive property prices, and healthy revenue potential. While major cities attract attention, smaller markets such as university towns, cathedral cities, and national park gateways can often offer stronger yields and lower competition.
Is investing in an Airbnb in the U.K. profitable?
It can be, provided you choose the right market. Profitability depends on factors such as occupancy, average daily rates (ADR), seasonality, operating costs, and purchase price. AirDNA's Best Places to Invest rankings identify markets with a strong balance of demand, revenue potential, and investability.
How do I choose the best location for a vacation rental investment?
Look beyond tourist popularity alone. The strongest markets typically combine consistent year-round demand, revenue growth, reasonable property prices, manageable competition, and a favorable regulatory environment. Neighborhood selection is just as important as choosing the right city.
What should I look for before buying a short-term rental property in the U.K.?
Before investing, evaluate rental demand, occupancy, revenue growth, seasonality, local regulations, competition, and property prices. Understanding these factors can help you identify markets with the strongest long-term investment potential.
Are short-term rental regulations the same across the U.K.?
No. England, Scotland, Wales, and Northern Ireland each have different rules for short-term rentals, and local councils may introduce additional requirements. Before buying a property, always check the regulations that apply in your chosen market.
ARTICLE SUMMARY
Thinking about investing in a short-term rental in the U.K.? This report ranks the country's best investment markets using AirDNA data on demand, revenue, gross yield, and property prices, while explaining the trends that make each location an attractive opportunity.
Camilo Schmid Rivas
Senior Research Analyst
Camilo Schmid Rivas is a Senior Research Analyst at AirDNA who brings a uniquely well-rounded perspective to short-term rental analytics. With a background that spans investment, real estate, and business analysis—including roles at Stayery and Sollers Consulting—Camilo has worn many analyst hats, each sharpening his ability to turn complex data into clear, actionable insights. A graduate of École hôtelière de Lausanne, he now channels his multidisciplinary expertise into uncovering trends that drive smarter STR decisions. In his free time, he enjoys playing tennis or scuba diving in or around Barcelona.
