

 Calculate Revenue
 Research Markets
 Find For Sale Properties
 Compare My Listing
 STR Revenue Calculator
 Custom Comp Sets
 Submarket Insights
 Custom Search Filters
 Rate Recommendations
 Performance Benchmarking
 Competitor Comparison
 Owner Contact Details
 Property-level performance data
 Tourism Insights
 Real Estate Investment Analytics
 About Us
 Sales
Sales Support
 Press
PressMost Profitable Cities for Airbnb in Australia in 2026
Published: September 10, 2026

Camilo Schmid Rivas
Key Takeaways
- Whitsunday, Exmouth, and Gold Coast are the three most profitable cities for Airbnb in Australia.
- Metrics like occupancy, ADR, RevPAR, seasonality, and annual revenue potential determine what truly drives profitability in Australian STR markets.
- Before committing capital to any Airbnb investment in Australia, consider local regulations, perform ample market research, and determine your personal investment strategy.
Australia's short-term rental markets are absolutely exploding. While other investors squabble over traditional long-term rentals with their predictable but uninspiring 3-4% yields, STR investors are quietly pocketing returns that would make stock market enthusiasts green with envy.
You could throw a dart at a map of profitable Airbnb locations in Australia and probably do alright—the market's that hot. But why settle for alright when exceptional returns are available to those who know where to look? Each region's Airbnb rental income in Australia tells a unique story of supply, demand, and untapped potential that translates directly to your bottom line.
Read on to discover which Australian markets deserve your investment dollars in 2026.
Top 20 Most Profitable Cities in Australia
The numbers are in for top Airbnb markets in Australia. The continent offers some impressive STR investment opportunities—if you know where to look.
We’ve compiled a list of the 20 most profitable cities for Airbnb in Australia. The rankings below are based on annual revenue potential, which provides a standardized way to compare different markets. Just remember: These figures represent theoretical maximum earnings, not guaranteed returns.
Let's explore the top performers that deliver particularly impressive property investment returns in Australia.
How we ranked top Australian Airbnb markets
Our analysis of the most profitable cities for Airbnb in Australia is built on comprehensive market intelligence derived from thousands of data points.
This study included any market with 100 or more listings. That cutoff isn't arbitrary—it reflects Australia's relatively small population density of just 8.8 people per square mile (compared to the USA's 95) to ensure we're comparing established markets rather than outliers with too few data points to be statistically significant.
While we tracked over 15 performance indicators—from occupancy trends to average length of stay—annual revenue potential emerged as our primary ranking metric. Why this figure above all others? Unlike ADR, which fails to account for vacant nights, or even revPAR, which provides a useful but limited daily snapshot, annual revenue potential offers the comprehensive perspective investors need to compare dissimilar markets.
Think of property investment returns in Australia like evaluating different career paths—you wouldn't compare an hourly wage to an annual salary. Revenue potential provides that annualized view, making it easier to weigh a beachside property with sky-high summer rates against a business district flat with steady year-round occupancy.
Using revenue potential as our primary ranking factor streamlines comparisons while still reflecting the combined impact of pricing power and market demand. The data reveals that while ADR might grab headlines, consistent performance across both pricing and occupancy delivers the strongest bottom-line results for Airbnb investment in Australia.
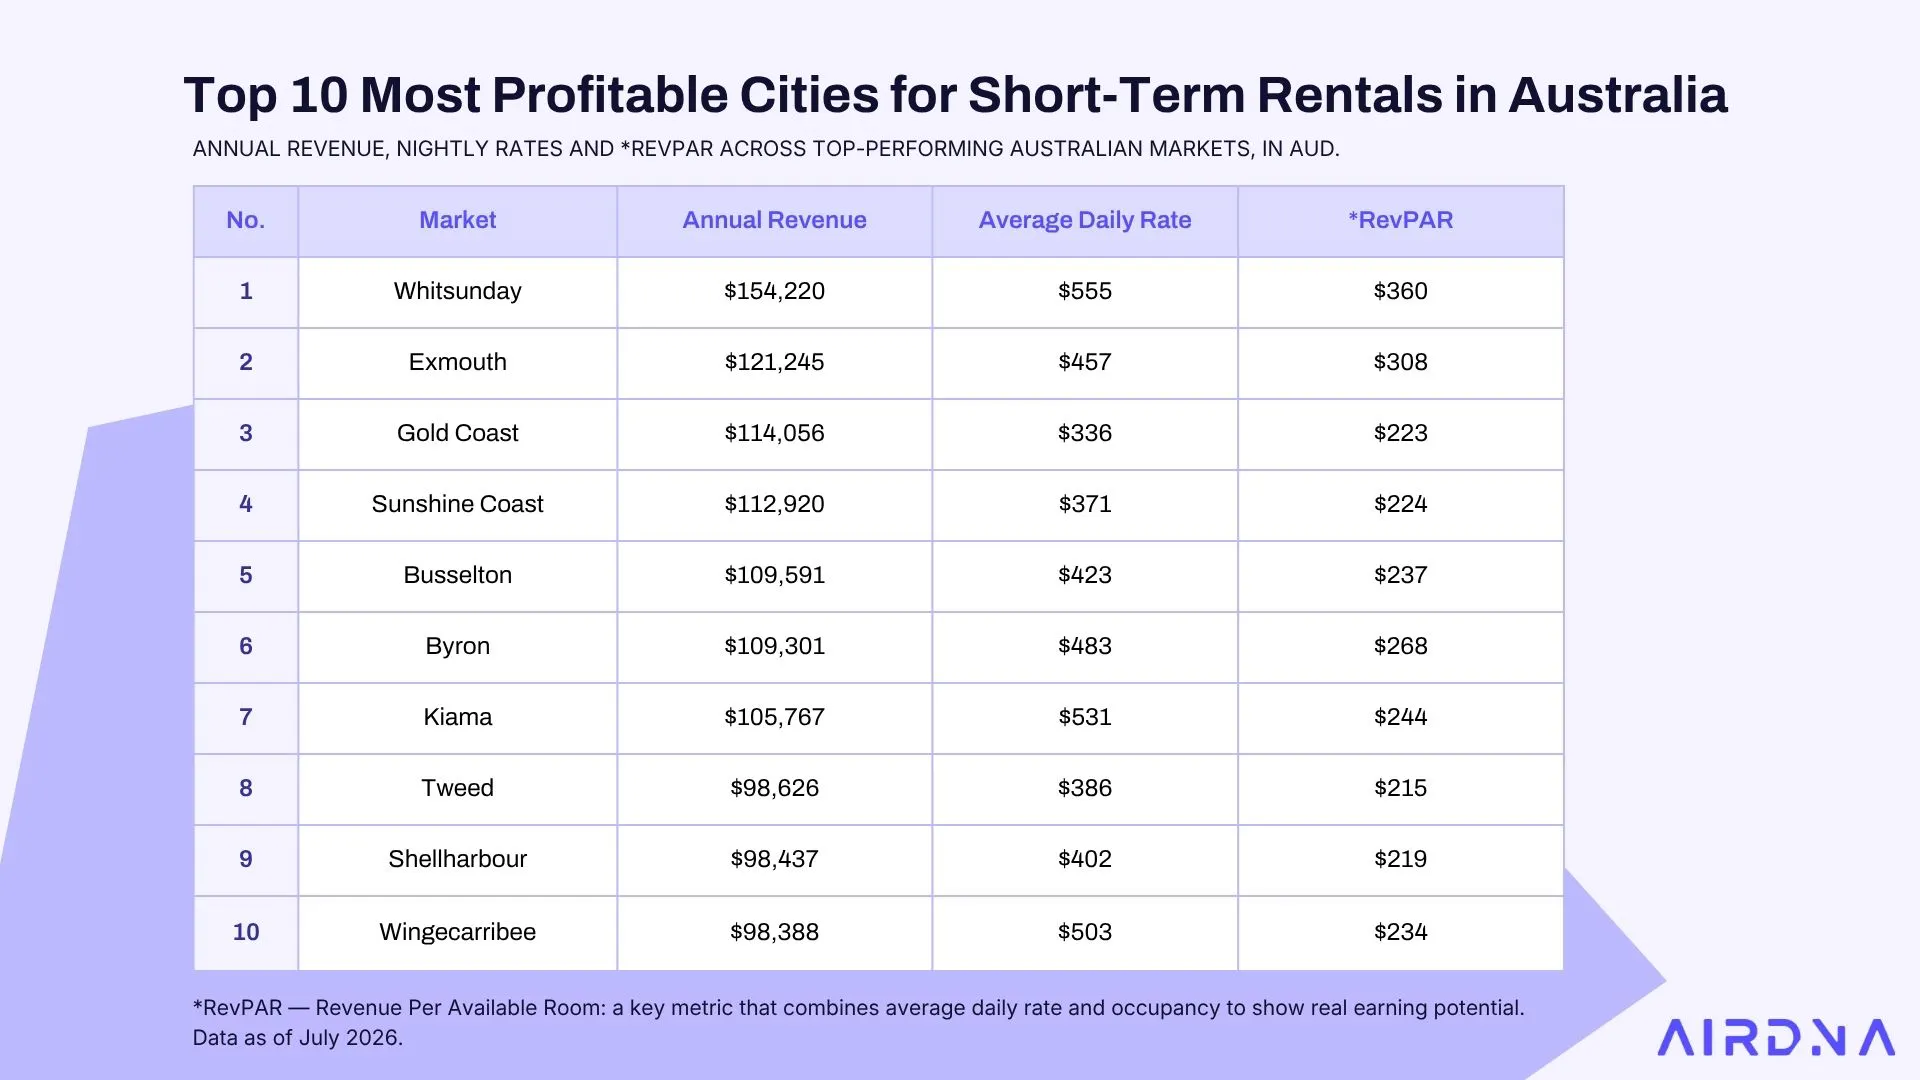
Note that all revenue numbers are in AUD. Below is a preview of the top 10.
1. Whitsunday
- ADR: $554.81
- RevPAR: $359.68
- Annual revenue potential: $154,220
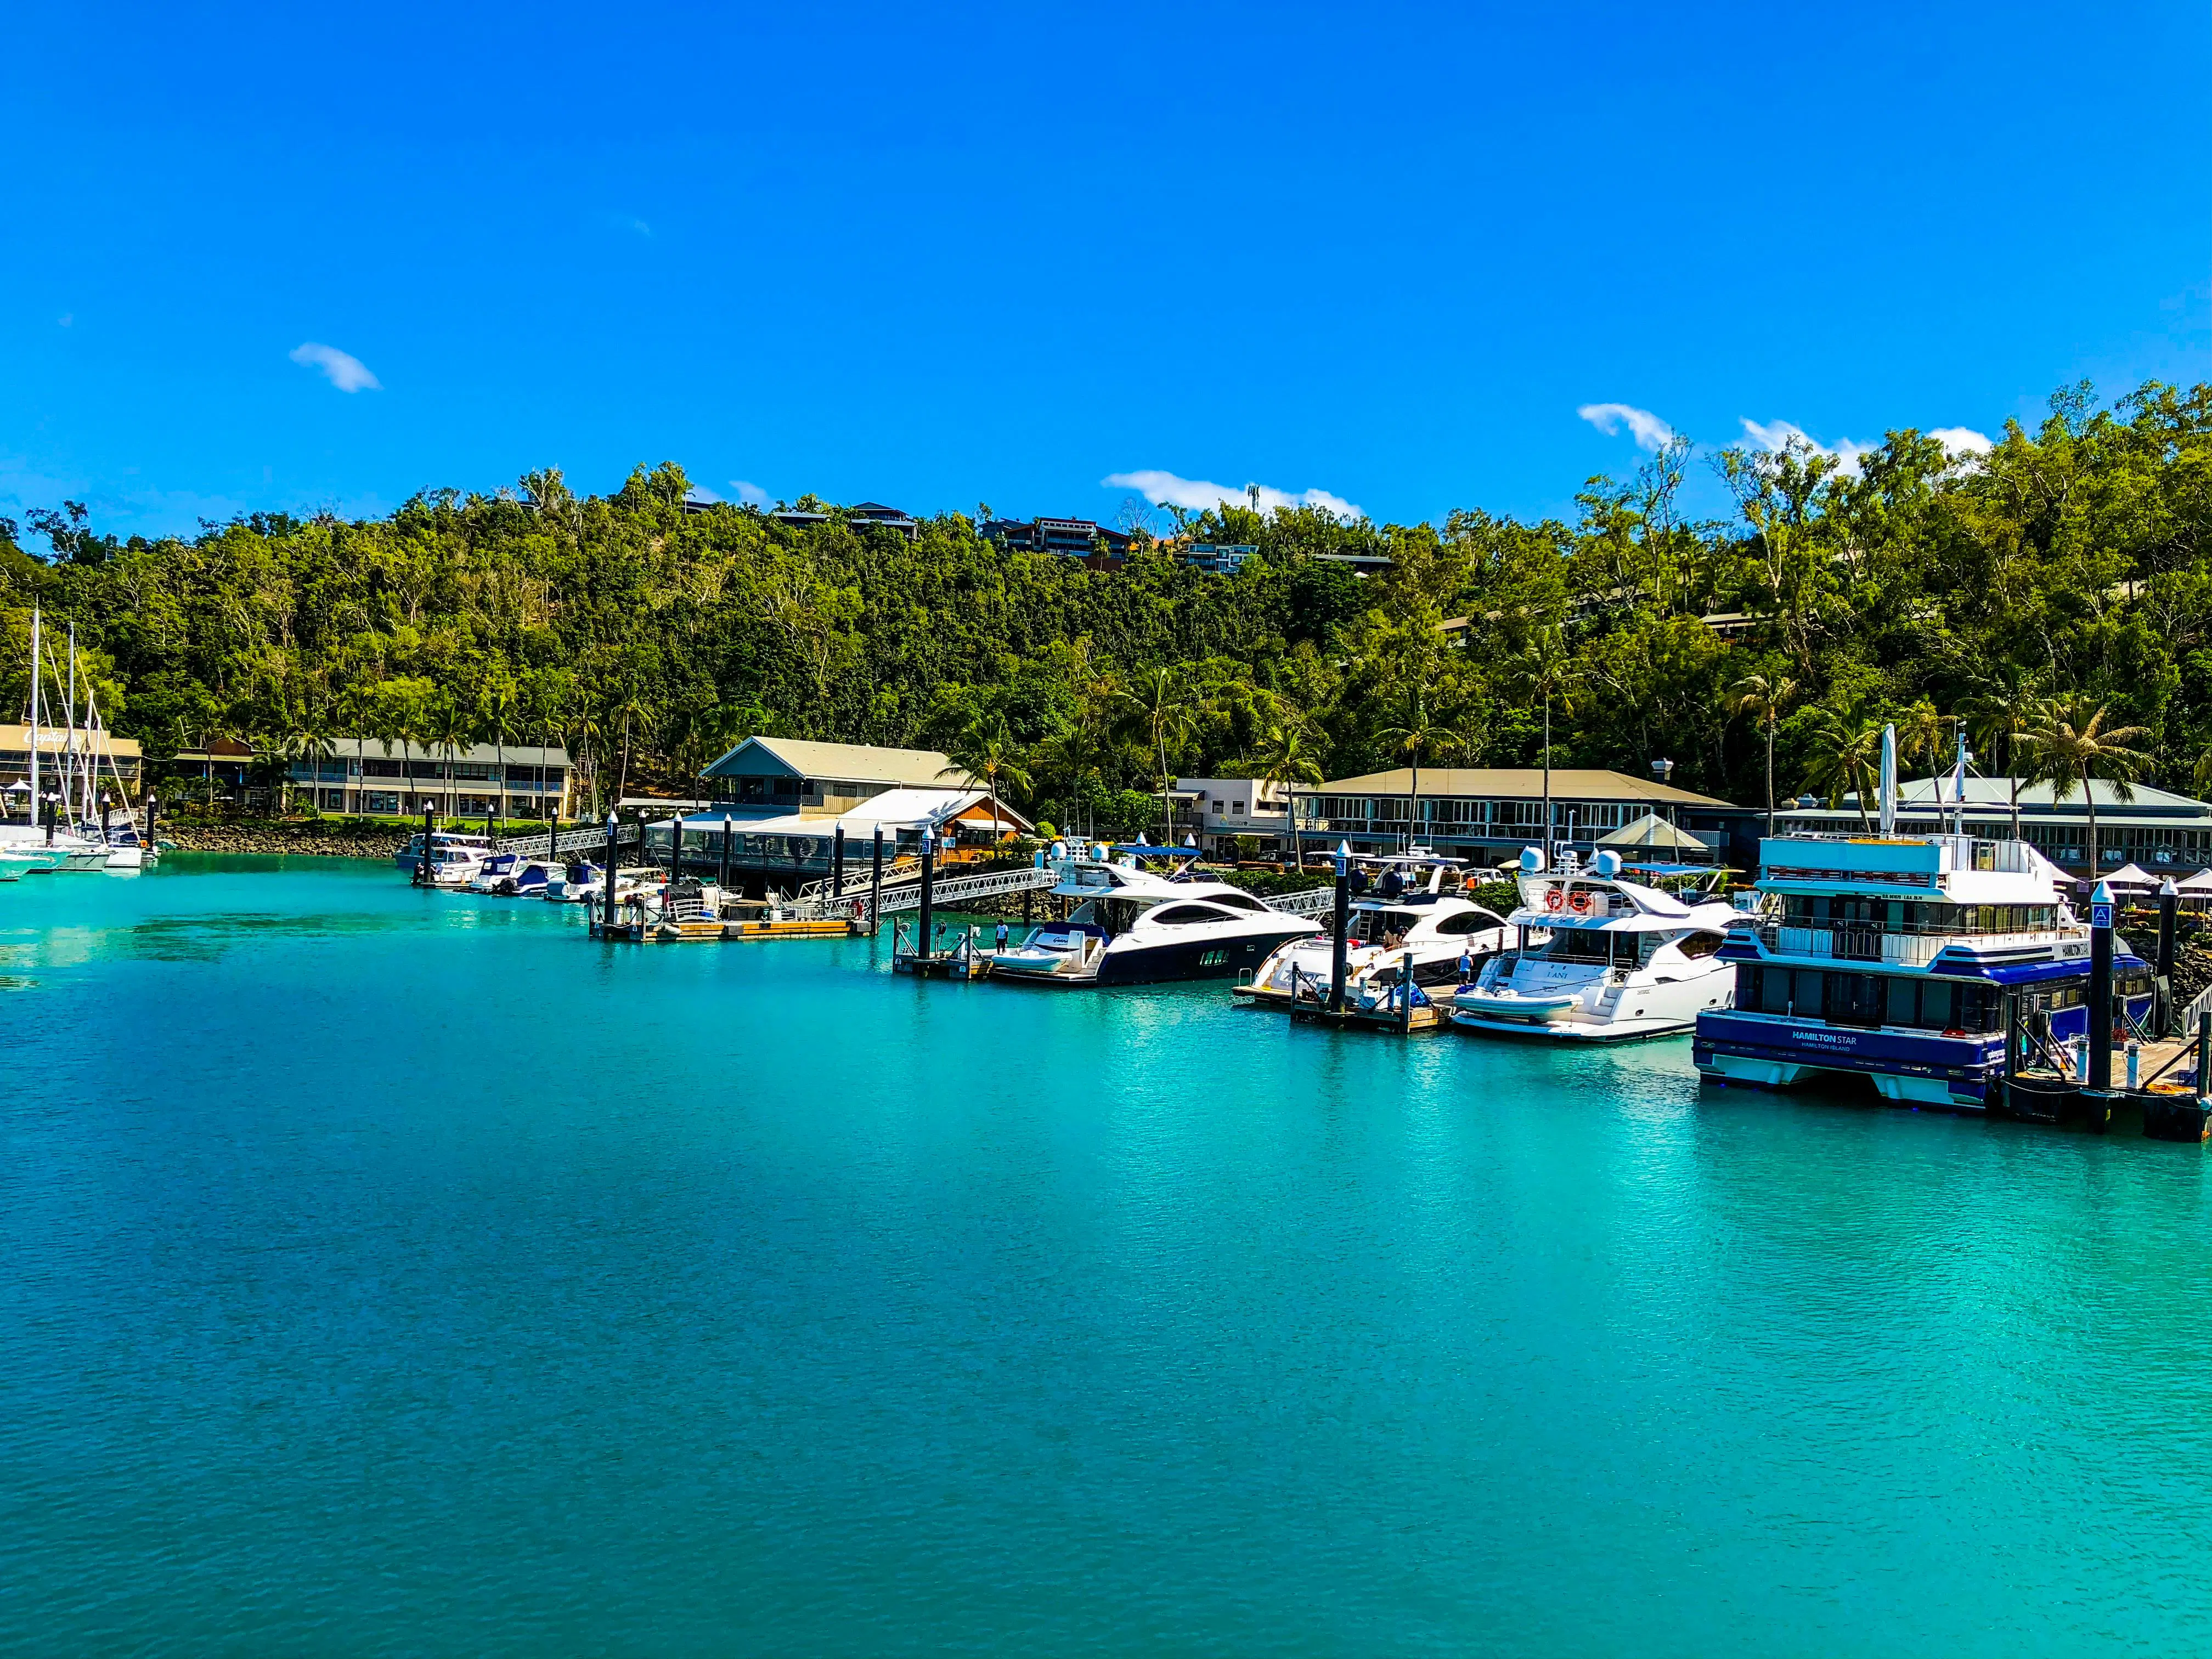
Located in tropical North Queensland, Whitsunday tops Australia's profitable Airbnb locations list for the second year running, with just over $154K in annual revenue potential and the highest RevPAR in the country at $360. This archipelago of 74 islands within the Great Barrier Reef Marine Park attracts diverse tourists year-round. Airlie Beach serves as the gateway to attractions like world-famous Whitehaven Beach, and the region's appeal peaks from July through December, coinciding with most of the dry season.
What makes Whitsunday's position convincing rather than lucky is how it handled growth: available listings rose 7.2% over the past year — one of the steepest supply increases in the top 20 — and revenue potential still climbed 2.0%. Markets that absorb new inventory without diluting per-listing returns are demonstrating genuine demand depth, not just scarcity.
2. Exmouth
- ADR: $457.09
- RevPAR: $307.60
- Annual revenue potential: $121,245
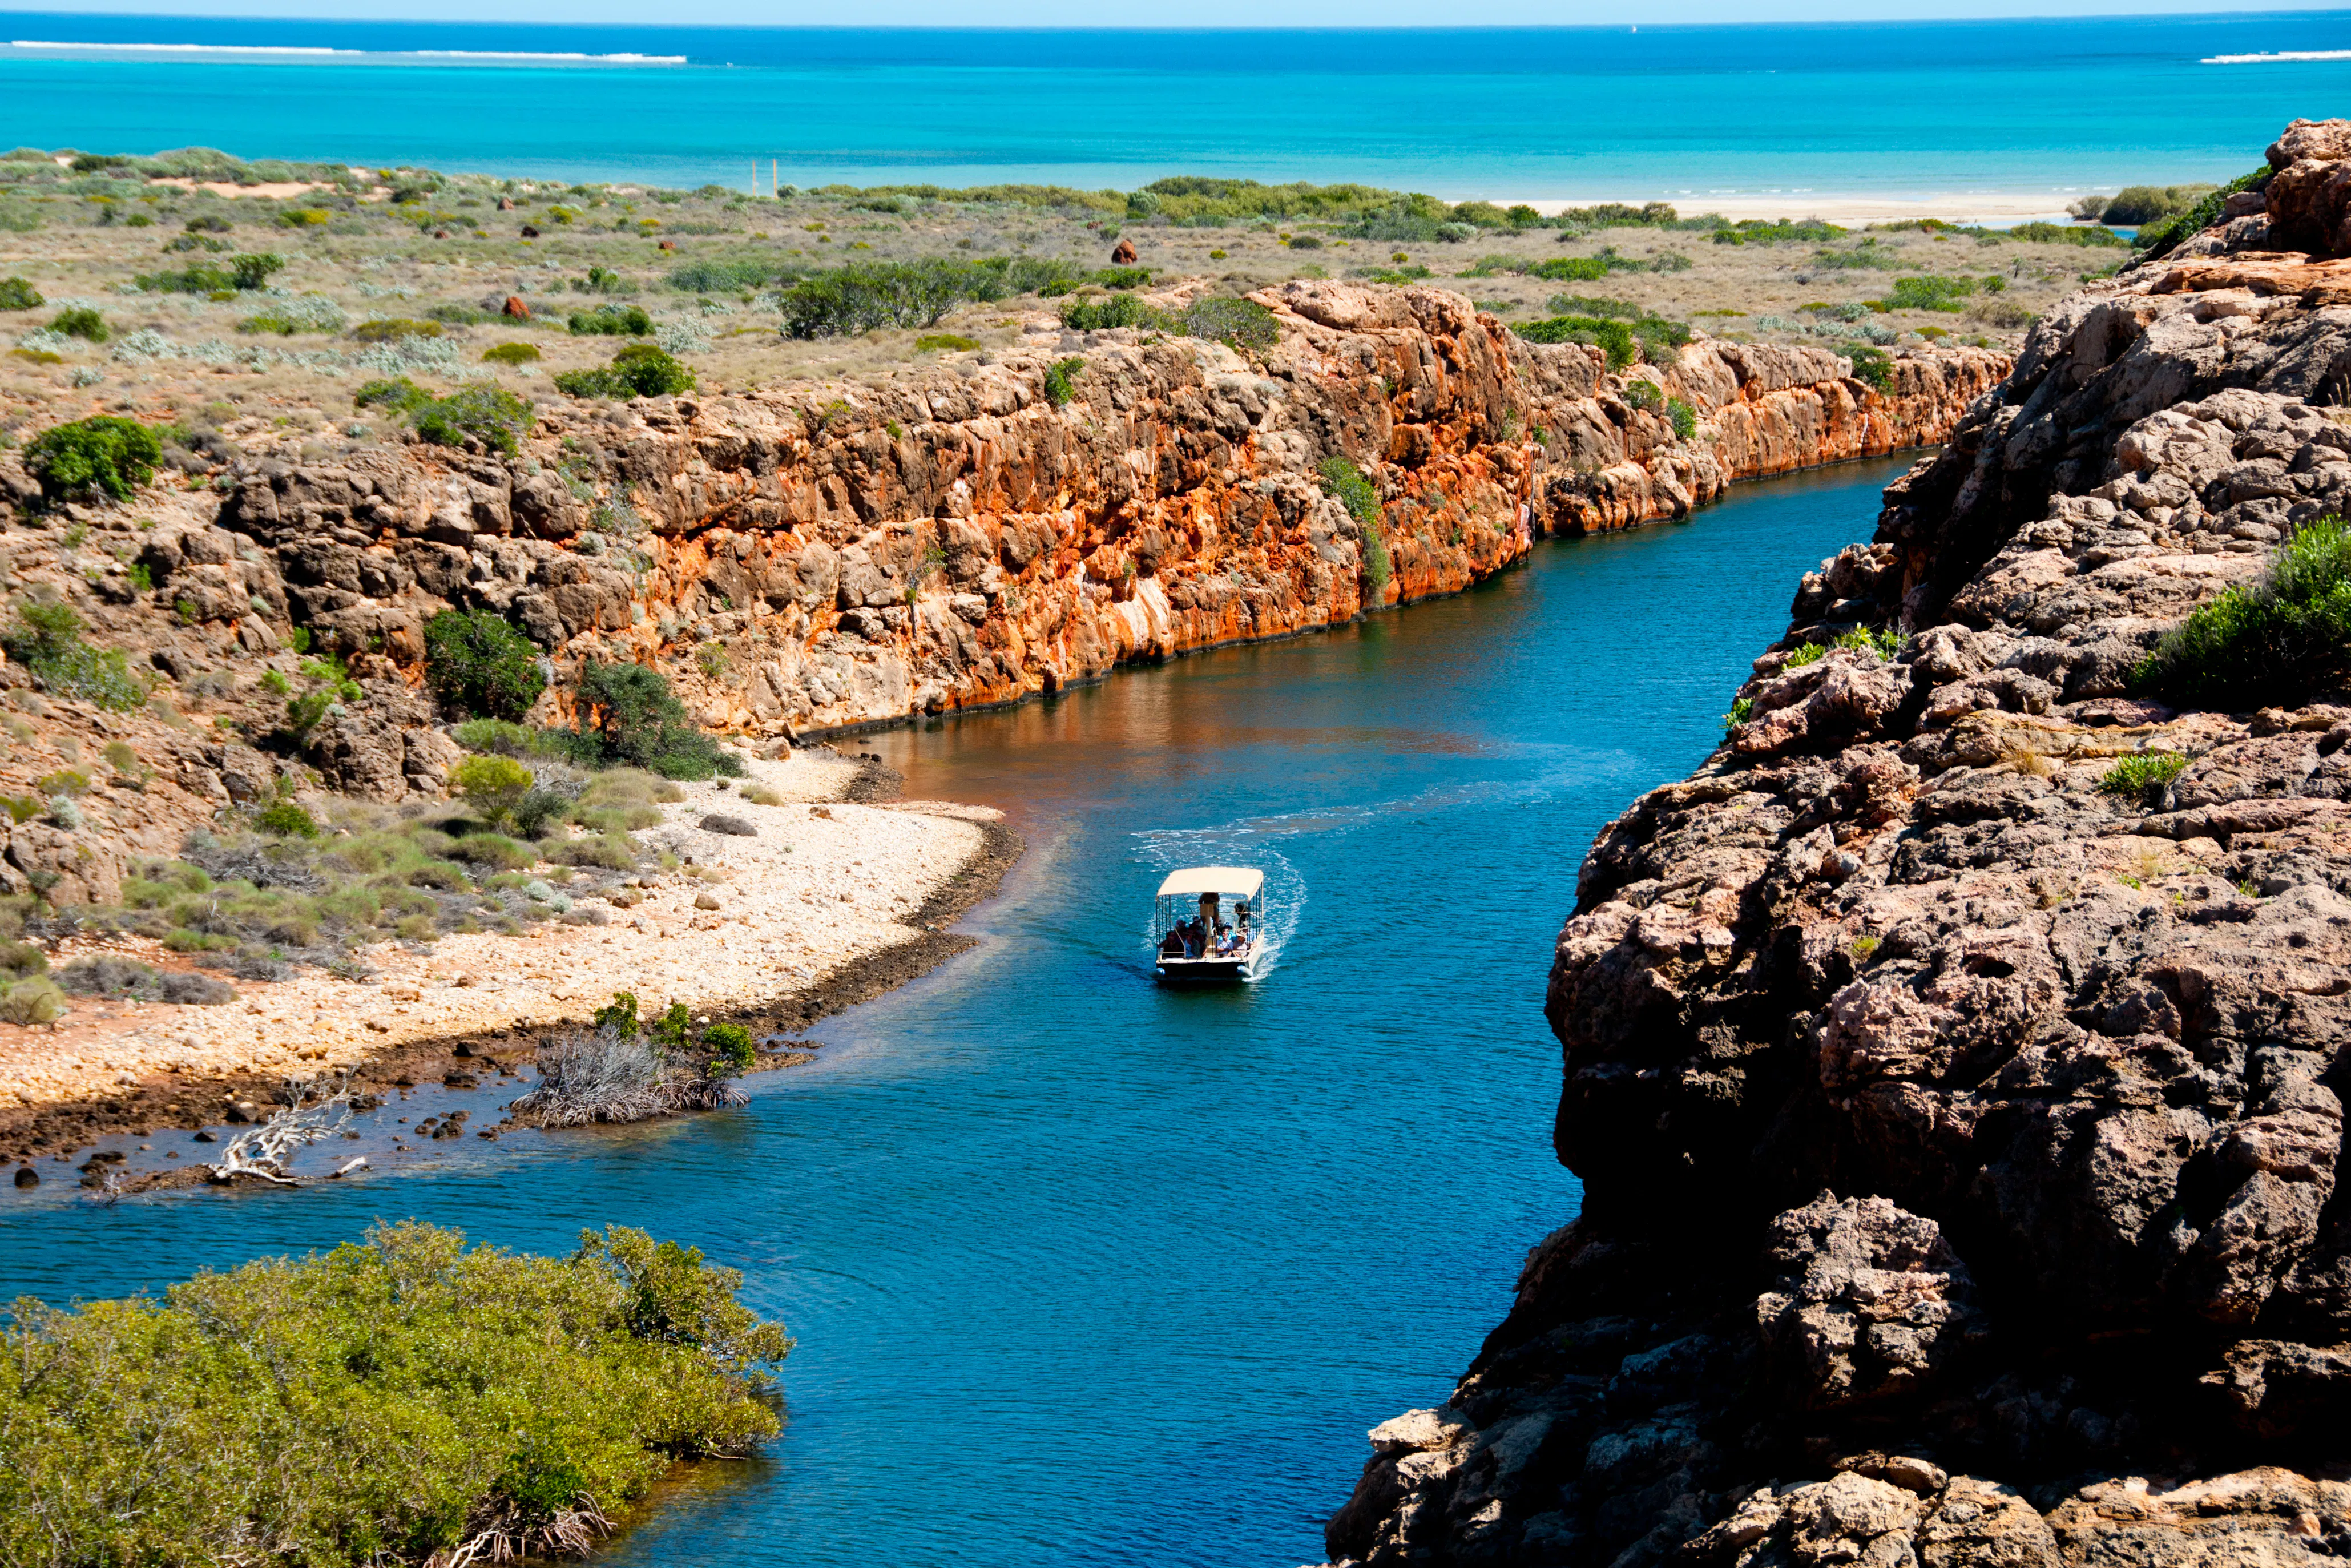
Situated on Western Australia's North West Cape, Exmouth holds second place for a second consecutive year with just over $121K in annual revenue potential and the nation's second-highest RevPAR at $308. This remote coastal town serves as the gateway to Ningaloo Reef, one of the world's largest fringing reefs and a UNESCO World Heritage site. Exmouth's primary appeal comes from seasonal attractions like whale shark swimming (March–July) and humpback whale watching (August–October).
The investment case here is supply constraint. With just 202 available listings — one of the three smallest markets in the top 20 — Exmouth sustains 67.3% occupancy, the tenth-highest rate in Australia. That said, a 52 seasonality score confirms the concentrated demand window, so this is a market that rewards operators who can price the peak aggressively.
3. Gold Coast

- ADR: $336.12
- RevPAR: $222.87
- Annual revenue potential: $114,056
Sun-soaked and vibrant, the Gold Coast holds third with $114K in annual revenue potential — without ranking anywhere near the top on nightly rate. Its $336 ADR places it 42nd of the 162 markets we ranked, which makes it a useful corrective to rate-first thinking.
This coastal playground stretches across 57 km of pristine beaches. From the iconic Surfers Paradise skyline to the thrilling rides at Dreamworld, the region masterfully balances family-friendly attractions with sophisticated dining and nightlife. What sets Gold Coast apart for investors is scale plus consistency: 7,521 available listings running at 66.3% occupancy, with an 84 seasonality score indicating limited seasonal swing. It was the only market in the top 10 where revenue potential edged down over the year, by 1.3% — a flat result rather than a weak one.
4. Sunshine Coast

- ADR: $371.08
- RevPAR: $223.51
- Annual revenue potential: $112,920
Queensland's Sunshine Coast holds fourth with nearly $113K in annual revenue potential, and posted a 5.6% gain — the strongest of the four markets whose ranking didn't move.
Stretching roughly from Caloundra north to Noosa, the region pairs surf beaches with hinterland villages and the volcanic peaks of the Glass House Mountains. Its 6,818 available listings make it one of Australia's deepest short-term rental markets, which matters for investors who want an exit: liquid markets are easier to buy into and easier to leave. An 86 seasonality score points to demand that holds up well outside the summer peak, and at 60.2% occupancy the market is neither supply-starved nor oversupplied.
6. Busselton
- ADR: $423.44
- RevPAR: $236.97
- Annual revenue potential: $109,591
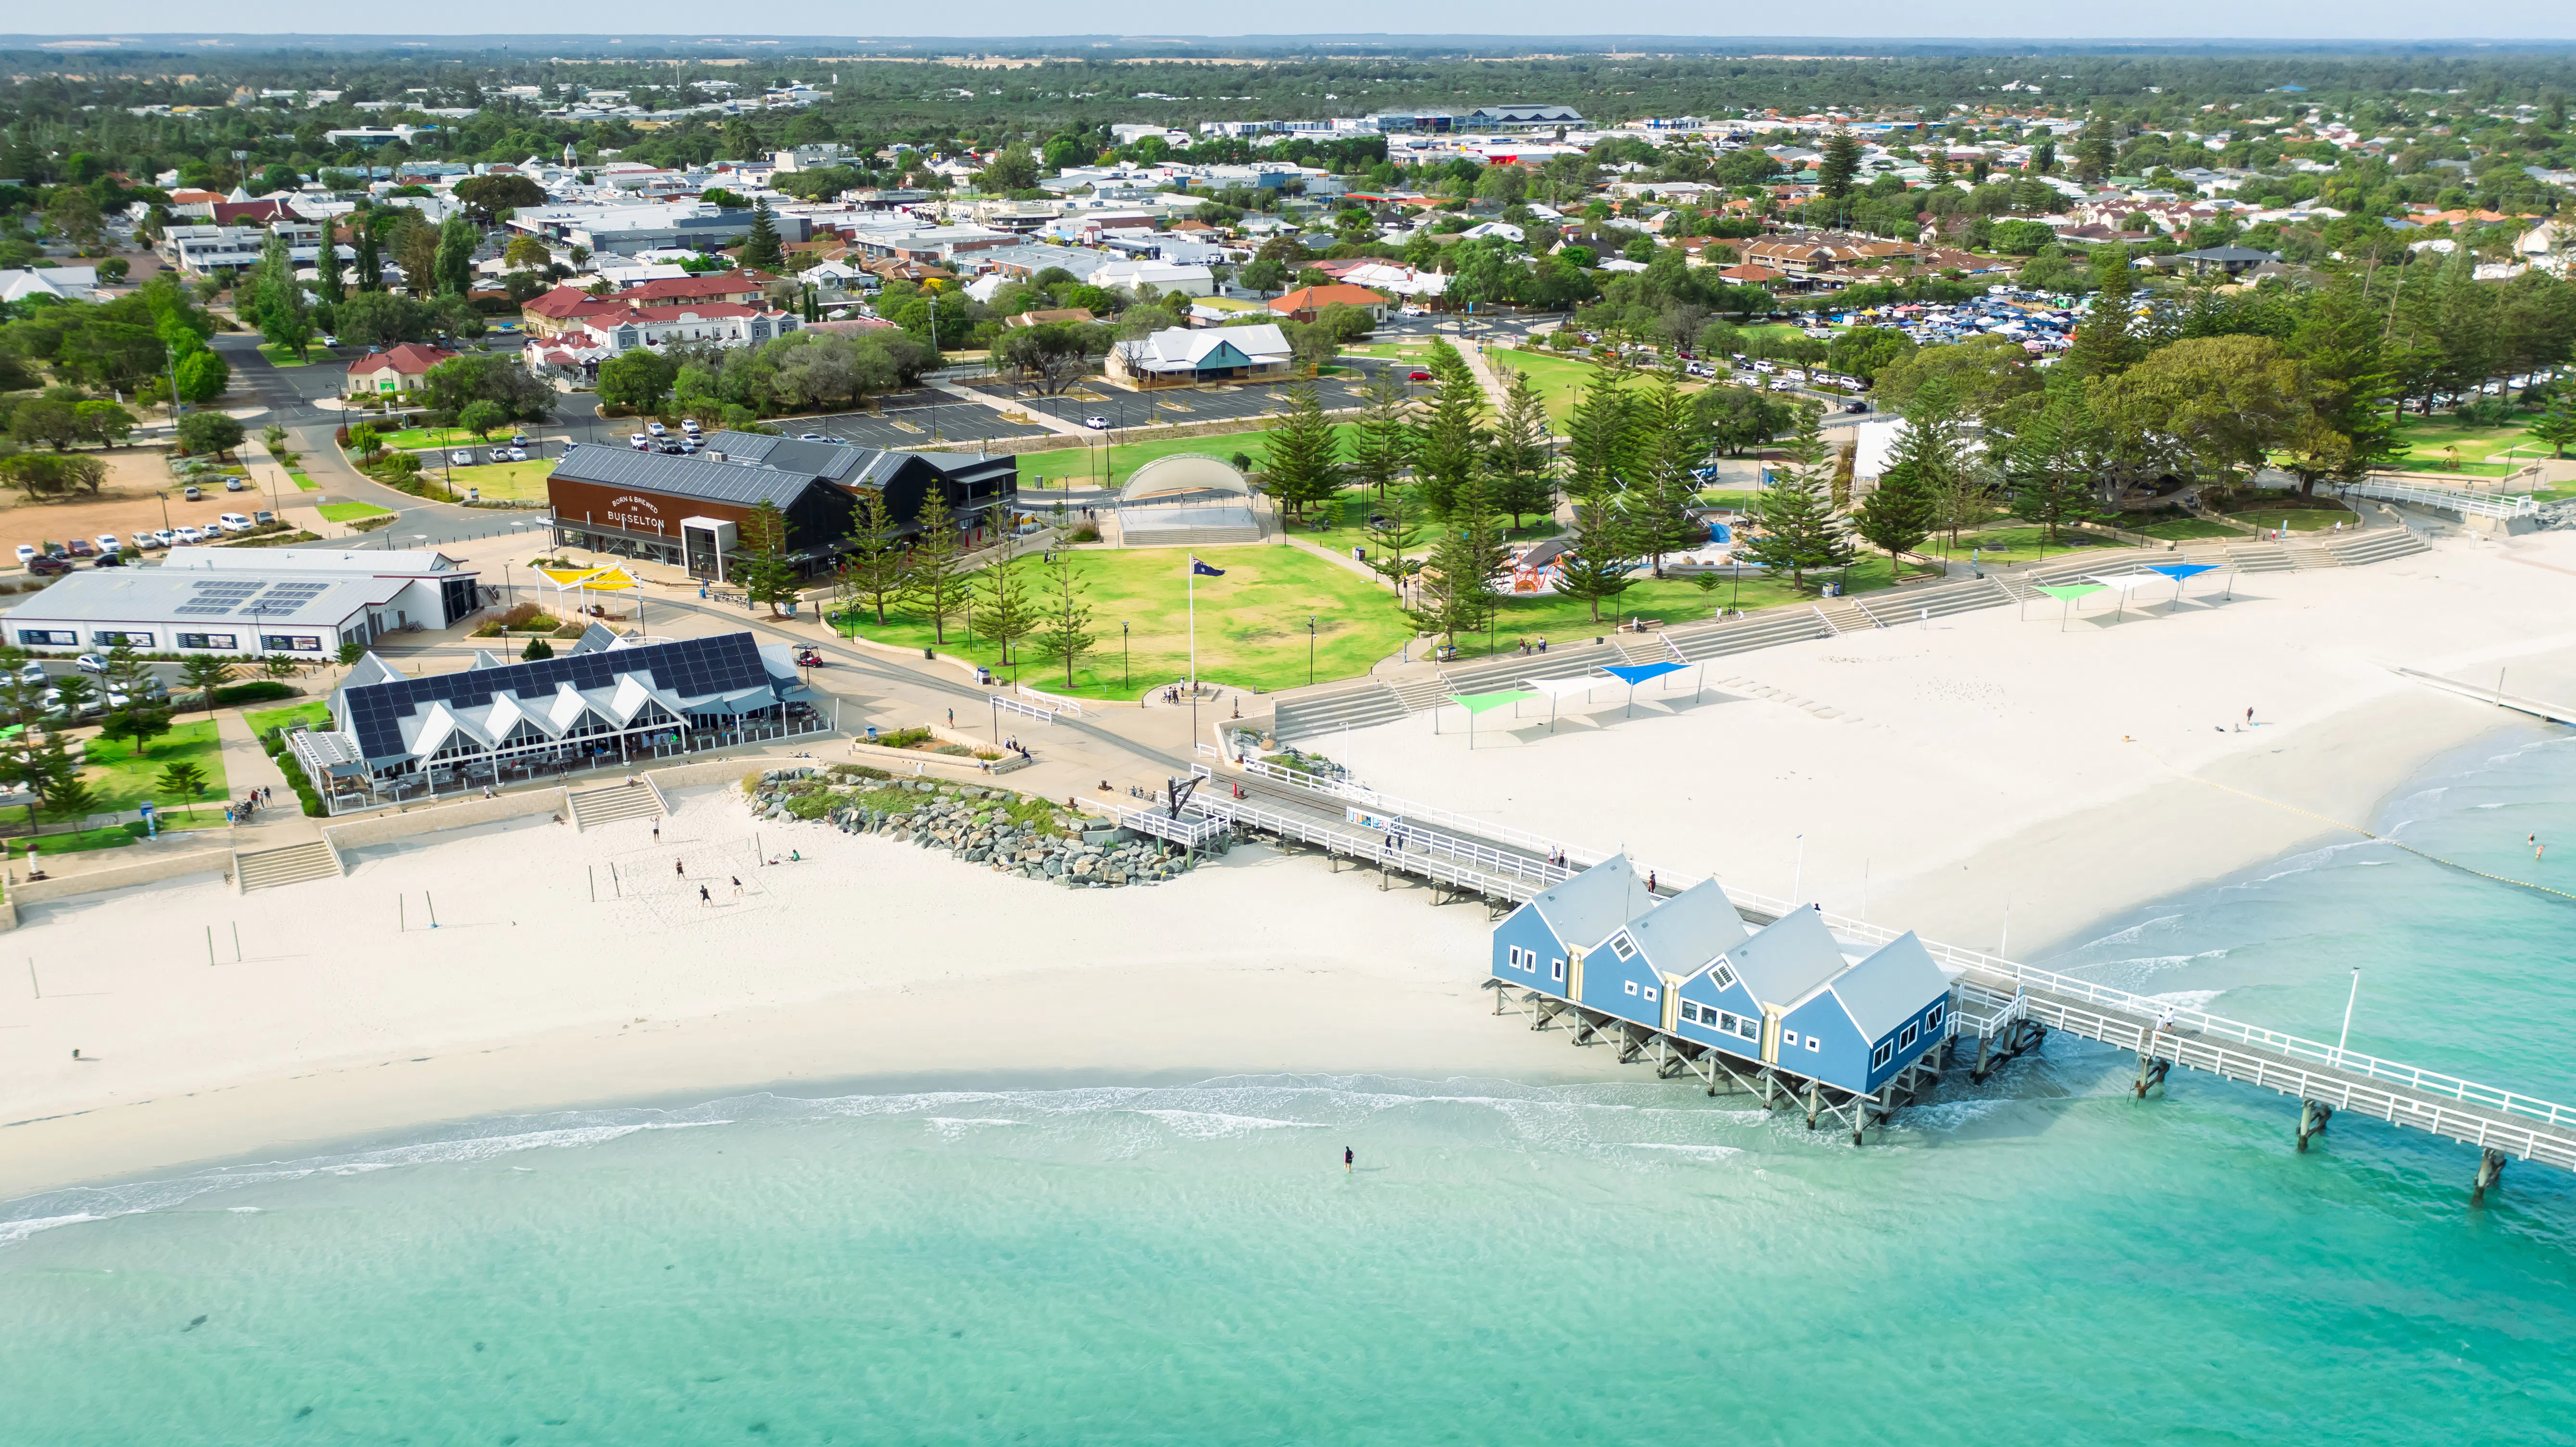
Western Australia's Busselton climbs one place to fifth, generating nearly $110K in annual revenue potential on a mid-pack $423 ADR. This coastal city, located 220 km south of Perth, is famous for its 1.8 km-long jetty — the longest timber-piled jetty in the southern hemisphere. Serving as the gateway to the renowned Margaret River wine region, Busselton attracts visitors with pristine beaches, an underwater observatory, and annual sporting events including the Ironman Western Australia triathlon.
Its dual appeal as both a beach destination and a wine region hub creates year-round demand, and a 3.5% rise in revenue potential came alongside a slight 1.2% contraction in available listings — a tightening market.
6. Byron

- ADR: $483.27
- RevPAR: $268.05
- Annual revenue potential: $109,301
Iconic Byron Bay ranks sixth with $109K in annual revenue potential and Australia's third-highest RevPAR at $268. Located on NSW's far north coast, this former bohemian surfing town has transformed into a stylish coastal destination attracting celebrities, digital nomads, and wellness seekers. Byron's appeal stems from its stunning beaches, laidback atmosphere, thriving food scene, and its retreats and spas.
Byron slipped one place this year, but the drop is misleading: revenue potential actually rose 3.1%. It was overtaken rather than weakened, and available listings contracted 2.5% — a market getting tighter, not softer.
7. Kiama
- ADR: $531.49
- RevPAR: $243.99
- Annual revenue potential: $105,767
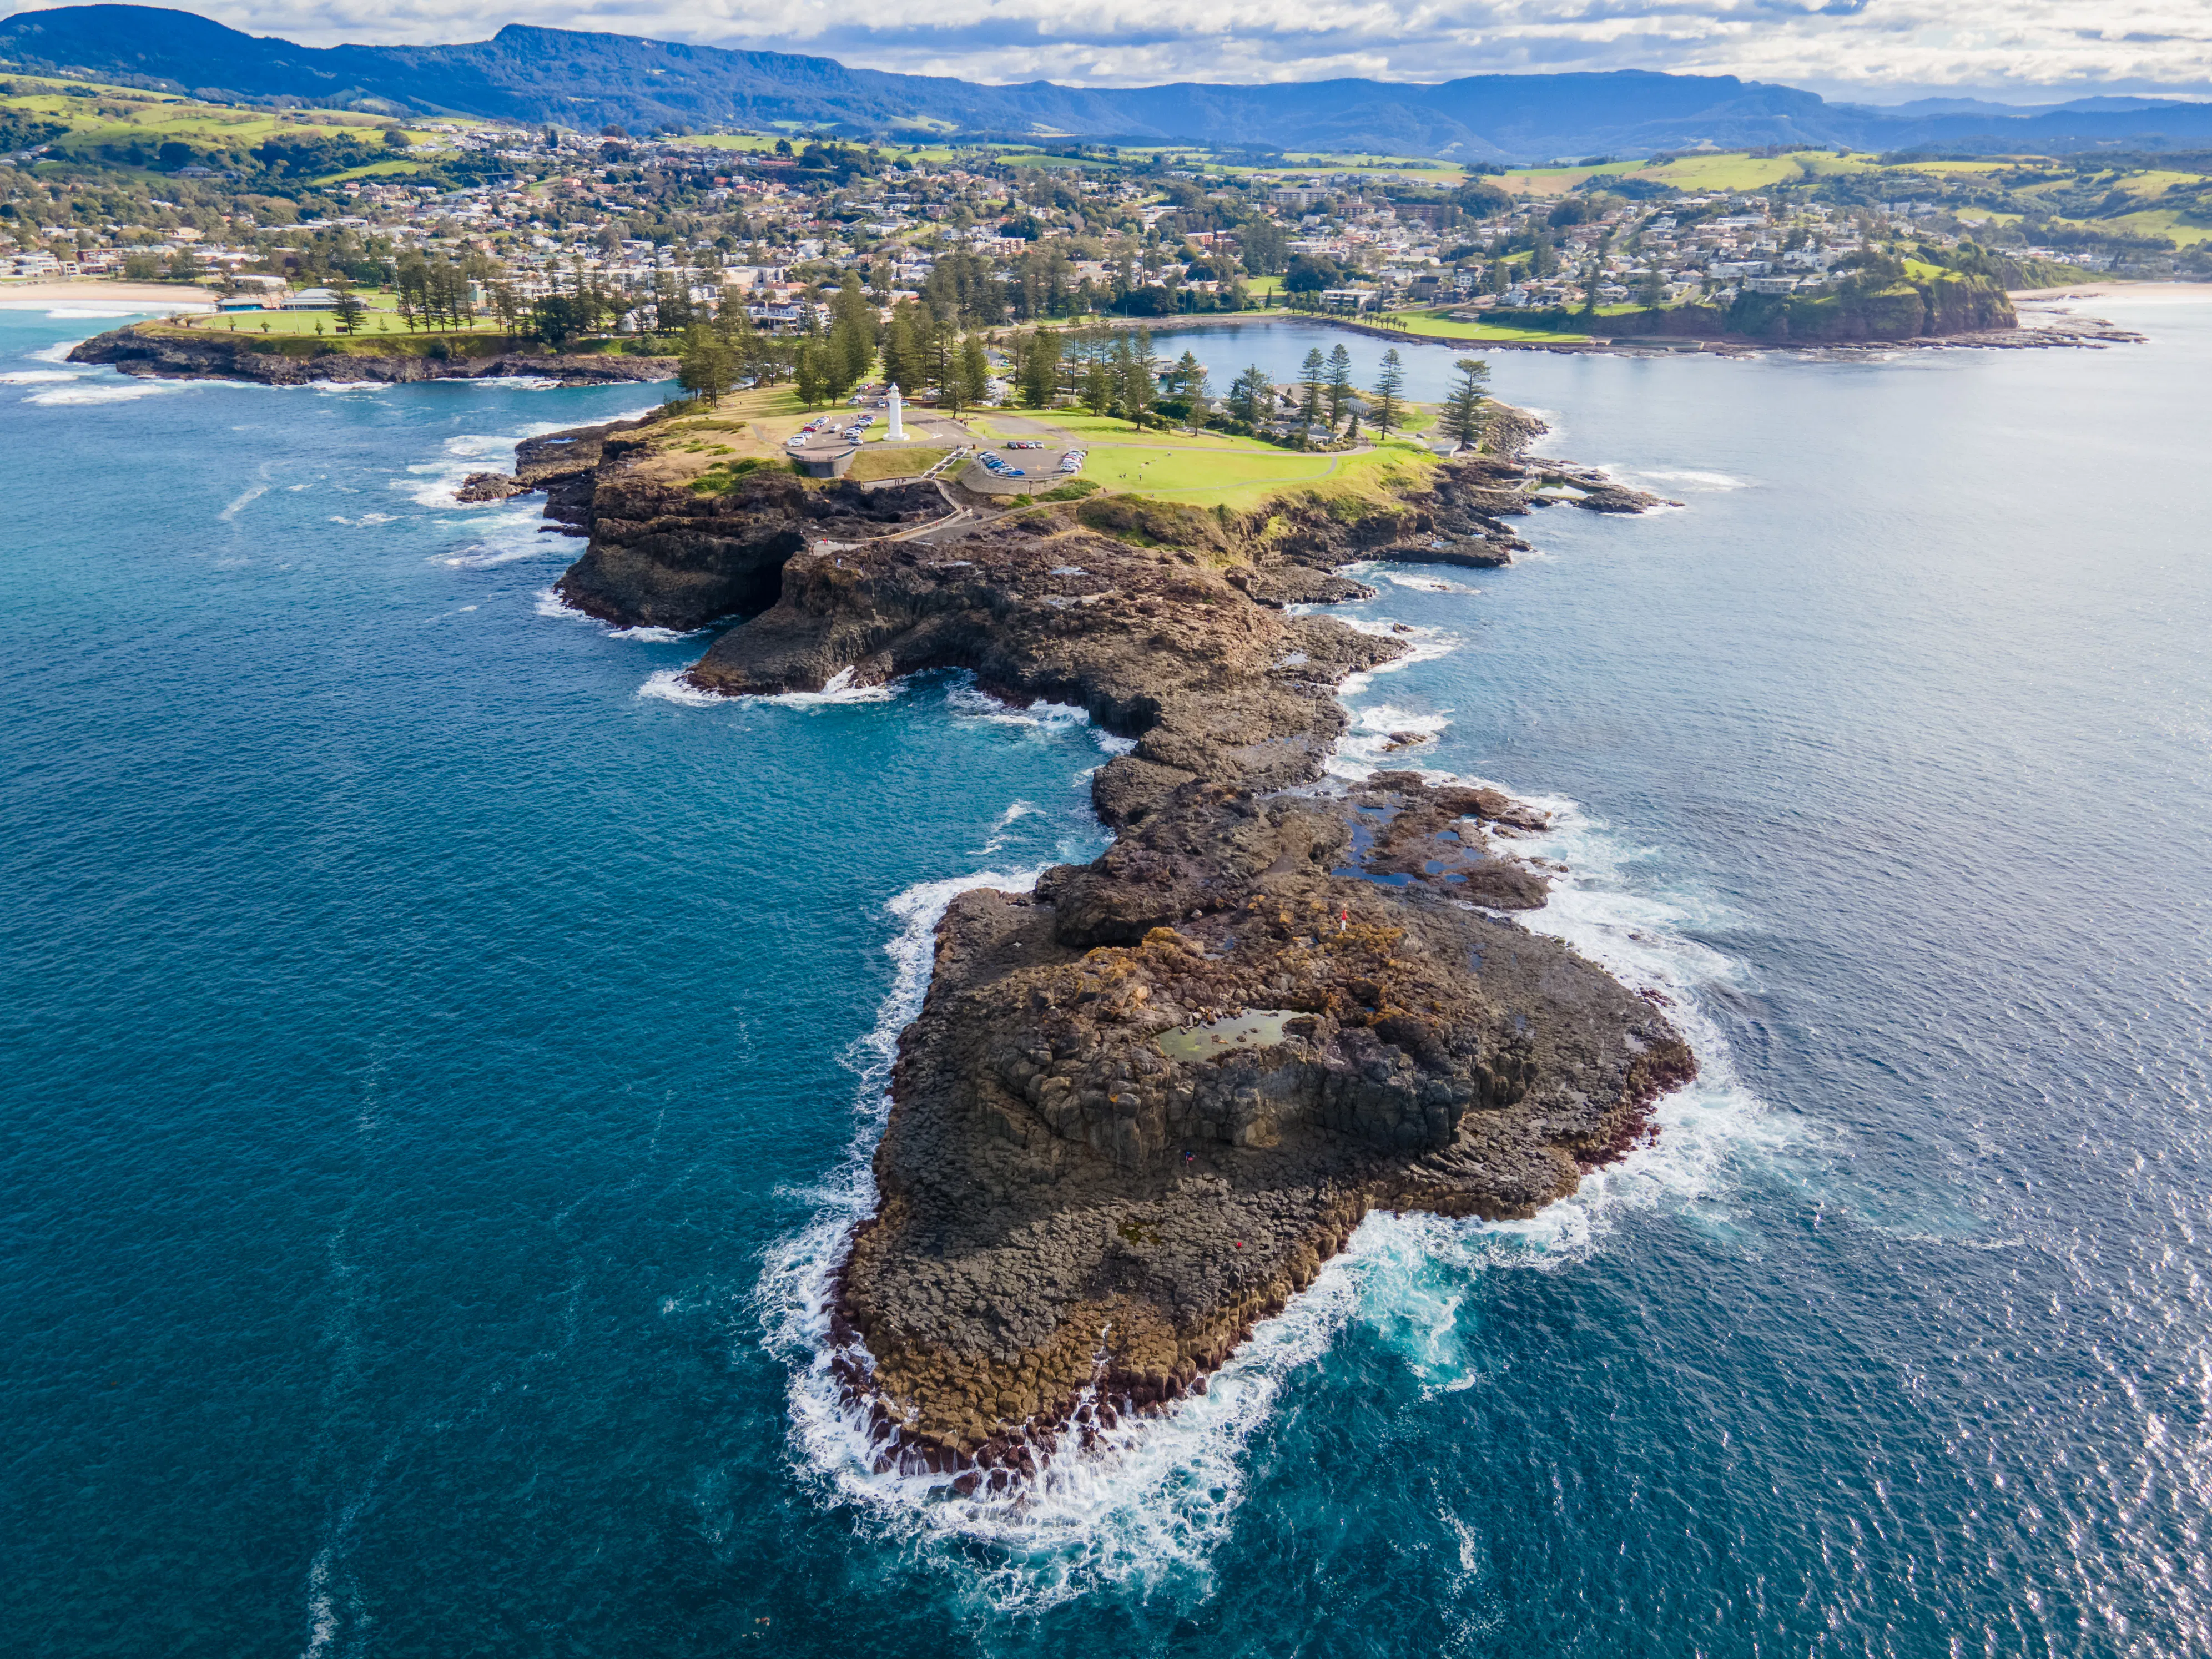
Coastal Kiama rises one place to seventh with nearly $106K in annual revenue potential, supported by Australia's eighth-highest ADR at $531. Located on NSW's South Coast about 120 km from Sydney, this seaside town is famous for its blowhole, where water can spray up to 25 metres high in the right conditions. Kiama draws weekend visitors from Sydney with its beaches, coastal walks, historic buildings, and charming town centre.
Revenue potential rose 6.3%, the strongest gain among the top eight. The trade-off is utilisation: at 45.9% occupancy, Kiama earns its position on rate and weekend intensity rather than steady year-round bookings.
8. Tweed
- ADR: $385.79
- RevPAR: $215.34
- Annual revenue potential: $98,626
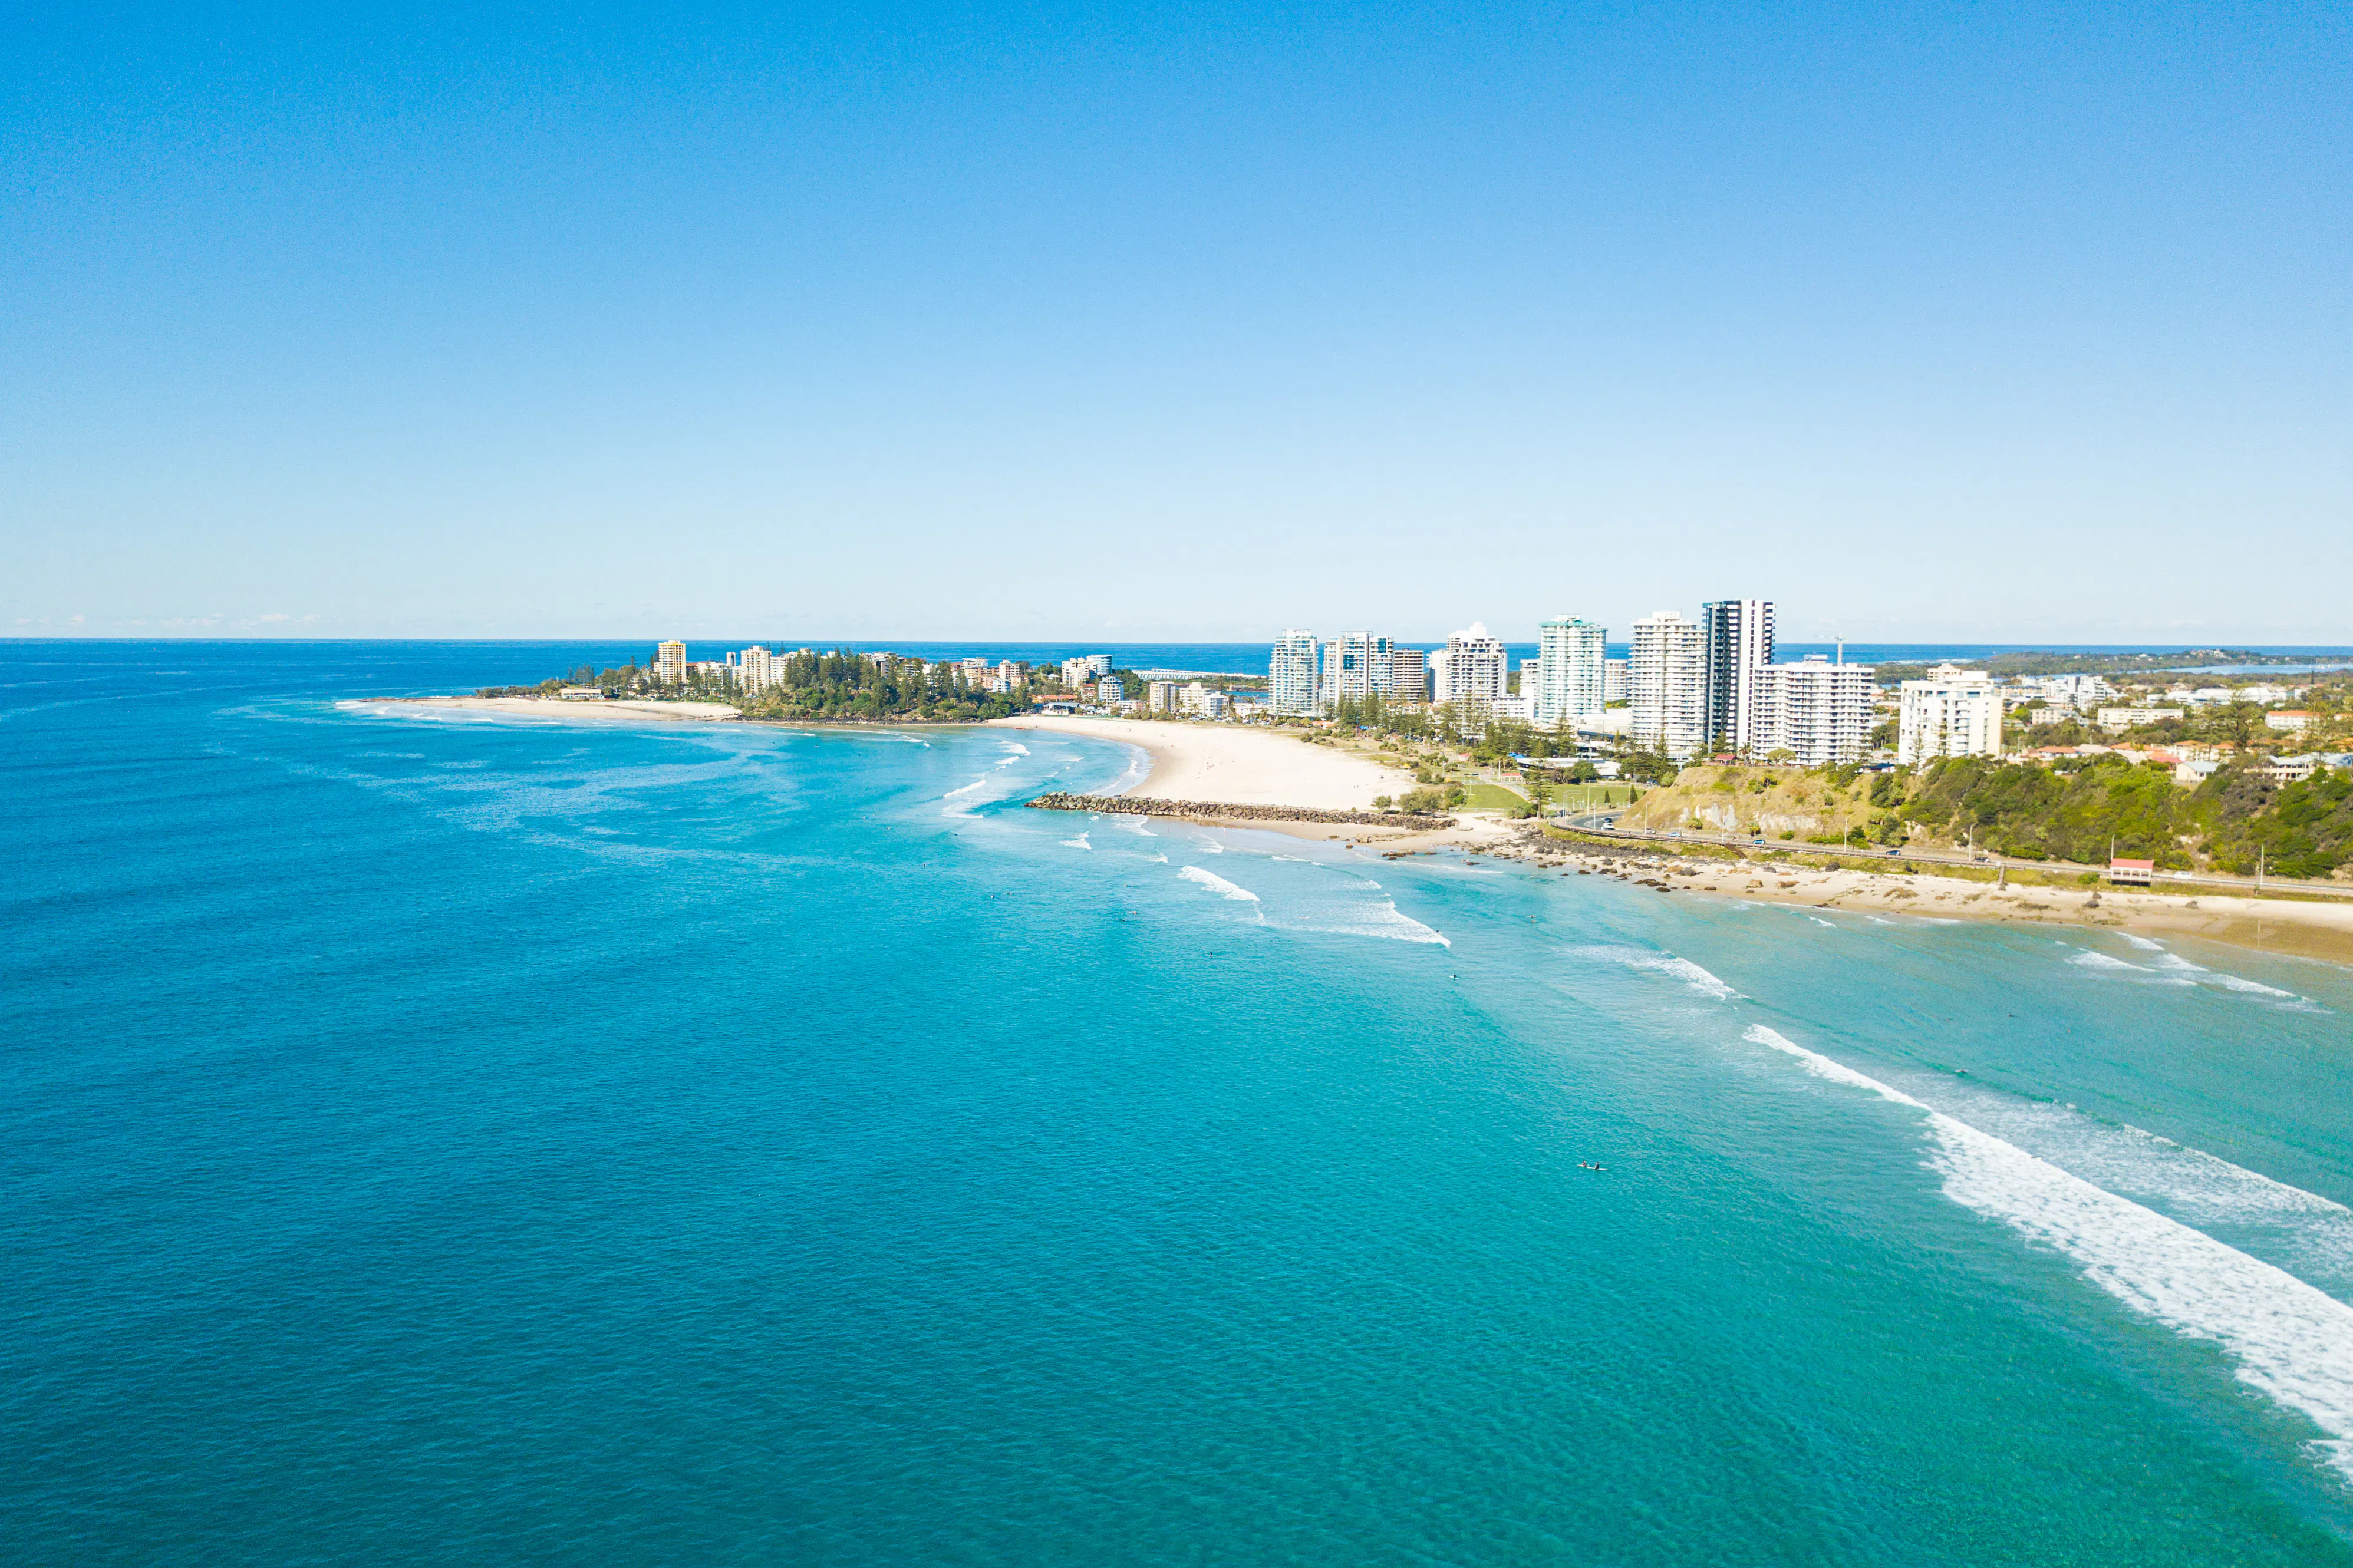
Straddling the NSW/Queensland border, Tweed moves up one place to eighth with nearly $99K in annual revenue potential. This coastal region benefits from its strategic position between the Gold Coast and Byron Bay, offering pristine beaches without the crowds or prices of its more famous neighbours. Tweed attracts visitors seeking a more relaxed coastal experience, with attractions including Mount Warning, the Tweed Regional Gallery, and the Tweed River. Its subtropical climate supports year-round tourism, reflected in an 81 seasonality score.
The gain was slim, however: revenue potential rose just 1.3%, and ADR fell 4.7%. Occupancy of 55.8% carried the result.
9. Shellharbour

- ADR: $402.38
- RevPAR: $218.59
- Annual revenue potential: $98,437
Shellharbour is the biggest riser inside the top 10, jumping ten places from nineteenth to ninth on a 20.2% surge in revenue potential to over $98K.
Just north of Kiama on the NSW South Coast, Shellharbour draws the same Sydney weekend traffic as its better-known neighbour at a lower entry price — an increasingly relevant point as South Coast acquisition costs climb. The move was driven almost entirely by occupancy, which rose from 49.2% to 54.3% on essentially unchanged supply, while ADR slipped 1.6%. With only 250 available listings, this remains a thin market where a handful of new entrants could shift the numbers quickly.
10. Wingecarribee
- ADR: $503.35
- RevPAR: $233.91
- Annual revenue potential: $98,388
Wingecarribee moves up one place into the top 10 for the first time, delivering over $98K in annual revenue potential and Australia's tenth-highest ADR at $503.
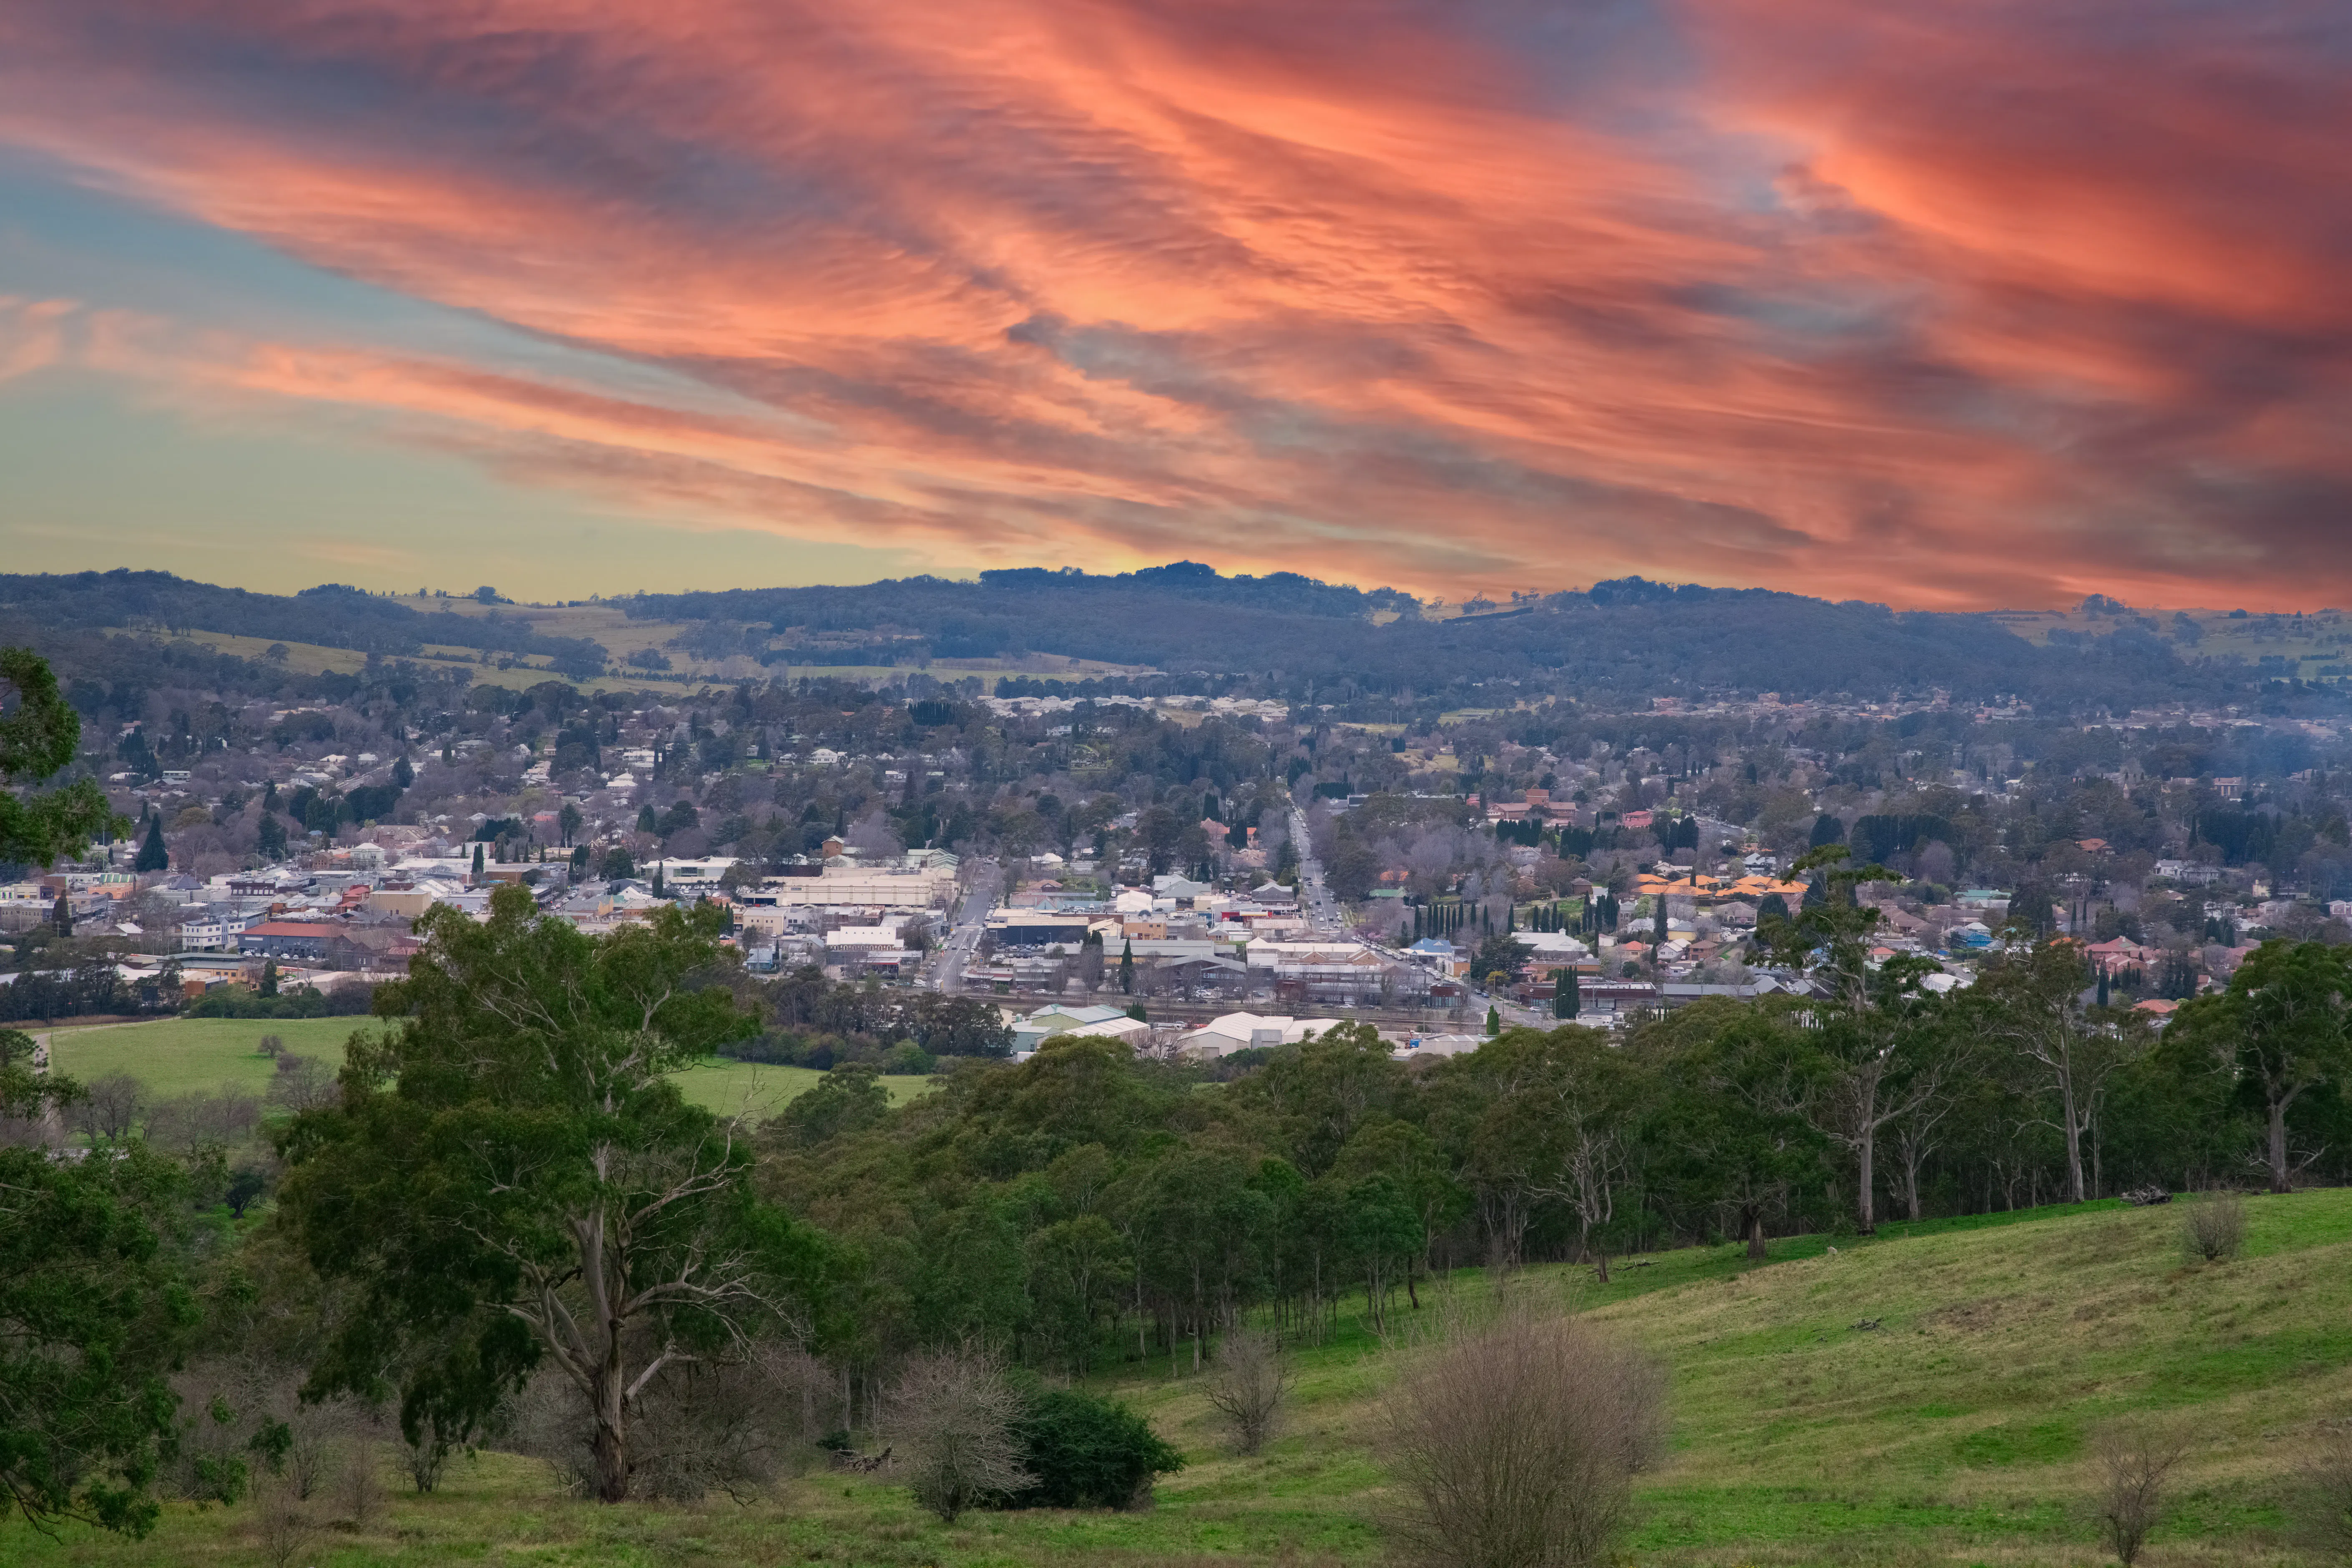
This Southern Highlands region, located 110 km southwest of Sydney, offers an appealing escape featuring historic villages, cool-climate wineries, and garden estates. Bowral, its main town, hosts the annual Tulip Time festival and serves as a base for exploring the area's natural beauty. The region's four distinct seasons create diverse seasonal appeal, and an 89 seasonality score — among the best in the top 20 — confirms demand is genuinely spread across the year. The counterweight is 46.5% occupancy: strong rates, but plenty of empty nights to fill.
11. Cessnock

- ADR: $588.12
- RevPAR: $236.26
- Annual revenue potential: $98,194
Hunter Valley's Cessnock commands Australia's third-highest ADR at $588 and just over $98K in annual revenue potential, up one place on a 4.3% gain.
This wine region hub, located 150 km north of Sydney, serves as the gateway to over 150 wineries and cellar doors. Beyond wine tourism, Cessnock attracts visitors with golf courses, hot air ballooning, and proximity to the Hunter Valley Gardens. Its 89 seasonality score is the second-highest in the top 20, indicating very low seasonality. But read that alongside occupancy of 40.2% — 152nd of 162 markets. Cessnock's demand is evenly spread across the year and thin in every month of it. This is a rate market, and it suits operators confident in premium positioning rather than those chasing high utilisation.
12. Augusta Margaret River

- ADR: $345.05
- RevPAR: $223.32
- Annual revenue potential: $97,144
Western Australia's Augusta Margaret River delivers over $97K in annual revenue potential on a modest $345 ADR — 38th nationally, and a reminder that rate is not the whole picture.
The region anchors one of Australia's premier wine areas, with surf breaks, karri forest and the limestone caves of the Leeuwin-Naturaliste ridge drawing visitors well beyond the cellar-door crowd. At 64.7% occupancy and an 87 seasonality score, it is one of the most consistent performers in the top 20. It slipped two places despite a 2.0% gain, having added 5.4% more available listings — the third-largest supply increase in the group, and enough to spread returns more thinly.
13. Singleton
- ADR: $666.57
- RevPAR: $244.41
- Annual revenue potential: $96,234
Hunter Valley's Singleton holds Australia's highest ADR at $667 — and is the steepest faller in this year's ranking, down six places to thirteenth on $96K in annual revenue potential.
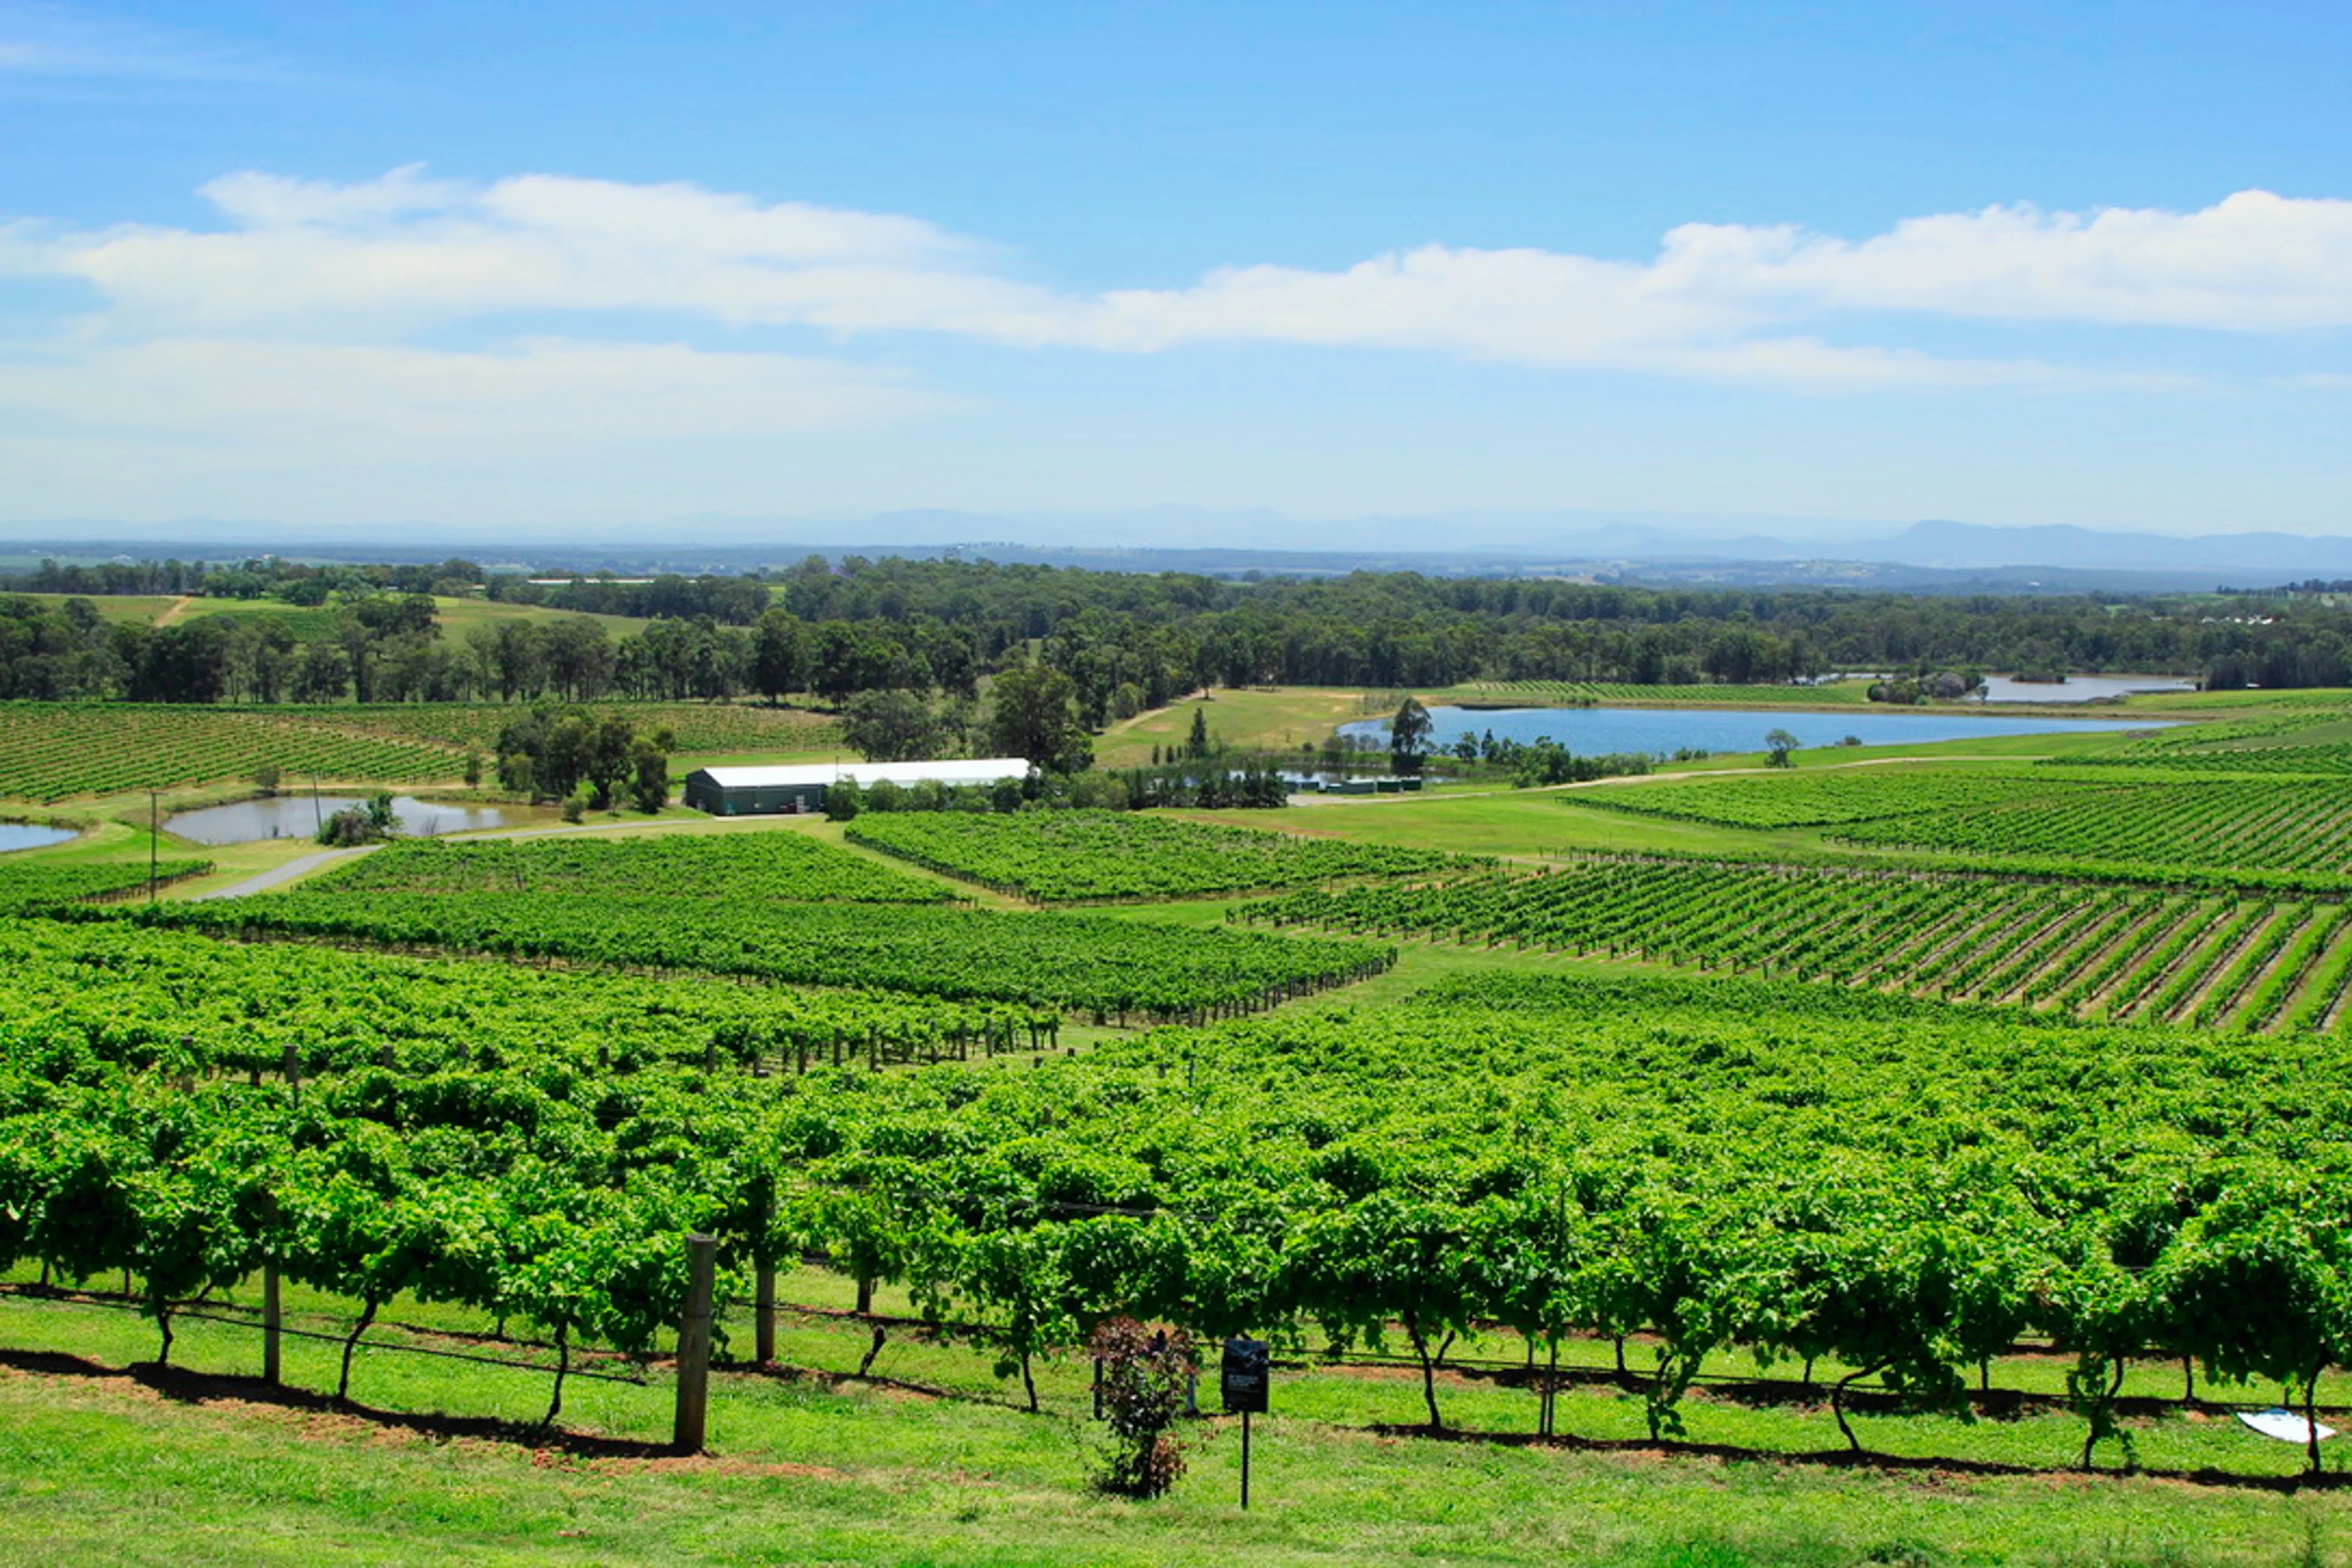
This inland destination, about 200 km north of Sydney, blends wine tourism with mining industry accommodation demand. The region's renowned vineyards attract weekend travellers, while business visitors support midweek occupancy, and its proximity to Barrington Tops National Park adds a third demand driver.
Singleton is the clearest illustration in this list of why ADR alone misleads. At 36.7% occupancy — 160th of the 162 markets we ranked — the country's best nightly rate converts into a mid-table annual result. It was also the only top-20 market with a meaningful decline in revenue potential, down 7.0%, as ADR fell 4.3% while available listings grew 3.6%. More supply chasing a softer rate, in a market that was already struggling to fill nights.
14. Culburra Beach
- ADR: $565.21
- RevPAR: $253.26
- Annual revenue potential: $95,392
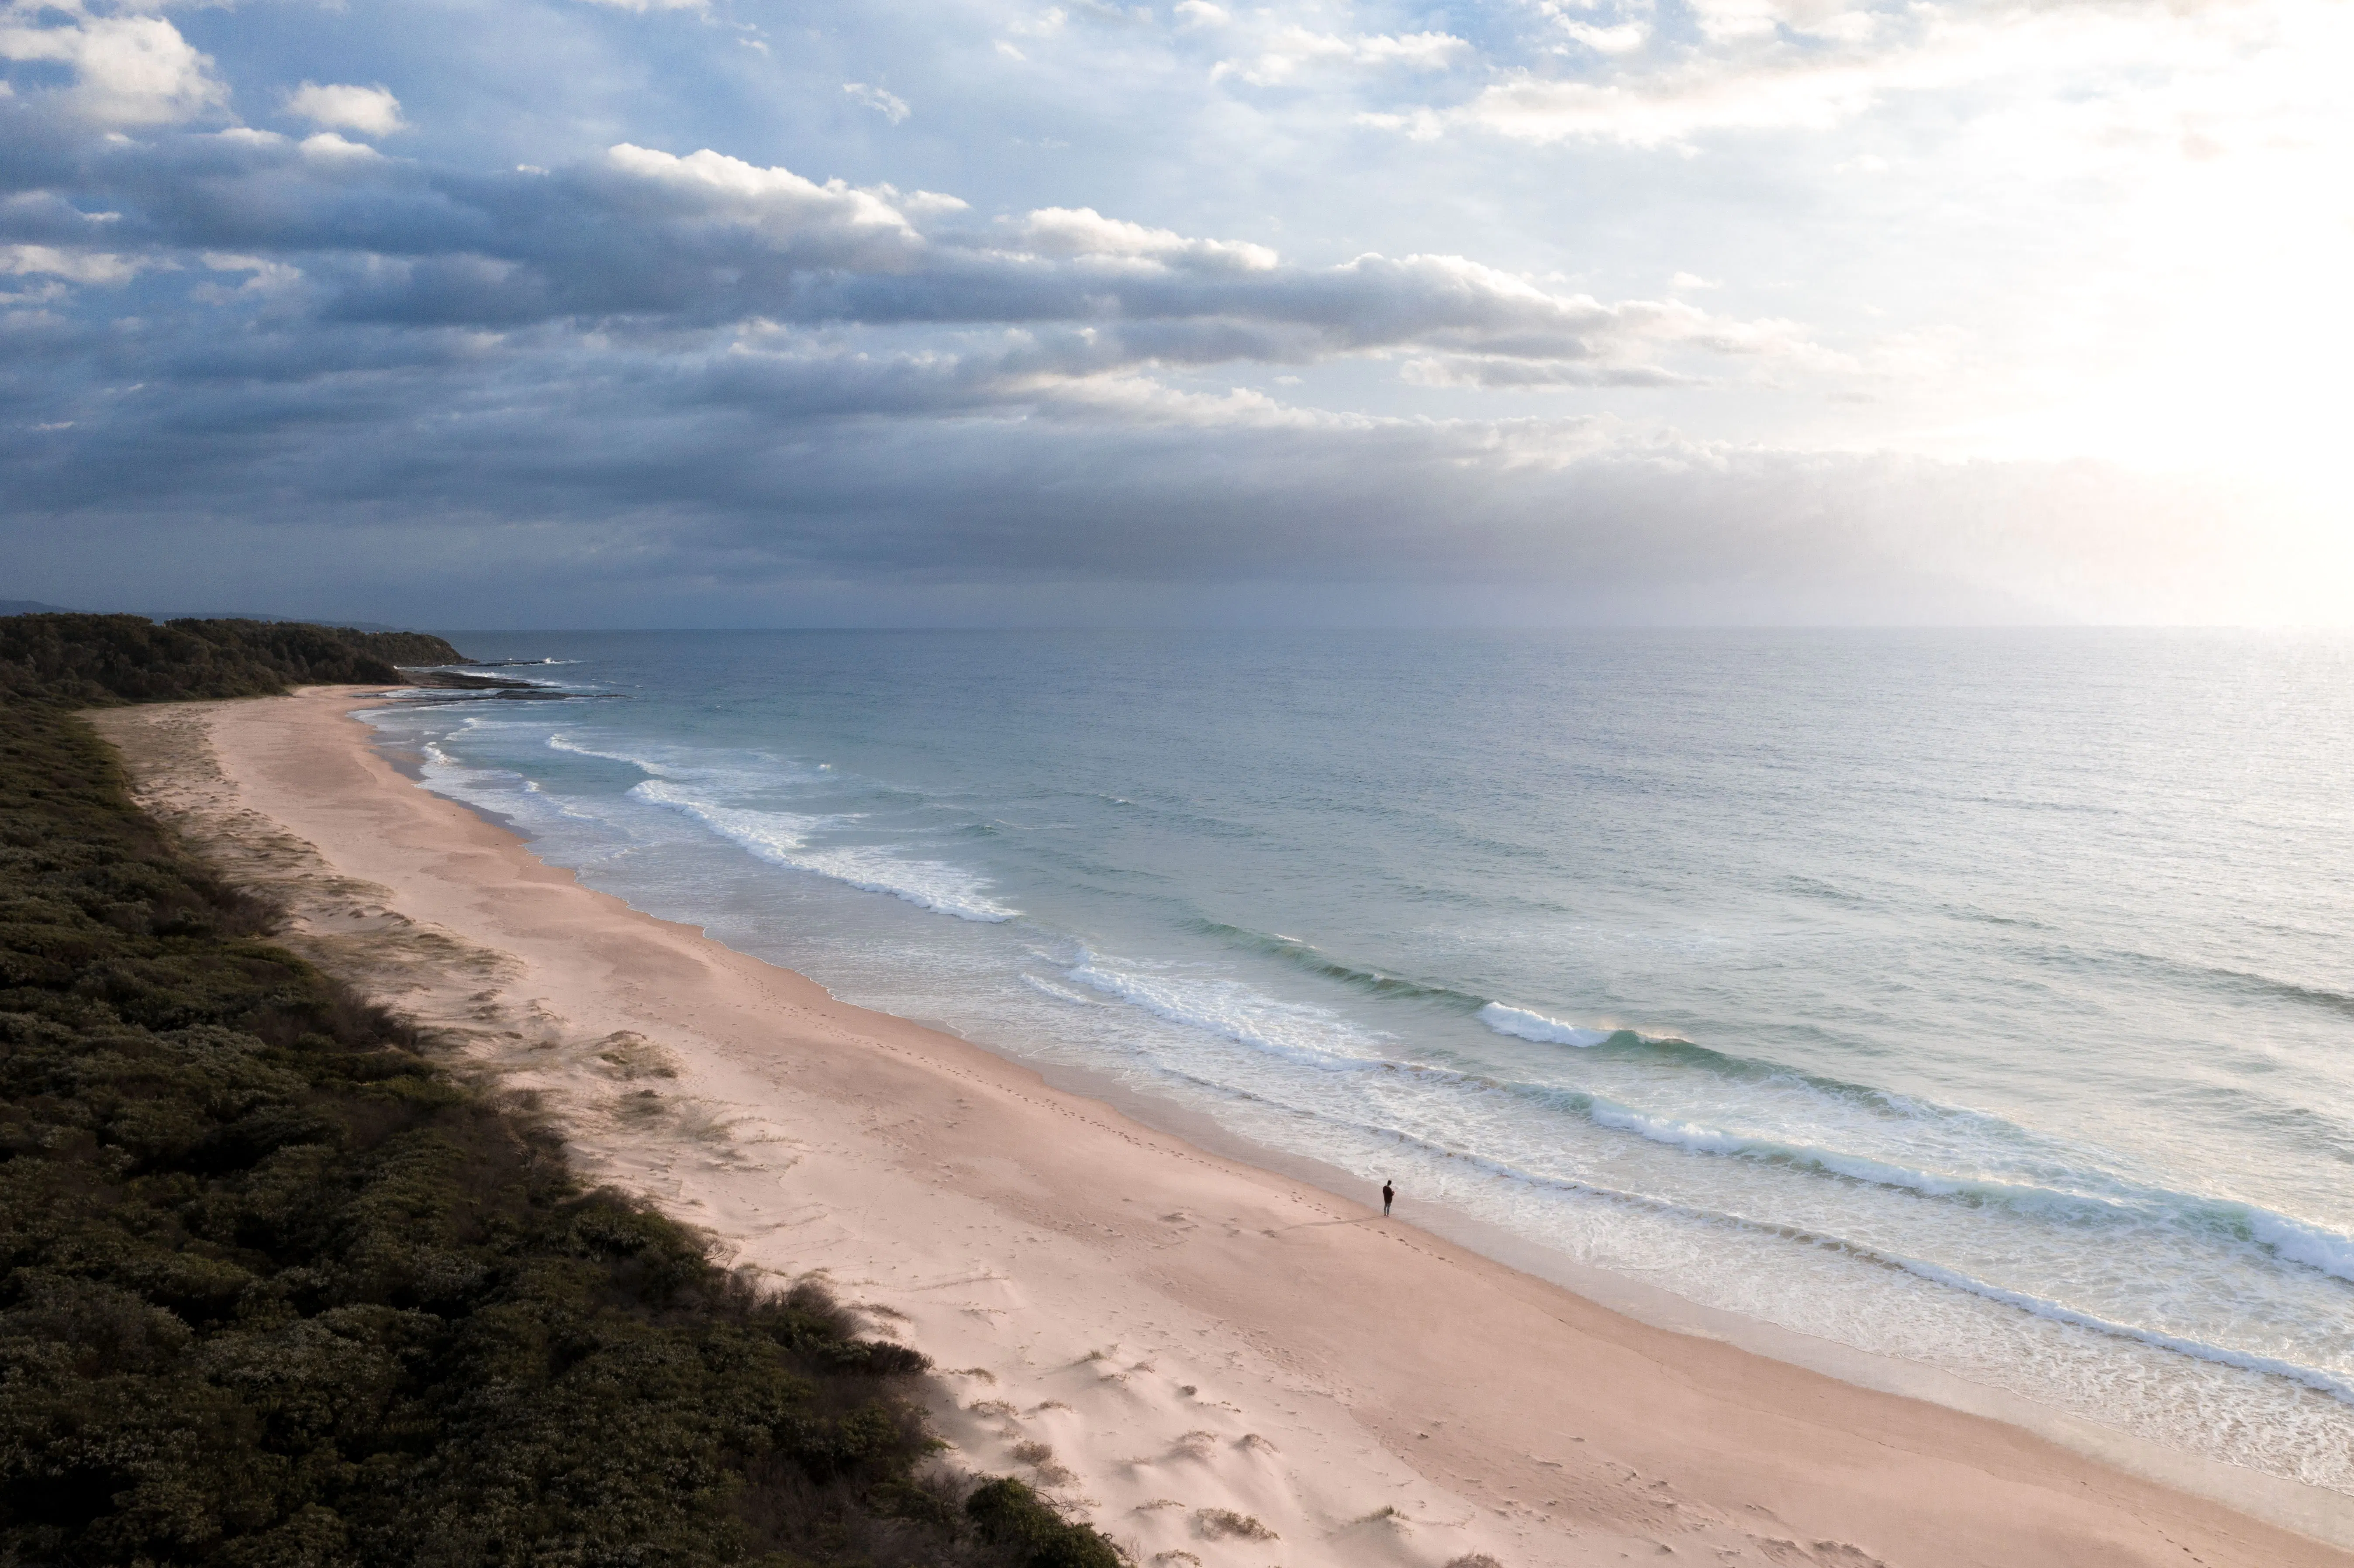
A NSW South Coast village on the Crookhaven River near Jervis Bay, Culburra Beach posts the country's fifth-highest ADR and fourth-highest RevPAR off just 165 available listings — the kind of numbers that only a genuinely supply-constrained market produces.
It climbed two places on a 14.8% rise in revenue potential, driven entirely by occupancy moving from 41.3% to 44.8%; ADR actually fell 5.9%. A 51 seasonality score marks it as one of the more seasonal markets in the top 20, so returns here are concentrated in the summer window.
15. Cairns

- ADR: $291.34
- RevPAR: $194.19
- Annual revenue potential: $90,733
The Far North Queensland gateway to the Great Barrier Reef and the Daintree Rainforest earns its top-20 place on volume and consistency rather than rate. At $291, Cairns' ADR ranks 67th nationally — but 66.7% occupancy is the 14th-highest in Australia, and the market carries 2,125 available listings.
Cairns slipped two places on a solid 3.7% gain, overtaken rather than declining. For investors, it offers something most high-potential markets don't: reliable year-round international and domestic demand at an accessible entry price.
16. Douglas

- ADR: $402.80
- RevPAR: $233.79
- Annual revenue potential: $89,126
Home to Port Douglas and the Mossman Gorge approach to the Daintree, this Queensland shire delivers $89K in annual revenue potential at 58% occupancy.
It dropped two places despite revenue potential rising 4.9%, having added 5.9% more available listings — the second-largest supply increase in the top 20. Its 50 seasonality score is among the most pronounced in the group, concentrating returns in the dry-season peak from roughly May to October.
17. Huskisson

- ADR: $440.65
- RevPAR: $221.66
- Annual revenue potential: $85,199
On the shores of Jervis Bay, known for some of the whitest sand in the country, Huskisson is the smallest market in the top 20 at just 146 available listings.
It slipped two places on a modest 2.5% gain. Its standout characteristic is conversion: Huskisson realises 73.5% of its theoretical revenue potential in actual earnings, the second-highest rate in the top 20 — meaning fewer owner-occupied blocks and seasonal closures than most comparable coastal markets.
18. Port Stephens

- ADR: $503.79
- RevPAR: $213.25
- Annual revenue potential: $84,133
A genuine new entrant, Port Stephens climbs thirteen places from thirty-first to eighteenth on a 13.4% rise in revenue potential.
This NSW coastal council roughly two and a half hours north of Sydney wraps around a large natural harbour, with Nelson Bay as its main centre, dolphin-watching and the Stockton sand dunes among its draws. It was the only market in the top 20 to post a near-double-digit ADR rise, up 9.1% to $504 — the ninth-highest rate in Australia. Occupancy of 42.3% is the constraint holding it back from a higher placing.
19. Darwin
- ADR: $253.45
- RevPAR: $176.42
- Annual revenue potential: $82,551
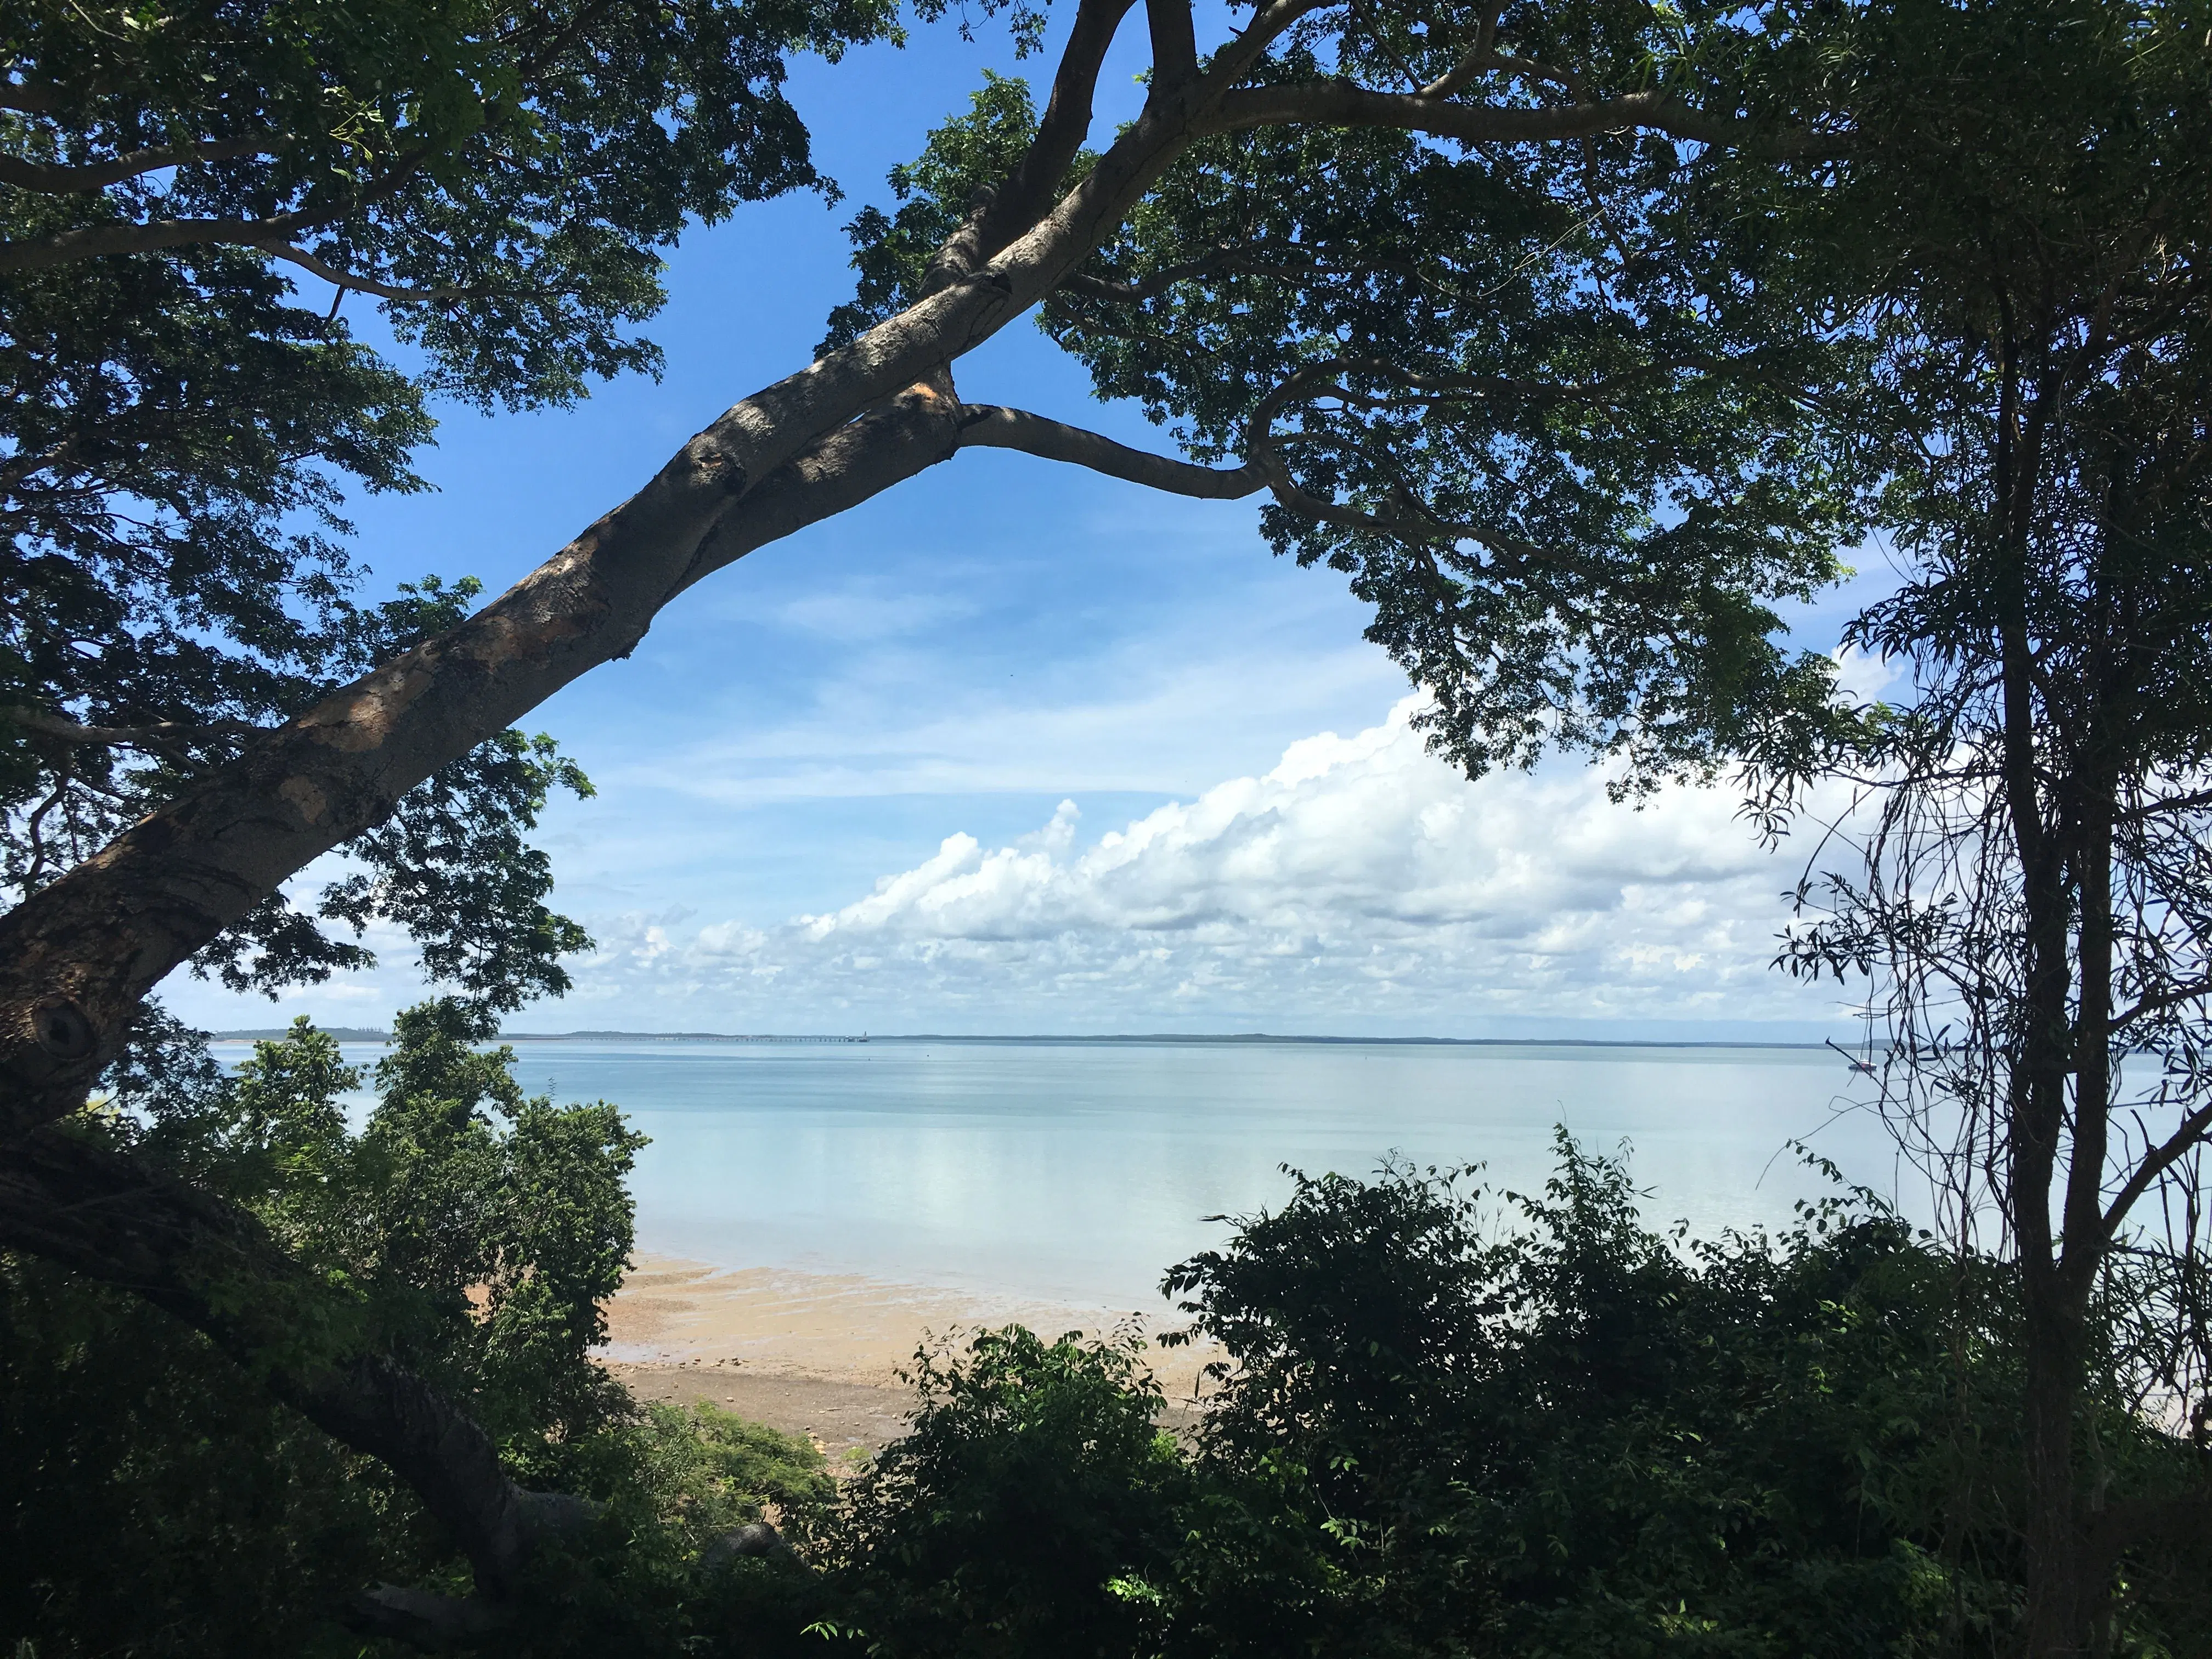
The Northern Territory capital is the biggest mover in the entire ranking, up nineteen places from thirty-eighth, and the sharpest counter-example to ADR-first thinking in this list: a $253 nightly rate, ranking 105th of 162 markets, paired with 69.6% occupancy — the fifth-highest in Australia.
Darwin is also the only top-20 market that isn't a coastal holiday destination, drawing on government, defence, resources and dry-season tourism demand rather than beach traffic.
One note of caution for investors reading the 15.2% jump in revenue potential: available listings fell 8.7% over the year, the steepest contraction in the top 20. When supply shrinks, occupancy rises partly by arithmetic rather than by demand. RevPAR still climbed 9.6% on a 5.4% ADR increase, so there is real rate growth underneath — but Darwin is a tightening market, not an expanding one, and that distinction matters if you're underwriting future supply competition.
20. Newcastle

- ADR: $278.09
- RevPAR: $175.56
- Annual revenue potential: $82,156
NSW's second city rounds out the top 20, up two places on a 5.1% gain, and brings the single most distinctive statistic in this year's list: a 96.8 seasonality score — the highest of any market in the top 20, and near the top nationally.
That means demand is effectively flat across the calendar. Newcastle blends business travel, a large university population, a working harbour and genuinely good beaches, and the result is a market with no dead season. At 63.1% occupancy on a modest $278 ADR, it will never top a rate table — but for cashflow-focused investors who want twelve months of deposits rather than a summer windfall, it is arguably the most attractive market on this page.
What Really Drives Airbnb Profitability in Australia
Just like you wouldn't buy a stock without checking its fundamentals, you shouldn't invest in an Airbnb without scrutinizing the metrics that predict its performance. The difference between an Airbnb investment in Australia that bleeds cash and one that generates wealth comes down to math and metrics.
Occupancy rates
A beautiful beachfront property sitting empty is just an expensive hobby, not an investment. Markets with consistently high occupancy are the foundation for sustainable profitability that amateur investors often overlook while being dazzled by peak season potential.
Average daily rate
Your average daily rate (ADR)—essentially the amount you charge each night—plays a role in your annual profits.
That said, while ADR might seem like the star of the show, it's actually more of a supporting character. Yes, charging $500/night sounds impressive, but if your property sits vacant half the year, you're leaving money on the table. The real magic happens at the intersection of price and demand—finding that sweet spot where your calendar stays full without unnecessarily discounting your property's value.
RevPAR
Revenue per Available Room (RevPAR) tells the complete story that ADR and occupancy only hint at. Think of revPAR as the truth serum of short-term rental markets in Australia—it cuts through the noise and reveals exactly how much revenue each unit generates, making market comparisons crystal clear.
Seasonality
Seasonality isn't the boogeyman most novice investors fear. While amateurs panic about Australian markets with distinct high and low seasons, experienced investors seek markets with diverse demand drivers.
A tourist hotspot that doubles as a business hub can deliver year-round performance—think Gold Coast attracting beach-goers in summer and conference attendees in winter.
Markets with flatter demand curves might not deliver those intoxicating peak-season windfalls, but they'll keep your bank account healthy with consistent monthly deposits while seasonal-only markets sit dormant.

Annual revenue potential
Annual revenue potential stands as the north star metric for Airbnb profitability in Australia. It represents the theoretical maximum a property could earn if booked 365 days per year at market rates—essentially your property's earning ceiling. This figure provides a standardized way to compare markets, similar to how salary ranges help job seekers evaluate different career opportunities.
Unlike ADR or occupancy rates, revenue potential combines pricing power with market demand to provide a comprehensive snapshot of profitability. It's particularly valuable when comparing dissimilar markets like coastal getaways versus urban business hubs, where nightly rates and booking patterns differ dramatically. For investors weighing options across diverse short-term rental markets in Australia, this creates an apples-to-apples comparison that cuts through market-specific noise.
That said, we have to drop a reality check: There’s a gap between potential revenue and actual earnings. For example, Whitsunday tops our rankings with an eye-popping revenue potential of approximately $154K per property. Impressive, until you realize the average Whitsunday property actually earns about $101K a year—roughly 66% of the theoretical ceiling. This gap repeats across profitable Airbnb locations in Australia, where maintenance periods, owner usage, and seasonal closures consistently reduce actual earnings.
Location
When comparing investment opportunities across regions, you'll find that no two markets behave alike.
The performance metrics we discussed above inevitably reveal dramatic regional variations across Australia's vacation rental landscape. Cessnock posts a higher headline ADR than Byron — but that is a reflection of size, not premium: the average Cessnock rental has 3.2 bedrooms against Byron's 2.5. Compare like with like, and Byron commands roughly 20% more per night. Gold Coast's steady demand profile, meanwhile, looks nothing like Exmouth's pronounced seasonality, where occupancy swings from 39% to 89% across the year.
For investors targeting high-demand Airbnb markets in Australia, understanding these distinct regional personalities makes the difference between purchasing a cash-flowing asset and an expensive liability.
So which metrics matter most? All of them—but in the right context and with proper weighting.
Australian Market Summary
Australia's unique geography and diverse climate contribute to a dynamic vacation rental market influenced by seasonality, weather patterns, and holidays. With its vast expanse spanning from the tropical north to the temperate south, the Land Down Under experiences a range of climatic conditions throughout the year, shaping traveler preferences and rental demand.
It’s no surprise that Australia’s high season (roughly December through February) coincides with its summer season. In summertime, Australia truly is the lucky country where visitors can expect spectacular festivals in Melbourne and Sydney, cloudless days on the Sunshine Coast, and vibrant coral blooms on the Great Barrier Reef.
Of course, the high summer season isn’t the only good time to travel. Given the country’s relatively temperate climate, the wintertime still attracts plenty of travelers. In fact, winter sees a spike in popularity for destinations like the Snowy Mountains and Victorian High Country, where snow enthusiasts seek out alpine adventures and cozy mountain retreats.
In addition to seasonal fluctuations, Australian holidays play a significant role in shaping the short-term rental industry. Major holidays such as Christmas, New Year's Eve, Australia Day (January 26), Easter, and school holidays drive peak travel periods and heightened demand for accommodation. Coastal regions and popular tourist destinations experience a surge in bookings during these times, as families and holidaymakers embark on vacations and weekend getaways.
What to Consider When Choosing a Profitable Airbnb Location in Australia
The data clearly shows which Australian cities for Airbnb deliver the strongest raw numbers, but it’s worth looking beyond headline figures to evaluate long-term viability. Before committing capital to any Airbnb investment in Australia, consider market research, your personal investment strategy, and local regulations.
Market research
Your gut might tell you a beachfront investment property is a no-brainer, but the data frequently tells a different story. Dig beyond the surface-level revenue figures we've highlighted to uncover other key factors, like:
- Occupancy patterns throughout the year, not just averages
- Weekend vs. weekday performance differentials
- Seasonality’s impact on pricing and booking windows
- Local events that drive demand spikes
- Supply growth trends and new development pipelines
- Guest demographics and their corresponding amenity preferences
AirDNA's market intelligence tools reveal these insights with surgical precision, spotlighting opportunities that casual observation misses. A market with modest nightly rates but consistent bookings often fills your bank account faster than glamorous destinations with high ADRs and lengthy vacancy periods.
The best investors take their market research one step further by benchmarking their target market against comparable destinations. This competitive perspective exposes both hidden advantages and lurking risks that single-market analysis can't capture.
Investment strategy
Your personal investment goals should dictate market selection rather than headlines about the "hottest" areas. Potential rental returns across Australia vary dramatically by location, each suited to different investment goals:
- For cashflow-focused investors, stable year-round markets like Gold Coast may serve you better than highly seasonal destinations with dramatic revenue swings.
- Investors with diversified portfolios might willingly accept off-season vacancies in exchange for extraordinary peak-season returns in markets like Exmouth.
Similarly, your management approach influences location viability.
- Self-managers generally succeed in markets within driving distance of their primary residence.
- Investors who rely on professional property management should target areas with an established vacation rental infrastructure and multiple competing management companies to ensure service quality and reasonable fees.
The scale of your ambitions also matters. Single-property investors face different considerations than those building a portfolio. Markets with higher barriers to entry often reward larger operators who can achieve economies of scale across multiple units, while smaller investors might find better opportunities in emerging areas with lower acquisition costs and less competition.
Lastly, local regulations directly impact the viability of a short-term rental business in your area
Why Should You Invest in Airbnb Properties in Australia?
Demand is growing
Analyzing short-term rental data, demand has already rebounded from pre-pandemic levels. In 2019, demand was approximately 20 million nights. By 2025, it increased by 26.6% to 25.3 million nights, and TTM data as of July 2026 shows a 27.2% rise compared to 2019.
Travelers want alternative accommodations
Another primary reason to consider investing in Airbnb properties in Australia is the strong and growing demand for alternative accommodations. As travelers increasingly seek unique and immersive experiences, the traditional hotel model is being disrupted by the rise of vacation rentals.
Airbnb offers something for every type of traveler, whether guests want to rent entire houses or just private rooms on a budget. Plus, Airbnb gives travelers the chance to stay in local neighborhoods, enjoy personalized accommodation experiences, and live like a local, fostering a sense of authenticity and connection that traditional accommodations often lack.

Top Booking Platforms for Australian Airbnbs
In Australia's booming vacation rental market, Airbnb, Booking and Vrbo stand out as the booking platform favorites among Australian Airbnb hosts.
Historically, Airbnb has led the pack in Australia, but its lead has narrowed considerably, and the picture is now genuinely three-platform. On a trailing-twelve-month basis, 47% of Australian STRs are listed exclusively on Airbnb. Vrbo-only listings sit at roughly 3%, and Booking.com exclusive listings now account for about 4% of listings on its own. Cross-listing has become the norm rather than the exception: 46% of Australian listings now appear on two or three platforms, including 22% listed on all three (Airbnb, Vrbo and Booking.com), 16% cross-listed on Airbnb and Vrbo, and 7% on Airbnb and Booking.com.
Where Airbnb Guests Are Traveling From
In Australia, the majority of Airbnb guests are domestic locals—but the country sees plenty of international Airbnb guests, too. Between July 2025 and June 2026, just under three-quarters (73.4%) of reviews on Airbnb in Australia were written by domestic travelers. Other major origins for travelers included the United Kingdom (5.9%), the United States (4.5%), New Zealand (2.7%), Singapore (2.0%), and Canada (1.2%).

Are you ready to tap into Australia’s growing short-term rental market? Let AirDNA help you find the right property for your vacation rental business.
FAQs
Does Airbnb exist in Australia?
Absolutely—Airbnb has a strong presence in Australia, spanning major metropolises and remote locales alike. Its user-friendly platform allows hosts to list everything from vineyards and beachside bungalows to urban apartments and outback cabins. With increasing domestic travel and a resilient tourism sector, Australians have embraced Airbnb’s short-term rental model. Many hosts across the country use Airbnb to supplement their income or invest in a dedicated STR business.
What is the Australian version of Airbnb?
Stayz is widely regarded as the Australian equivalent to Airbnb, specializing in traditional holiday homes for Aussie families. Established in 2001, it became a local favorite long before the rise of modern short-term rental platforms. Now part of Expedia Group, it shares similarities with Vrbo, which also focuses on entire-home listings. Hosts who prefer local travelers often find success on Stayz due to its deep roots in the Australian market. Many property owners list on both Airbnb and Stayz to boost their overall visibility.
What metrics should I use to evaluate Airbnb profitability in Australian cities?
Focus on RevPAR (revenue per available room) rather than just ADR, as it accounts for both pricing and occupancy. Annual revenue potential provides the clearest picture of earning capacity, but remember to factor in seasonality, operating expenses, and regulatory constraints that might limit available rental days.
How can I use AirDNA’s data to identify profitable Airbnb markets in Australia?
AirDNA's comprehensive analytics help you look beyond surface metrics to examine factors including occupancy patterns, seasonality, demand trends, and competitive supply growth. Use these insights to identify markets with the optimal balance of pricing power and booking frequency that aligns with your investment strategy.
ARTICLE SUMMARY
Discover Australia's most lucrative Airbnb investment locations and learn which metrics you should analyze to maximize returns in Australia's booming short-term rental market.
Camilo Schmid Rivas
Senior Research Analyst
Camilo Schmid Rivas is a Senior Research Analyst at AirDNA who brings a uniquely well-rounded perspective to short-term rental analytics. With a background that spans investment, real estate, and business analysis—including roles at Stayery and Sollers Consulting—Camilo has worn many analyst hats, each sharpening his ability to turn complex data into clear, actionable insights. A graduate of École hôtelière de Lausanne, he now channels his multidisciplinary expertise into uncovering trends that drive smarter STR decisions. In his free time, he enjoys playing tennis or scuba diving in or around Barcelona.
