U.S. Market Review: STR Summer Is Bright So Far with June Occupancy Above 2019 Levels
Published: July 16, 2024
Last updated: February 26, 2025

Bram Gallagher
Key Takeaways
- June 2024 saw a 9.8% increase in demand for short-term rentals, with occupancy levels surpassing pre-pandemic 2019 levels for the first time this year.
- Anticipated interest rate cuts from the Fed, slowing inflation, and a softening labor market are expected to stabilize and support the STR market.
- While urban areas face supply declines, small city, rural, and coastal locations are experiencing strong growth in both supply and demand.
With June behind us, the summer travel season is off to a brighter start than in 2023. Demand has increased by 9.8%, and occupancy levels have exceeded pre-pandemic 2019 levels for the first time this year.
AirDNA has long predicted that 2024 would mark a new growth period for unit-level performance. However, the first few months of the year had ups and downs due to calendar shifts and bad weather, making it hard to confirm this trend.
Now, with strong performances in May and June, the U.S. short-term rental (STR) market is much more clearly on the rise. Supply growth is slowing down from the breakneck pace of 2022 and 2023, while demand is showing steady growth.
Employment and Inflation
The long-anticipated interest rate cuts from the Fed seem likely to arrive in September. Recent economic reports show that inflation continues to slow while the labor market softens. In June, the Consumer Price Index (CPI), a widely referenced, key measure of inflation, declined by 0.1% month-on-month. This was the first monthly decline since the immediate aftermath of the COVID-19 outbreak. Annual inflation also dropped from 3.3% year-over-year (YOY) in May to 3.0% in June.
The unemployment rate increased for the fourth consecutive month, reaching 4.1%. This rise has not been accompanied by any significant changes in labor force participation, which is the proportion of the population that is employed or actively looking for work. This suggests that the higher unemployment rate is due to employer responses to the economy rather than changes in the workforce.
While the Fed uses high interest rates to reduce economic activity and inflation, keeping rates too high for too long can harm the labor market. Although a 4.1% unemployment rate is not historically high or alarming by itself, the increasing trend indicates that the rate hikes are having the expected effect.
Recent remarks from the Fed acknowledged these risks alongside inflation, and financial markets are betting on rate cuts in September. If timed correctly, the lower rates should stabilize labor markets while allowing inflation to continue decreasing, achieving the "soft landing" often mentioned in the press. Still, it’s natural to feel some anxiety as we navigate this economic adjustment.
Federal Reserve interest rates significantly impact mortgage rates. When the Fed raises interest rates, borrowing costs increase, making mortgages more expensive. This higher cost discourages potential investors from purchasing new properties, leading to a slowdown in the supply of short-term rentals (STRs).
This is one of the main reasons we believe the supply in the STR market has slowed since its peak in 2022. For current operators, the good news is that the decline in interest rates will be slower than the previous rapid increase in rates. New investors will still face challenges in the coming year and we expect weak supply growth to persist.
At a Glance: Key U.S. STR Performance Metrics for June 2024
- Revenue per Available Rental (RevPAR) increased 1.2% year-over-year (YOY) to $203.05
- Available listings were 1.68 million, up 5.7% YOY
- Total demand (nights) rose 9.8% YOY
- Occupancy was 2.2% higher YOY at 63.7%
- Average Daily Rates (ADR) decreased 1.1% YOY to $318.65
- Repeat Rent Index (RRI) increased by 0.7% YOY
- Nights booked increased by 6.9% YOY

Available Listings Decline for the First Time Since the Pandemic
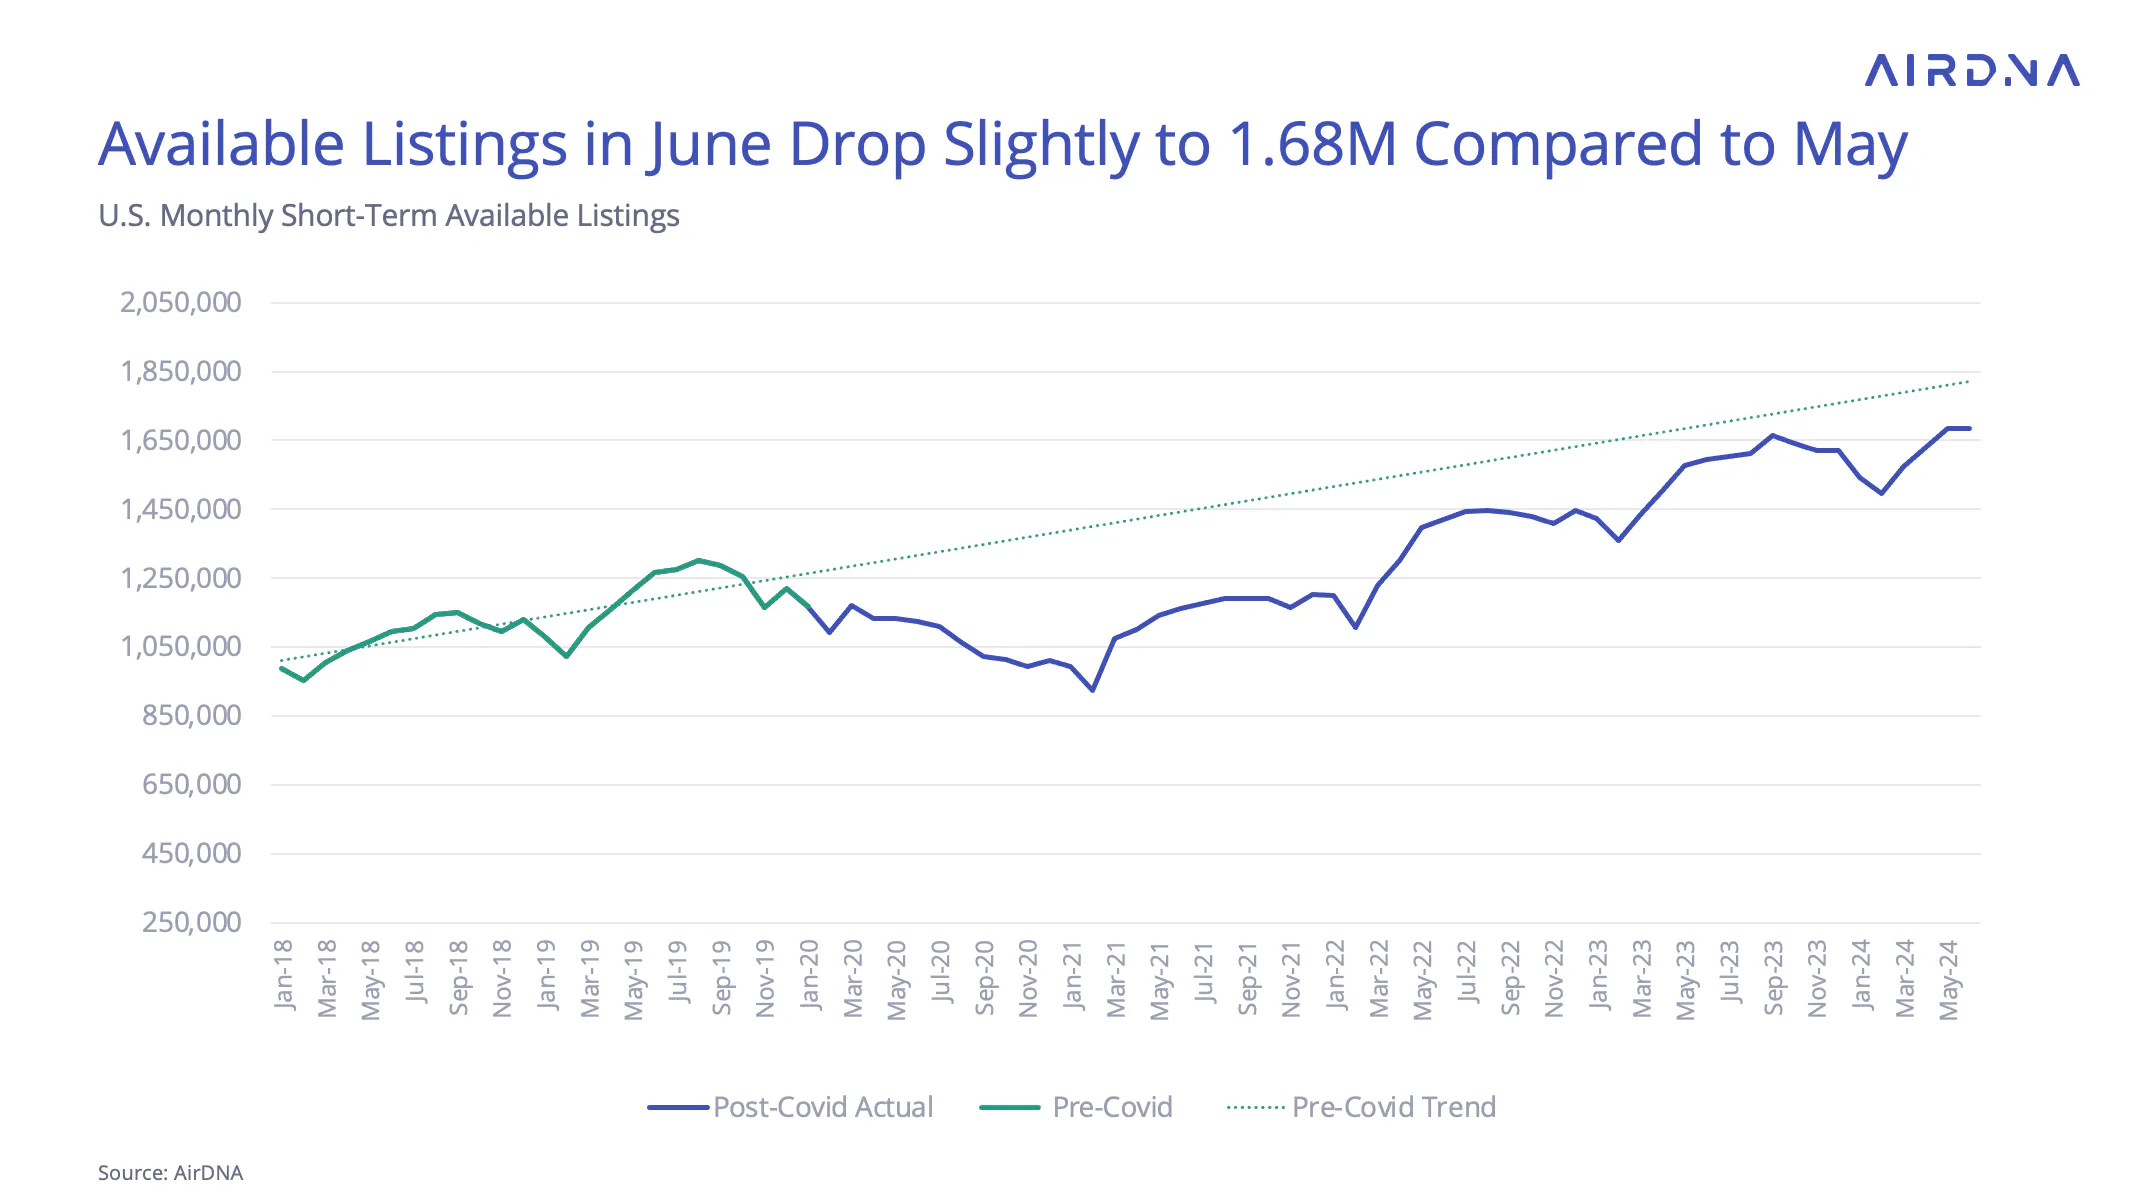
The available listings for June provided more evidence of slowing supply. In May, available listings reached their previous peak, although a month later than usual. However, listings declined from 1.69 million in May to 1.68 million in June. This is the first decline since the pandemic outbreak, making May's total the all-time high.
A look at the chart of available listings shows that over the past three years, the gap between actual listings and the pre-COVID trend has been closing. However, this year, the gap has started to widen again.
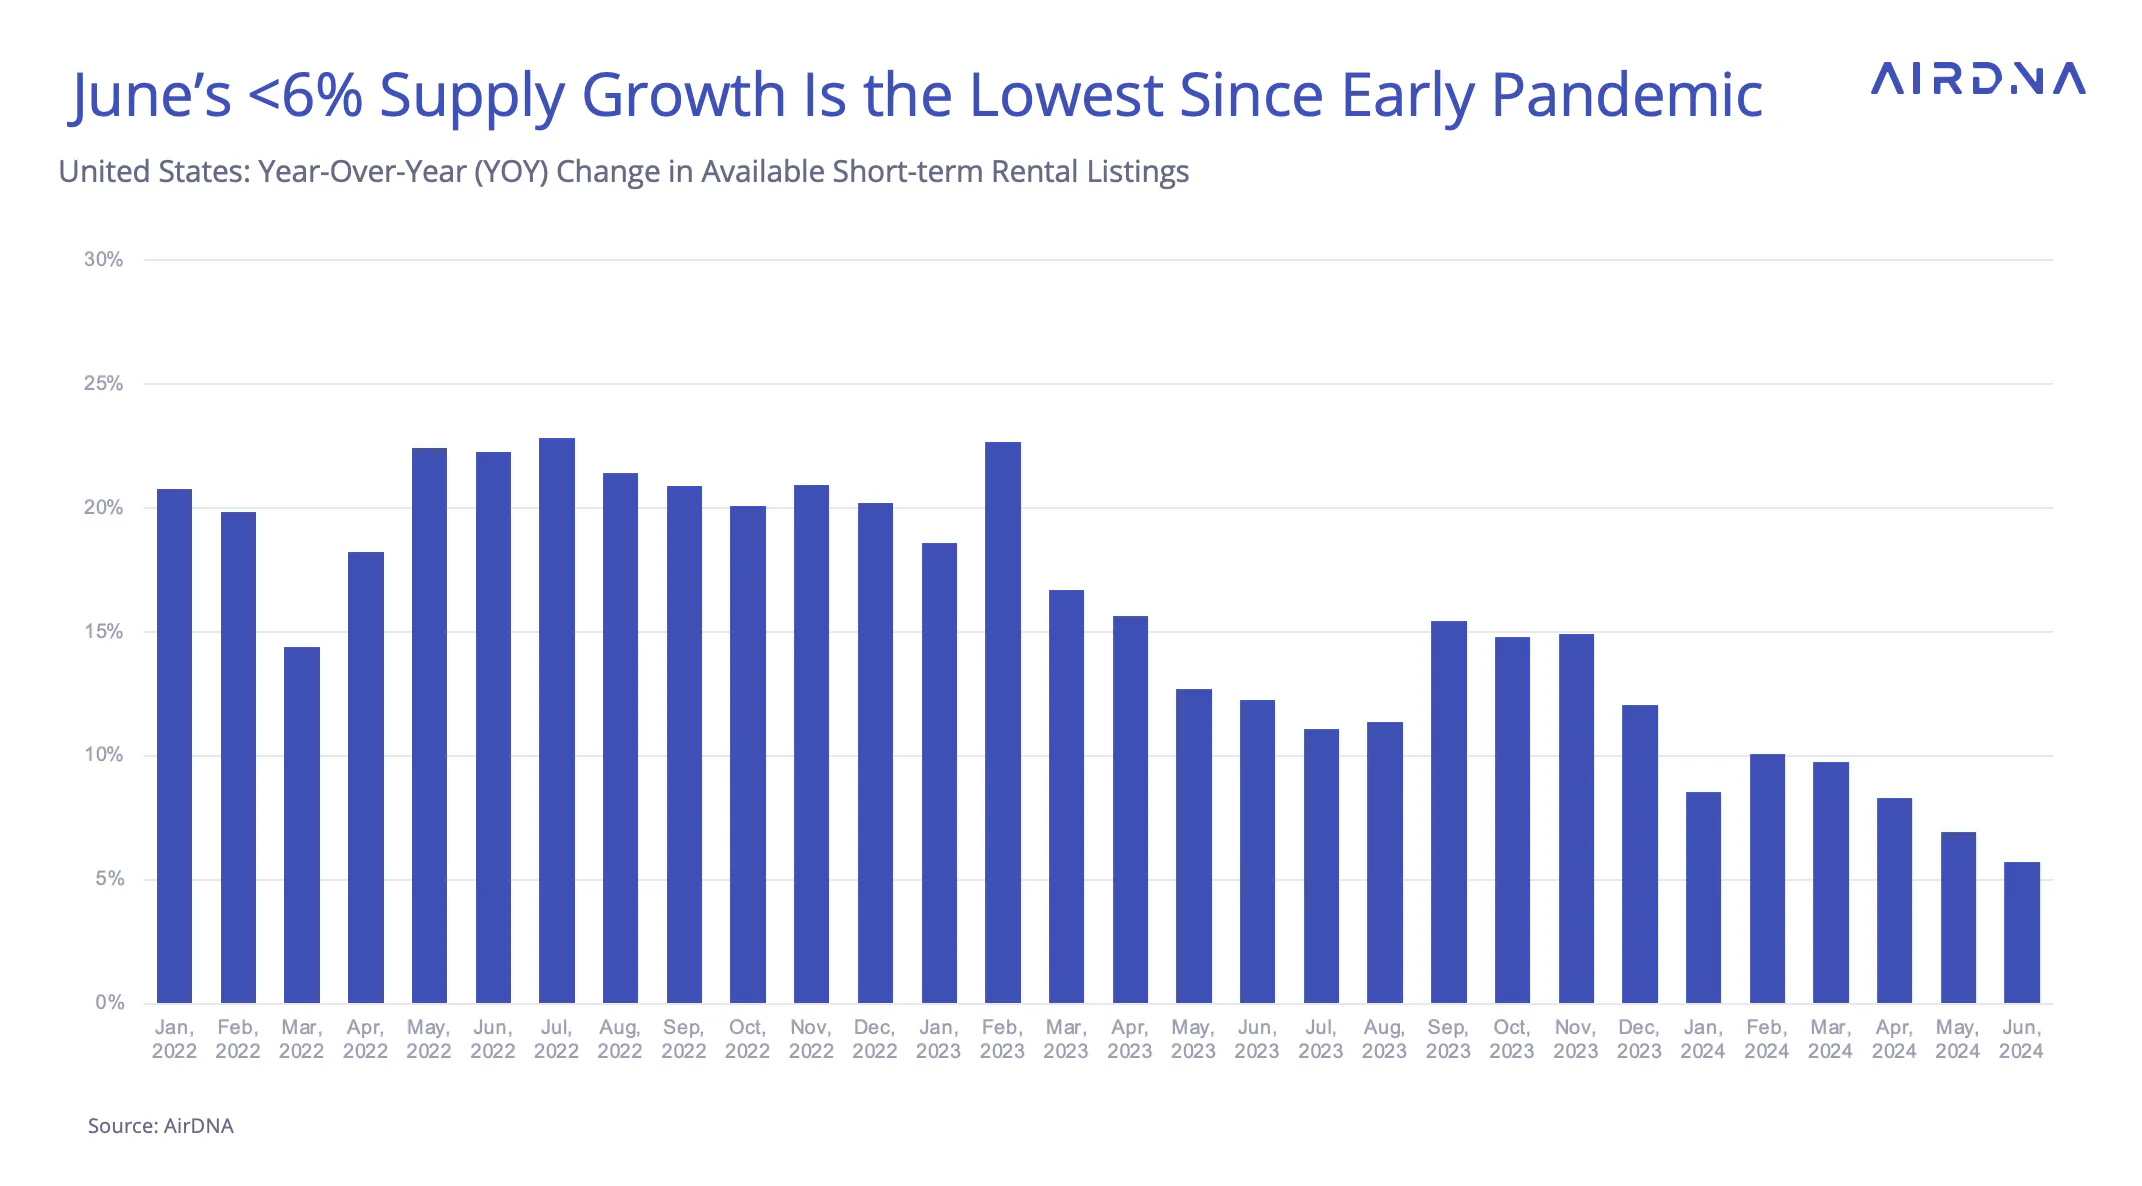
Supply growth rates began to decline in the second half of 2022, partly due to the rate increases that started in March of that year. This June, supply growth dropped to 5.7%. This is about a quarter of the growth rate seen in June 2022 and less than half of the rate in June 2023.
Uneven Slowing of Supply
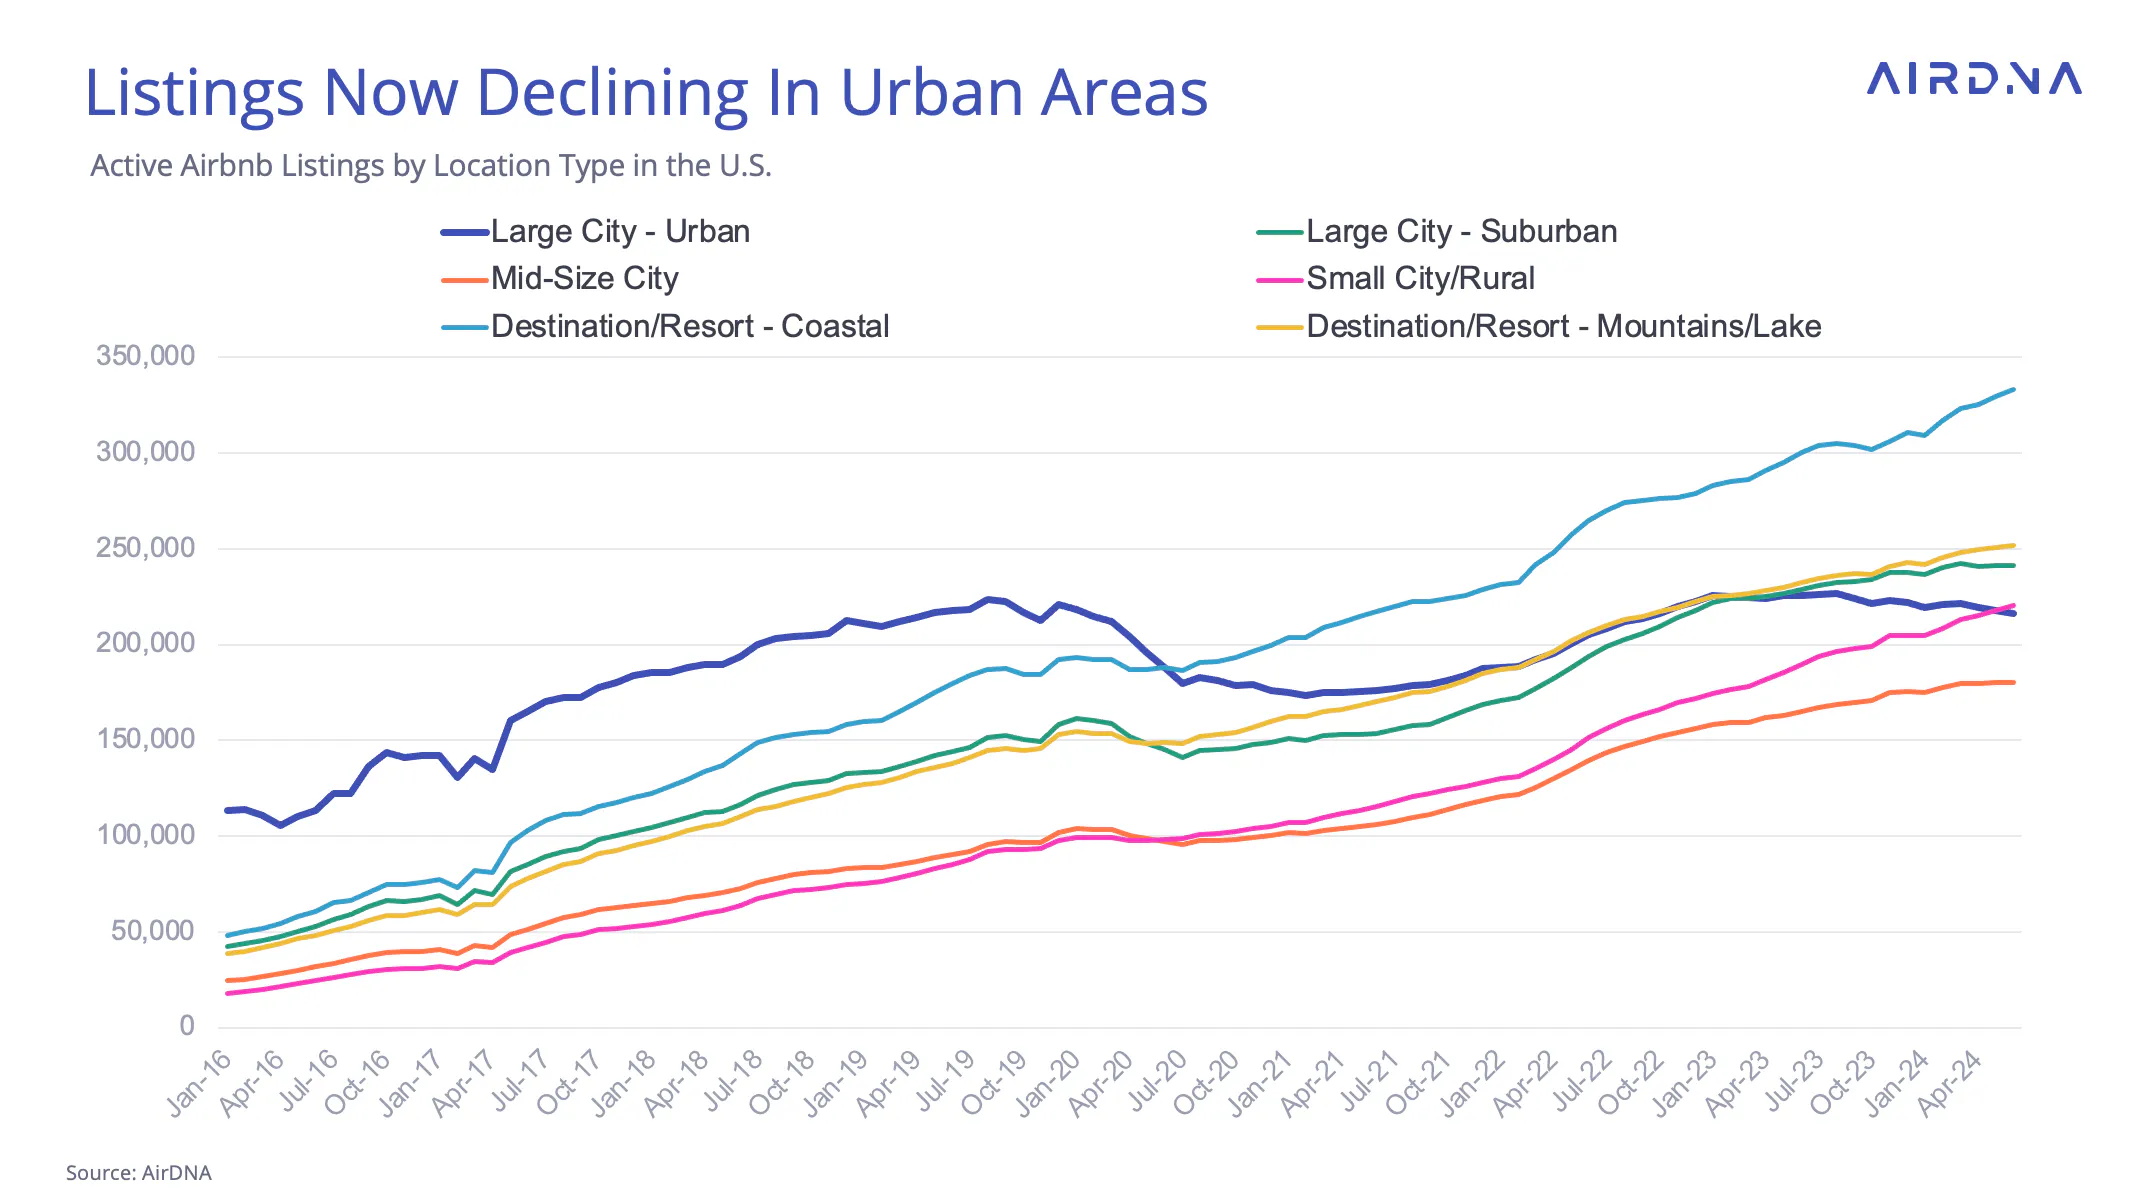
Supply isn’t slowing at an equal rate across all locations. Urban areas are particularly affected by interest rates and increased regulatory scrutiny. For example, in New York, stricter enforcement of short-term rental (STR) regulations in September 2023 effectively banned short-term rentals in the city. As a result, urban locations have seen accelerating declines in supply for the second month in a row, dropping to -4.6% in June from -2.2% in May.
On the other hand, small city and rural locations are still experiencing growth, although at a slightly slower rate than in May. These areas had the fastest-growing supply in June at 14.4%, compared to 16.4% in May.

Looking at the absolute levels of Airbnb listings by location reveals big changes in the U.S. STR market since the pandemic. Before 2020, urban areas consistently had the most listings, while small city and rural areas had the fewest. After the pandemic hit, urban growth slowed down, and small town and rural listings took off. In June 2024, small city/ rural location listings overtook urban listings on Airbnb to become the fourth most-listed location type. Coastal locations, which took the top spot in 2020, have only widened their lead since then.
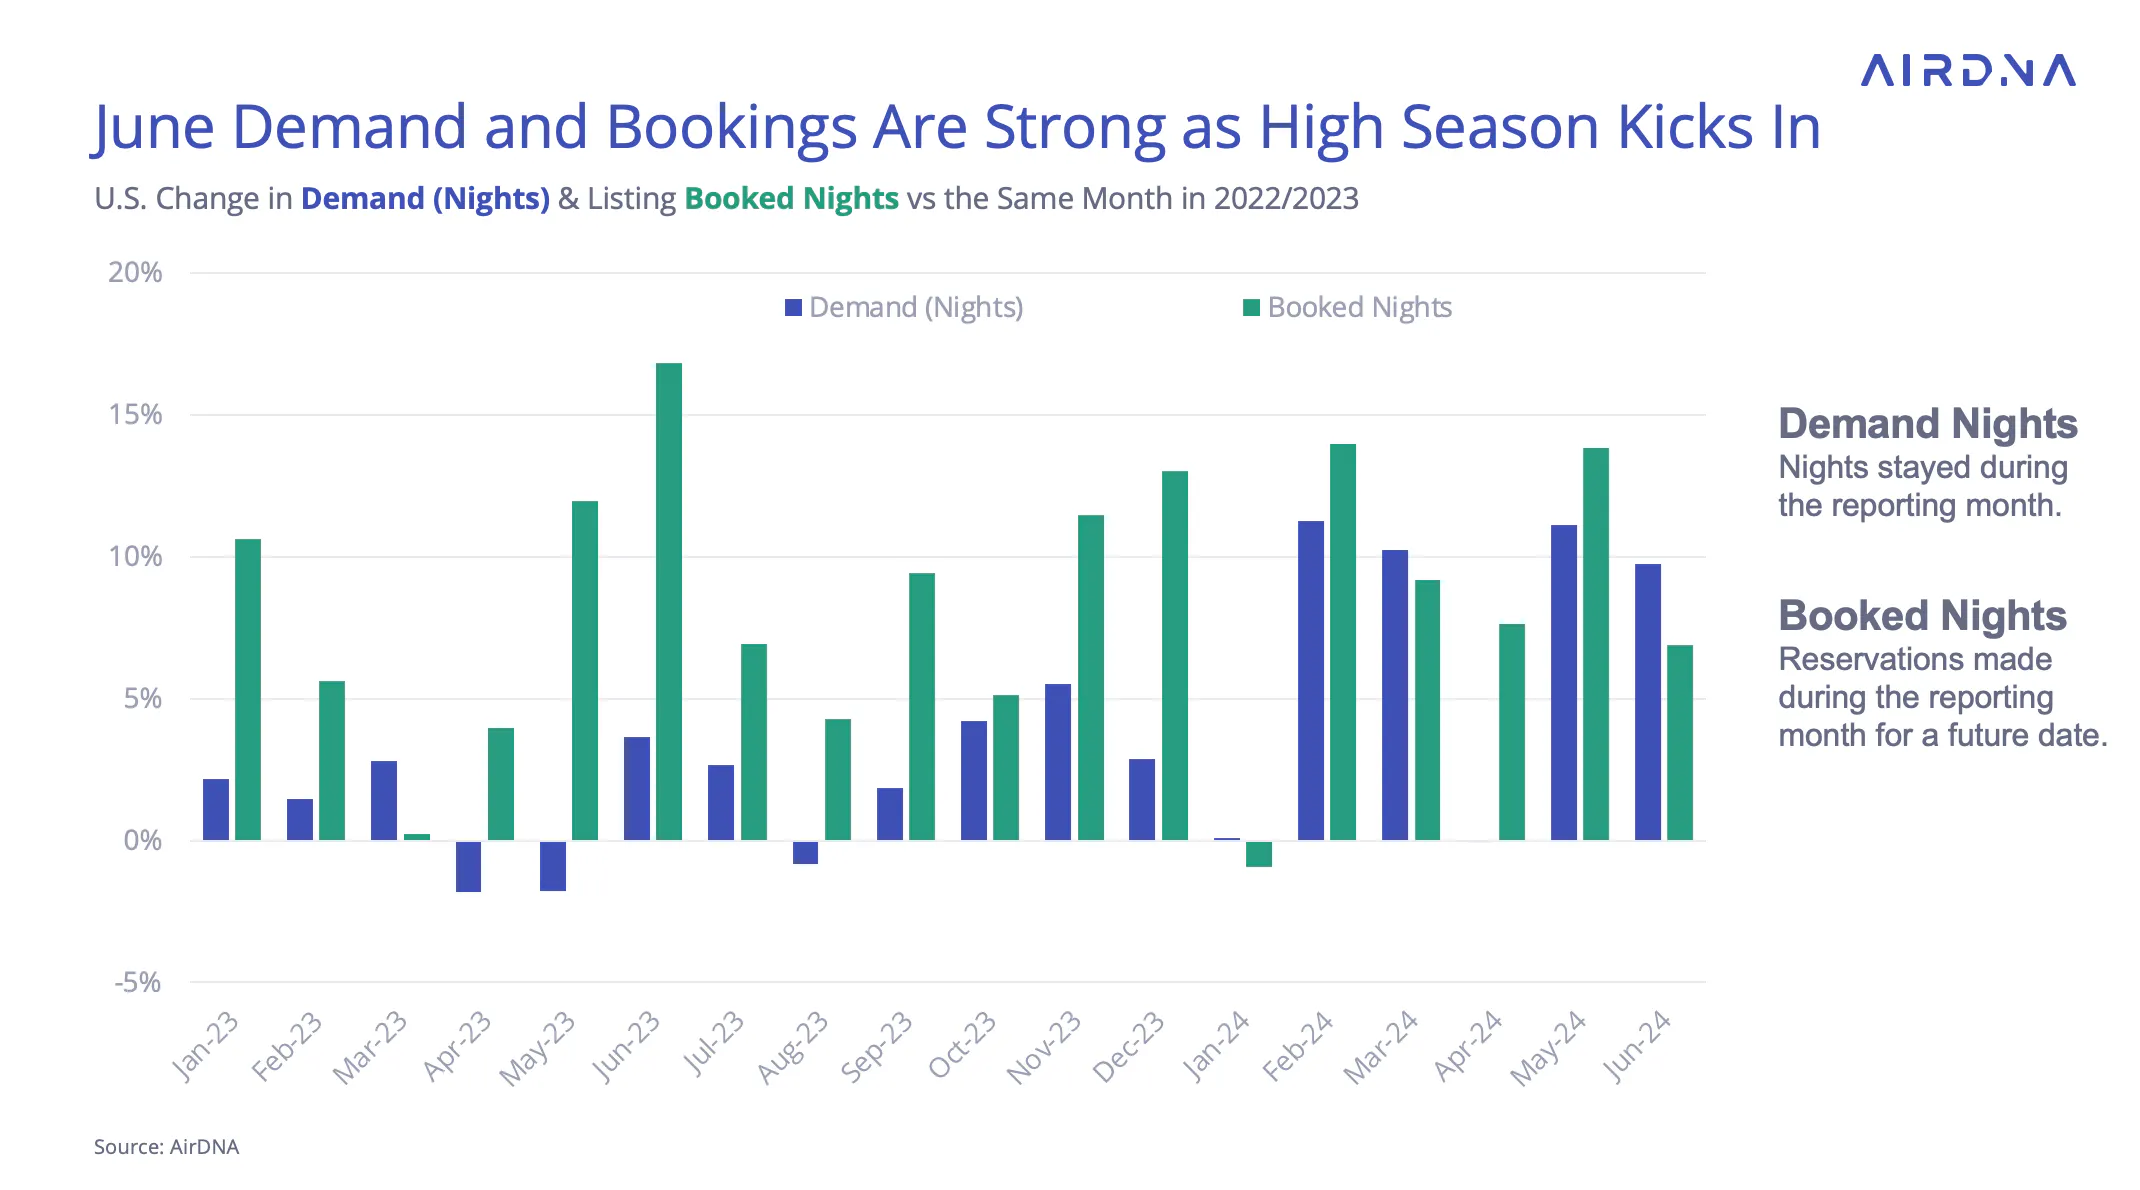
2024’s summer travel season is officially well under way, and June’s demand growth numbers speak to the dramatically better consumer confidence this year compared to last. While June demand in 2023 grew at 3.7% YOY, the most recent June saw demand levels 9.8% higher than last year, slightly above pacing estimates. Booking was 6.9% higher than last year in June as well, a good signal for demand for the rest of the season.
Demand Growth Surpasses Estimates
The summer travel season is in full swing, and June's demand growth numbers show much higher consumer confidence compared to last year. People are feeling more optimistic about the economy and their financial situation, which bodes well for their willingness to spend money.
In June 2023, demand grew by 3.7% year-over-year (YOY). This June, demand levels were 9.8% higher than last year, slightly exceeding pacing estimates. Additionally, bookings were 6.9% higher than in June 2023, indicating strong demand for the rest of the season.
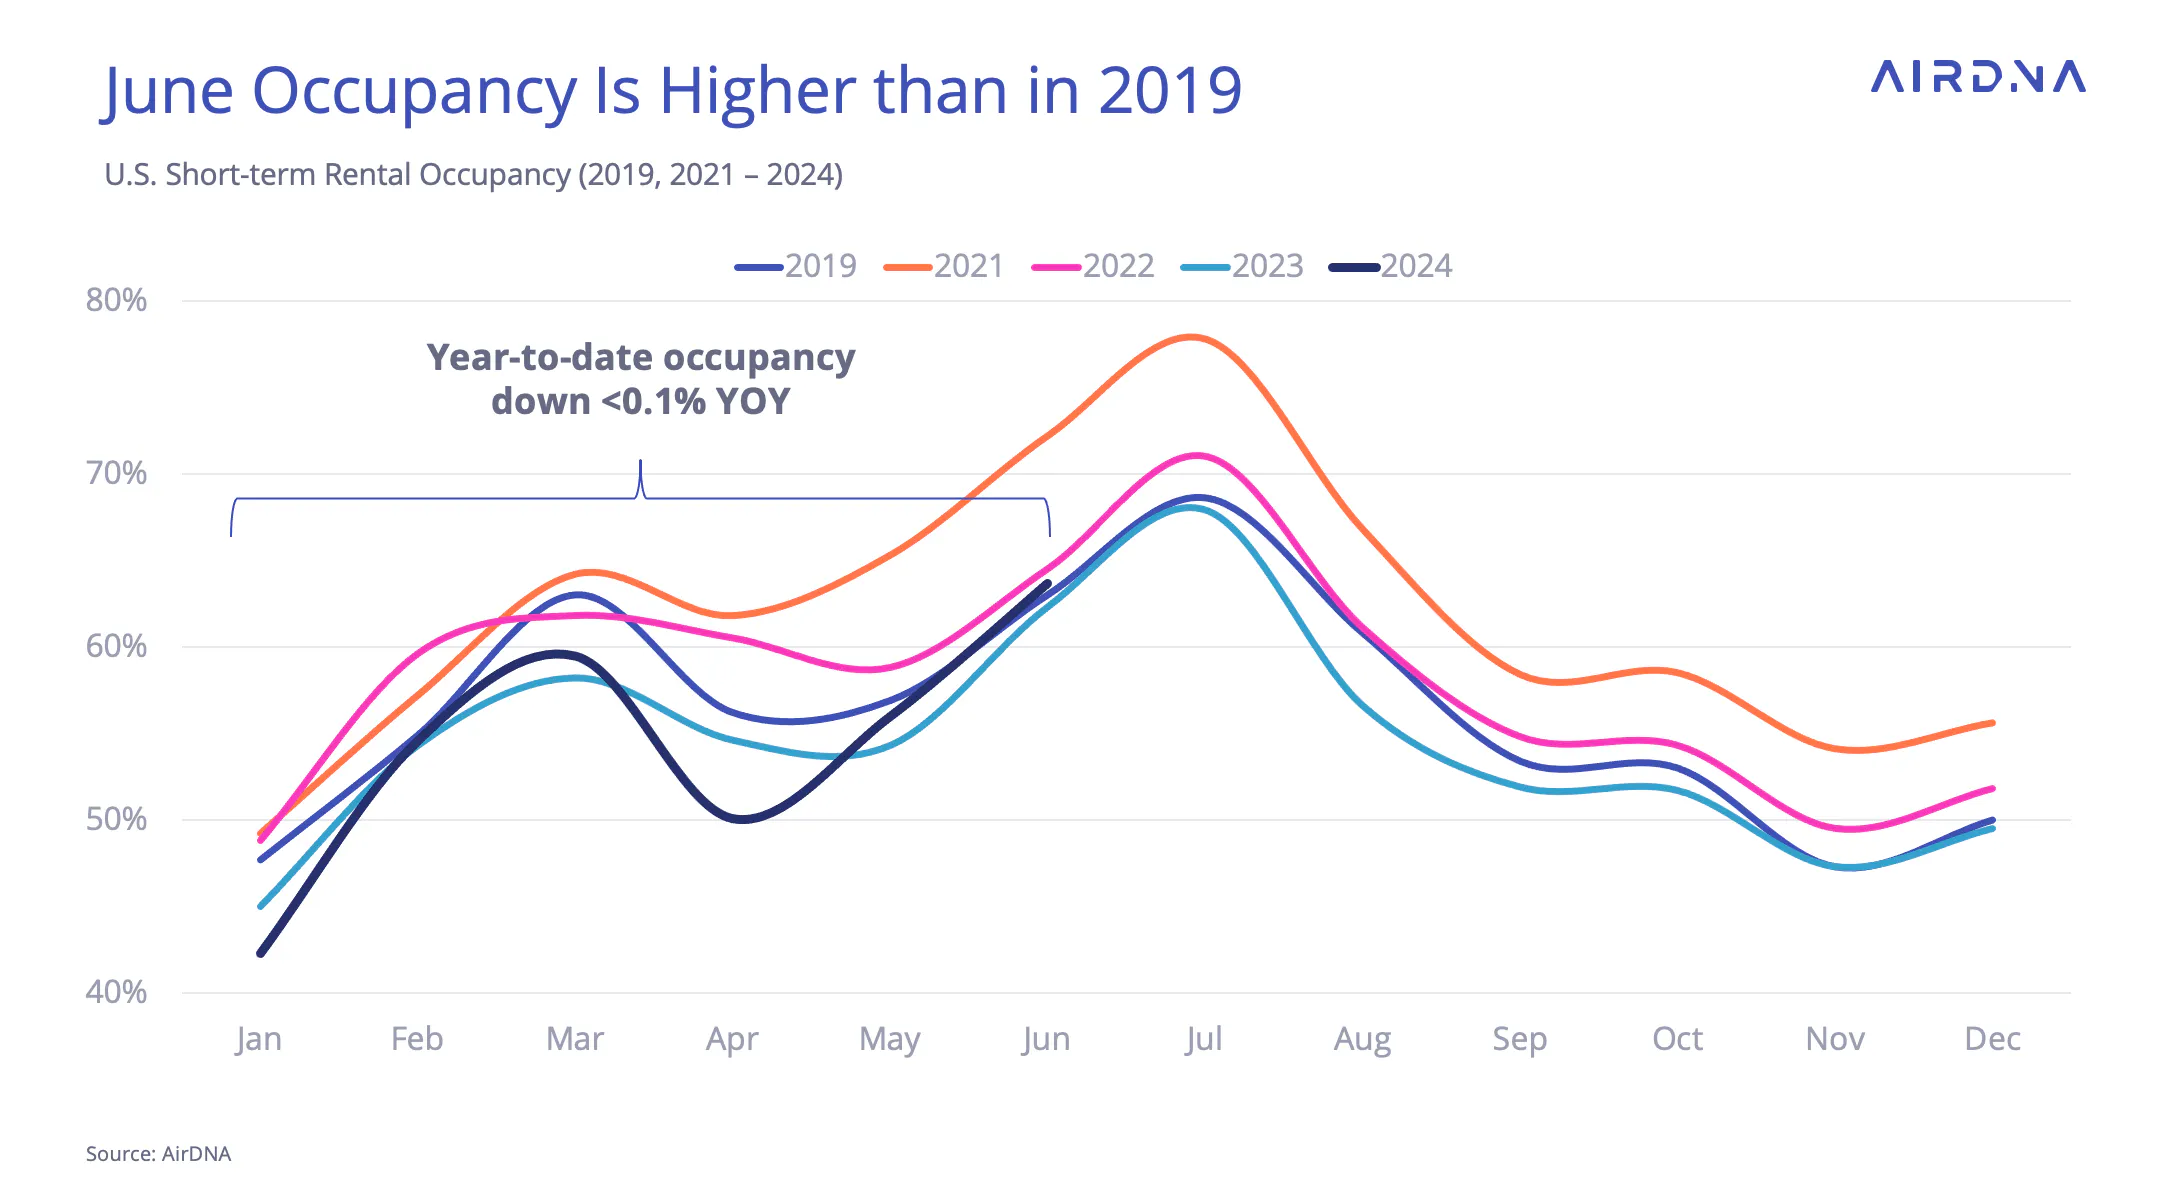
The combination of slowing supply and strong demand led to occupancy increasing 2.2% over the previous year, up to 63.7% from 62.3% in June 2023. Occupancy was also slightly higher than the same month in 2019 (63.0%), making it the first month this year to surpass pre-pandemic levels.
Although year-to-date occupancy has been lower than in 2023 for most of the year, June narrowed the gap to less than 0.1%, the smallest margin yet.
All 6 Location Types Enjoy Demand Increases
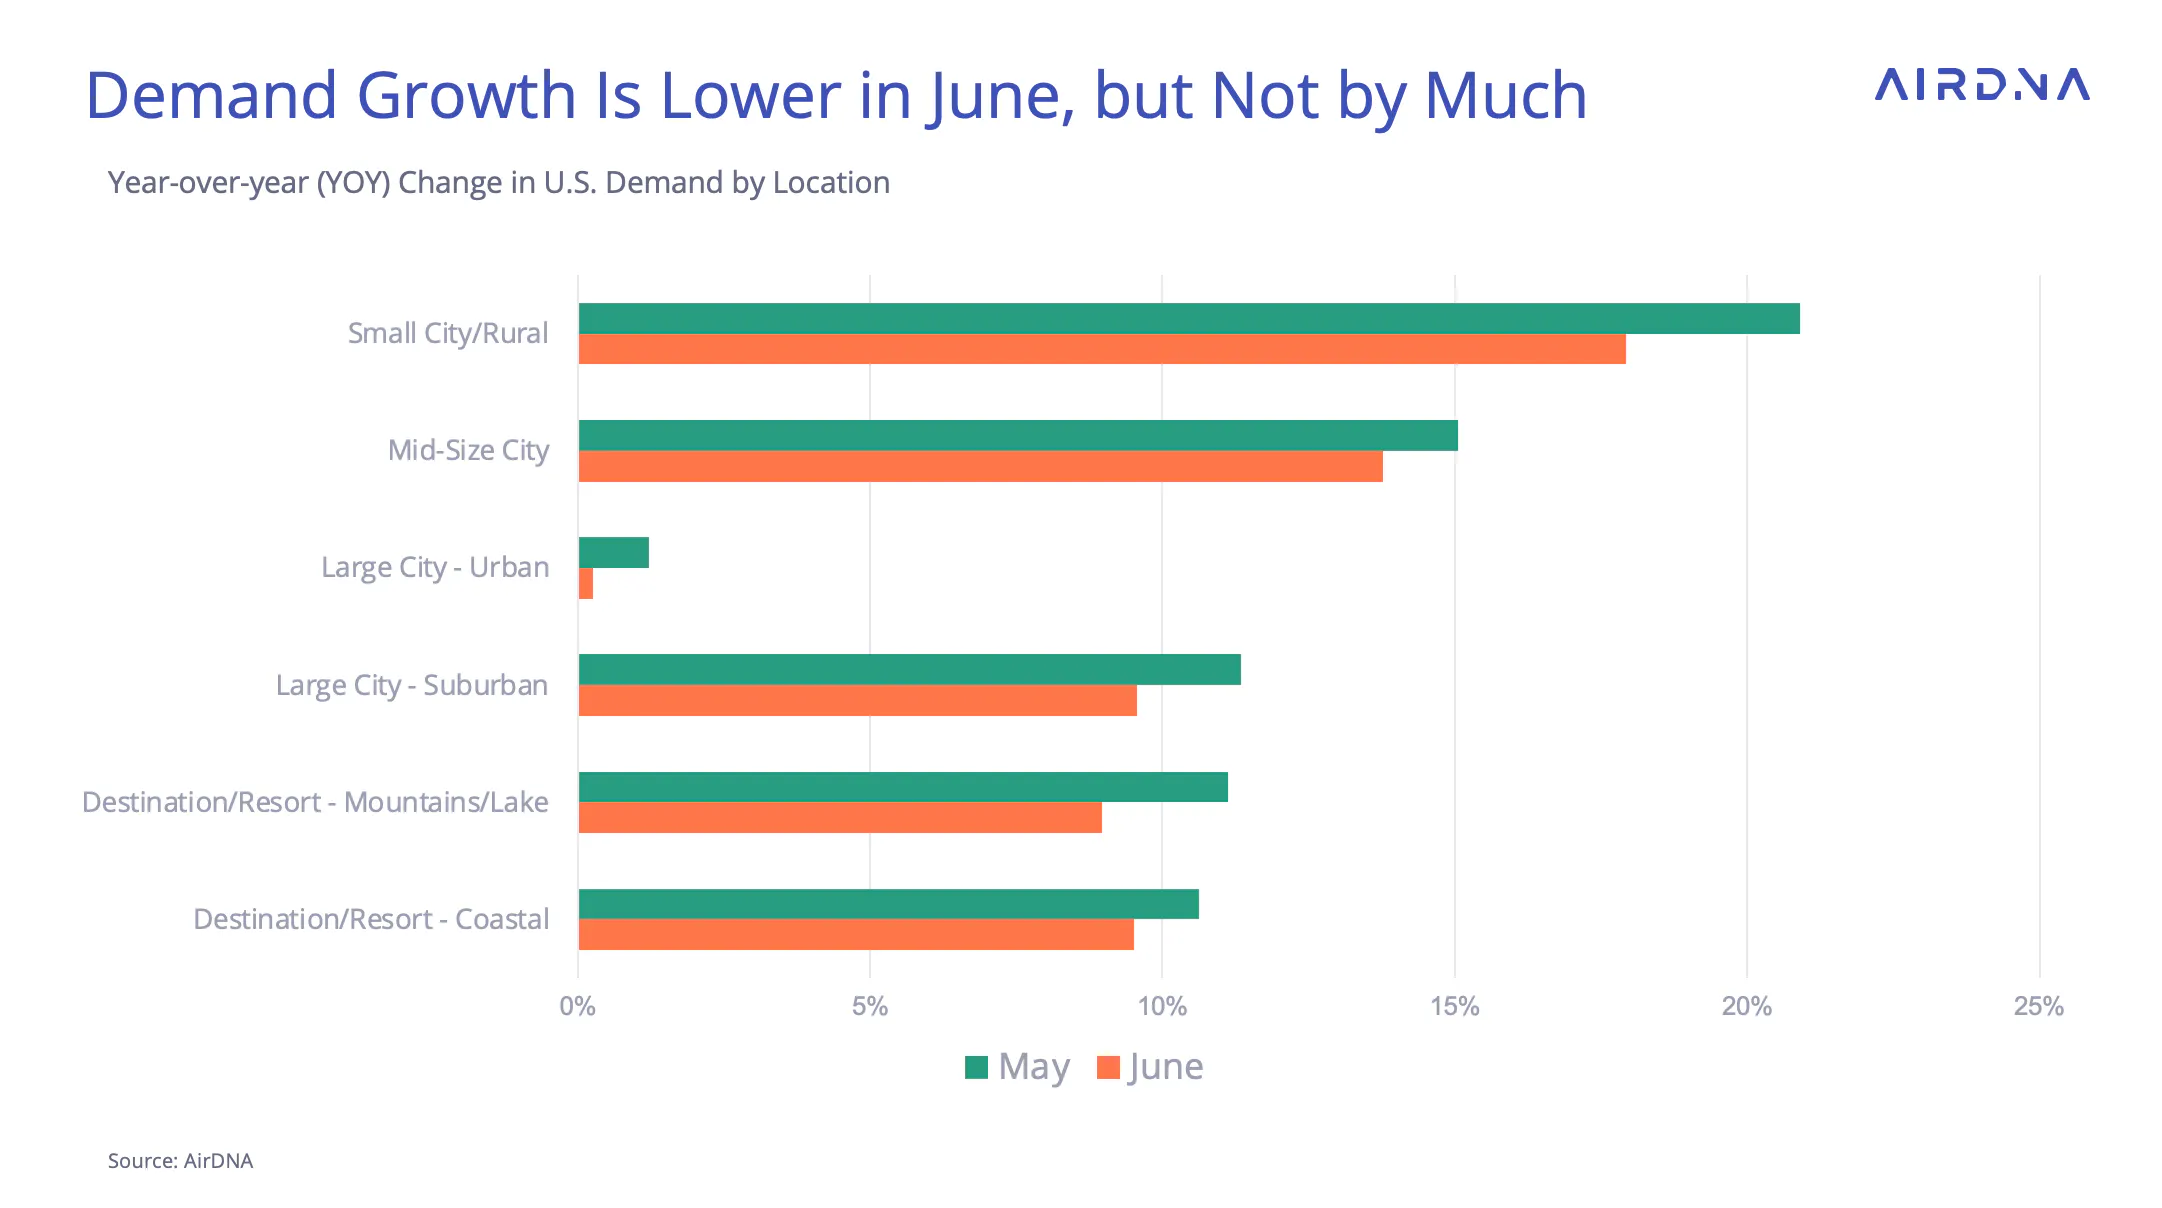
Demand grew in all 6 locations in June. Even urban locations, which saw the number of available listings decline, managed to eke out a rate marginally above zero (0.03%). Although growth rates were lower in June than in May, the pattern of growth remained similar. Small City/Rural locations held on to the top spot with an astonishing 17.9% growth rate year-over-year (YOY).
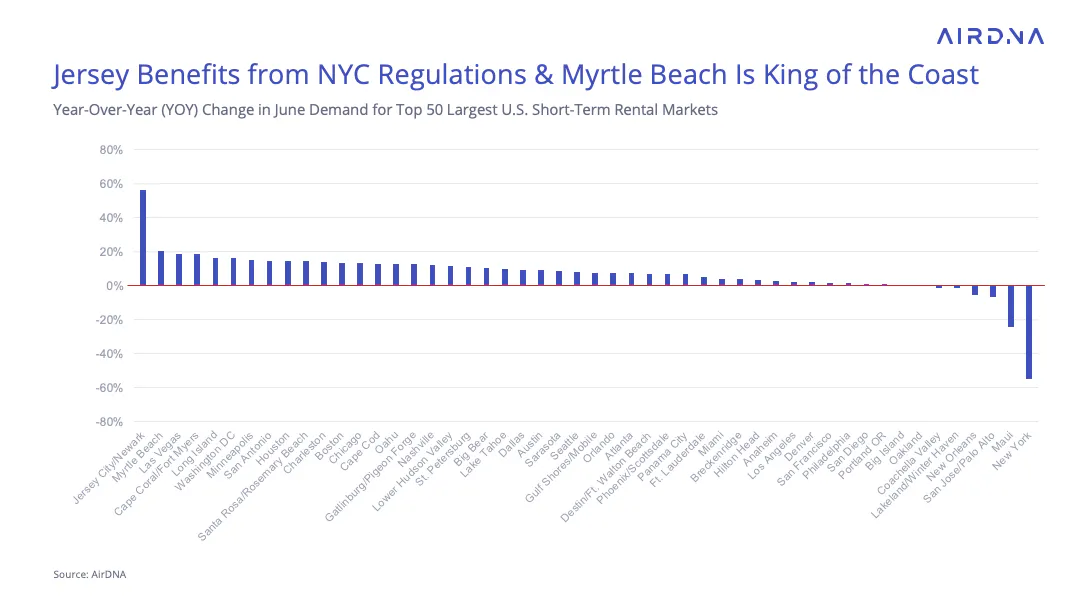
All but 6 of the top 50 markets enjoyed a positive demand trend. Several of these markets are ones with recently enhanced regulations or natural disasters. Topping the list is Jersey City/Newark with a 56.7% increase in demand. STR hosts in this locale are still enjoying spillover from displaced visitors to New York searching for a convenient vacation rental.
Three of the top five markets for demand growth are coastal destinations:
- Myrtle Beach, South Carolina (+20.6%)
- Cape Coral/Ft. Myers, Florida (+18.7%)
- Long Island, New York (+16.6%)
Myrtle Beach is the front runner for all coastal markets in the top 50 and is a key player in the rising popularity of Atlantic beaches that we’ve seen over the last year. Rounding out the top markets is Las Vegas, which proves to be an evergreen tourist destination.
ADR Growth Dips Below Zero
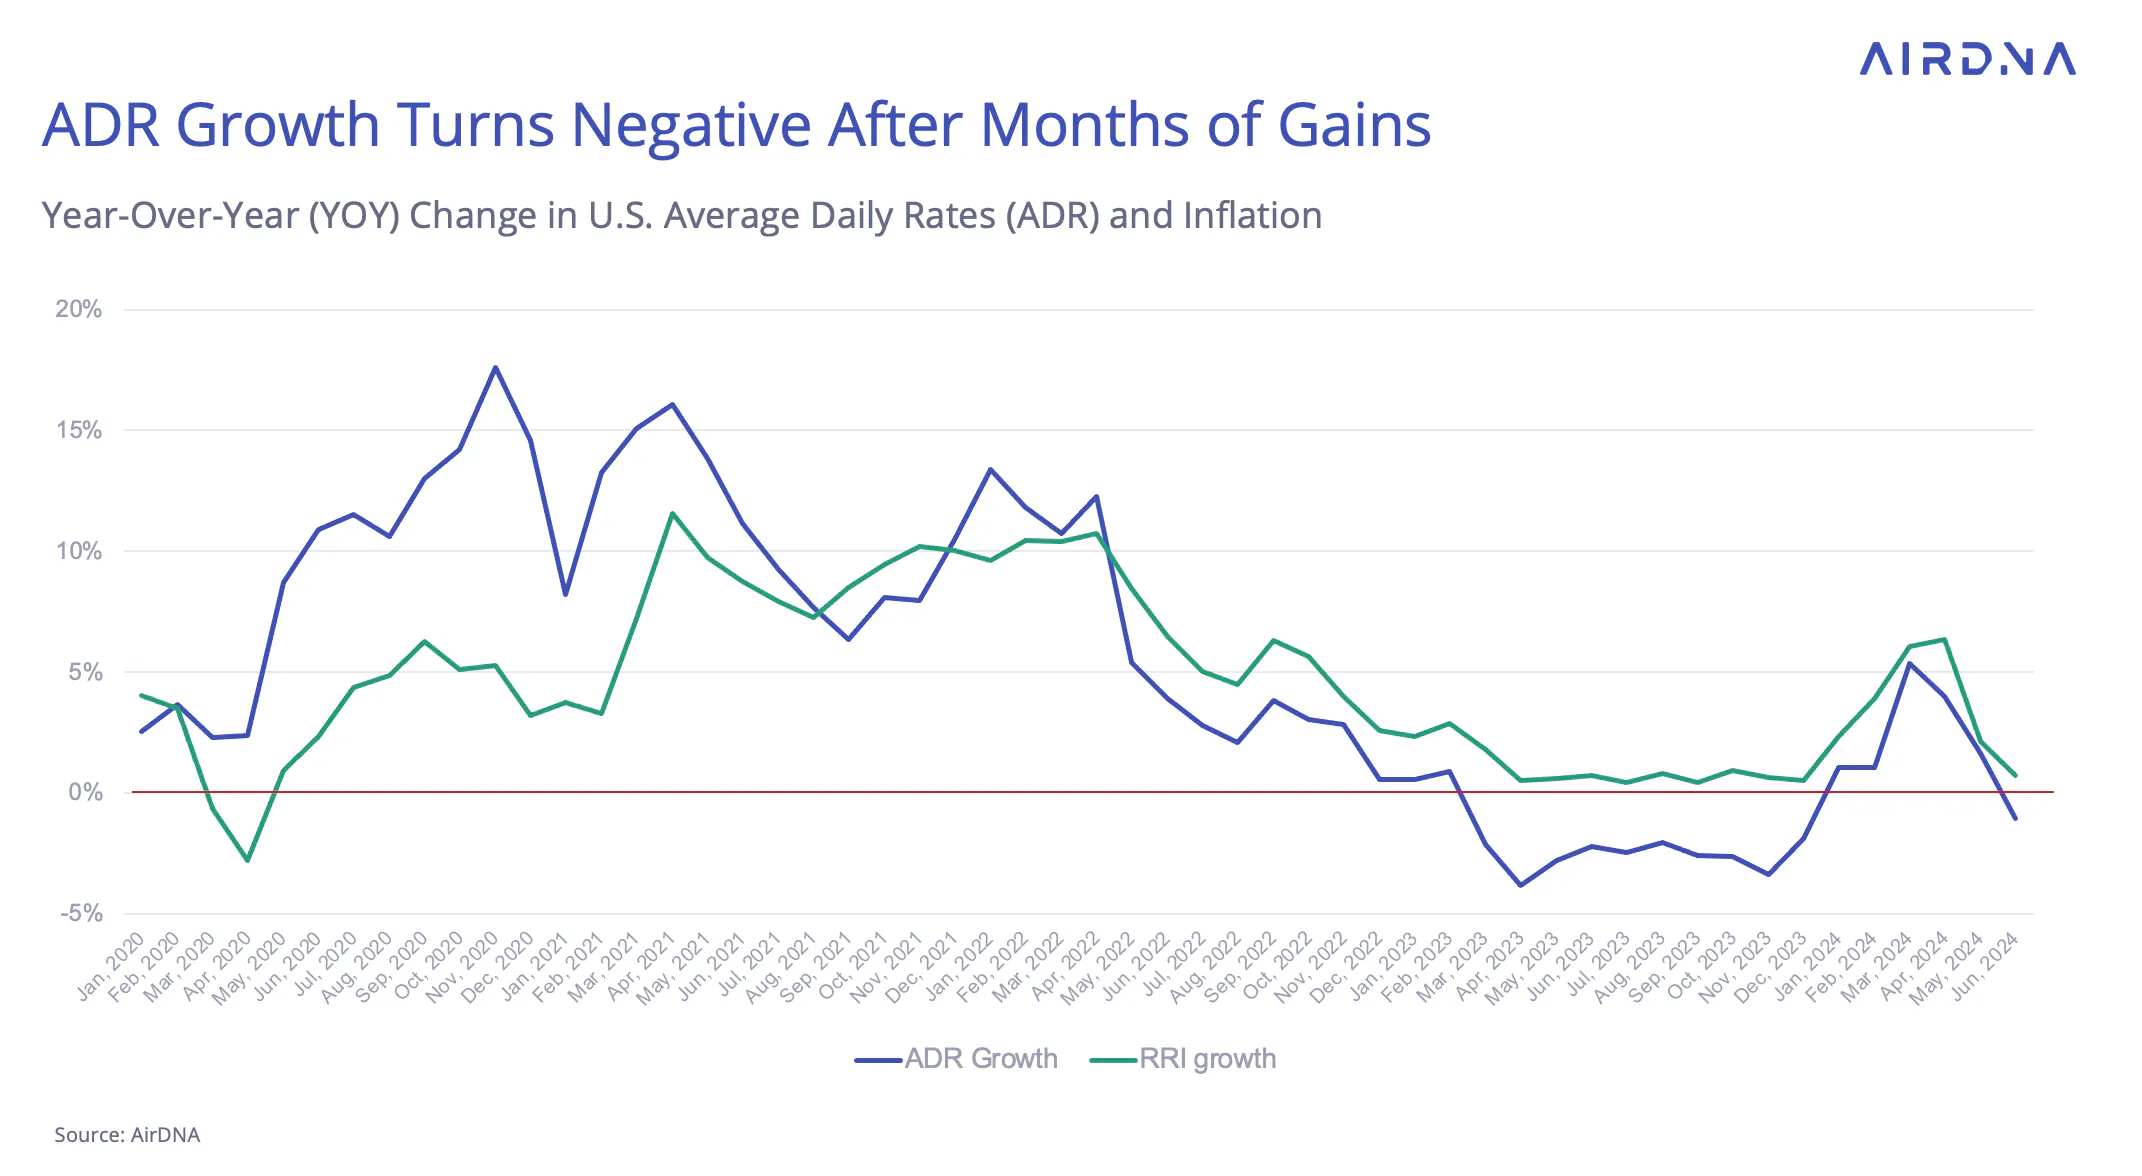
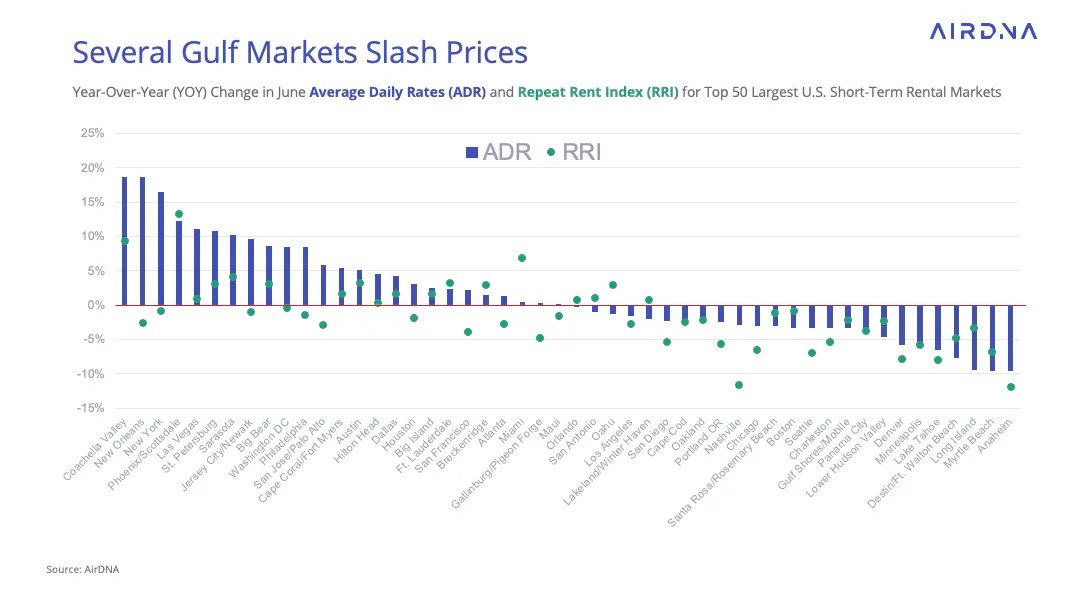
ADR growth was initially a bright spot in otherwise lackluster unit-level performance. However, the past two months have seen a sharp drop in rate growth, turning negative (-1.1% year-over-year) in June.
We look at the Repeat Rent Index (RRI), which isolates the performance of existing properties by removing the effect of new listings, to better understand this trend. The RRI also saw a drop in growth but remained positive at +0.7%. This indicates that the lower ADR was caused by the mix shift, which is the effect of new listings on the average rate. Despite the decline in ADR, the slight positive growth in the RRI suggests that existing properties are maintaining their pricing, albeit barely.
With supply growth significantly slower than in past years, we can expect the RRI and ADR to follow each other more closely. The difference between the two is due to the mix shift. With slower supply growth, there is less impact from mix shift on overall market performance.
Coastal Locations Lead in Price Cuts
If you consider price declines by location, coastal resorts emerge as a catalyst for the national trend in June. Aggressive price increases along the gulf coast in previous years have yielded to pressure from international competition as well as competition from up and coming markets. This has led many popular gulf destinations to decrease prices, including:
- Destin/ Fort Walton Beach, Florida (-7.7%)
- Panama City, Florida (-3.5%)
- Gulf Shores, Alabama (-3.3%)
- Santa Rosa/Rosemary Beach, Florida (-3.1%)

Myrtle Beach, which led demand growth in June, also experienced rapid price declines (-9.6%). On the other hand, St. Petersburg (+10.8%) was a top growth market for ADR. Other top markets for ADR growth, like New Orleans (+18.7%), New York (+16.4%), and Las Vegas (+11.1%) only saw rising rates due to new listings (mix shift). In contrast, Coachella Valley, California (+18.7) experienced both high ADR and RRI increase in it’s off-season, as did Phoenix/Scottsdale, Arizona (+12.2%).
August Demand Soars at the Expense of September Bookings
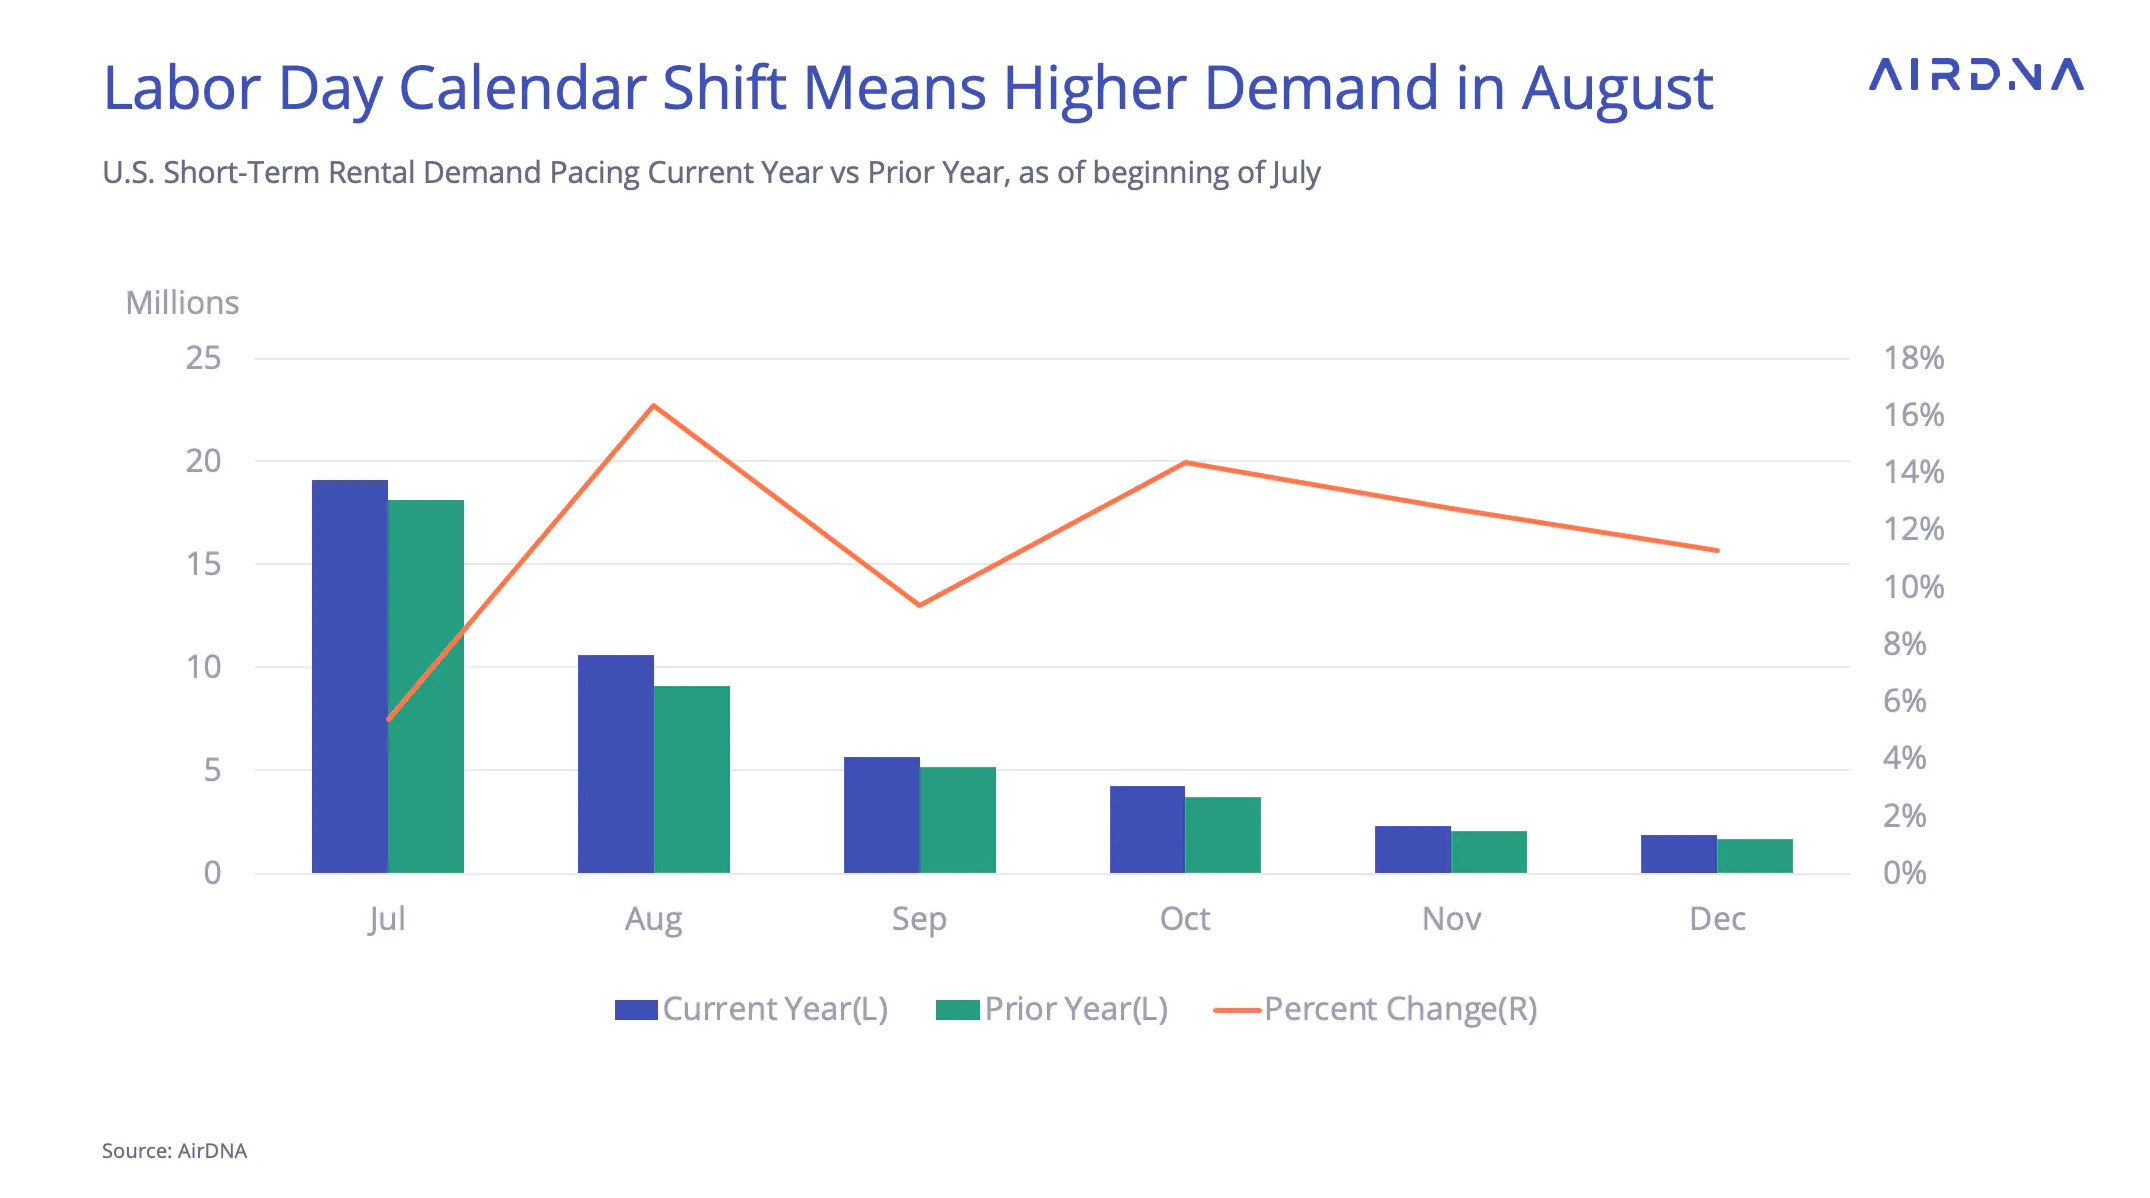
How will the rest of the summer look for short-term rental hosts? July demand pacing looks slower than June’s demand growth, at 5.4%.
Booking lead times, or the number of days in advance that a reservation is made before a stay date, have been shortening post-pandemic. This suggests that the eventual demand growth may slightly exceed our prediction by 1-2%, as was the case for June.
August pacing remains very high due to both a relatively weak August in 2023 and a calendar shift that has moved many extended Labor Day plans from September to August. Labor Day-related demand growth in August may mean weaker demand growth in September. In fact, September’s demand pacing of +9.4% year-over-year (YOY) is considerably smaller than YOY demand growth for October (14.4%).
ARTICLE SUMMARY
June 2024 shows promising trends for the U.S. short-term rental market, with occupancy rates surpassing pre-pandemic levels and steady demand growth. Looking ahead, strong August demand is expected, although it may come at the expense of September bookings due to a calendar shift.
Bram Gallagher
AirDNA Director of Economics and Forecasting
Bram Gallagher is an Economist at AirDNA, specializing in uncovering insights that drive smarter short-term rental decisions. He put his Ph.D. in Economics from the University of Georgia to work researching and forecasting hotel data with CBRE prior to joining AirDNA, as well as teaching economics at a number of universities. In his spare time, Bram enjoys making wooden furniture with hand tools.