6 Airbnb Growth Trends Fueling the U.S. STR Market in 2025 📈
Published: April 29, 2025
Last updated: October 30, 2026

Bram Gallagher
Key Takeaways
- Small cities and rural areas are seeing explosive 13.76% YoY growth while urban markets decline.
- Property-specific factors like pet-friendliness can boost ADR by $17.41 on average.
- Luxury-tier listings are experiencing 5.23% ADR growth while budget properties decline.
Forget what you thought you knew about short-term rental growth in 2025—the market has completely transformed. While average hosts are seeing modest gains, savvy investors are quietly raking in returns that would make traditional real estate investors do a double-take.
Data shows that certain STR segments are exploding at nearly triple the national average growth rate of 4-6%. But what’s separating the blockbuster properties from the underperformers?
We've done the research to discover six powerful Airbnb growth trends that explain why some investors are dominating while others struggle to keep pace. These aren't your typical vague industry forecasts—we're talking about specific, actionable growth factors backed by hard data.
We've organized these STR market growth factors into two categories:
- Macro drivers reshaping entire market segments
- Micro factors that can turn an average listing into a revenue machine
Ready for the inside track? Let’s dive in.
The Macro vs. Micro Divide: Mapping 2025's Airbnb Growth Trends
Forget the outdated notion that "location, location, location" is all that matters in short-term rental investing—in 2025, it's all about location TYPE. Our research reveals a clear pattern: Some location types are absolutely booming while others struggle to stay flat.
First, there are macro growth factors—market-wide forces that lift (or sink) entire location categories regardless of property type. These are the big-picture trends reshaping the industry map.
Then there are the micro growth factors—property-specific characteristics that determine winners and losers within the same ZIP code. Unlike macro trends, these factors (like bedroom count and price tier) won't necessarily predict which markets will boom, but they dramatically impact which properties outperform their neighbors.
Here's the crucial distinction: Macro factors should guide your market selection, while micro factors should inform your property selection once you've chosen a market.
For a deeper dive into these evolving Airbnb growth trends, our comprehensive market forecast and short-term rental trends reports provide forward-looking analysis. Prefer the complete picture? Our 2025 Outlook Report offers industry-leading projections backed by proprietary data you won't find anywhere else.
Now, let's explore exactly how these growth factors are reshaping STR investing in 2025.

Macro Growth Factors Fueling STR Growth
Want to know where the real STR money is flowing in 2025? Look beyond saturated urban cores.
Our Airbnb market insights reveal three unmistakable macro Airbnb growth trends that are substantially influencing investment outcomes across entire markets.
Small cities and rural areas are leading the way
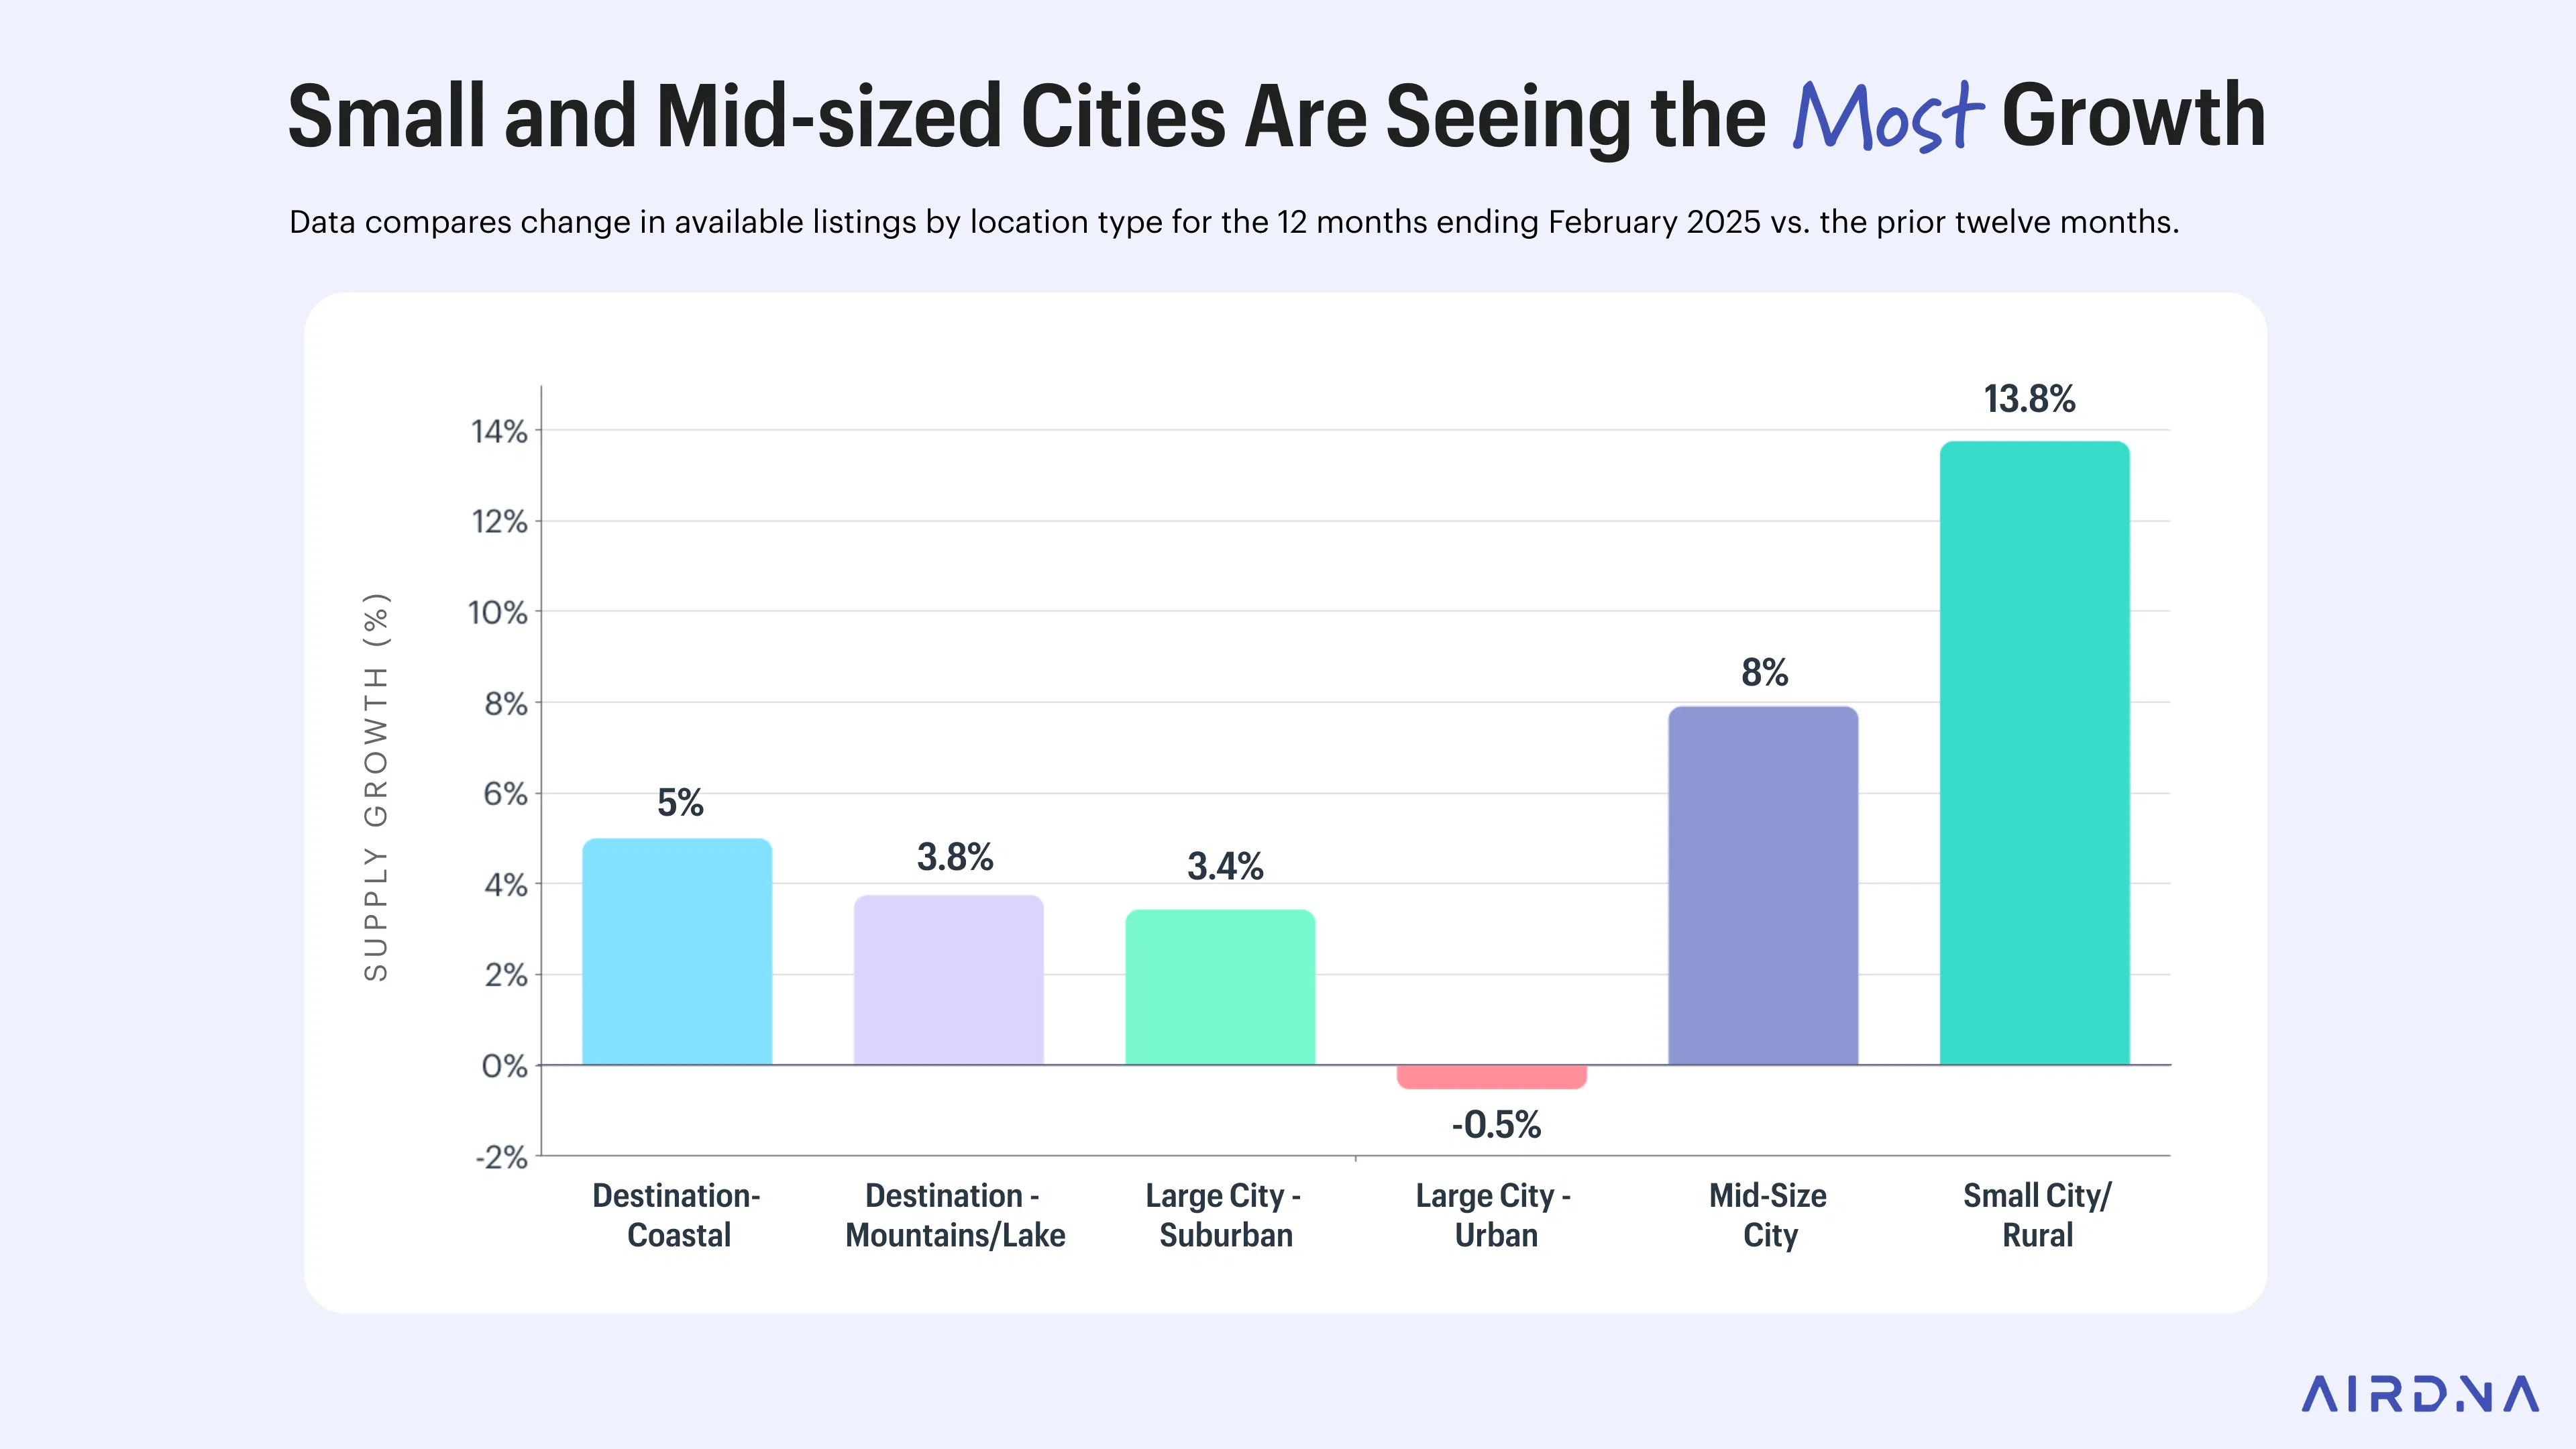
While everyone was fighting over urban listings, smart investors quietly capitalized on an explosive rural boom. Small cities and rural areas are growing at a blistering 13.76% year-over-year rate, while mid-size cities aren't far behind at 7.9%.
We define small cities and rural areas as locations that don’t represent the country’s top 150 most populous cities (and aren’t classified as destination/resort markets). Mid-size cities are those that rank #51 - 150 in population density.
So, what's driving growth in small- and mid-size cities?
- Fewer regulatory barriers
- More space for those in-demand larger homes
- Increasing travel demand
These Airbnb growth trends show a fundamental shift in traveler preferences. For context, urban STR markets are actually shrinking by 0.5% YoY, though regulation is primarily to blame for the slowdown.
Find opportunities with AirDNA
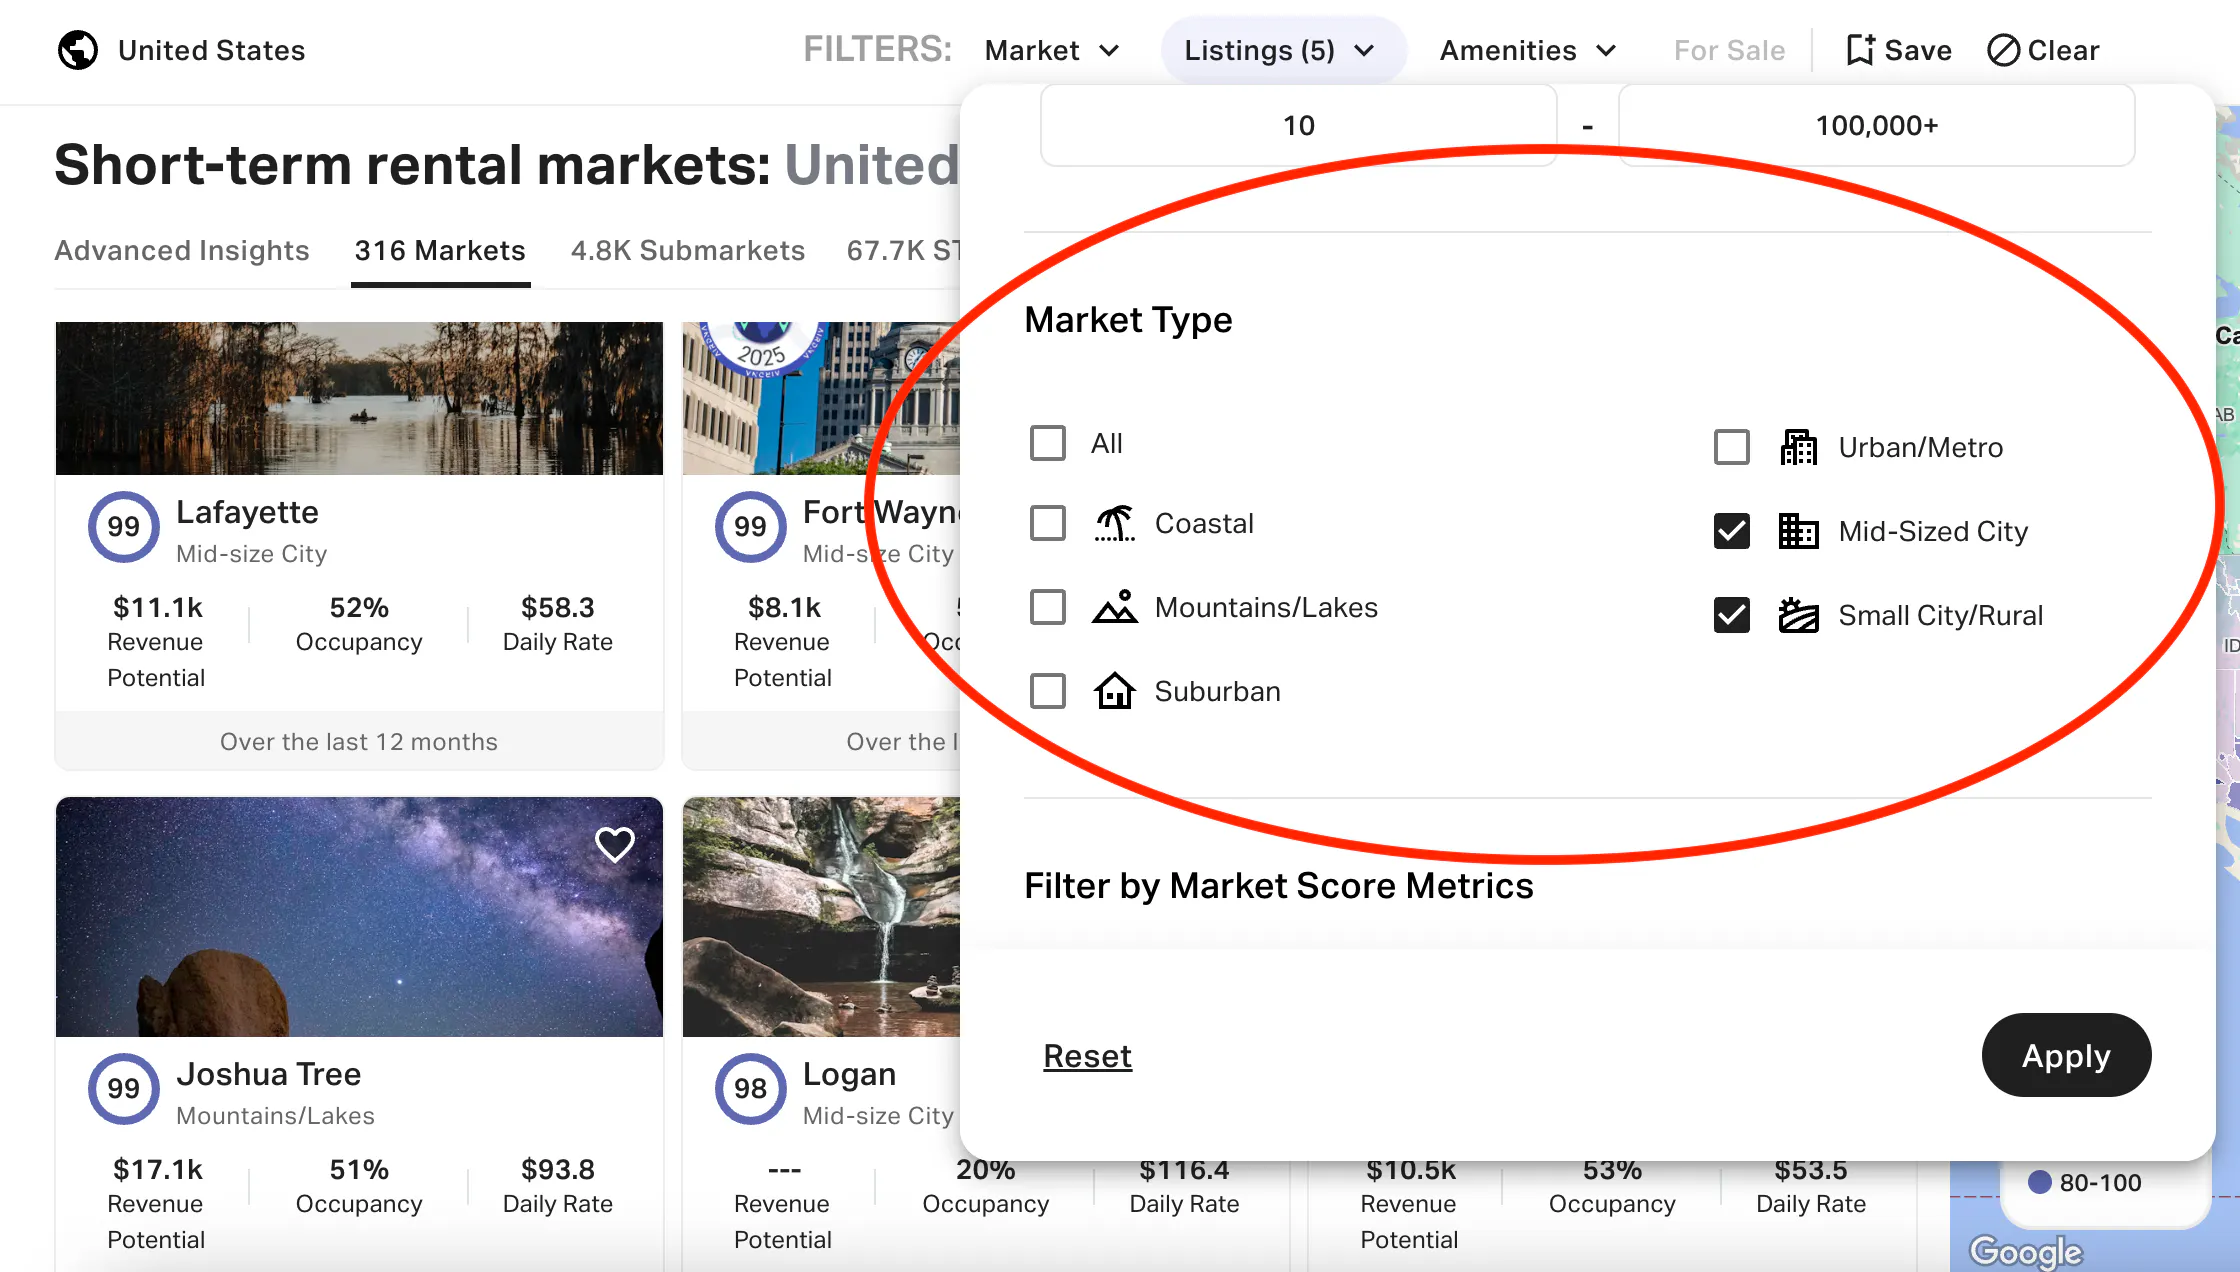
Want to capitalize on this trend? The Market filter in AirDNA lets you instantly sort markets by location type. Filter to show only mid-sized cities and small cities/rural areas to reveal hidden gems in these high-growth categories before they become overcrowded.
Pet-friendly listings are quietly winning
Forget premium upgrades and expensive renovations—your most powerful revenue booster might be as simple as saying "yes" to four-legged guests.
Our data reveals a surprising Airbnb growth trend: Pet-friendly listings consistently outperform their no-pets counterparts across every key metric that matters to your bottom line.
Listings that welcome pets enjoy:
- 5.4% higher growth rates than those that don't
- A full percentage point boost in occupancy rates
- An Average daily rate (ADR) that's $17.41 higher on average
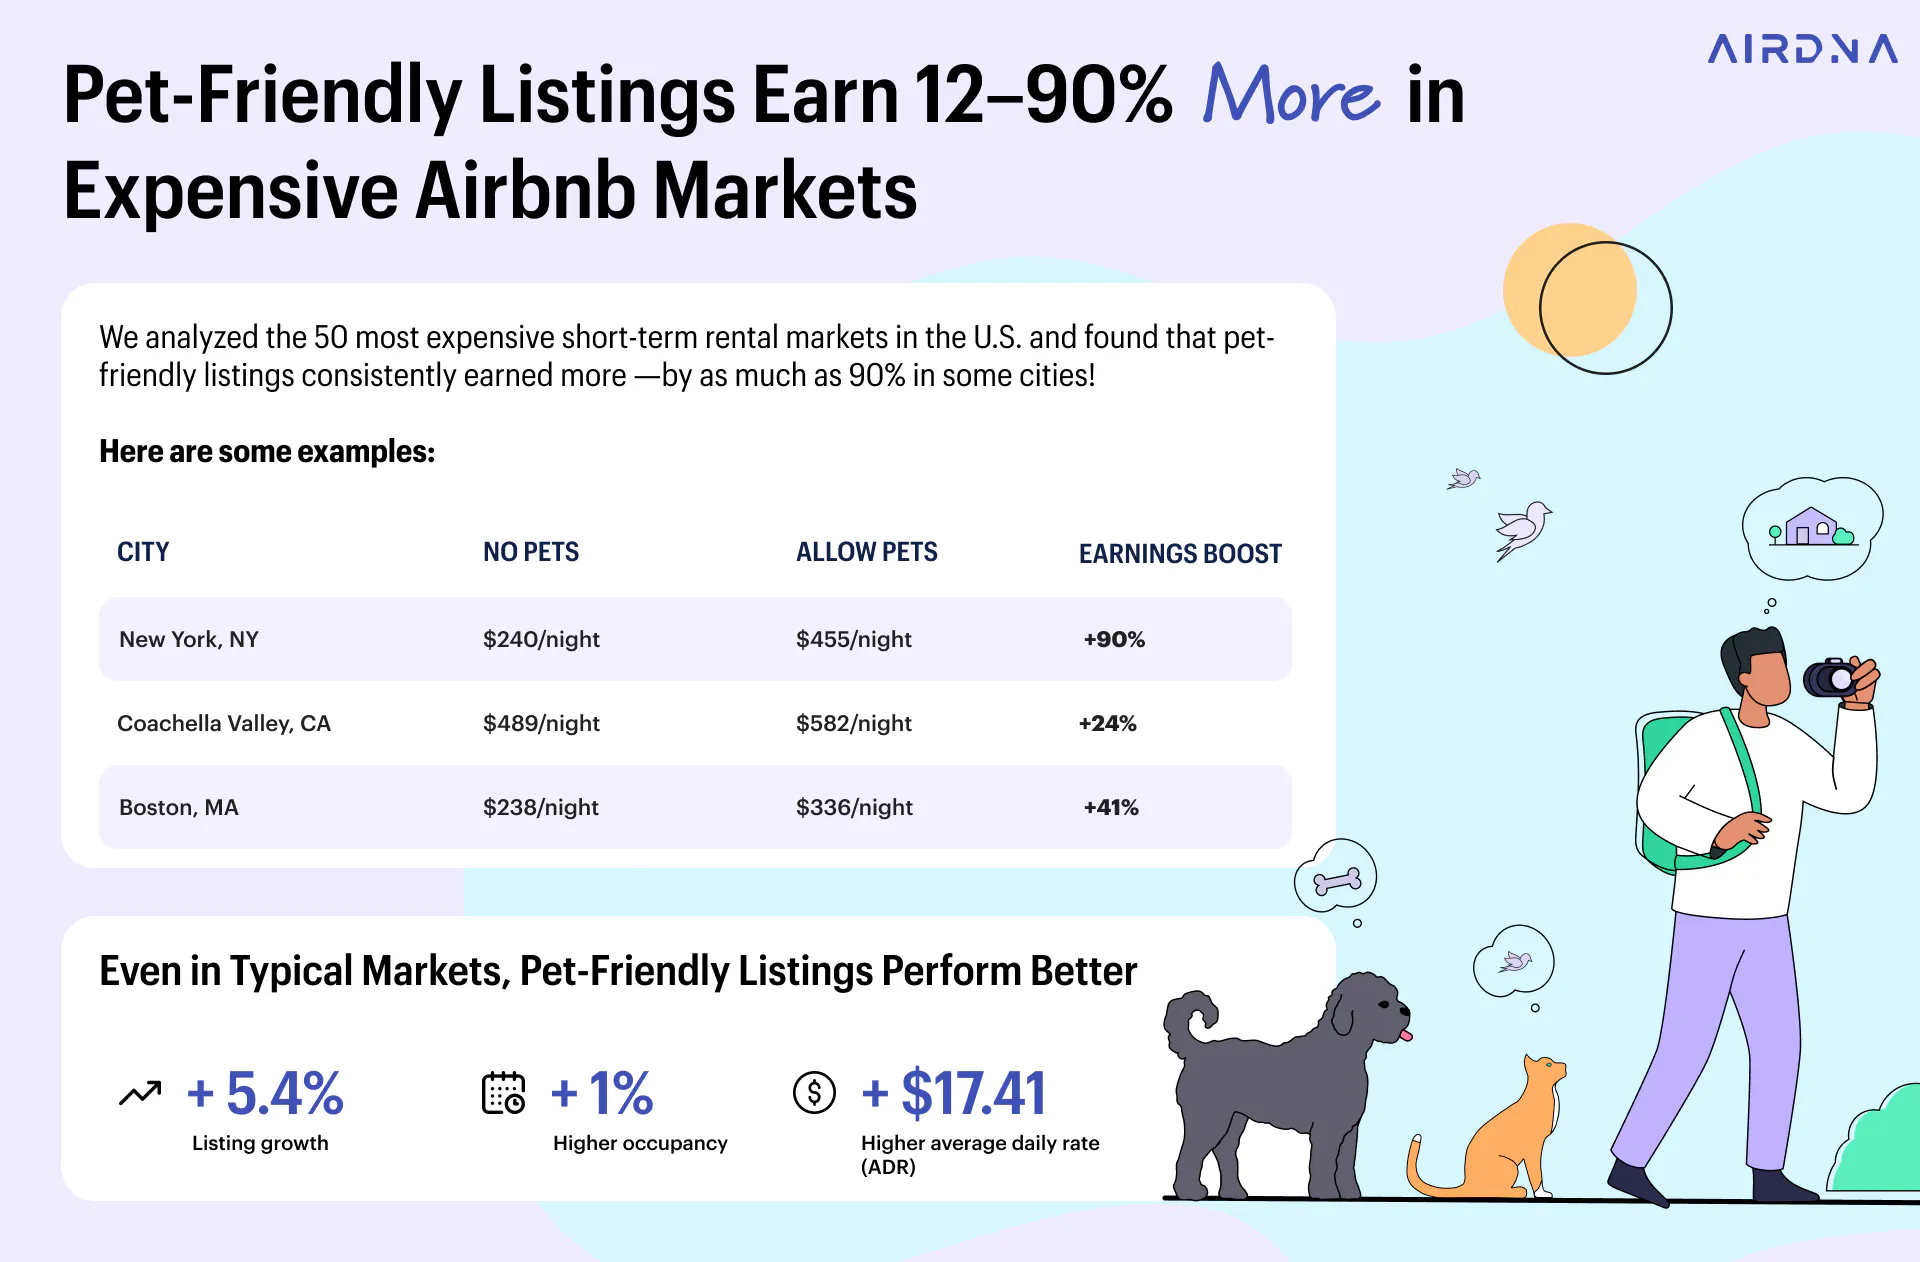
In luxury markets in particular, pet-friendly STRs see premiums explode. The top 20 most expensive markets get 22-90% more per night, while the top 50 see gains starting at 12%.
U.S. markets with the most dramatic ADR growth for pet-friendly rentals include:
- New York City: 89.58%
- New Jersey Area: 68.78%
- Long Island, New York: 57.51%
- Port St. Lucie, Florida: 54.74%
- Oahu, Hawaii: 52.69%
This Airbnb growth trend is a clear signal that traveler decisions are increasingly amenity-driven. And unlike costly renovations, this revenue lever costs almost nothing to implement. If you’re planning to make your rental pet-friendly, capitalize on the demand by adding strategic pet amenities like:
- Fenced outdoor spaces
- Pet cleanup stations
- Curated recommendations for nearby pet-friendly activities
Analyze pet-friendly listing performance in your market
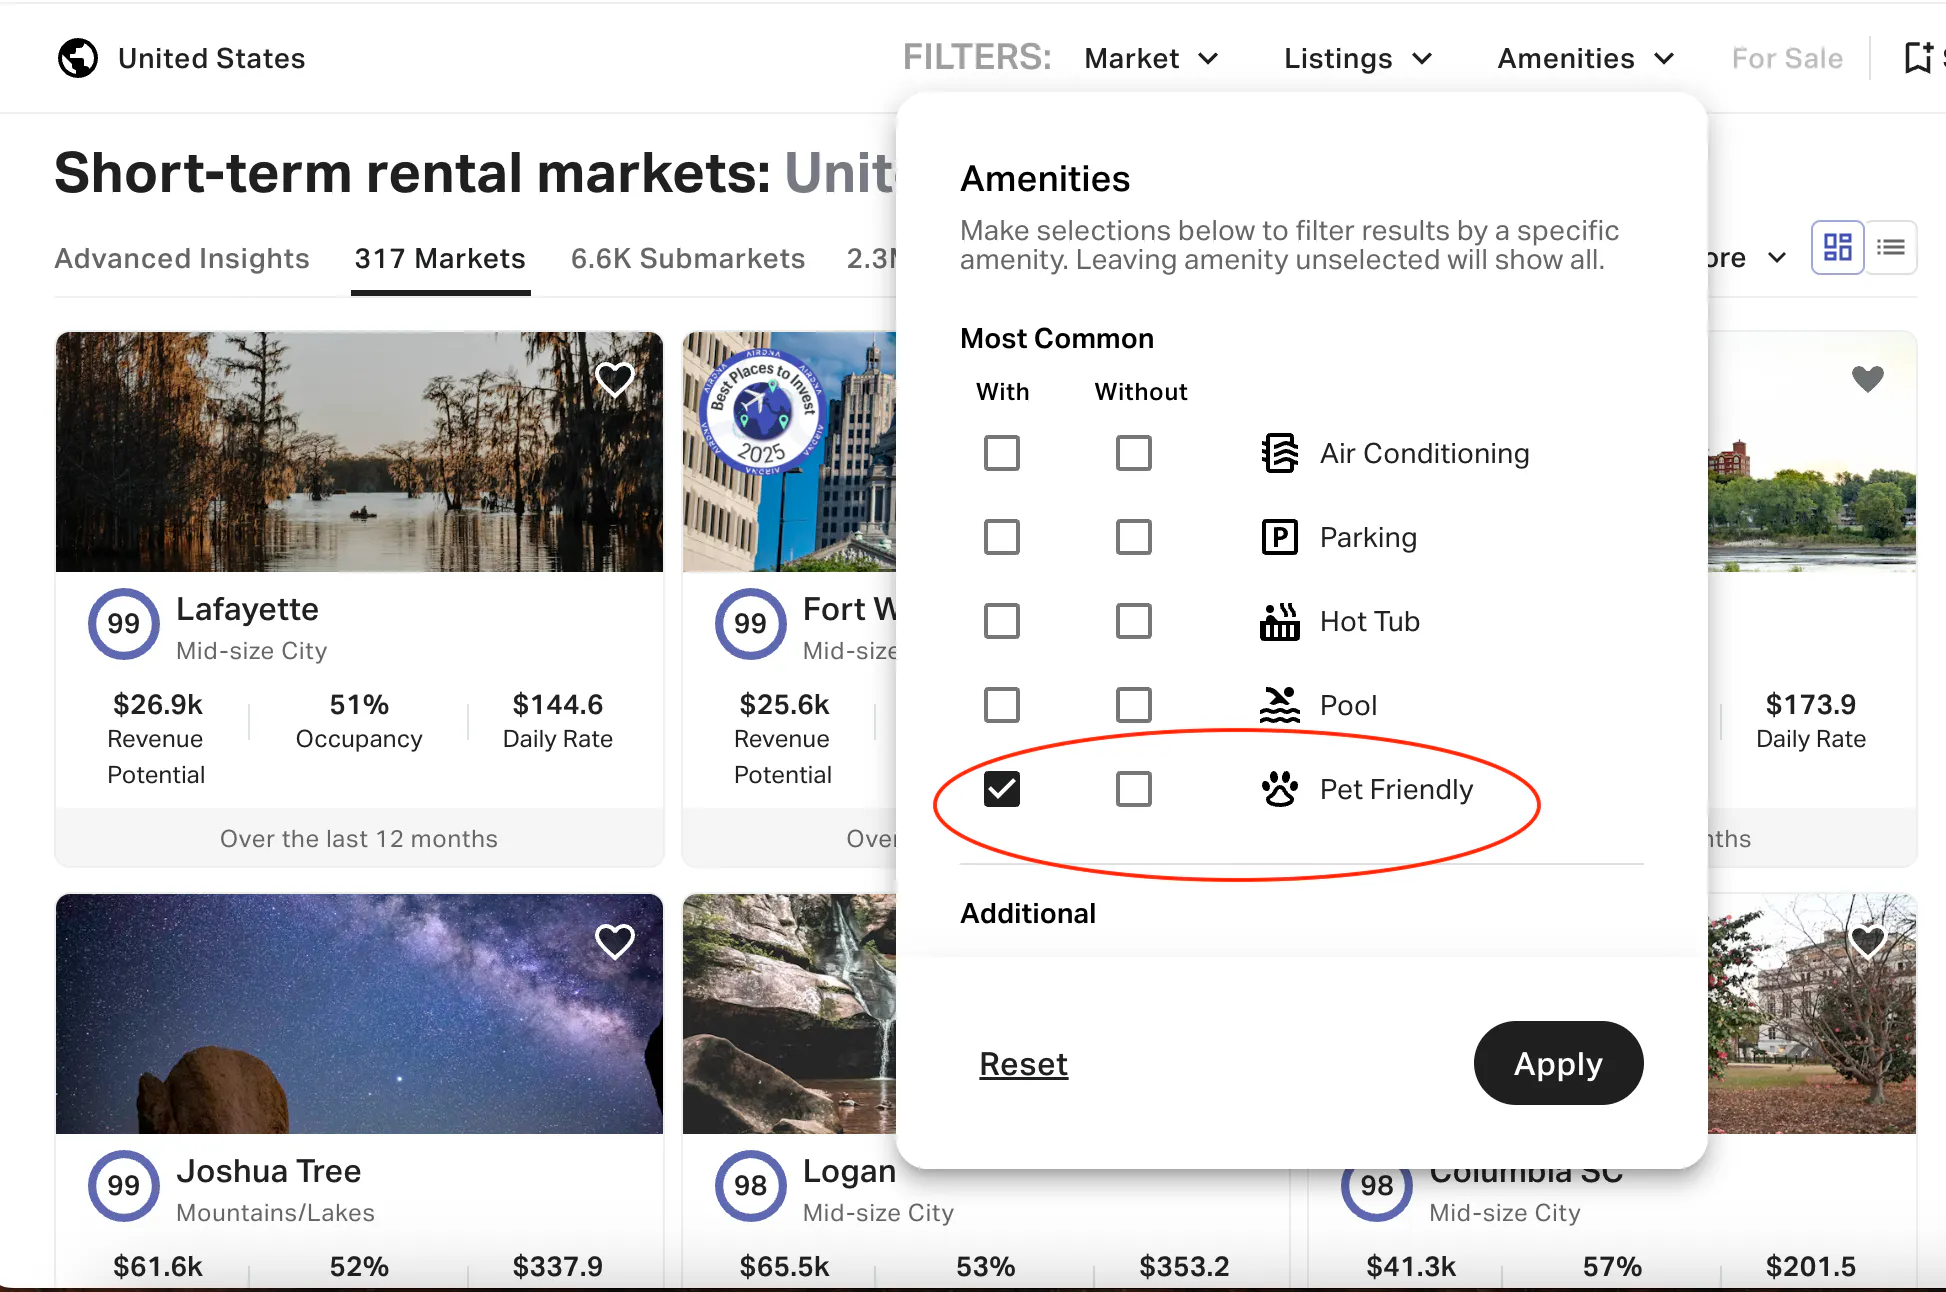
Curious how this trend plays out in your target market? AirDNA’s Amenities filter lets you directly compare the performance of pet-friendly versus non-pet-friendly listings, revealing exactly how much revenue you're leaving on the table by turning away furry travelers.
Suburbs > cities: The new STR sweet spot
The urban exodus represents one of the most significant Airbnb market trends of 2025, dramatically transforming how and where STR investors are finding success. Our analysis reveals Airbnb growth trends too significant to ignore: In 75.5% of large metro areas, suburban listings are growing faster than their urban counterparts.
Kansas City is a great example, where urban listings plummeted 24.5% while suburban listings grew 8.1%—a 32-point differential. Or St. Louis, where urban listings declined 8.3% while suburban growth surged 6.7%. This isn't happening in just a few outlier markets—it's the dominant pattern across three-quarters of major U.S. metros.
So what's driving this suburban advantage? A trifecta of investor-friendly conditions:
- More flexible zoning laws
- Larger properties that command higher nightly rates
- Homes better equipped for the remote work reality that's now permanently embedded in traveler expectations
But here's the critical insight for investors: Supply growth (what our chart shows) is only half the equation. The real opportunity lies in identifying suburban markets where demand growth outpaces supply growth. When supply exceeds demand, you're looking at potential market saturation—a recipe for declining occupancy rates and compressed margins.
Pinpoint top-performing suburban markets with AirDNA
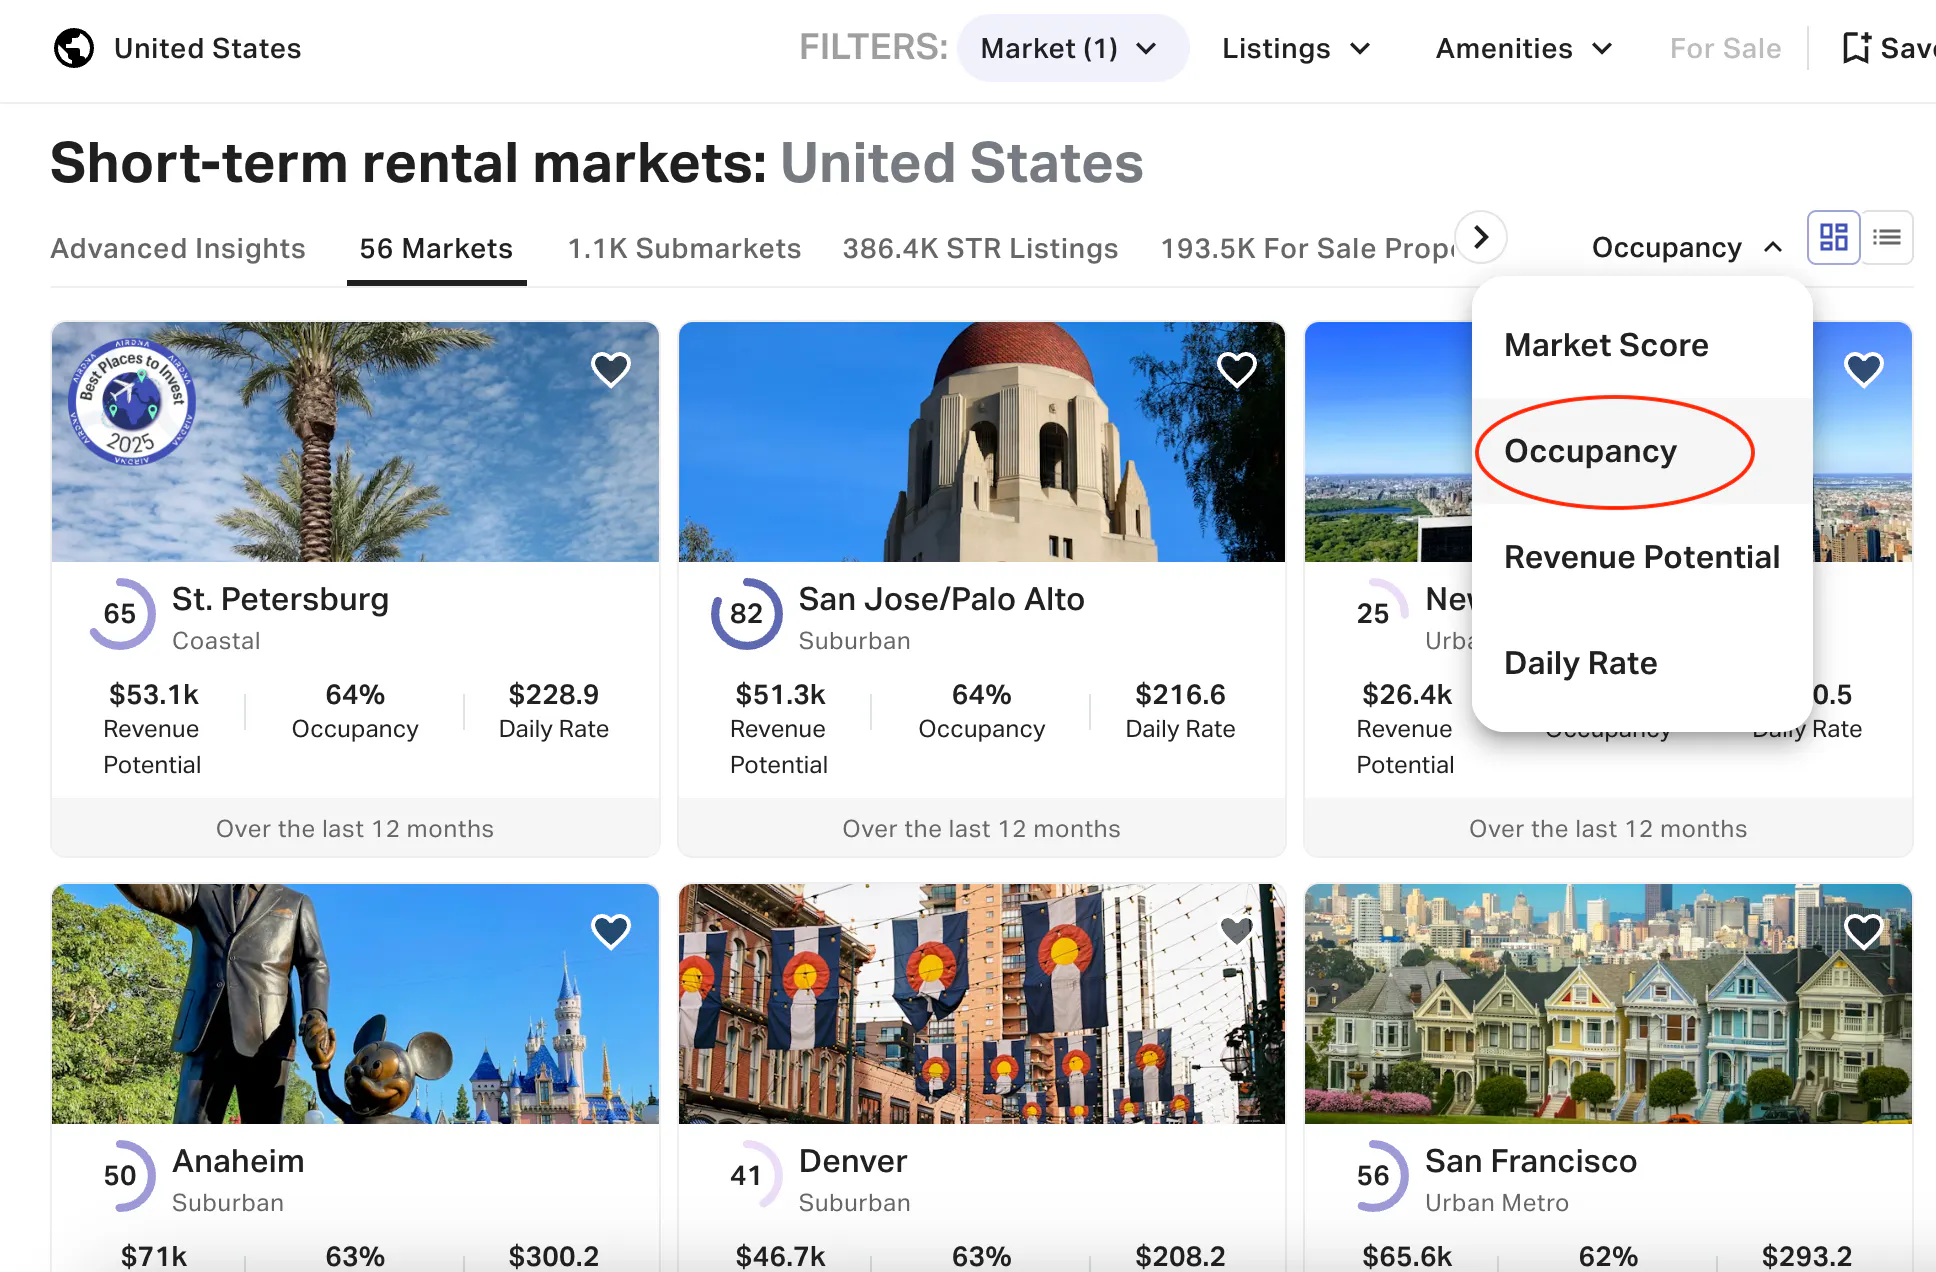
AirDNA’s custom filters make it easy to analyze suburban markets and find the hidden gems. You can simultaneously filter by location type (suburban) and Market Score metrics like occupancy to instantly reveal which suburban areas offer the optimal balance of growth potential and sustainable demand.
Micro Growth Factors Fueling STR Growth
Not all Airbnb growth trends operate at the market level—some are distinctly property-specific, varying dramatically even within the same zip code. These micro factors won't necessarily help you choose which city to invest in, but they'll absolutely determine which properties outperform once you've selected your market.
Unlike macro trends that reshape entire regions, these property-level differentiators depend heavily on local characteristics and traveler preferences unique to each location. Let's examine the three most powerful micro factors driving ROI disparities between seemingly similar properties.
Bigger homes = more bookings (usually)
Larger listings are winning the demand race in 2025. Demand for properties with 6+ bedrooms exploded by 12.61% year-over-year, while 5-bedroom properties saw 10.65% growth. Even 3-bedroom properties outpaced the market average, growing at 7.48%.
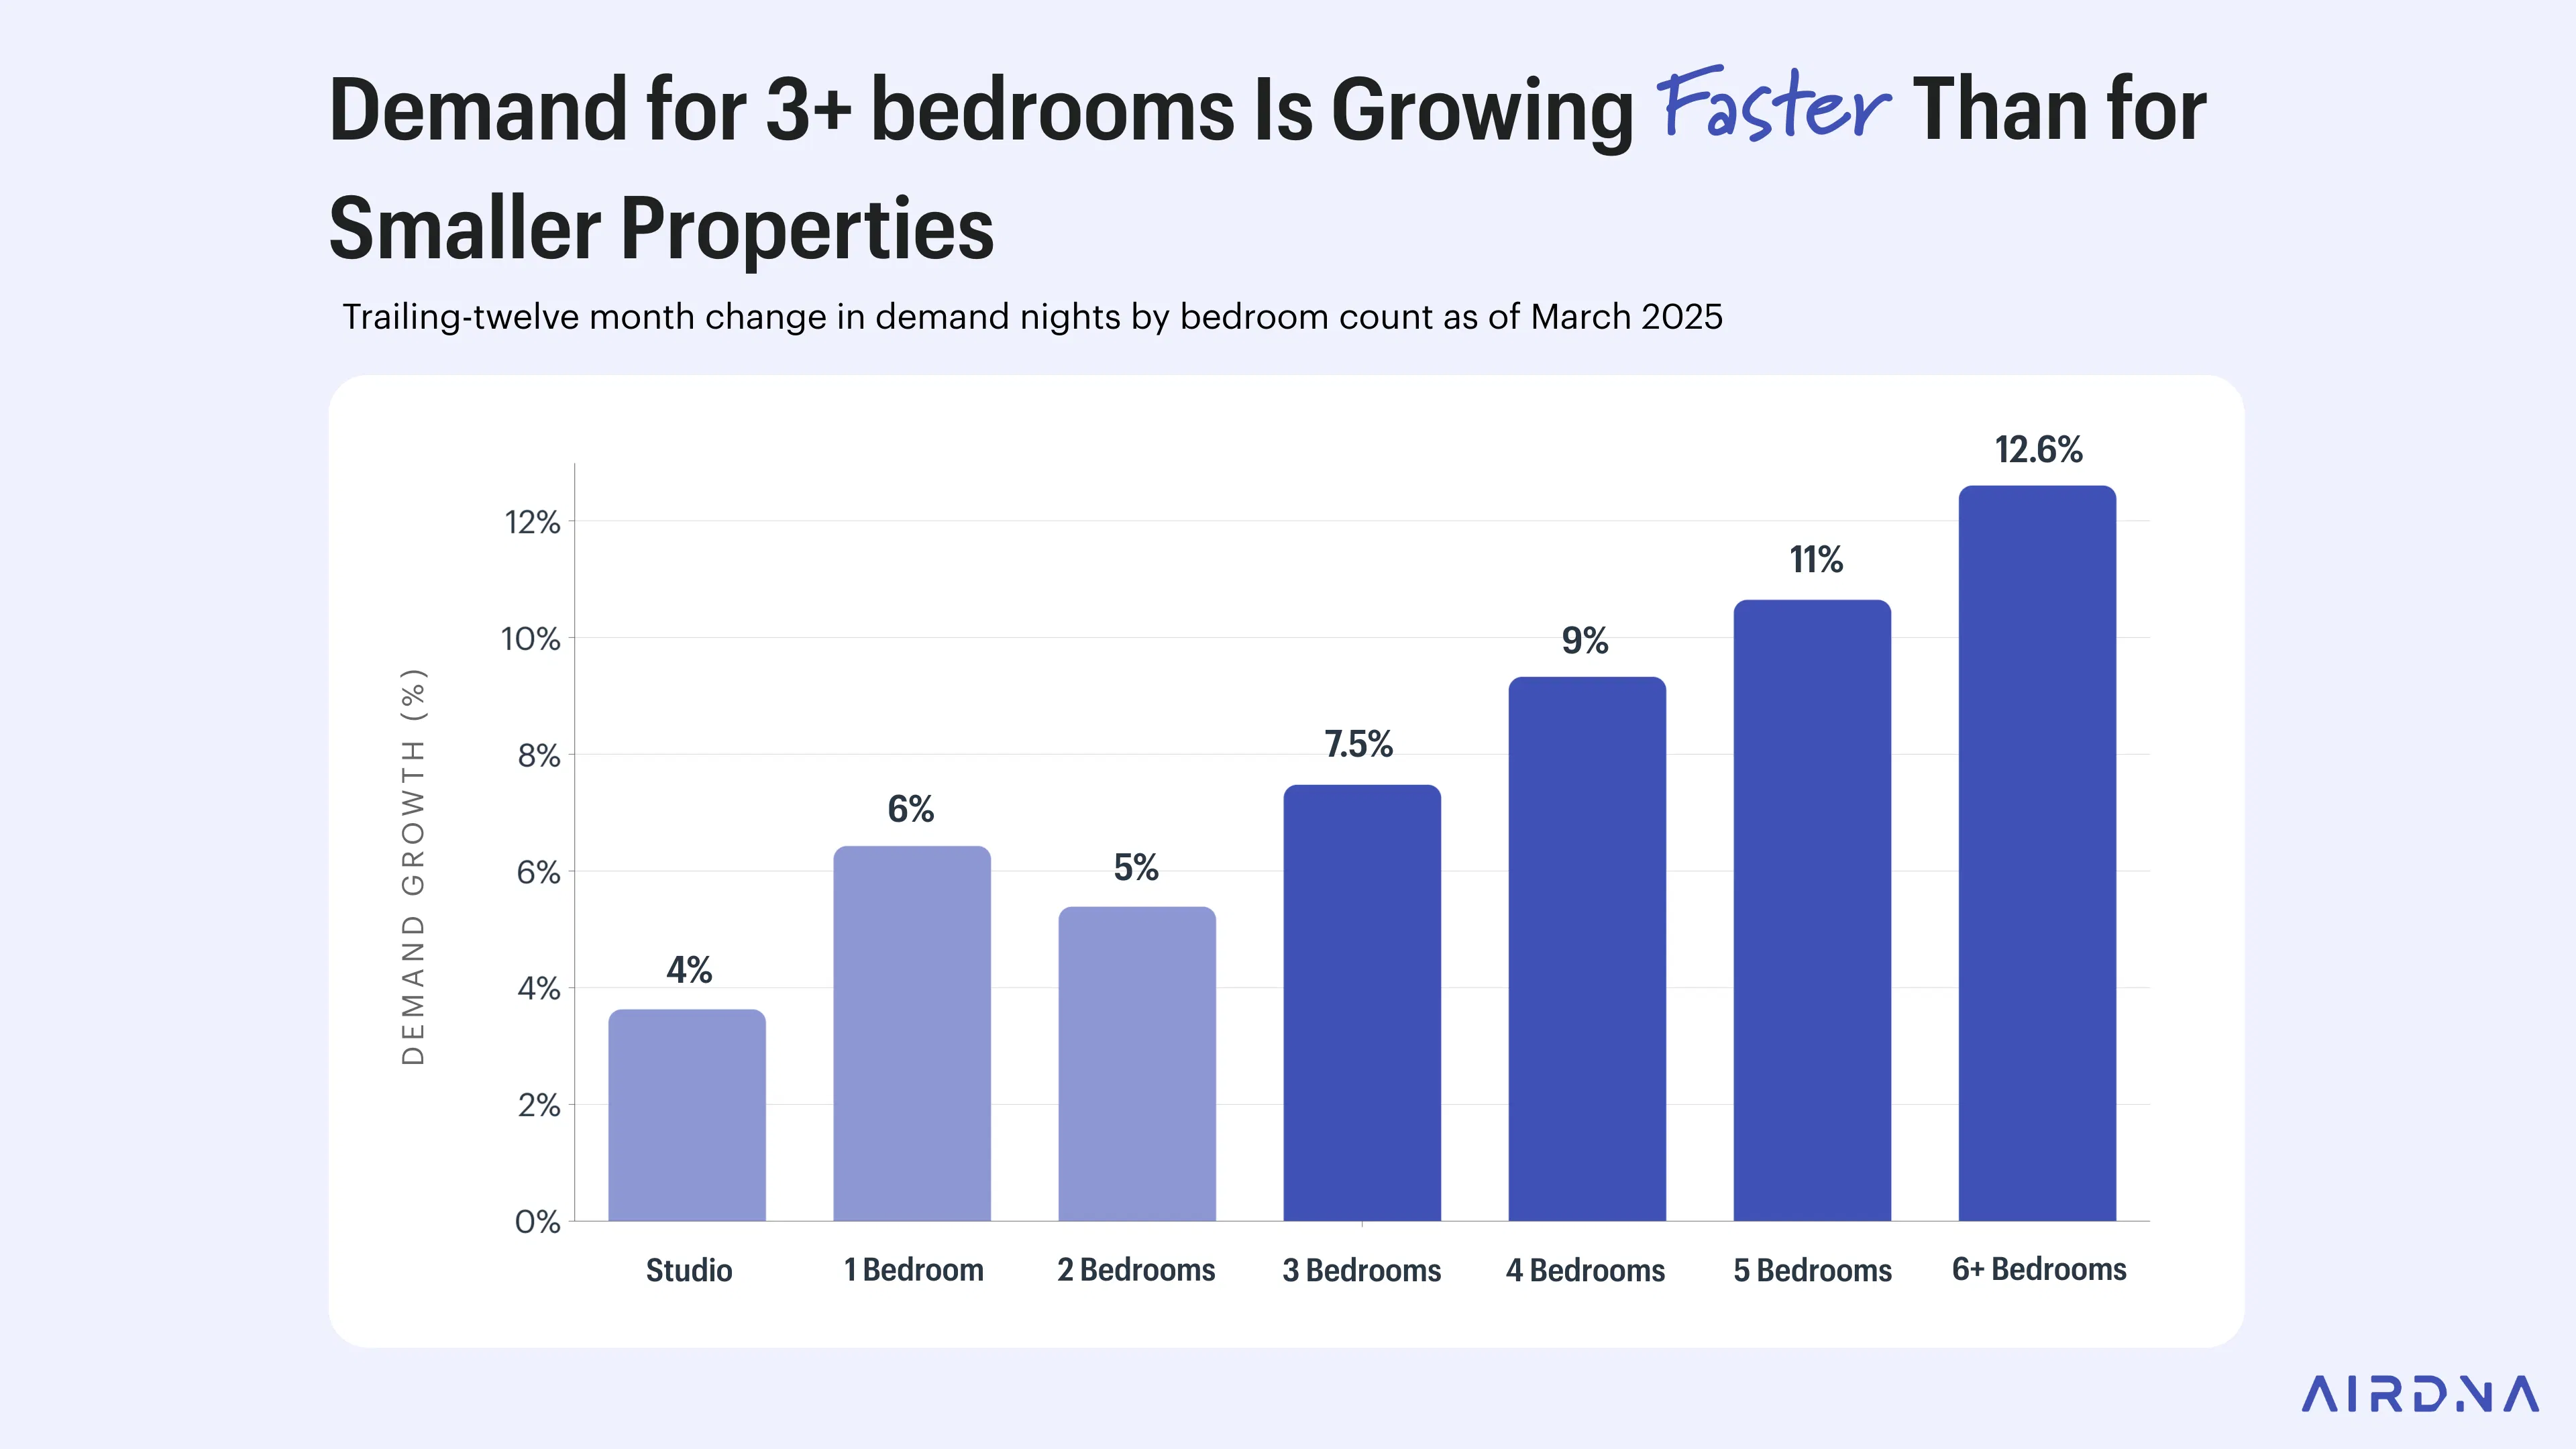
Keep in mind that this isn't a blanket growth driver across all markets. The correlation between a market’s average bedroom count and market-wide demand growth is surprisingly weak. Why? Because each market has its own unique property size mix.
The real insight lies in the tradeoff: While larger homes generate more demand, they also struggle to maintain occupancy. Our analysis shows that markets with larger average bedroom counts typically see lower occupancy rates than those dominated by smaller units.
Vacation hotspots like the Poconos in Pennsylvania (3.5 bedrooms average) achieve occupancy just over 40%, while urban areas with smaller units like New York (1-2 bedrooms average) maintain occupancy above 65%.
This creates a strategic calculation for investors: Larger homes command higher nightly rates but with lower occupancy, while smaller units book more consistently but at lower rates. The optimal choice depends entirely on your market and investment goals.
Analyze bedroom count and occupancy tradeoffs with AirDNA
The bedroom count dilemma doesn't have to be a guessing game. AirDNA empowers you to quantify the property size vs. booking consistency tradeoff in any target market.
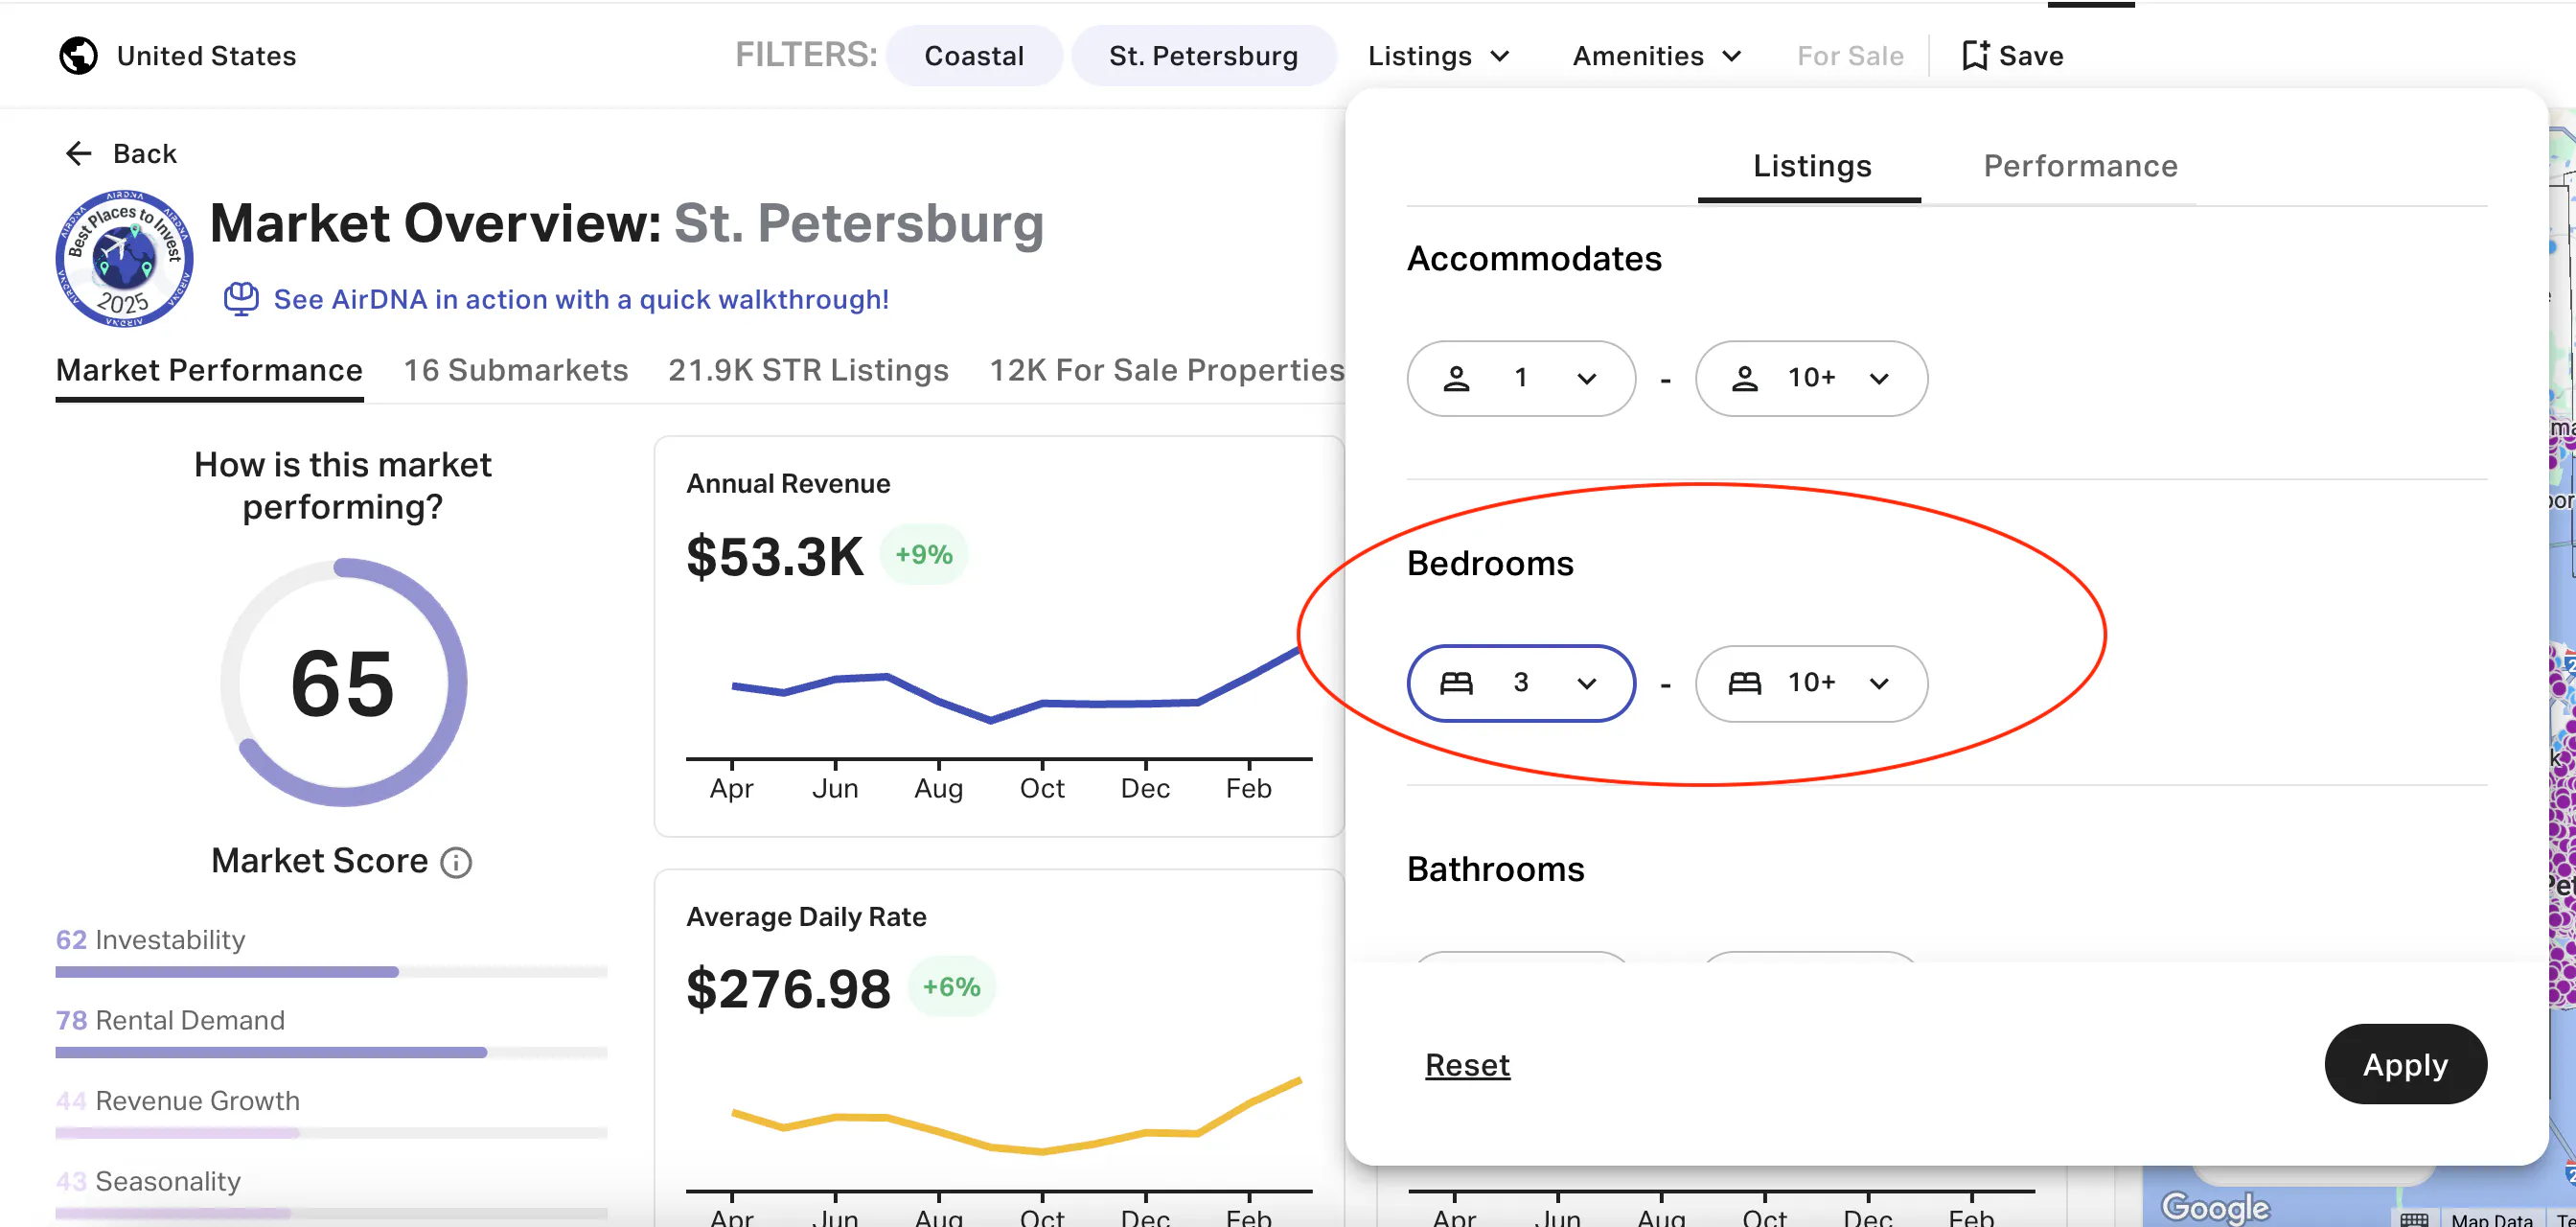
By using AirDNA's custom filters, you can directly compare how properties with different bedroom counts perform within the same market. Select your target location, then filter by bedroom count to instantly see how metrics like average daily rate, occupancy rates, and revenue per available room (revPAR) vary across property sizes.
For investors actively evaluating specific properties, AirDNA’s Rentalizer rental calculator takes the guesswork out of projections. Simply input the address and our algorithm analyzes thousands of comparable properties to generate earnings forecasts based on actual market performance. This allows you to validate demand and ROI potential for different-sized properties before making any financial commitments.
High-end listings are crushing ADR growth
While budget properties struggle to maintain rates, luxury listings are riding a tidal wave of pricing power in 2025. Luxury-tier listings saw average daily rates grow 5.23% year-over-year, while budget listings actually declined by 0.33%.
The relationship between price tier and growth is remarkably consistent, with each step up the pricing ladder corresponding to stronger ADR gains:
- Budget: -0.33%
- Economy: +2.66%
- Midscale: +3.81%
- Upscale: +4.65%
- Luxury: +5.23%
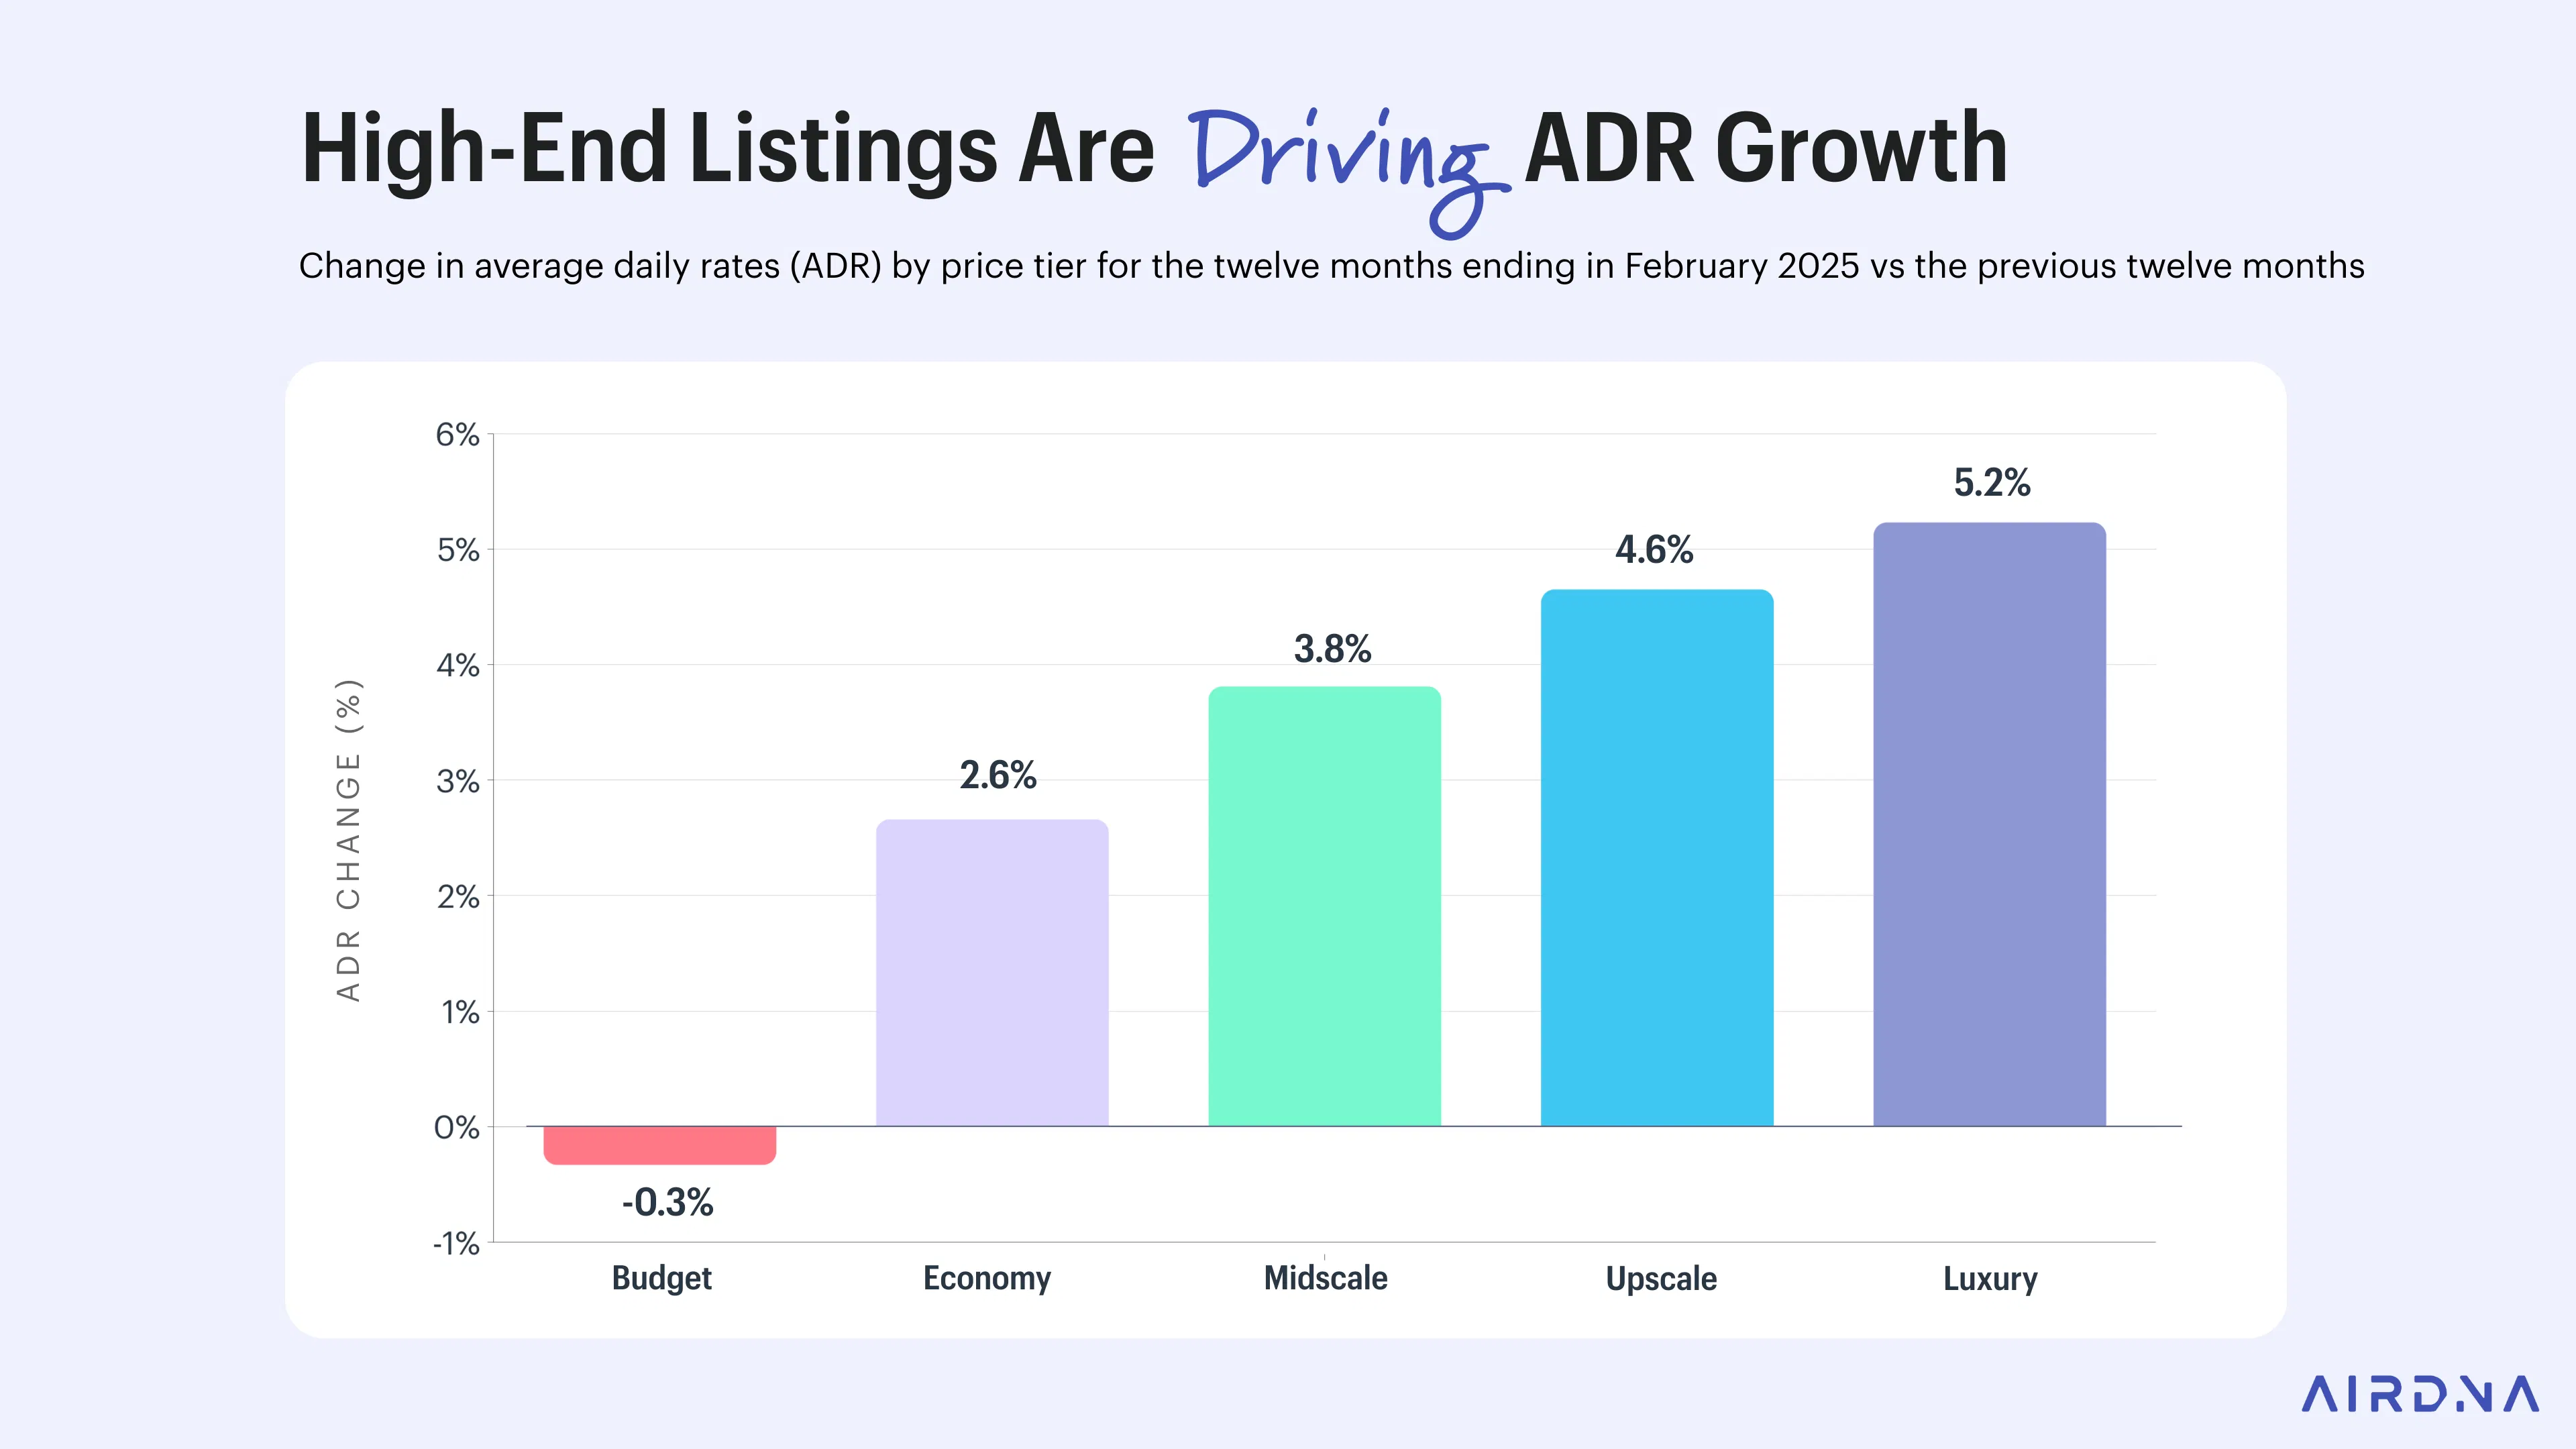
Here's the key takeaway: High-end properties are driving overall market growth. Consider the top performing markets for ADR growth: Steamboat Springs, Colorado saw ADR jump 22.7%, Moab, Utah increased 17.6%, and Pensacola, Florida grew 16.2%.
What do they all have in common? A big gap (7-10%) between what their cheapest and most expensive listings charge. In other words: Expensive properties aren't just growing alongside the market—they're the main force pushing rates higher.
The strategic implication for investors and hosts is clear. Positioning your property in higher price tiers pays dividends. Adding premium amenities and upgrading its visual aesthetics can shift your listing into a more favorable growth category. Even in markets with modest overall ADR growth, the premium tier frequently outperforms—meaning a strategic repositioning can deliver outsized returns regardless of your location.
Regulations make or break urban markets
While urban markets appear stagnant on paper (averaging -0.5% growth nationally), the reality is far more nuanced. This negative average masks an extraordinary regulatory divergence that's creating both winners and losers in urban STR markets.
Our Airbnb industry analysis shows that regulations, not demand, are driving urban market performance. Look at the extremes: New York City's listings plummeted 23.1% as strict Local Law 18 took effect, while Indianapolis has surged an astonishing 33% thanks to its accommodating regulatory environment. Perhaps most telling is Jersey City/Newark's 25% growth, directly benefiting from neighboring NYC's crackdown as investors cross the Hudson seeking friendlier rules.
The top 20 fastest growing markets remain dominated by small and mid-size cities, but urban standouts like Indianapolis (+33%), Jersey City/Newark (+25%), and Cleveland (+20.9%) prove that regulation—not location type—is often the determining factor for urban success.
For investors targeting urban markets, regulatory due diligence is a must. Before purchasing, investigate:
- Zoning restrictions specific to short-term rentals
- Permit requirements and associated costs
- Caps on the number of nights you can rent annually
- Primary residence requirements
Remember: Urban markets showing negative growth aren't necessarily poor investments—they're regulation-constrained investments. The underlying demand often remains strong, which is why cities with favorable regulatory environments continue to experience explosive growth despite the broader urban slowdown.

FAQs
Is Airbnb growth slowing in 2025?
No, Airbnb growth isn’t slowing—it’s growing an average of 4-6% nationally. Of course, growth varies dramatically by location type and property characteristics.
Small city and rural markets are experiencing explosive growth (13.76% year-over-year), while urban markets are seeing slight declines (-0.5%) primarily due to regulatory constraints.
The growth narrative isn't about slowing—it's about redistribution, with clear winners (suburban, pet-friendly, luxury-tier) and underperformers (urban cores, budget listings) emerging in 2025.
Which regions show the fastest STR growth right now?
Regions showing the fastest STR growth right now are small cities and rural, with listing increases of 13.76% year-over-year.
Indianapolis (+33%), Jersey City/Newark (+25%), and Cleveland (+20.9%) stand out as the fastest-growing urban markets, while suburban areas surrounding major metros consistently outpace their urban cores in 75.5% of large cities.
Kansas City suburbs (+8.1%), St. Louis suburbs (+6.7%), and Dallas suburbs (+8.6%) show particularly strong growth despite their urban cores experiencing declines. The Midwest and Southeast regions generally show stronger growth patterns than the heavily regulated coastal markets.
What is the STR 2025 forecast?
The 2025 STR market forecast calls for continued growth averaging 4-6% nationally, with increasing segmentation between high and low performers. Small cities and rural areas will maintain their significant growth advantage, while luxury-tier properties will see the strongest ADR increases.
Regulatory developments will remain the single biggest variable affecting urban markets. The suburban advantage will likely continue as flexible work arrangements remain permanent, with further growth in pet-friendly accommodations and larger properties (3+ bedrooms).
For detailed projections by market, our comprehensive 2025 Outlook Report provides in-depth analysis and forecasting.
Is Airbnb profitable in 2025?
Yes, Airbnb growth trends indicate that short-term rentals remain profitable in 2025, but success is increasingly location-specific and property-dependent.
The national average ROI for STRs is holding steady at 10-15%, but this masks dramatic variations across markets and property types.
For investors who strategically target high-growth areas like suburban markets outside regulatory-friendly cities and focus on in-demand property characteristics (3+ bedrooms, pet-friendly amenities), average daily rates and occupancy rates combine to deliver returns significantly above those of traditional long-term rentals.
ARTICLE SUMMARY
See who’s thriving in the STR industry in 2025. We cover 6 Airbnb growth trends in small cities, pet-friendly listings, suburbs, larger homes, luxury properties, and regulation-friendly markets.
Bram Gallagher
AirDNA Director of Economics and Forecasting
Bram Gallagher is an Economist at AirDNA, specializing in uncovering insights that drive smarter short-term rental decisions. He put his Ph.D. in Economics from the University of Georgia to work researching and forecasting hotel data with CBRE prior to joining AirDNA, as well as teaching economics at a number of universities. In his spare time, Bram enjoys making wooden furniture with hand tools.