

 Calculate Revenue
 Research Markets
 Find For Sale Properties
 Compare My Listing
 STR Revenue Calculator
 Custom Comp Sets
 Submarket Insights
 Custom Search Filters
 Rate Recommendations
 Performance Benchmarking
 Competitor Comparison
 Owner Contact Details
 Property-level performance data
 Tourism Insights
 Real Estate Investment Analytics
 About Us
 Sales
Sales Support
 Press
PressThe Fastest Growing STR Markets in 2025 Revealed
Published: April 29, 2025
Last updated: September 8, 2025

Jamie Zhang
Key Takeaways
- The fastest growing STR markets in 2025 demonstrate demand growth that outpaces supply growth.
- International markets like Saudi Arabia (110% YoY growth) and Venezuela (73%) are leading global short-term rental market growth in 2025.
- Within the U.S., small cities and rural areas are outperforming urban centers overall, while emerging Airbnb markets like Jersey City/Newark, New Jersey (38% YoY demand growth) and Red River Gorge, Kentucky (36%) show exceptional momentum.
The race to identify untapped opportunity in short-term rental markets is only intensifying as we move deeper into 2025. For investors eyeing their next acquisition, data reveals that certain regions are experiencing unprecedented momentum while others show early warning signs of saturation.
Based on AirDNA's comprehensive analysis of global and domestic markets, we've identified which destinations are truly accelerating—not just in listing count, but in the much more critical metric of guest demand. These markets offer that rare combination investors chase: Upward trajectory with room for growth.
If you're considering your first property purchase or expanding an existing portfolio, this data-backed breakdown of the fastest growing STR markets in 2025 provides the intelligence you need to make informed decisions.
How to Measure Growth in Short-Term Rental Markets
Before jumping into our rankings, let’s quickly get on the same page about how we define and measure growth in short-term rentals. Two fundamental metrics reveal the complete picture: Supply and demand.
Supply is measured through available listings—the total count of active rentals in a market over a specific time period. When this number increases year-over-year, it signals investor confidence in a location's potential.
Demand is captured through demand nights—the total number of booked nights during the reporting period. This metric directly reflects actual guest interest and booking behavior, not just speculative investment.
These metrics are not created equal. From an investor's perspective, demand trumps supply every time. While supply growth indicates other investors see opportunity (a positive validation signal), this becomes a liability if it outpaces demand. The sweet spot is where demand growth maintains a healthy lead over supply growth—ensuring both market momentum and pricing power for hosts.
For our analysis of the fastest growing STR markets in 2025, we present rankings for both supply and demand growth separately, then provide combined rankings that prioritize markets where demand growth outpaces supply—the precise conditions that maximize Airbnb profitability forecast potential.

Fastest Growing Global Short-Term Rental Markets (2025)
International markets capture some of the most dramatic growth stories in the short-term rental industry this year, with several regions showing double- and even triple-digit percentage increases. Let's take a look at which countries are seeing true momentum in both supply and demand:
Supply growth leaders
- Saudi Arabia (104% year-over-year or YoY)
- Pakistan (67%)
- Egypt (64%)
- Bolivia (58%)
- Venezuela (57%)
Demand growth leaders
- Saudi Arabia (110% YoY)
- Venezuela (73%)
- Kazakhstan (70%)
- Albania (68%)
- Egypt (64%)
But here's what you have to remember: Rankings by individual metrics tell only part of the story. The best fast-growing STR markets are where demand outpaces supply, creating that golden ratio investors should prioritize.
Fastest growing markets where demand outpaces supply
- Saudi Arabia
- Venezuela
- Kazakhstan
- Albania
- Morocco
- Chile
- El Salvador
- Bolivia
- Japan
- Brazil
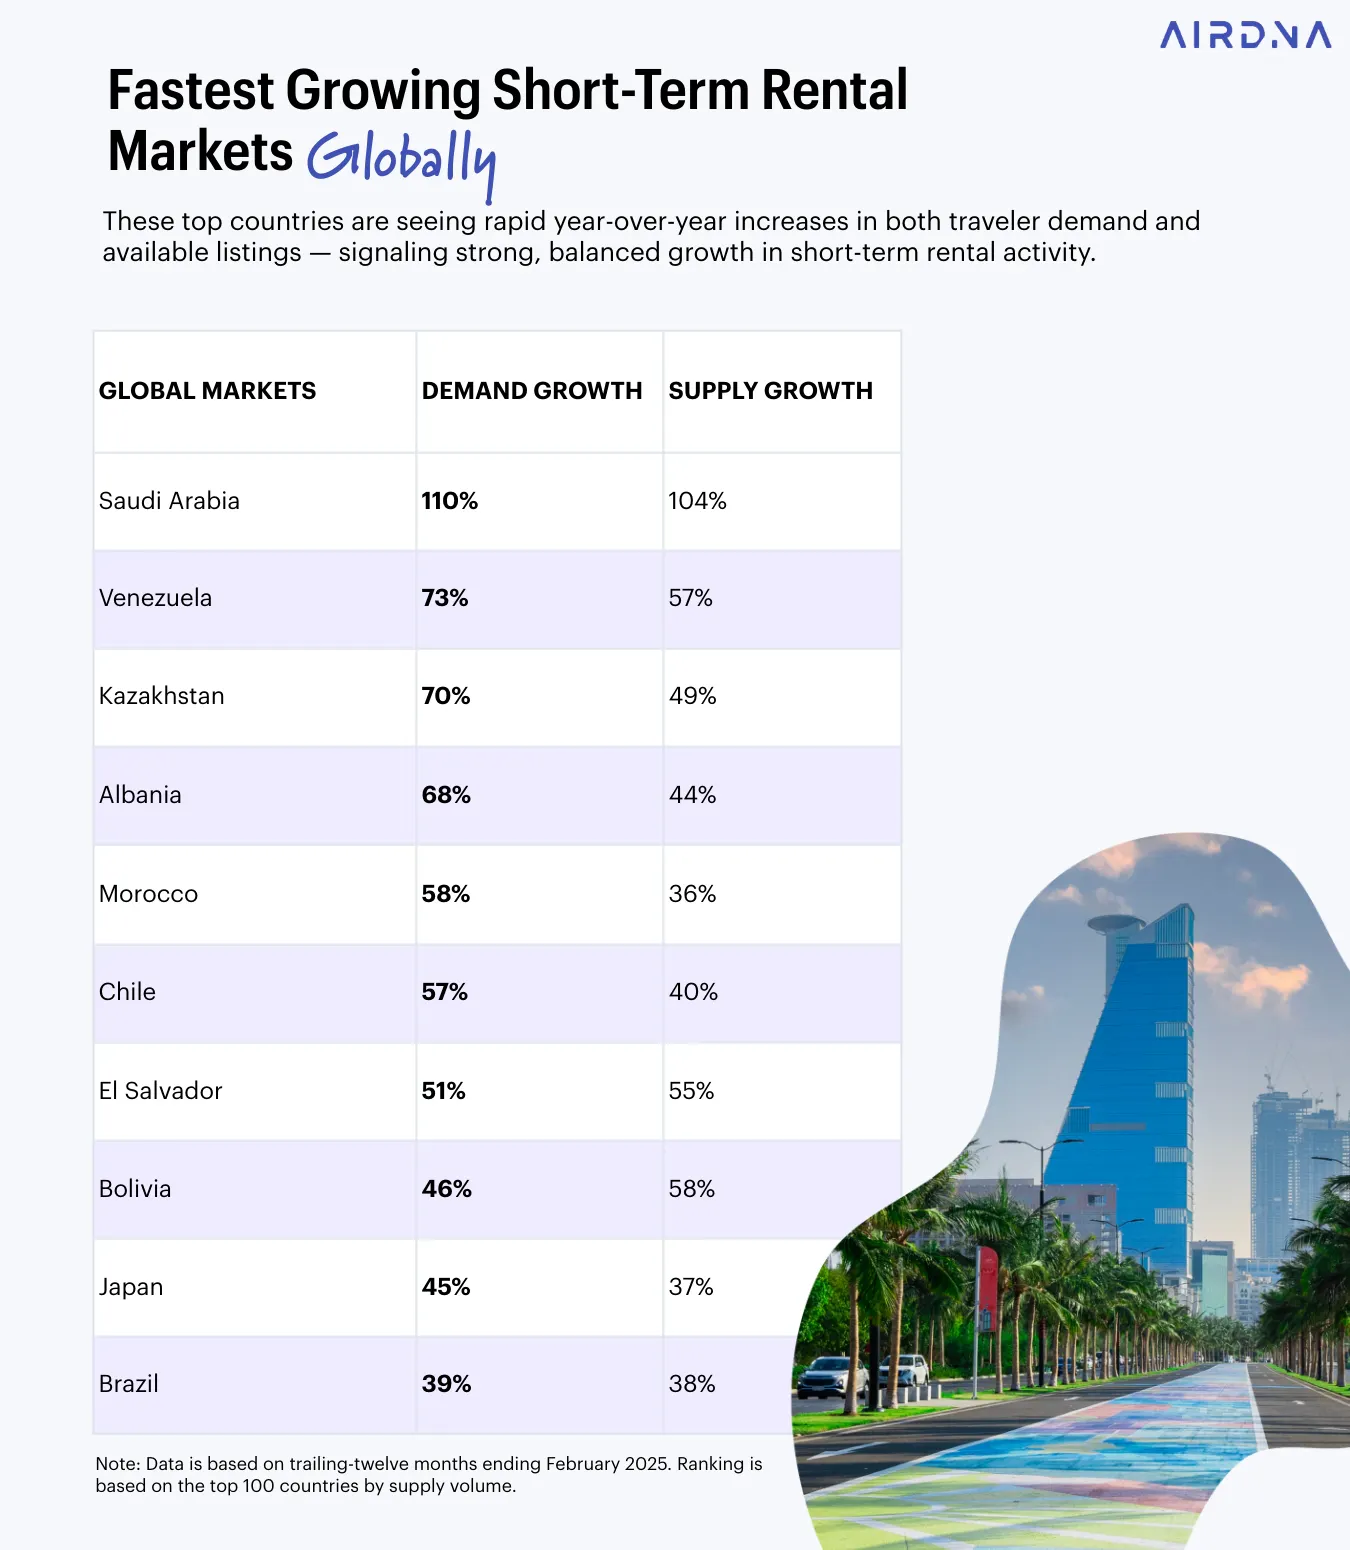
So why do certain supply growth leaders fail to make the top 10 list in the chart above? It’s because although they may win the supply race, their demand growth isn’t up to snuff—or vice versa.
Pakistan illustrates this principle perfectly. Despite impressive supply growth (67%), it doesn't make our combined rankings due to comparatively weaker demand. Similarly, several countries show warning signs of potential oversaturation:
- Egypt: 64% for both supply and demand growth YoY
- Bolivia: 58% supply growth vs. 46% demand growth
- Argentina: 53% supply growth vs. 41% demand growth
These imbalances create potential pricing pressure that investors should approach with caution.
Honorary mentions
Beyond the top performers, several additional markets demonstrate noteworthy rising rental demand that deserves attention:
- Sri Lanka: (57% YoY)
- Peru: (50%)
- Nigeria: (43%)
- Uruguay: (40%)
- Ghana: (40%)
- United Arab Emirates: (39%)
- Tunisia: (39%)
- Thailand: (39%)

What's driving global STR growth in certain countries?
Three primary factors:
- Regional economic development
- Tourism growth expansion initiatives
- Post-pandemic travel pattern stabilization
For example, Saudi Arabia's extraordinary numbers reflect its massive Vision 2030 tourism investment program, while Venezuela's surge represents recovery from years of economic turbulence.
Remember that growth metrics should never be considered in isolation. The most promising Airbnb investment opportunities combine these performance indicators with regulatory stability, infrastructure development, and favorable local economic conditions.
Discover hidden gems for your next investment
Get granular insights into which neighborhoods are hottest for vacation rentals.
U.S. Short-Term Rental Trends: Demand Soars Outside Big Cities
Forget what you thought you knew about prime STR locations in the U.S.—2025 has flipped the script. The glitzy downtown high-rises and trendy urban neighborhoods? They're taking a backseat to an unlikely hero: Small towns and rural retreats.
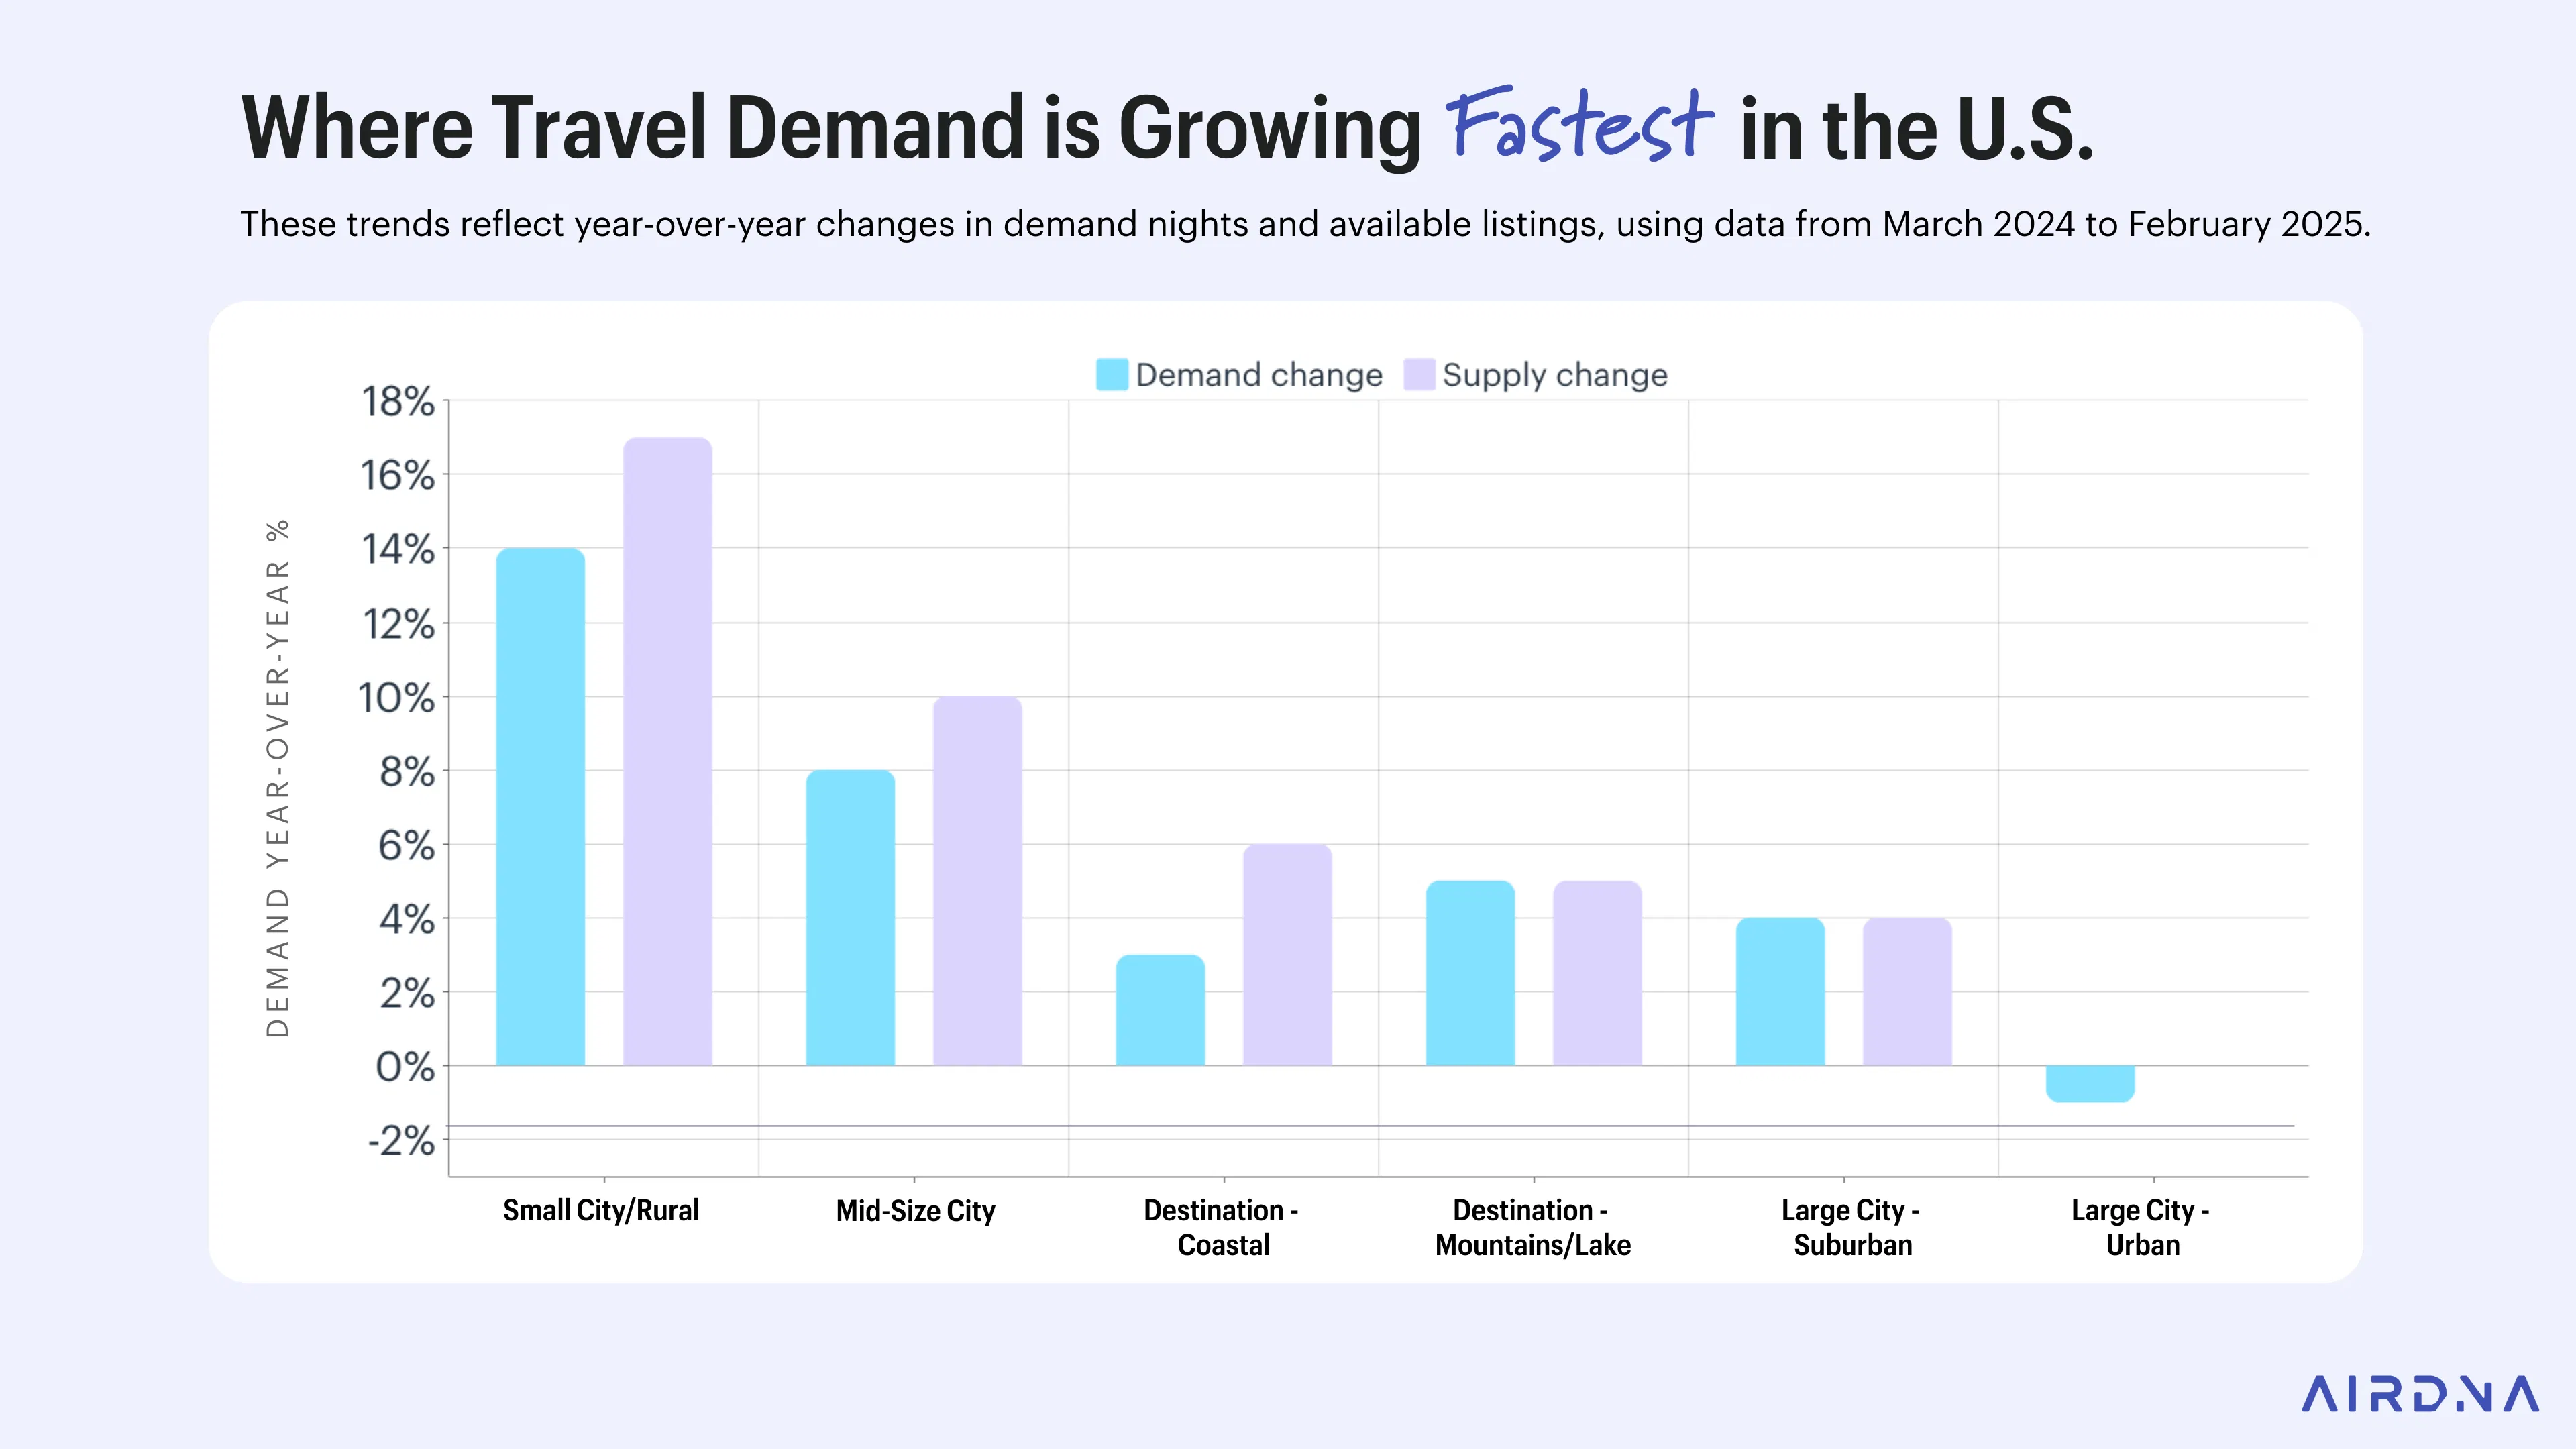
As the chart above illustrates, small city and rural markets are crushing it with a remarkable 14% demand growth and 17% supply growth year-over-year. Meanwhile, demand for urban cores is actually on the decline.
This "zoom out" phenomenon is transforming the short-term rental investment playbook. Properties in the periphery—those small, charming towns you might have driven past without a second glance—are now outperforming their big-city cousins by margins that you might have once thought impossible.
So what's behind this rural renaissance? Three powerful forces:
1. Lower upfront investment
First, the dollars and cents make too much sense to ignore. While you might need a small fortune (and a large mortgage) for that downtown condo, peripheral areas offer entry points that won't make your accountant wince. The return potential? Often dramatically higher.
2. Few regulations
Second, regulatory red tape has created a striking contrast in opportunity. As urban markets tangle hosts in increasingly complex restrictions, smaller municipalities are rolling out the welcome mat—sometimes explicitly positioning themselves as havens for STR entrepreneurs seeking regulatory stability.
3. More space
Third, space is the new luxury. These growing markets offer what urban markets physically can't: Extra bedrooms, outdoor areas, and the elbow room that today's travelers will happily pay premium rates to enjoy. The average listing in these booming regions boasts nearly a full extra bedroom compared to their urban counterparts—a feature that translates directly to higher nightly rates and occupancy during peak family travel periods.
This evolution perfectly aligns with broader real estate market outlook indicators showing that flexibility and foresight continue to separate winning investors from the pack.
Below, we dig into exactly which U.S. cities are leading this charge.

Fastest Growing U.S. Short-Term Rental Markets (2025)
AirDNA data reveals precisely which U.S. markets are emerging as the true standouts among the fastest growing STR markets in 2025. These cities represent concrete opportunities where investor momentum and guest demand have reached remarkable velocity.
Supply growth leaders
- Indianapolis, Indiana: (33% year-over-year or YoY)
- Bloomington, Indiana: (28%)
- Tuscaloosa, Alabama: (28%)
- Killeen, Texas: (26%)
- Ocala, Florida: (25%)
Demand growth leaders
- Jersey City/Newark, New Jersey: (38% YoY)
- Red River Gorge, Kentucky: (36%)
- Ocala, Florida: (35%)
- College Station, Texas: (34%)
- Cleveland, Ohio: (33%)
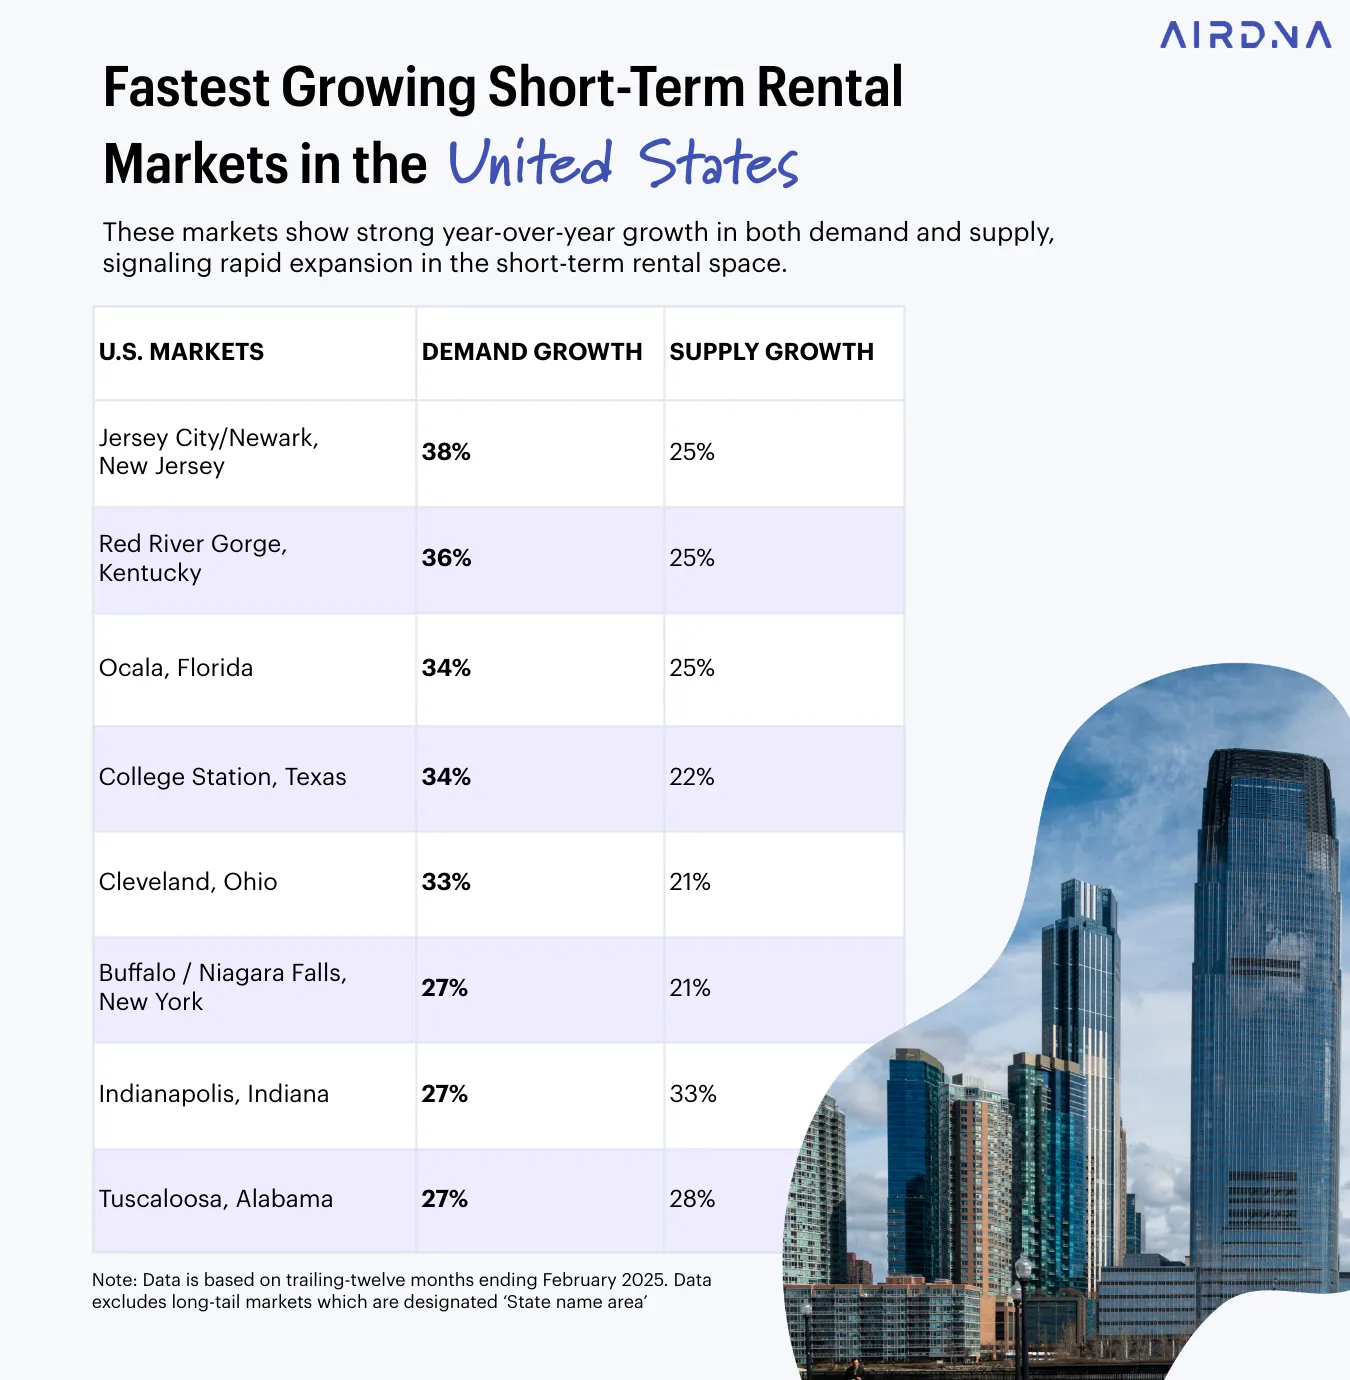
Fastest growing markets where demand outpaces supply
- Jersey City/Newark, New Jersey
- Red River Gorge, Kentucky
- Ocala, Florida
- College Station, Texas
- Cleveland, Ohio
- Buffalo/Niagara Falls, New York
- Indianapolis, Indiana
- Tuscaloosa, Alabama
A closer look at the fastest growing U.S. STR markets
First, the Jersey City/Newark revolution showcases regulatory dynamics at their most consequential. As New York City clamps down on short-term rental market growth with some of the nation's strictest regulations, demand simply migrated across the Hudson River. This regulatory arbitrage creates a compelling opportunity for investors who recognize the pattern.
Another pattern worth dissecting: Ocala's appearance on both lists, which signals particularly strong fundamentals. This central Florida destination combines the state's established vacation appeal with significantly lower entry costs than coastal hotspots, resulting in exceptional ROI potential.
Tuscaloosa presents a more nuanced case study. With supply growth only marginally outpacing demand growth (28% vs. 27%), investors should conduct deeper research before diving in. The key question to ask: Are ADRs and revPARs holding steady despite growing inventory? If hosts maintain pricing power even as supply expands, that's a powerful indication of a healthy market.
Finally, beyond our top-ranked destinations, there are a couple additional markets that deserve honorable mentions for their impressive demand growth:
- Lafayette, Louisiana: 30%
- McAllen, Texas: 28%
Overall, these fast-growing Airbnb cities represent diverse investment profiles, from college towns to outdoor recreation hubs. The common thread? They all demonstrate that there are still explosive growth opportunities for STR investors willing to look beyond flashy cities.

Research Airbnb Markets
Gain insights into the revenue and occupancy trends in your market.
Our Methodology: How AirDNA Identifies Growth Markets
Let's pull back the curtain on how we compiled our list of the fastest growing STR markets in 2025. Our approach focuses on identifying sustainable Airbnb market trends that translate to actual investment potential.
Our analysis draws from our proprietary database tracking over 10 million listings globally. For this 2025 report, we've analyzed trailing 12-month data ending February 2025, capturing a complete annual cycle to neutralize seasonal fluctuations that might otherwise distort growth signals.
We didn't want to muddy the waters with tiny markets or overly broad regions, so we used specific filtering criteria:
- Only markets within the top 100 by absolute supply and demand volume were considered
- We excluded "state area" zones to focus on discrete, targetable markets
- Growth percentages were calculated using year-over-year comparisons of identical time periods
There is a critical nuance to keep in mind when interpreting growth percentages: Raw percentage increases can be misleading without context. A 100% growth rate signifies very different investment opportunities depending on baseline market size.

For example, consider how a tiny market with 10,000 annual demand nights growing at 100% reaches just 20,000 nights—still relatively small in absolute terms. Meanwhile, a mid-sized market with 500,000 demand nights growing at a more modest 50% adds 250,000 new demand nights—and creates substantially more actual booking opportunities despite the lower percentage growth.
While our growth metrics provide valuable directional insights, you should treat them as a launching point for deeper market analysis. Four additional factors deserve equal consideration:
- Local regulations and ordinances
- Acquisition costs
- Seasonality
- Competitive intensity
Ready to dig deeper? Check out these resources to take your analysis to the next level:
FAQs
How do I know if an STR market is actually “emerging”?
You’ll know an STR market is actually “emerging” if it shows consistent demand growth that outpaces supply growth over 6-12 months.
Key indicators include rising ADRs despite inventory increases, lengthening booking windows, and improving occupancy rates during traditional shoulder seasons.
Always validate these metrics across multiple consecutive quarters to distinguish genuine emergence from seasonal spikes.
For a comprehensive framework to identify and evaluate emerging markets, check out our detailed guide: How to Find Emerging STR Markets
Where is the best place to Airbnb in 2025?
Some of the best places to Airbnb in 2025 are Jersey City/Newark (+38% demand growth) and Red River Gorge, Kentucky (+36%), and Ocala, Florida (+35%).
Outside the U.S., some of the fastest growing STR markets in 2025 are Saudi Arabia, Venezuela, Kazakhstan, Albania, and Morocco.
What are the best markets for short-term rentals?
The best short-term rental investment markets are currently small city/rural markets (14% YoY demand growth), which significantly outperform urban cores. College towns like Bloomington and Tuscaloosa offer reliable demand, while outdoor recreation hubs like Red River Gorge capitalize on the continued surge in experiential travel.
What are the most STR-friendly states?
The most STR-friendly states in 2025 are Florida, Indiana, Texas, Georgia, and Arizona, based on a combination of statewide legislation and local implementation. These states have established clear, consistent regulatory frameworks that allow hosts to operate with reasonable compliance requirements. Florida stands out for its 2023 legislation limiting local governments' ability to impose excessive restrictions on short-term rental market growth.
Are urban STRs dead—or are some bouncing back?
Urban STRs aren't dead, but they're highly segmented. Large city centers continue to struggle with declining demand (-1% YOY) and restrictive regulations, while suburban and second-tier urban markets show selective resilience. Cleveland and Jersey City demonstrate that emerging Airbnb markets can exist within urban contexts when they offer value advantages over nearby high-cost markets.
Calculate potential earnings
Understand the investment potential of any address in the world.
ARTICLE SUMMARY
This analysis reveals 2025's fastest growing short-term rental (STR) markets globally and domestically, highlighting where demand outpaces supply, while analyzing how regulations, location types, and property features impact investment potential.
Jamie Zhang
AirDNA Data Analyst
Jamie Zhang is a Data Analyst at AirDNA, leveraging her background in data science and analytics to uncover key trends in the short-term rental industry. Before joining AirDNA, she worked as a data analyst at Shanghai Disney, where she specialized in revenue forecasting and financial planning . She holds a Master’s degree in International Economics and International Relations from Johns Hopkins. Jamie enjoys cycling to explore different corners of the city.
