

 Calculate Revenue
 Research Markets
 Find For Sale Properties
 Compare My Listing
 STR Revenue Calculator
 Custom Comp Sets
 Submarket Insights
 Custom Search Filters
 Rate Recommendations
 Performance Benchmarking
 Competitor Comparison
 Owner Contact Details
 Property-level performance data
 Tourism Insights
 Real Estate Investment Analytics
 About Us
 Sales
Sales Support
 Press
PressThe Real Way to Value Rental Properties: Occupancy First
Published: April 17, 2025
Last updated: September 25, 2026

Bram Gallagher
Key Takeaways
- A higher occupancy rate can increase a property’s value and a market’s investability.
- Optimizing occupancy through dynamic pricing and strategic promotions costs almost nothing but delivers substantial returns.
- Look beyond annual occupancy averages to value a property—instead, assess occupancy by season, day of week, and special events.
Occupancy rates silently dictate the fate of your real estate portfolio—unfortunately, a lot of investors remain oblivious to their power.
Long-term rental investors might get by checking their vacancy once a year and celebrating a 95% occupancy rate with a 12-month lease. But short-term rental (STR) investors are tracking a completely different animal. When your property rents by the night instead of by the year, occupancy becomes a daily battle with vastly different stakes and strategies.
Too many investors throw money at properties without understanding this fundamental metric. But if you can't confidently analyze short-term rental occupancy, you're gambling, not investing. In this piece, we explain exactly how occupancy rates should impact market and property valuations—and how they should drive your next investment decision.
Need a refresher on occupancy rates? Jump to the section Occupancy Rates: A Quick Overview.
Smart investments happen here.
AirDNA’s powerful yet easy-to-use tools make hosting and investing a breeze. This means having every insight you need, all in one place, always up-to-date.
How Occupancy Rates Impact Rental Market Analysis
Raw occupancy data is market intelligence in its purest form. When properly analyzed, occupancy rate patterns reveal abstract forces like guest behavior and market demand.
Consider the difference between these two properties with an average 75% annual occupancy:
- Property A: Maintains steady 75% occupancy year-round
- Property B: Hits 95% occupancy in summer months but drops to 55% in winter
While both show identical 75% annual occupancy, Property B might generate substantially higher revenue by capturing peak-season rates during high-demand periods. When summer rates are double or triple off-season prices, the revenue difference becomes dramatic despite the identical annual occupancy percentage.
Tracking occupancy patterns will reveal predictable demand surges, seasonal compression periods, and weekday/weekend differentials that directly impact rental income projections.
Benchmarking: See how you stack up against competitors
The most dangerous phrase in STR investing? "My property is doing well." Well compared to what? Your property's occupancy only matters in context with relevant benchmarks.
Your first option is to compare your occupancy performance to market- (or submarket-) wide averages. Alternatively, you can compare your performance against a precise comp set that matches your property's bedroom count, amenities, and location tier. This targeted comparison reveals whether your Airbnb occupancy rate truly outperforms similar listings or merely rides market trends.
AirDNA’s benchmarking and comp set tools make this easy. In AirDNA, consult the following graphs in the Performance dashboard:
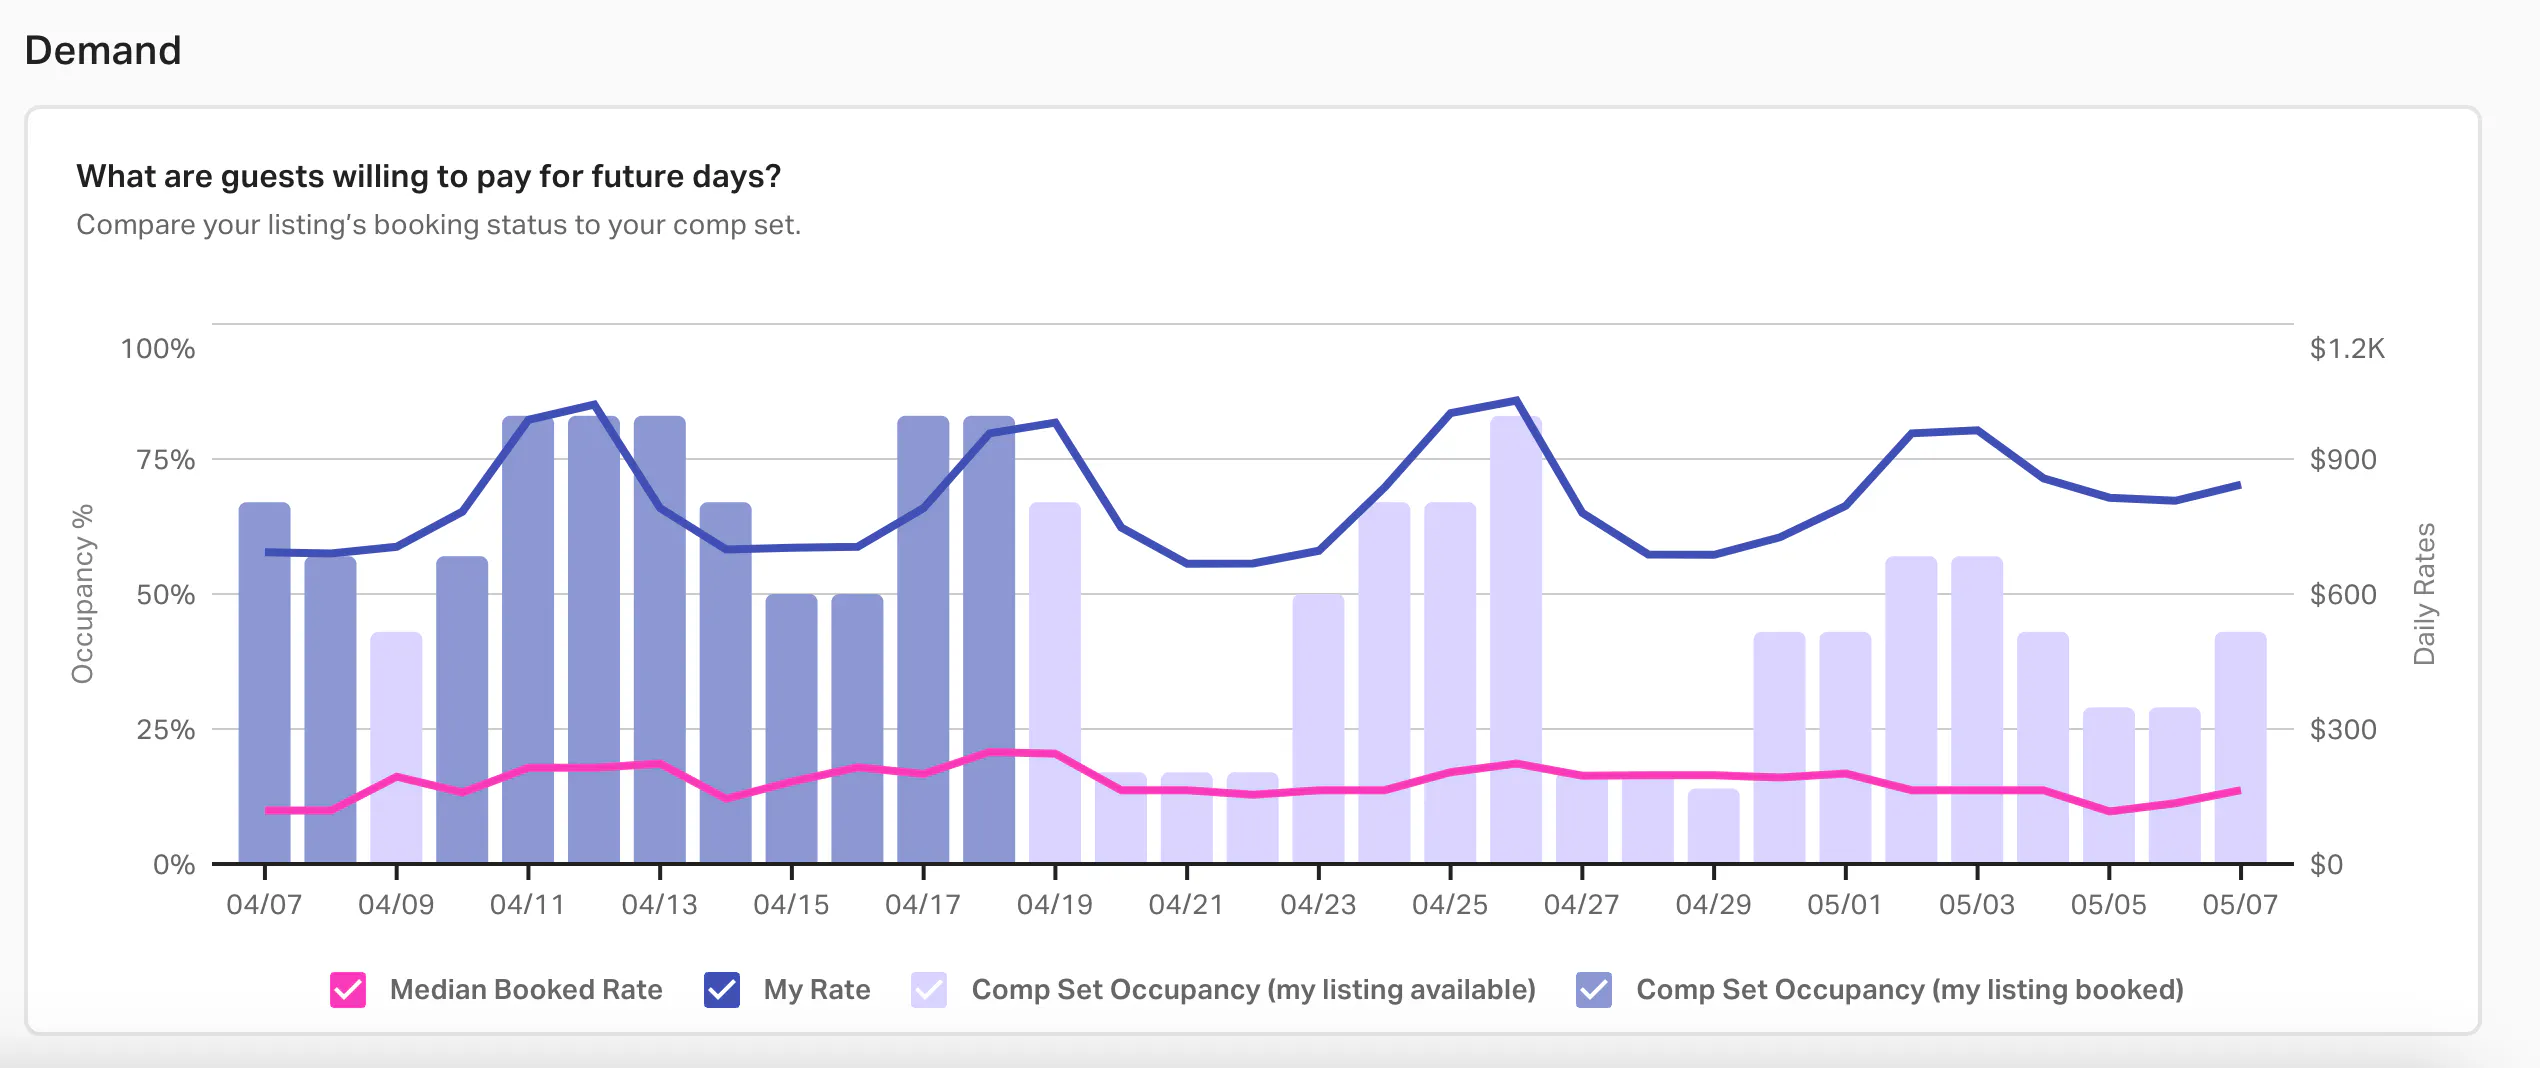
- What are guests willing to pay for future days? This predictive insight lets you adjust pricing strategy before your competition.
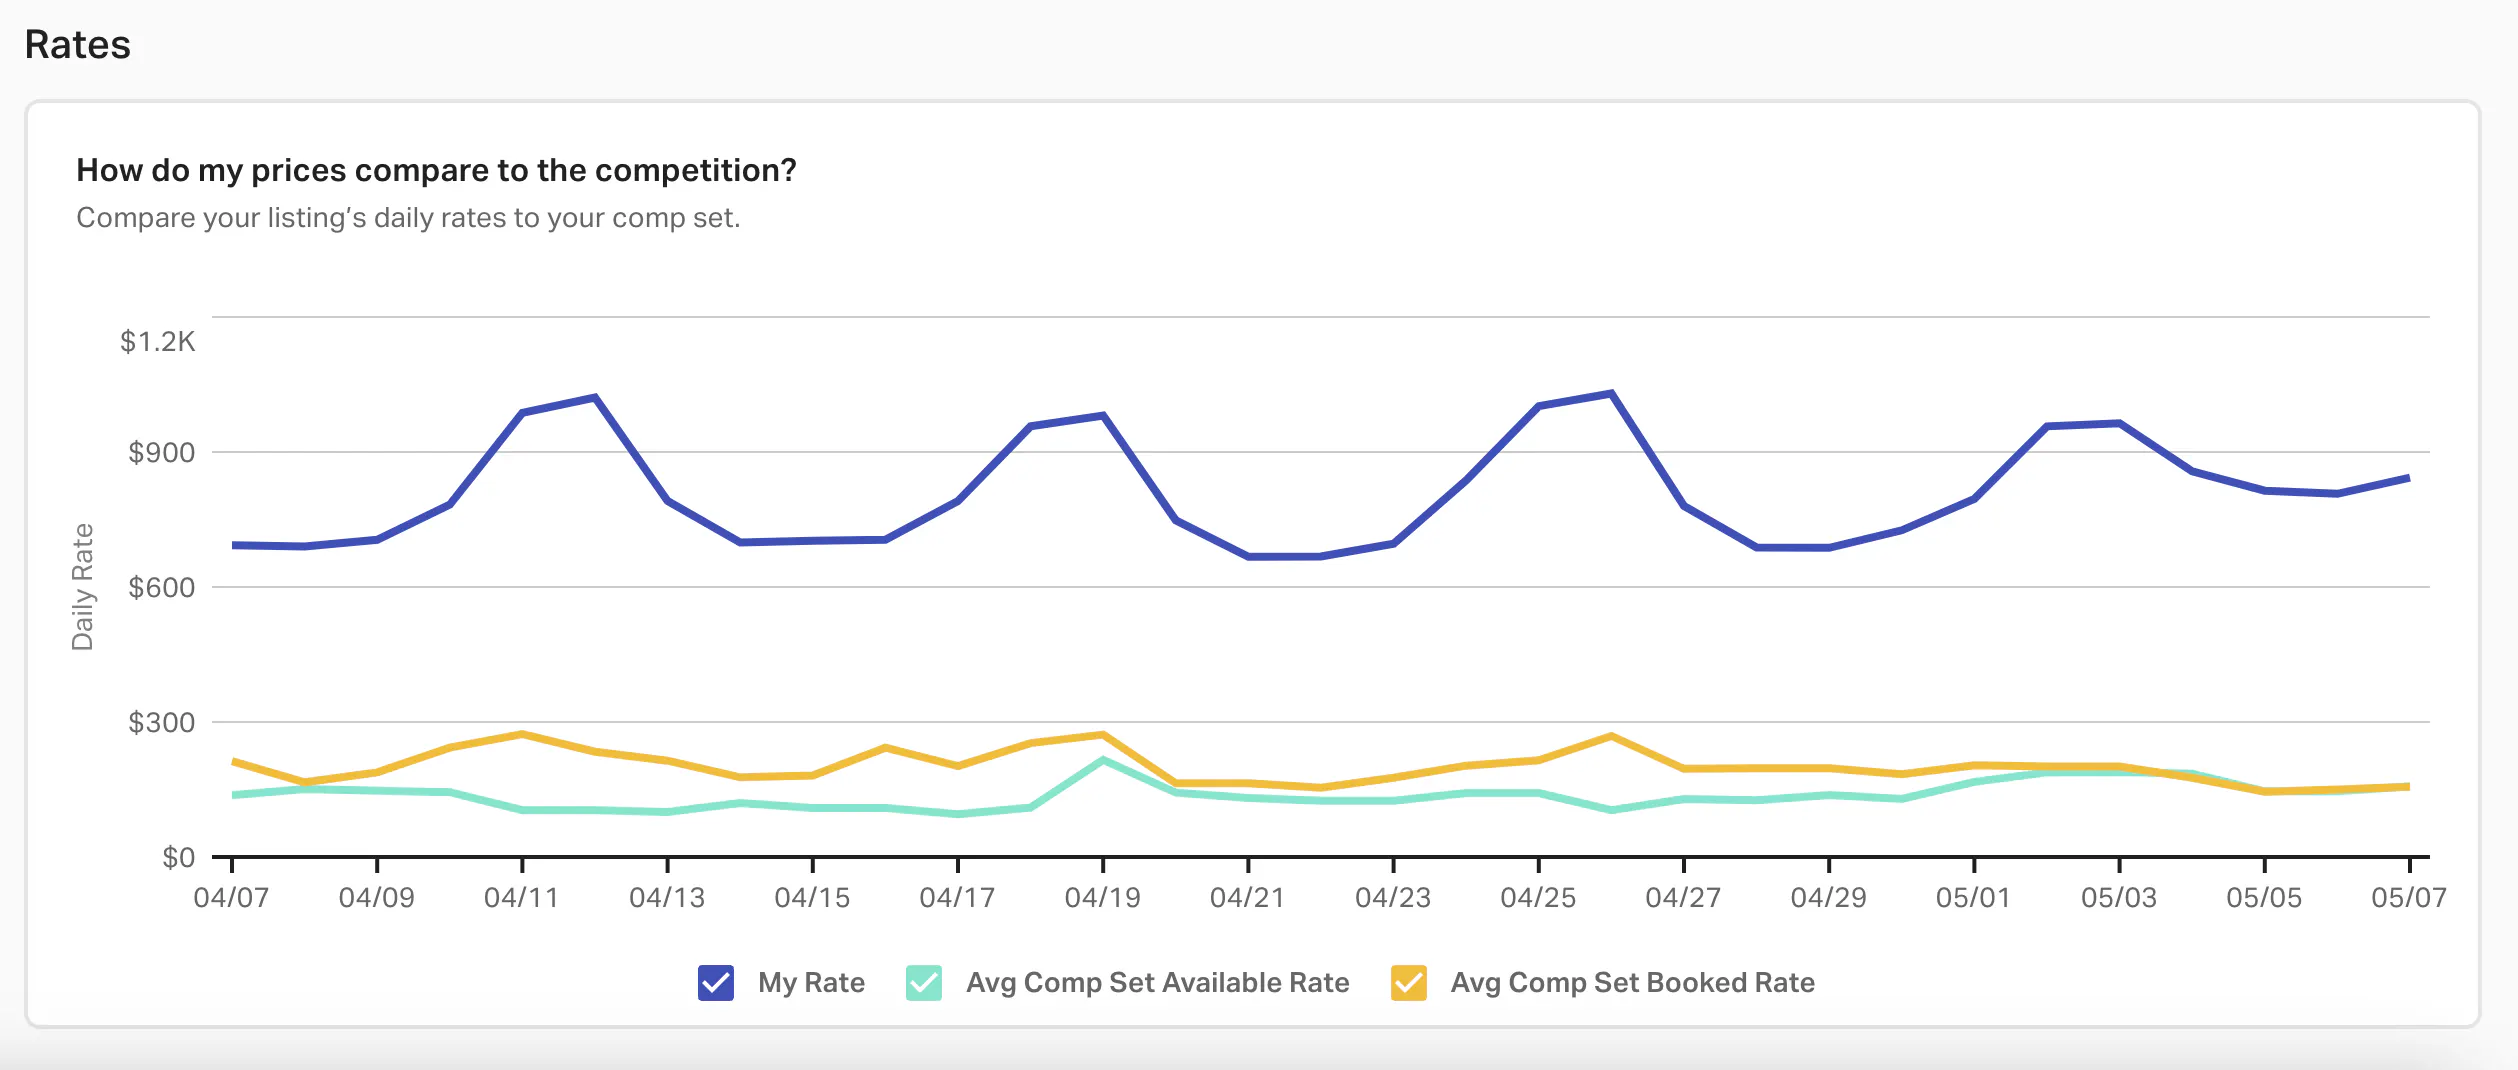
- How do my prices compare to the competition? How do your prices align with comparable properties? Identifying rate gaps often explains occupancy differentials.
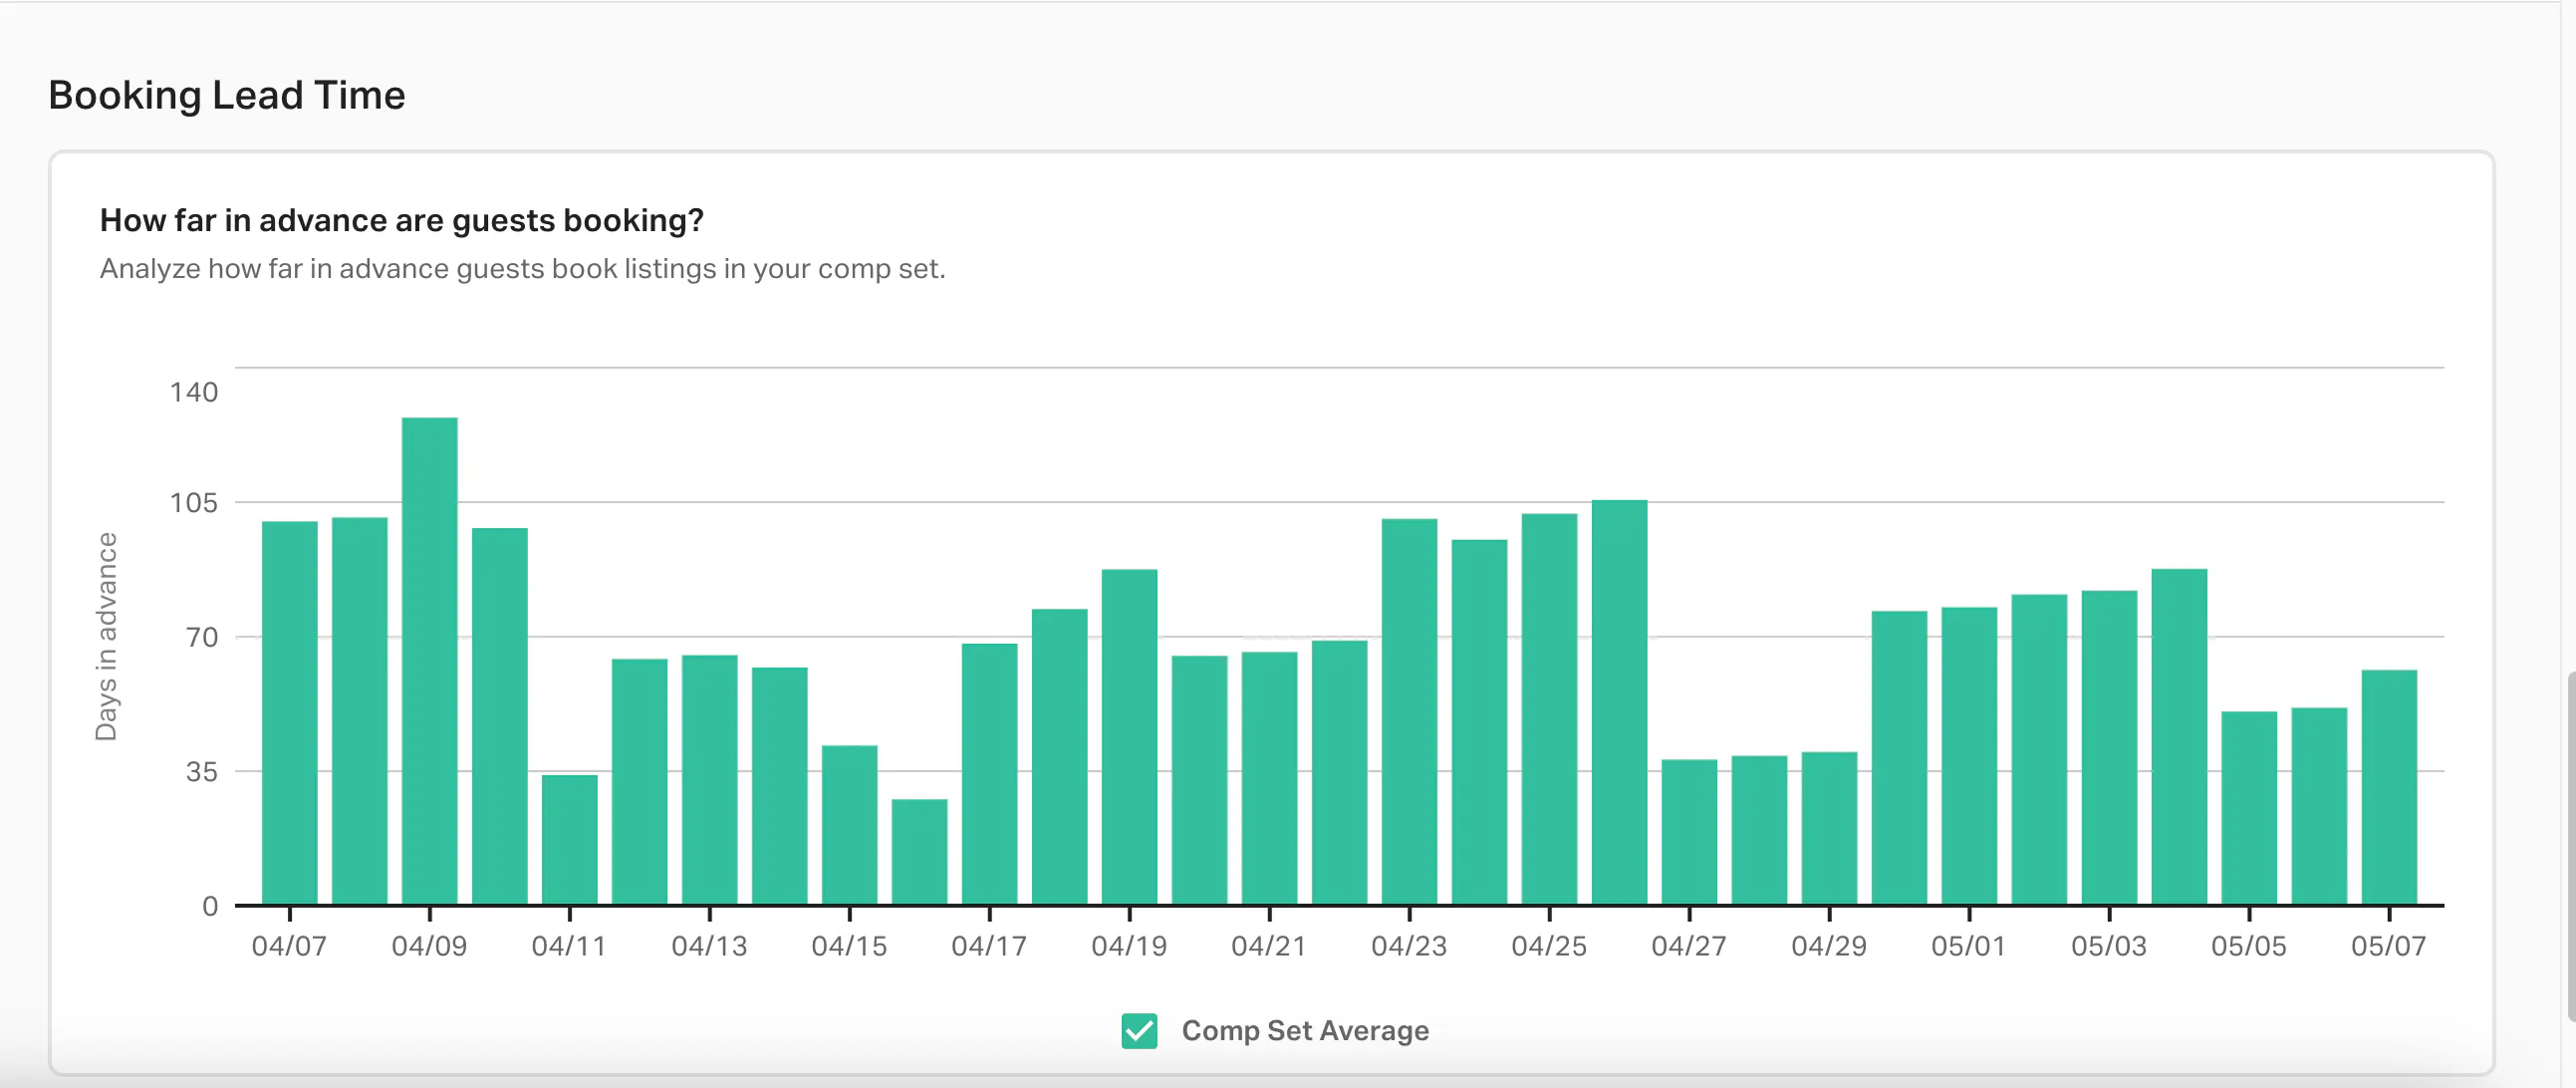
- How far in advance are guests booking? Are guests booking your property further in advance than competitors or the market as a whole? Shorter lead times may signal pricing issues or listing quality concerns.
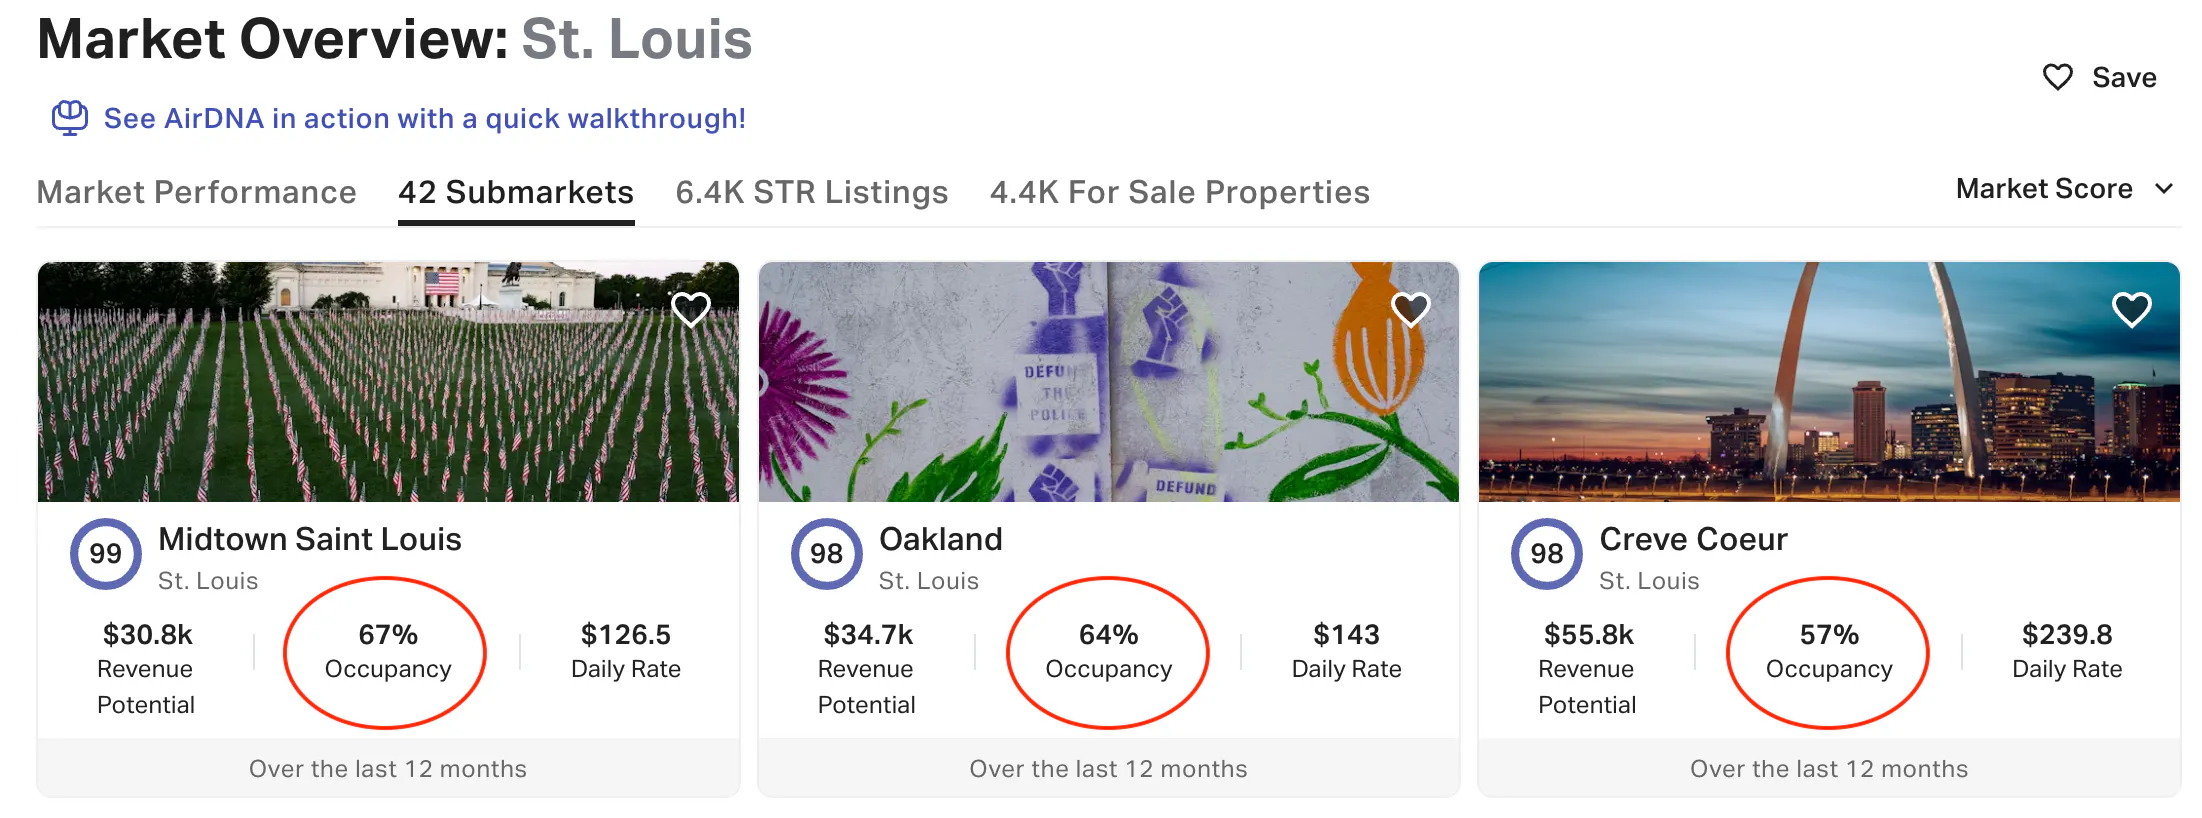
Outside of your Performance dashboard, you can also use AirDNA to see which segments (or submarkets) of a market boast the highest occupancy rates.
From the Explore tab, search for and click into a market. Click the Submarkets tab to see an overview—including average occupancy rates—for each submarket. Note: Not every market has submarkets.
Get reliable data for smarter investment decisions
AirDNA allows you to handpick the active short-term rentals that align with your investment criteria and shows you exactly how a similar property performs in the real world.
How Occupancy Rates Impact Property Valuation
When appraisers and investors value rental properties, they overwhelmingly favor the income approach to property valuation. Unlike the comparable sales method that might work for primary residences, investment properties are valued based on their income-generating potential—and that's where occupancy comes in.
Every percentage point of occupancy rate directly impacts your property's valuation. A seemingly small 5% occupancy advantage can translate to tens of thousands in additional property value. Why? Because property valuation models for STRs calculate Net Operating Income (NOI) using this simple but decisive formula:
NOI = (Average Daily Rate × Occupancy × 365) - Expenses
A property commanding 75% occupancy versus a comparable one at 65% doesn't just mean 10% more revenue—it signals stronger market positioning, better guest satisfaction, and ultimately, a more valuable asset.
Risk assessment: How occupancy stability impacts cap rates
All that said, you can’t just look at current occupancy—you also have to analyze occupancy stability over time. Properties with wildly fluctuating occupancy rates represent higher risk investments, which directly impacts the capitalization rate applied in your property’s valuation.
Consider two identical properties with the same average annual occupancy:
- Property A: Maintains consistent occupancy with minor seasonal variations
- Property B: Experiences dramatic swings from 95% peak season to 30% off-season
Property A will invariably command a lower cap rate in valuation models because its income stream is more predictable and stable. This occupancy stability might translate to a cap rate advantage of 0.5-1.0 percentage points—which can increase valuation by 10-20% on the exact same income.
Leverage AirDNA data to demonstrate occupancy stability with hard evidence.
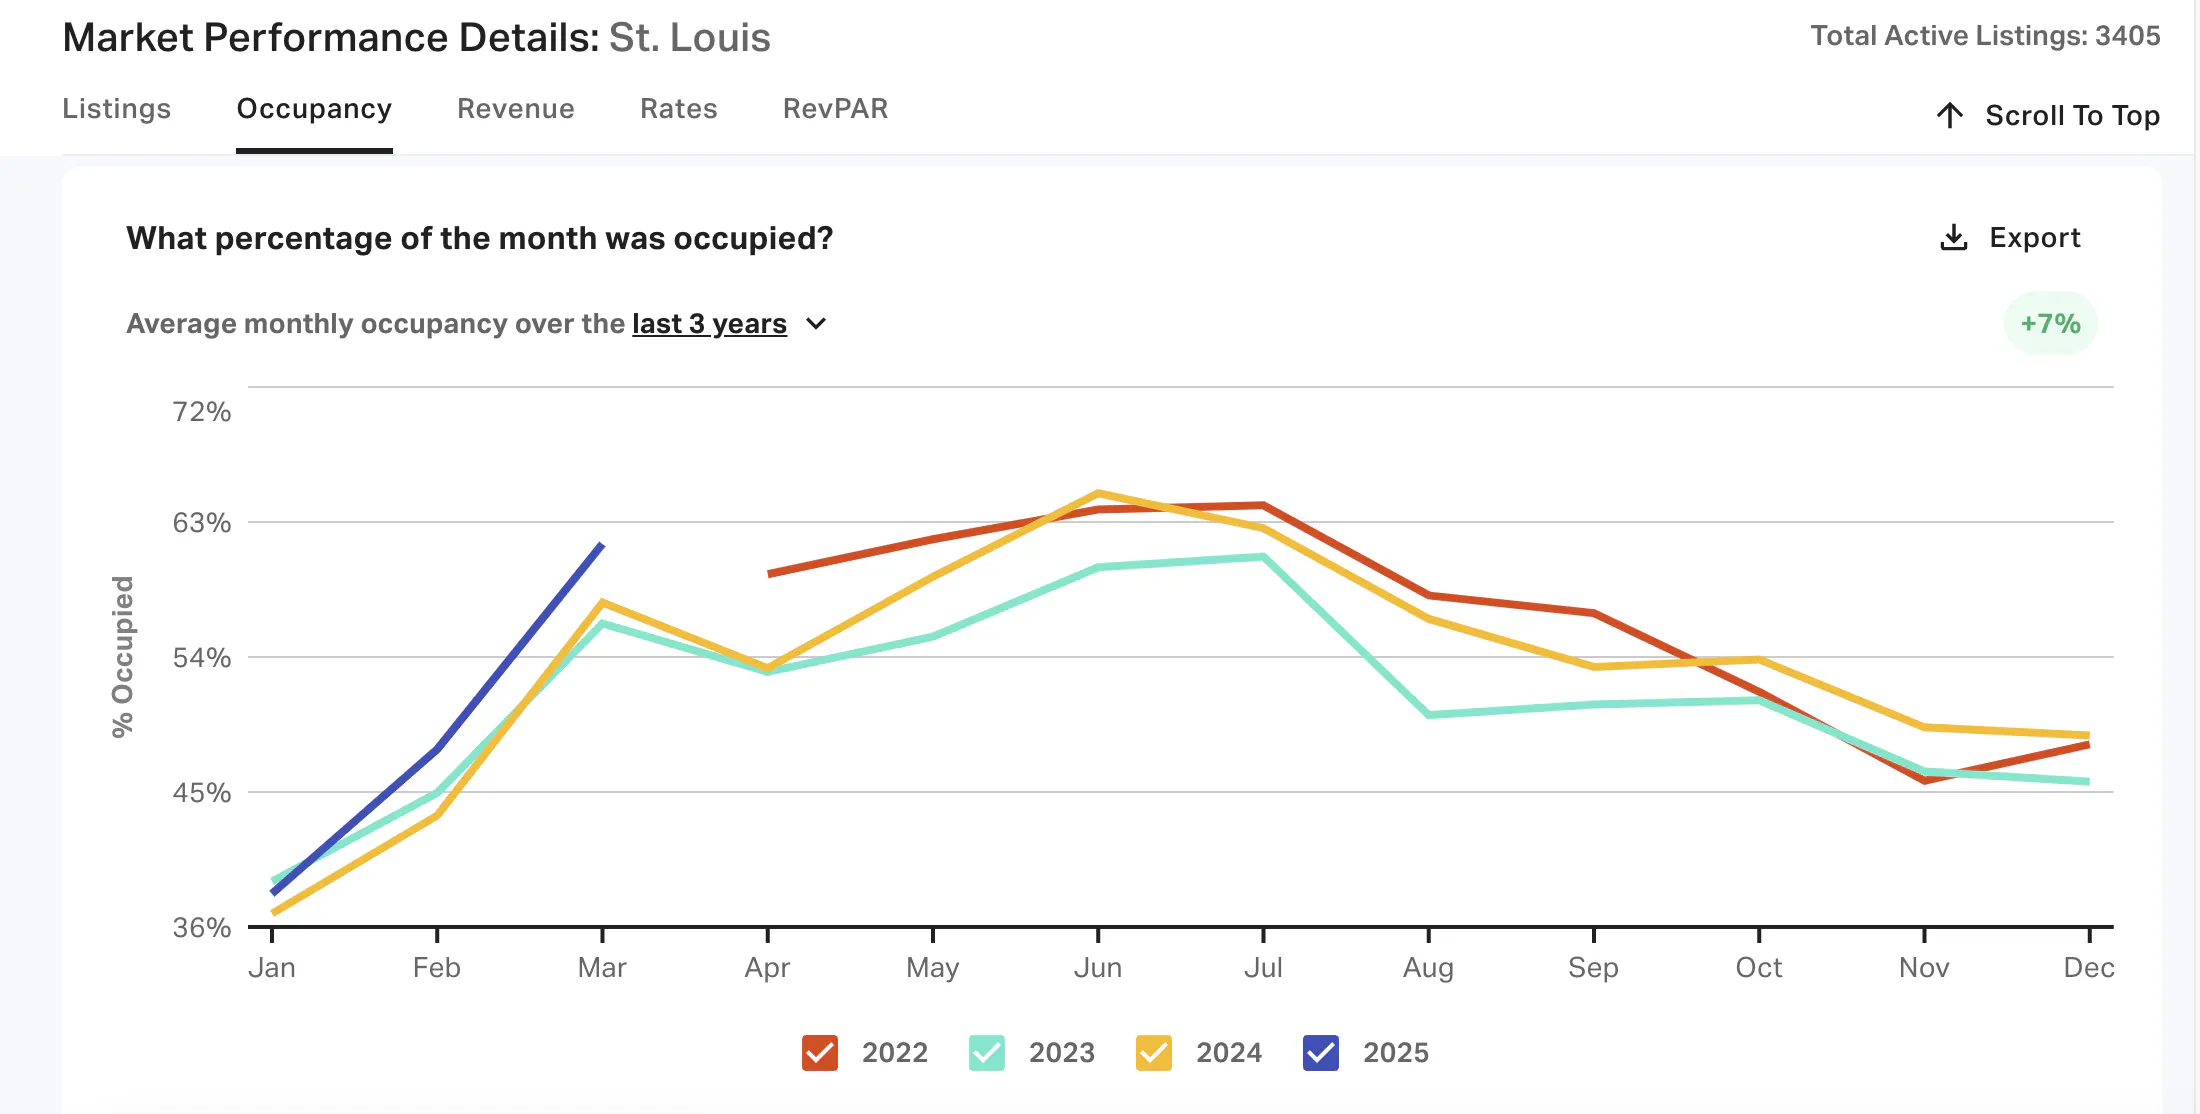
First, you can look at the market’s (or submarket’s) historical average occupancy rates. Search for the market in the Explore tab and scroll down to the graph “What percentage of the month was occupied?” Toggle to view data over the last 3 years. Compare these year-over-year patterns to your own property’s historical occupancy patterns.
Using occupancy rate to project future income
Modern property valuation also projects future performance. This is where you can leverage AirDNA's future-looking demand data to demonstrate your property’s upcoming demand (and therefore its future projected income).
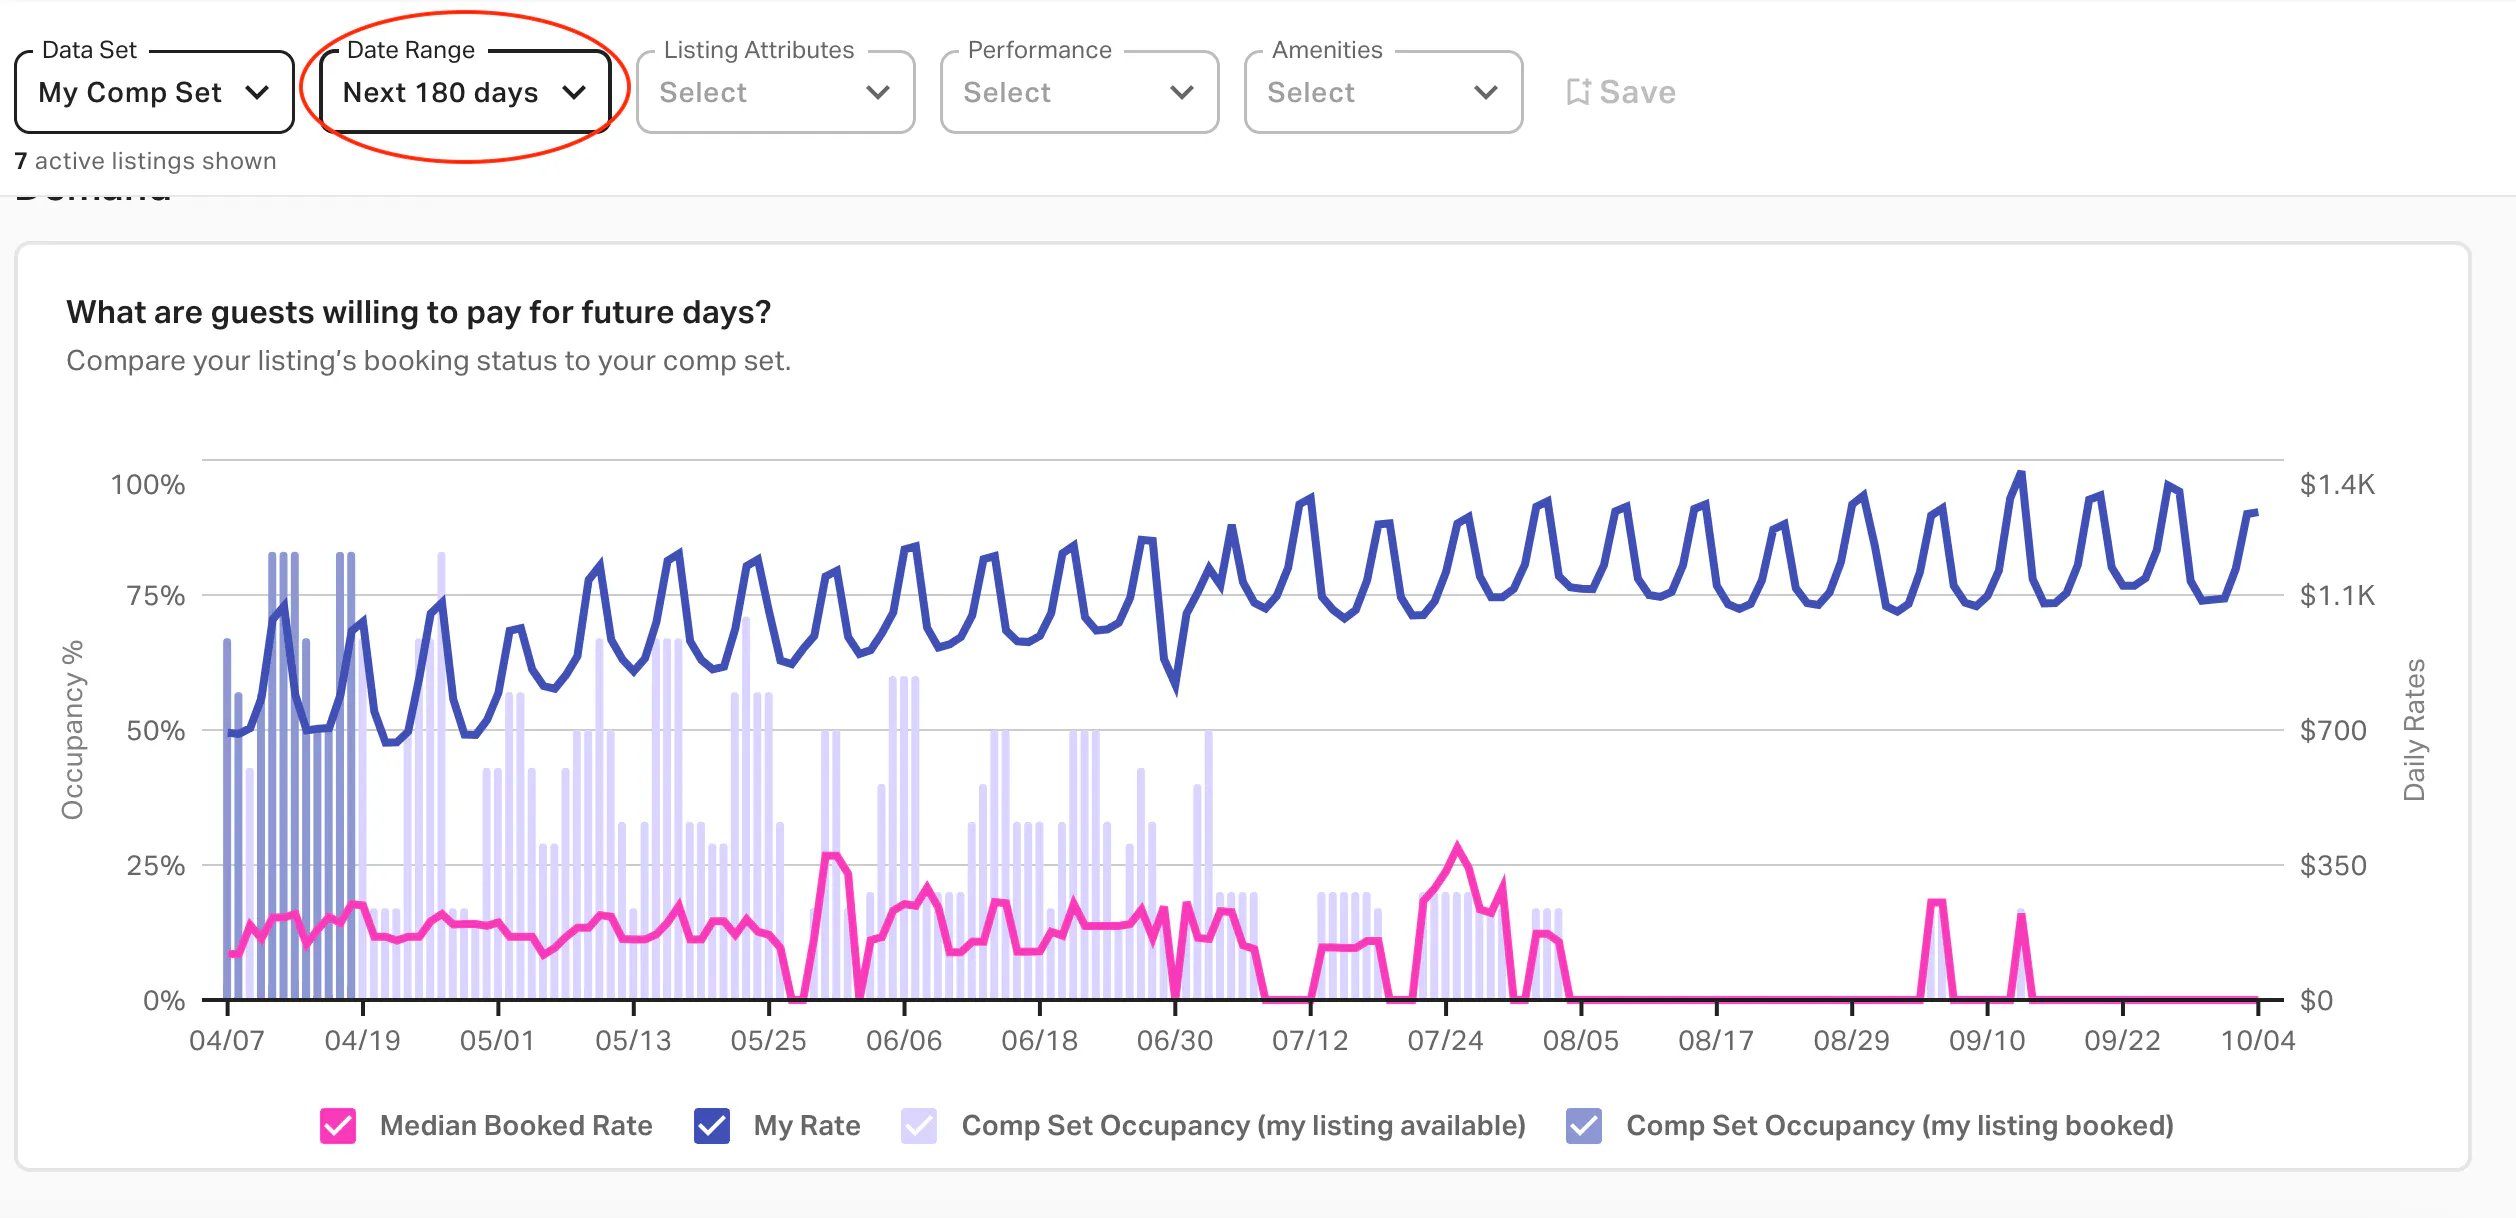
From the Performance dashboard, scroll down to the Demand graph. Toggle the graph to a date range of ‘next 180 days’ to see a high-level overview of your listing’s occupancy compared to your comp set’s over the next four months.
Occupancy Rates: A Quick Overview
Occupancy rate represents the percentage of time a rental property is occupied by paying guests. For short-term rentals, the standard calculation is straightforward:
Occupancy Rate = (Number of Booked Nights ÷ Total Available Nights) × 100
The higher your occupancy, the more nights your property generates revenue—a key consideration in any property valuation exercise.
Some STR investors treat all "occupied" nights as equal. They're not. Let's get precise about what we're measuring:
- Revenue-generating occupancy: The only metric that truly matters—cash-generating bookings. Any time we talk about occupancy rates in this piece, this is what we’re referring to.
- Calendar occupancy: A deceptive metric that lumps revenue nights with blocked dates, maintenance periods, and your family's summer vacation. Useful for tracking fair rental days for tax purposes, worthless for valuation.

Strategies to Improve Occupancy Rates
Let's be honest: Most "occupancy improvement" advice is pure fluff. Adding throw pillows and "cozy vibes" won't meaningfully impact your occupancy rate. What will? Strategic tactics that address the actual drivers of booking behavior.
Dynamic pricing: The most powerful occupancy lever
Rigid pricing is the leading killer of optimal occupancy rates. If you're still setting flat seasonal rates, you're hemorrhaging potential bookings. Implement sophisticated dynamic pricing that flexes daily based on:
- Day-of-week demand patterns (weekends vs. weekdays)
- Seasonal compression periods
- Local events and demand surges
- Competitive pricing shifts
- Booking lead time optimization
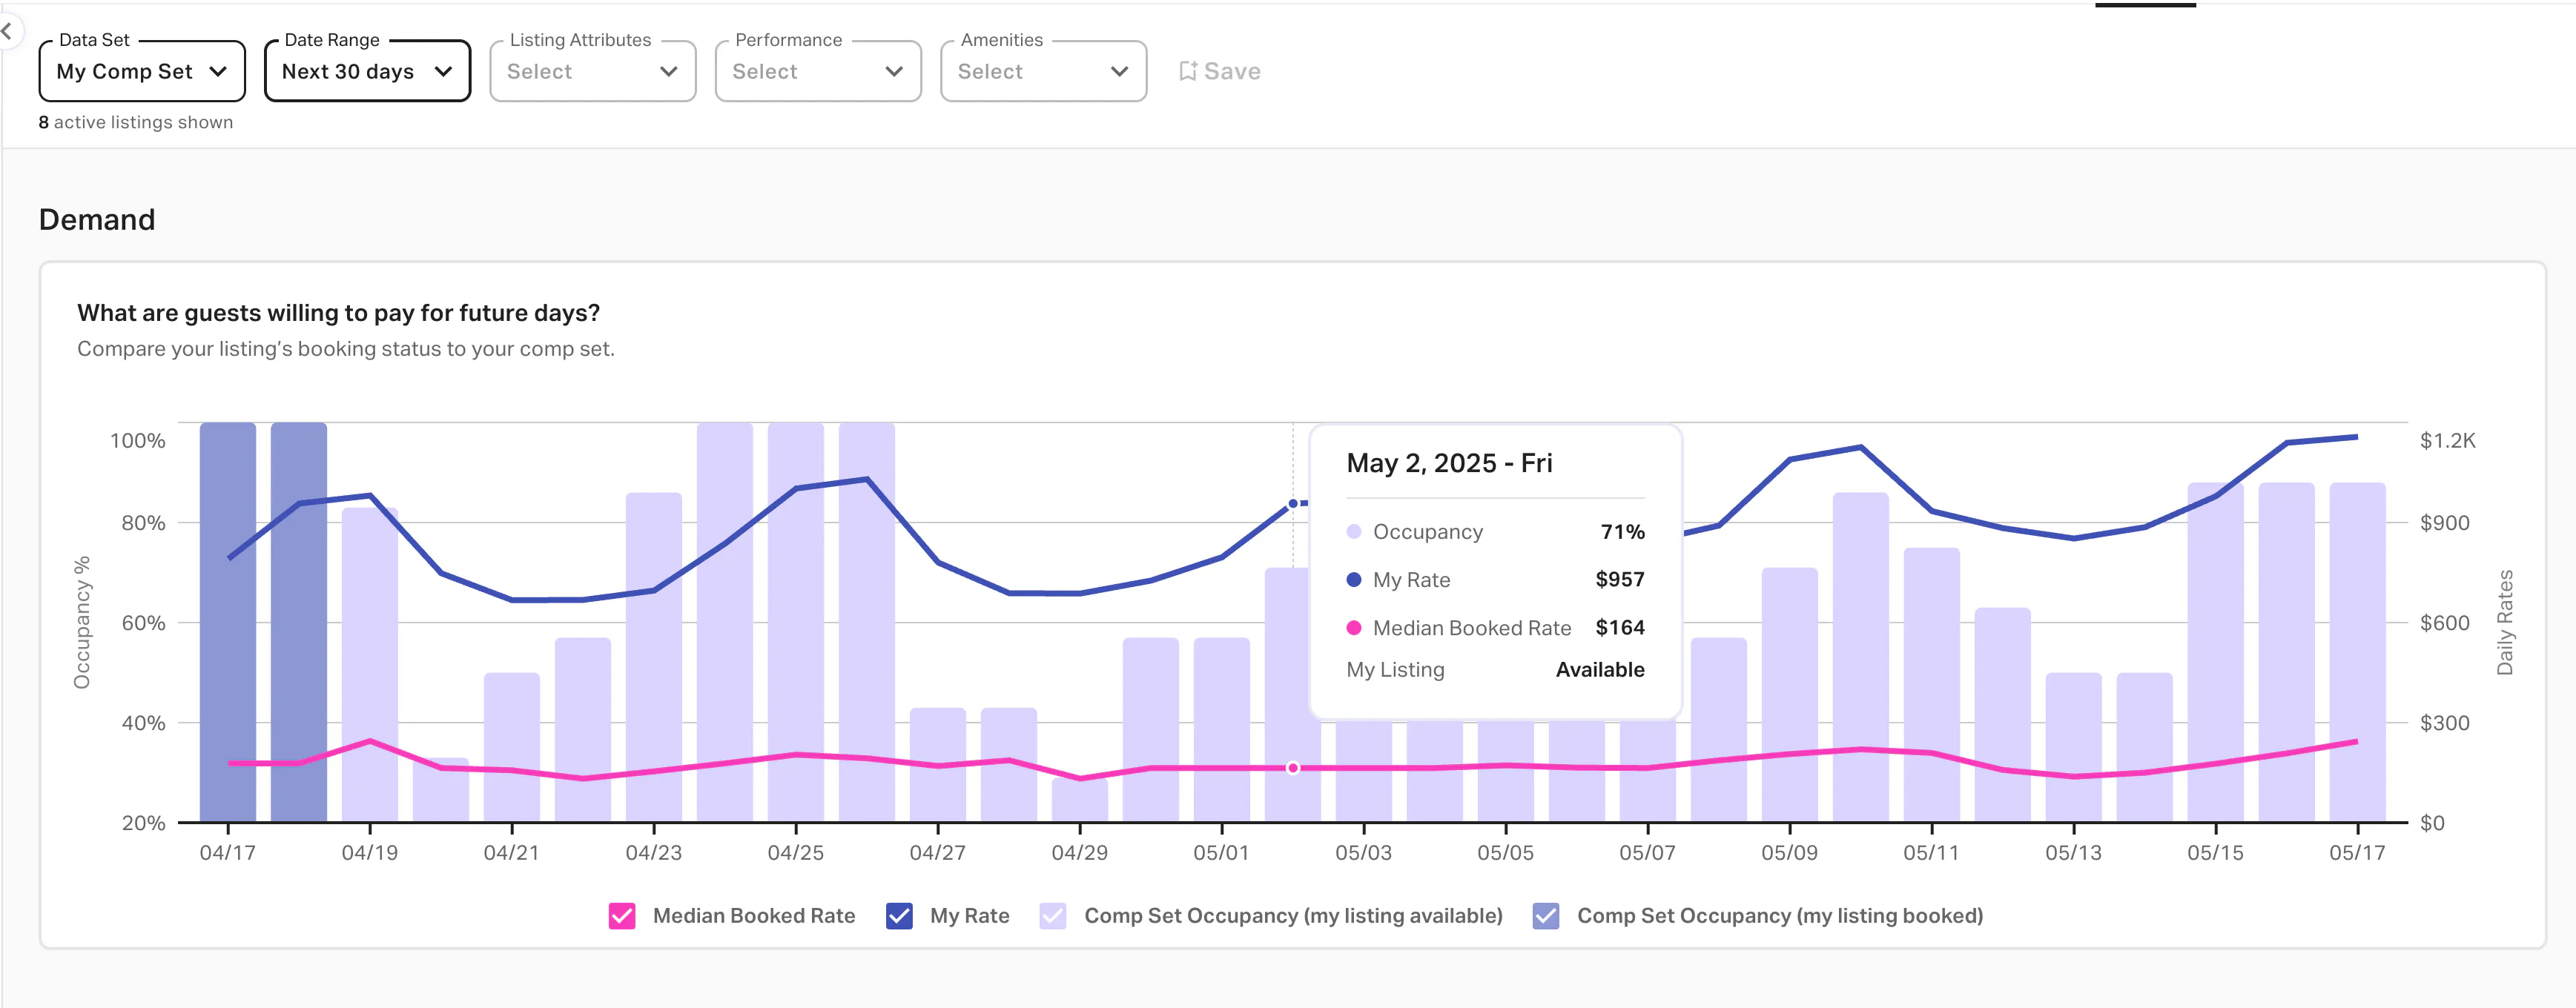
Your AirDNA Performance dashboard gives you precise insights into what guests are willing to pay on specific dates, allowing you to adjust pricing with surgical precision. In the “What are guests willing to pay for future days?” graph, hover over any day to see your rate and the median booked rate.
Try Our Vacation Rental Pricing Tool
Use rate recommendations to optimize your pricing strategy.
Fill vacancies with seasonal promotions
Most hosts randomly discount their properties when panicking about low occupancy. This reactive approach decimates your revenue while failing to meaningfully boost bookings. Instead, use data-driven seasonal promotions strategically:
- Length-of-stay discounts during shoulder seasons: Offering tiered discounts (7% for 3 nights, 15% for 7+ nights) during specific shoulder months can increase occupancy rates while minimizing revenue impact.
- Early-bird booking incentives: Use the "Booking lead time" graph in your AirDNA dashboard to identify optimal windows for early-booking promotions. Offering 10-15% discounts for bookings made 90+ days in advance during traditionally slow periods locks in base occupancy that you can build around.
- Gap-filling flash promotions: Rather than discounting entire weeks, use targeted 48-hour promotions to fill specific gap nights between existing bookings.
Boost occupancy with review management and marketing
Great photos and catchy listing titles matter, but don’t overlook your review score in attracting prospective travelers. The algorithms aren't subtle about this—they reward high-rated properties while burying those with mediocre scores.
Smart operators obsessively manage their reviews by:
- Identifying and fixing recurring guest complaints
- Setting expectations accurately in listing descriptions
- Providing proactive communication during stays
- Implementing professional cleaning protocols

Calculate potential earnings
Understand the investment potential of any address in the world.
Practical Considerations for Investors and Appraisers
While occupancy rate is undeniably a critical metric for property valuation, relying solely on raw occupancy data is like navigating with half a map. Smart investors recognize several crucial limitations:
Market volatility factors
Historical occupancy patterns can be disrupted by macro-level events beyond your control. The pandemic dramatically illustrated how quickly established occupancy patterns can transform. Markets previously dominated by business travel saw occupancy collapse while digital-nomad-friendly destinations surged.
When performing rental market analysis, segment your occupancy data into pre- and post-disruption periods. A property showing 70% average occupancy might actually reflect 85% pre-disruption and 55% post-disruption—a trend line that tells a completely different story than the average suggests.

Balance occupancy with nightly rates
Chasing maximum occupancy at the expense of rate integrity is a rookie mistake. Some investors proudly claim 90%+ occupancy while generating less revenue than competitors running at 75% with optimized pricing. The key metric isn't occupancy alone, but revPAR (revenue per available room):
RevPAR = Occupancy Rate × Average Daily Rate
Make it your goal to maximize revPAR alongside occupancy. Use AirDNA to pinpoint opportunities where you can strategically sacrifice some occupancy to capture significantly higher rates during peak demand periods.
The sustainability question
When evaluating a property's occupancy performance, assess whether current levels are sustainable. Is the property benefiting from temporary factors like:
- New property "honeymoon period" with algorithm preference
- Temporary lack of competition in an emerging market
- Unsustainably low rates that boost occupancy artificially
- Market anomalies from macro-level events
The regulatory landscape
Perhaps the most underappreciated occupancy risk comes from regulatory changes that can transform your investment overnight. Smart investors scrutinize the regulatory environment as carefully as they do occupancy trends.
Many municipalities are actively restricting STR operations through zoning ordinances that:
- Limit the number of nights a property can be rented annually
- Require primary residence status for hosts
- Establish minimum-night stay requirements
- Create "no-STR zones" in certain neighborhoods
A property with a stellar 75% occupancy rate becomes dramatically less valuable when new regulations cap annual rentals at 90 nights (24.7% maximum occupancy).
AirDNA's Regulation Score can help you quantify these risks. Of course, before you acquire a property, you should examine not just current regulations but pending legislation that could impact future short-term rental occupancy.

Learn from your competitors
Without reliable rental comps, you're making pricing decisions in the dark. Use real data to compare your listing performance to similar properties and discover your true market position.
FAQs
What is considered a “good” occupancy rate for STRs?
There's no universal benchmark for "good" occupancy rate because markets vary dramatically. Instead of chasing arbitrary targets, measure your performance against relevant benchmarks:
- Market average occupancy: Aim to exceed your market's average occupancy by at least 5-10 percentage points.
- Comp set occupancy: More important than market-wide averages is how you stack up against your direct competitors. Create a custom comp set in AirDNA that matches your exact property attributes, then target occupancy 10+ points above this group.
- Revenue-optimized occupancy: The most sophisticated approach isn't about maximizing occupancy but finding your property's revPAR sweet spot. Some properties generate more revenue at 70% occupancy with premium rates than at 85% with discounted pricing.
How often should I update my occupancy data for valuation?
For accurate property valuation, your occupancy data should be updated:
- Quarterly: At minimum, perform quarterly occupancy analysis that tracks both your property's performance and market trends. This cadence allows you to identify emerging patterns while avoiding reactionary responses to short-term fluctuations.
- Before major financial decisions: Refresh your occupancy analysis before refinancing, selling, or expanding your portfolio. Lenders and buyers will want current data, not historical snapshots.
- After significant market events: Update your occupancy analysis following major market disruptions (economic shifts, regulatory changes, new supply entering the market) as these can rapidly transform occupancy patterns.
- Annually for formal valuations: Most professional appraisers will request trailing 12 months' occupancy data for formal valuations, with particular emphasis on seasonality patterns.
What are the best practices for integrating occupancy metrics into a valuation model?
Here are five key practices for incorporating occupancy rate data into your property valuation:
- Break down occupancy by segments: Don't rely on annual averages. Analyze occupancy by season, weekday/weekend, and special events to create more accurate income projections.
- Account for occupancy stability: Properties with consistent occupancy deserve lower cap rates than those with volatile patterns. Measure this stability by tracking monthly variation over at least one year.
- Use forward-looking data: Don't just rely on historical performance. AirDNA's demand forecasting data helps you project future occupancy trends that better reflect true income potential.
- Connect occupancy to revenue: Remember that optimal occupancy isn't always maximum occupancy. The best valuation models examine how occupancy and ADR work together to maximize total revenue.
- Document competitive advantages: When your property consistently outperforms market occupancy, use AirDNA's comp set tools to demonstrate why these advantages will persist, justifying a more favorable valuation.
How do seasonality and local events affect occupancy rates?
Seasonality impacts on occupancy vary dramatically by market type, while local events create occupancy micro-patterns that smart investors capitalize on:
- Festivals & conferences: Can drive 100% occupancy with premium rates during otherwise slow periods
- Sporting events: Create predictable occupancy spikes that strategic pricing can leverage
Recurring annual events: Build valuable occupancy patterns that increase overall annual performance
ARTICLE SUMMARY
Occupancy plays a crucial role in how much a market and an investment property are worth. This guide reveals how to use occupancy data to boost short-term rental property values.
Bram Gallagher
AirDNA Director of Economics and Forecasting
Bram Gallagher is an Economist at AirDNA, specializing in uncovering insights that drive smarter short-term rental decisions. He put his Ph.D. in Economics from the University of Georgia to work researching and forecasting hotel data with CBRE prior to joining AirDNA, as well as teaching economics at a number of universities. In his spare time, Bram enjoys making wooden furniture with hand tools.
