

 Calculate Revenue
 Research Markets
 Find For Sale Properties
 Compare My Listing
 STR Revenue Calculator
 Custom Comp Sets
 Submarket Insights
 Custom Search Filters
 Rate Recommendations
 Performance Benchmarking
 Competitor Comparison
 Owner Contact Details
 Property-level performance data
 Tourism Insights
 Real Estate Investment Analytics
 About Us
 Sales
Sales Support
 Press
PressHow Much Can You Earn on Airbnb with Lake Access?
Published: October 31, 2025
Last updated: December 4, 2025

Jamie Zhang
Key Takeaways
- Listings with lake access earn 22% more per night on average, with some markets seeing revenue more than double for properties right on the water.
- Lake views also increase RevPAR by 16% because guests are often willing to pay more for scenic stays (even without direct lake access).
- With AirDNA, you can easily estimate how much a lake house might earn on Airbnb by comparing similar properties.
Lakefront properties are some of the most searched vacation rentals on Airbnb. Guests love the idea of launching a kayak from the dock or sipping coffee with a lake view. However, when it comes to short-term rental income, not all waterfront perks deliver the same return.
So how much can you actually earn on Airbnb with lake access or a lake view? What should you look for if you're considering buying a lake house?
In this guide, we’ll look at how lake access and views impact Airbnb income, where they deliver the biggest returns, and how to use AirDNA to estimate the income you could earn from an Airbnb lakehouse.
Calculate potential earnings
Understand the investment potential of any address in the world.
How Much Can You Earn on Airbnb With Lake Access or a Lake View?
If you’re eyeing a lake house as a short-term rental, you already know that waterfront features are in high demand. Lake access and lake views can both boost your earnings but in different ways and by different amounts.
Lake access lifts nightly rates by 22%
Guests are willing to pay more for a stay that offers direct water access—whether it’s a dock, beach, or walkable shoreline. According to AirDNA data, listings with lake access earn an average of $346 per night, compared to $283 for similar listings without it. That’s a 22% increase in Average Daily Rates (ADR) driven by that one highly desirable feature.
Interestingly, occupancy is slightly lower for lake-access listings (48% vs. 49%), which means the income boost comes from higher pricing, not more bookings. Even with fewer nights booked, the added rate drives overall revenue higher. Revenue Per Available Rental (RevPAR) climbs from $138 to $167.
For hosts and buyers, this highlights the value of water access in markets where guests come specifically for the lake. It’s not just a nice amenity. It’s a feature that increases what you can charge and helps your listing stand out in a crowded seasonal market.
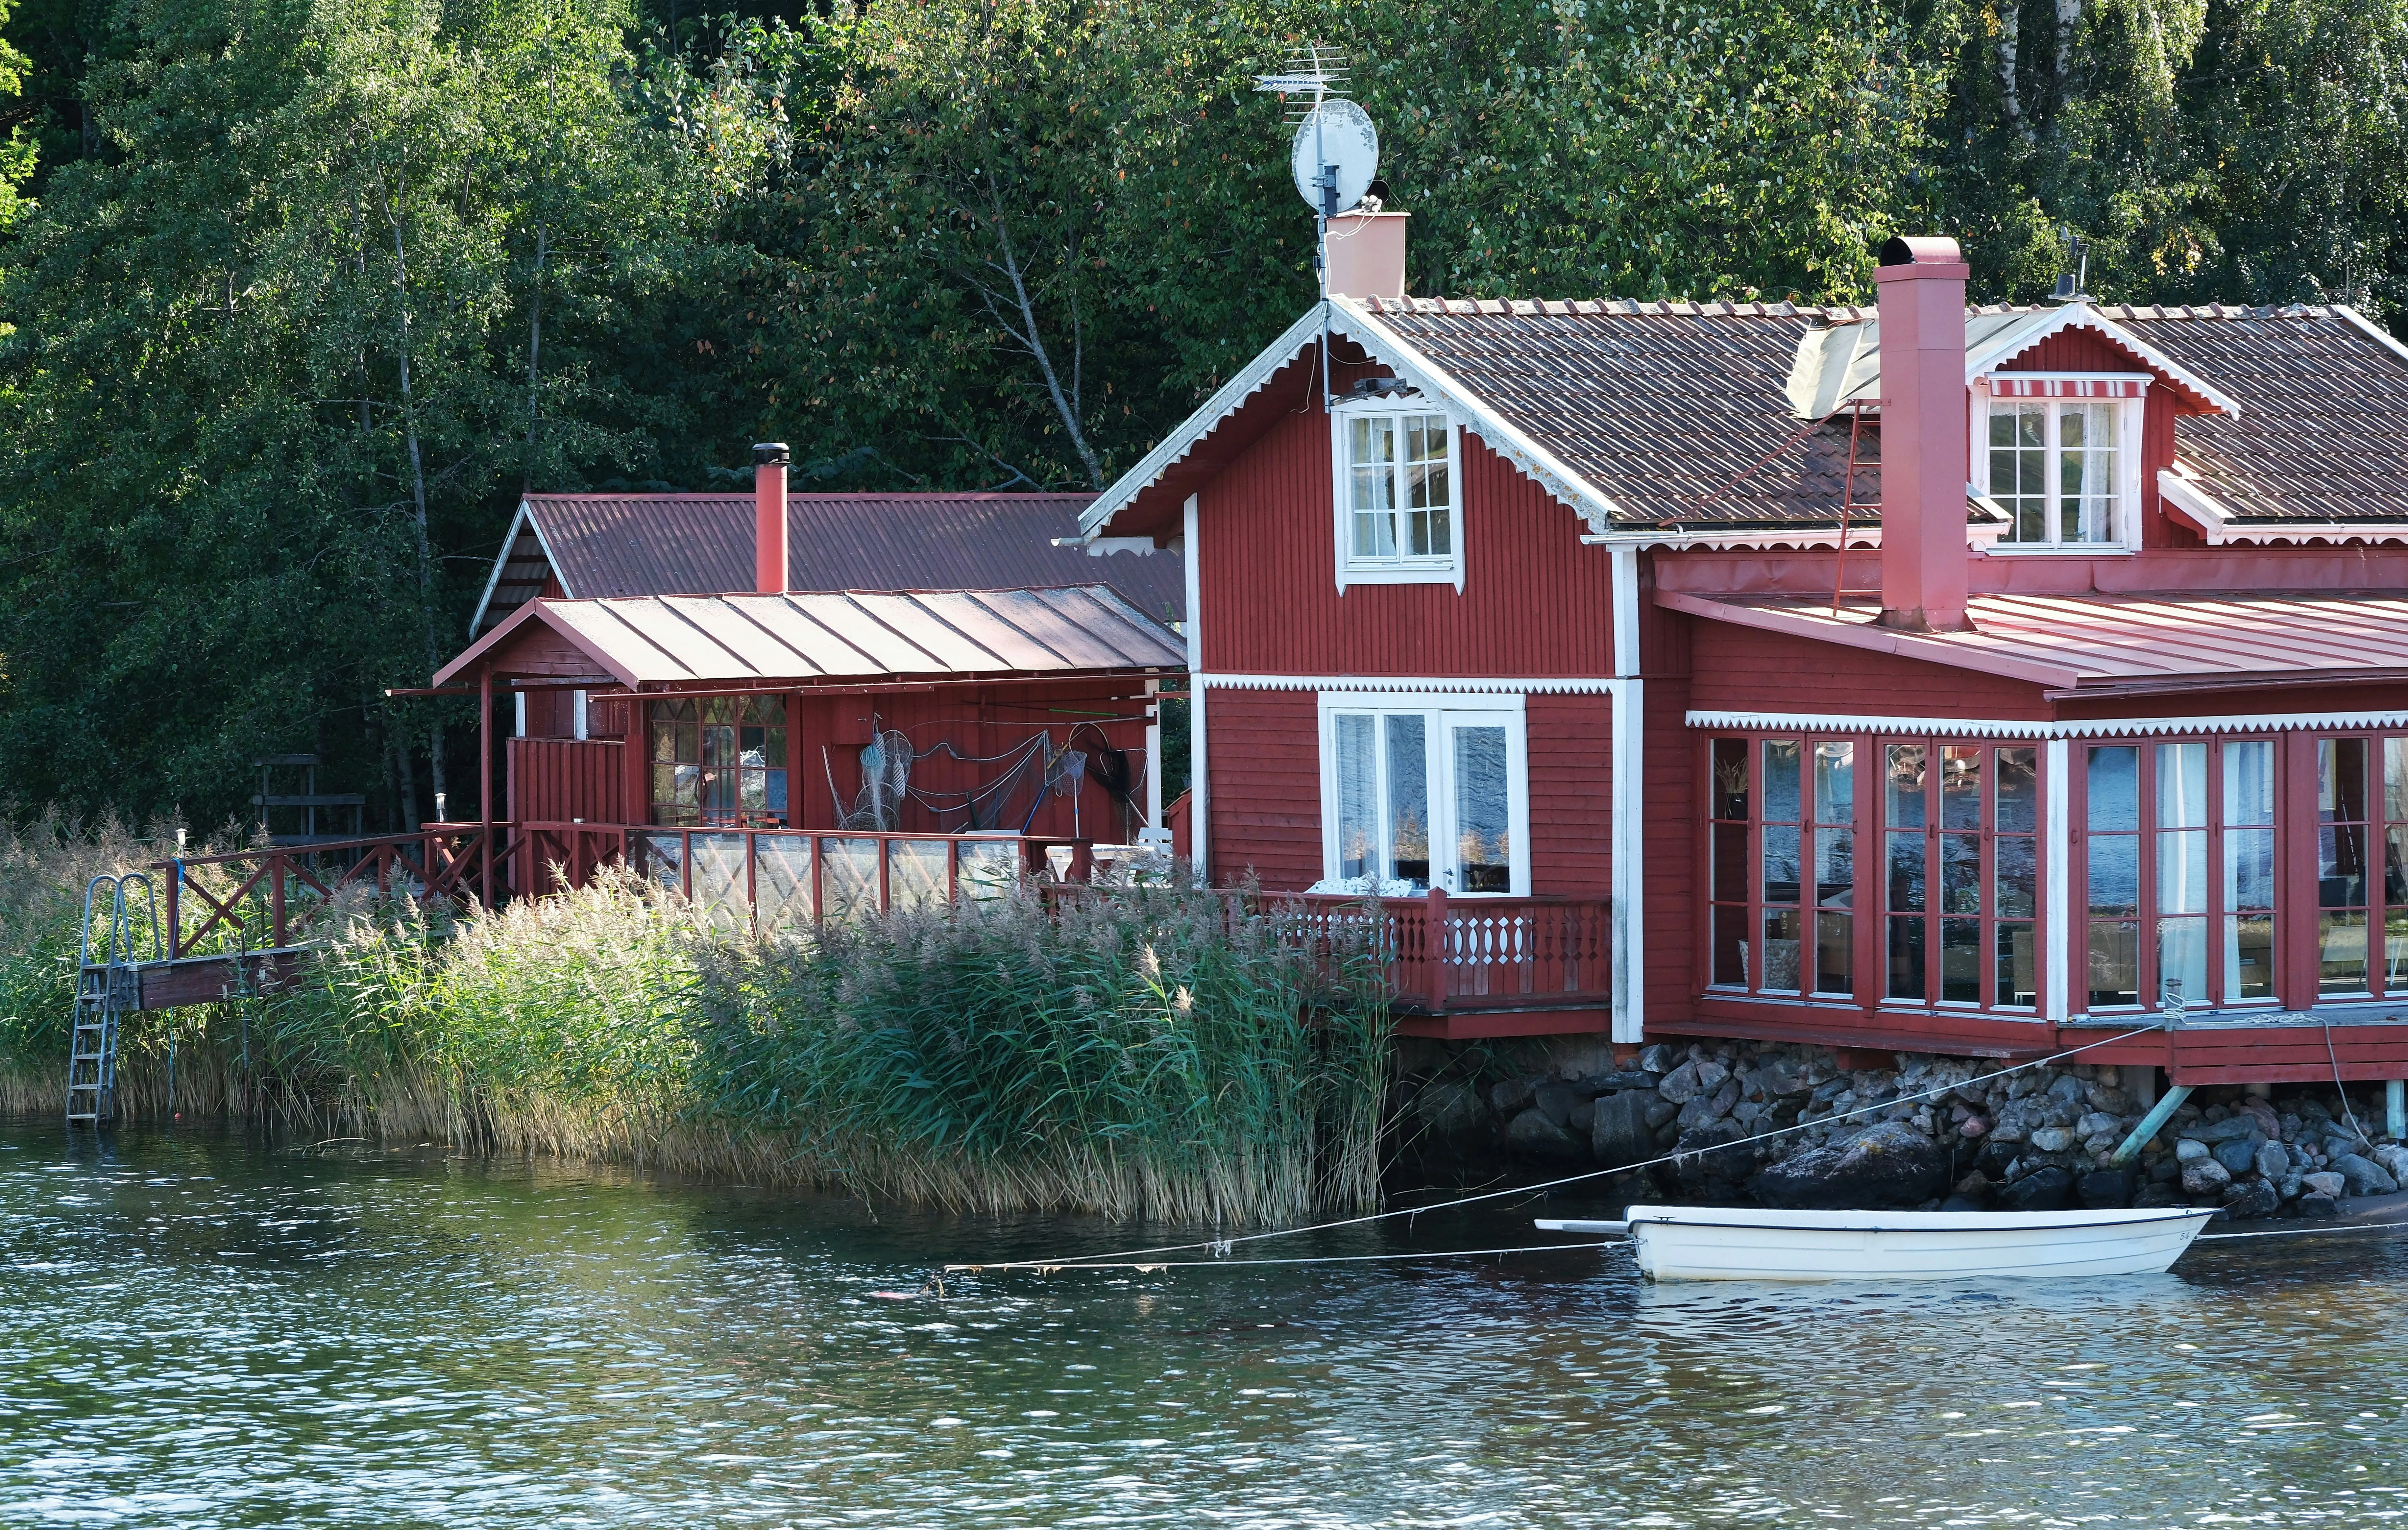
Lake views boosts overall revenue
When it comes to short-term rentals, the area seen from the property can be almost as important as what’s directly accessible from it. That’s why a house with a lake view can still earn more, even without immediate water access.
In mountain and lake resort markets, listings with lake views average $327 per night, compared to $281 for those with no lake views. That price difference adds up to a 16% increase in RevPAR.
Occupancy stays the same at 49%, which tells us the premium comes entirely from price again. Guests are willing to pay extra for the atmosphere, the setting, and those postcard-perfect photos. In a market where many travelers are choosing based on visuals alone, a standout view can do a lot of the heavy lifting.
This makes lake views a smart feature to prioritize, especially in regions where shoreline access is limited or more expensive.
Lake premiums are highest where they’re hard to find
Not all lakes are equal when it comes to income potential. AirDNA data shows that lake access and lake views boost revenue. How much they boost revenue depends heavily on where your property is located.
In the South and Mid-Atlantic, listings with lake access earn about 38% more in RevPAR compared to similar properties farther from the water. In contrast, the West Coast sees a more modest premium (around 18%), and the Mountain States show almost no lift at all. In parts of the Southwest, including Arizona and New Mexico, lake access can even correlate with slightly lower performance.
Why such regional differences? There’s no single explanation, but several factors could be at play:
- Traveler intent: In some regions, travelers are booking specifically for lake time (think Lake Norman in North Carolina or Lake Oconee in Georgia), while in others, lake proximity is a nice-to-have rather than the main draw.
- Seasonality and climate: Warmer regions often see longer lake seasons, meaning more potential for summer recreation and repeat visits. In contrast, mountain or desert lakes may have shorter or more specialized peak periods.
- Competition density: Markets where most homes already have water access might see smaller premiums simply because it’s not a differentiator. In contrast, regions where waterfront listings are rare stand out more in search results and pricing.
- Accessibility and amenities: Easy-to-reach lake markets near big cities (like Atlanta or Charlotte) tend to attract high weekend demand, whereas remote or rugged lake areas might appeal to narrower audiences.
- Traveler demographics: Regional travel cultures differ. Families driving in from nearby metro areas may value lake access differently than adventure travelers visiting the Rockies or coastal tourists in California.
Ultimately, lake properties can perform strongly almost anywhere. How much of a revenue boost they deliver depends on a mix of supply, demand, and what travelers in that region value most.

Top Markets by Lake Access Premium
When we zoom in on specific markets, the potential upside becomes more striking. Here are the top five markets where short term rentals with lake access earn the largest RevPAR premiums:
- Black Hills, South Dakota (+139%)
- Idaho Falls / Rexburg, Idaho (+118%)
- Lake Norman, North Carolina (+100%)
- Lake Lanier, North Georgia (+68%)
- Finger Lakes, New York (+66%)
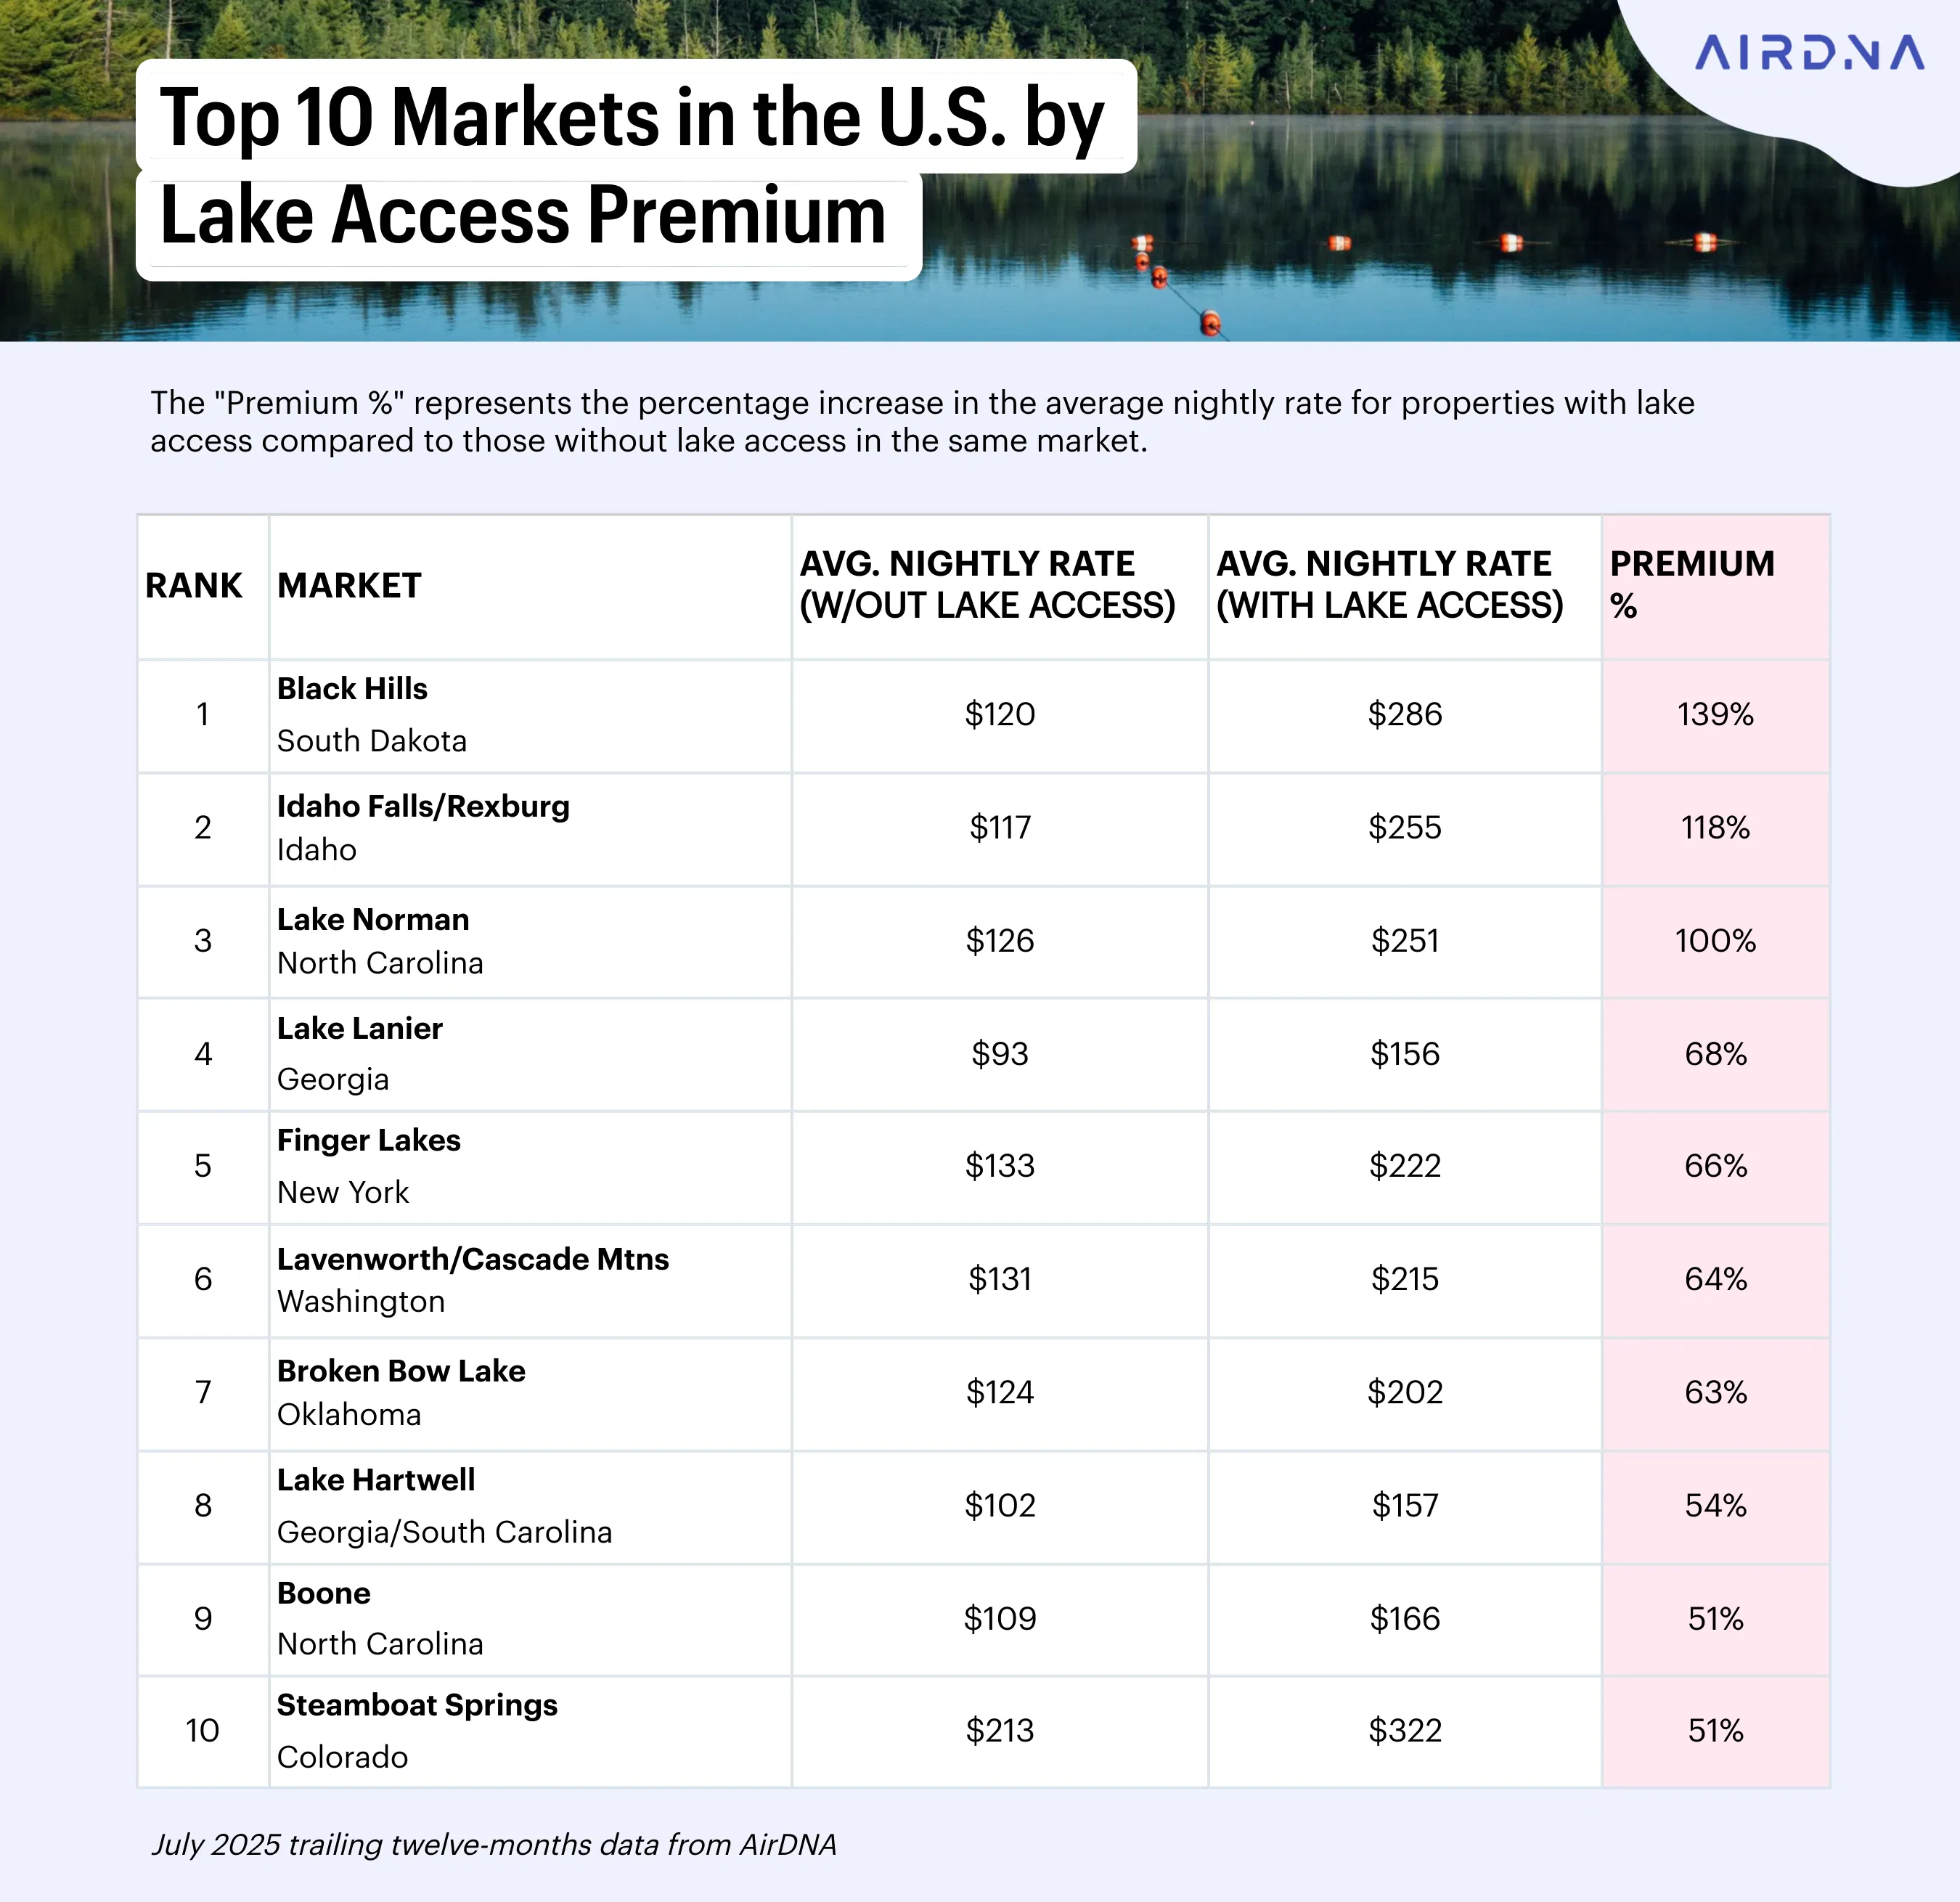
What do they all have in common? Lake access is limited, but guest demand for it is high. These are recreation-first markets where travelers come specifically to spend time on the water, yet not every property offers a dock or shoreline access. That scarcity drives up value. When access is rare, it becomes a feature guests will pay significantly more for, especially during peak season.
The same trend holds true for lake views, which also deliver strong returns in view-heavy markets. Top performers include:
- Lake Lanier, Georgia (+106%)
- Utah area (outside of Salt Lake City) (+83%)
- Lake Hartwell, South Carolina / Georgia (+82%)
- Finger Lakes, New York (+73%)
Still, even in top-performing markets, the impact of lake features can vary widely. Take Idaho Falls, for example. The market as a whole sees a 118% premium for lake access, but in the Island Park submarket, that premium drops to just 33%. Why the difference? In Island Park, lake access is everywhere, so it doesn’t set a property apart. When something becomes expected, it loses its pricing power.
For hosts and investors, it’s a good reminder: lake access isn’t a golden ticket. It’s not just about whether a property has a dock or a view. It’s about how rare and desirable those features are in that specific market. If everyone has access, no one’s paying extra for it.
Want to know where lake access really pays off? Check out our guide on the best places to buy a lake house. It dives into the top-performing lake markets and shows how you can use AirDNA to browse lakefront properties for sale.
Get reliable data for smarter investment decisions
AirDNA allows you to handpick the active short-term rentals that align with your investment criteria and shows you exactly how a similar property performs in the real world.
Key Factors that Shape Lake House Airbnb Income
Choosing the right property and the right market is a big part of STR success, but it’s only part of the picture. The layout, features, and seasonality of your lake house all play a role in how much you can actually earn. Here's a closer look at key lake house rental pricing factors that affect income.
Property size and layout
Larger homes often come with higher earning potential, especially in markets where lake trips are group trips. Families, friend groups, and multi-generational travelers often search for listings that can sleep 6 to 10 guests comfortably.
In Lake Norman, a high-performing lake market in the Mid-Atlantic, 4-bedroom homes with lake access see the highest revenue premium among different property sizes. RevPAR for these listings is 67% higher than same-sized properties without lake access, jumping from $133 to $222 per night. In contrast, 1-bedroom properties with lake access only earn 30% more than listings without direct access to Lake Norman. The data suggests that mid-size properties strike the best balance between space and affordability for guests.
Keep in mind that more bedrooms can boost your average daily rate (ADR), but they also come with added costs: cleaning, maintenance, and sometimes higher insurance premiums, especially near the water.
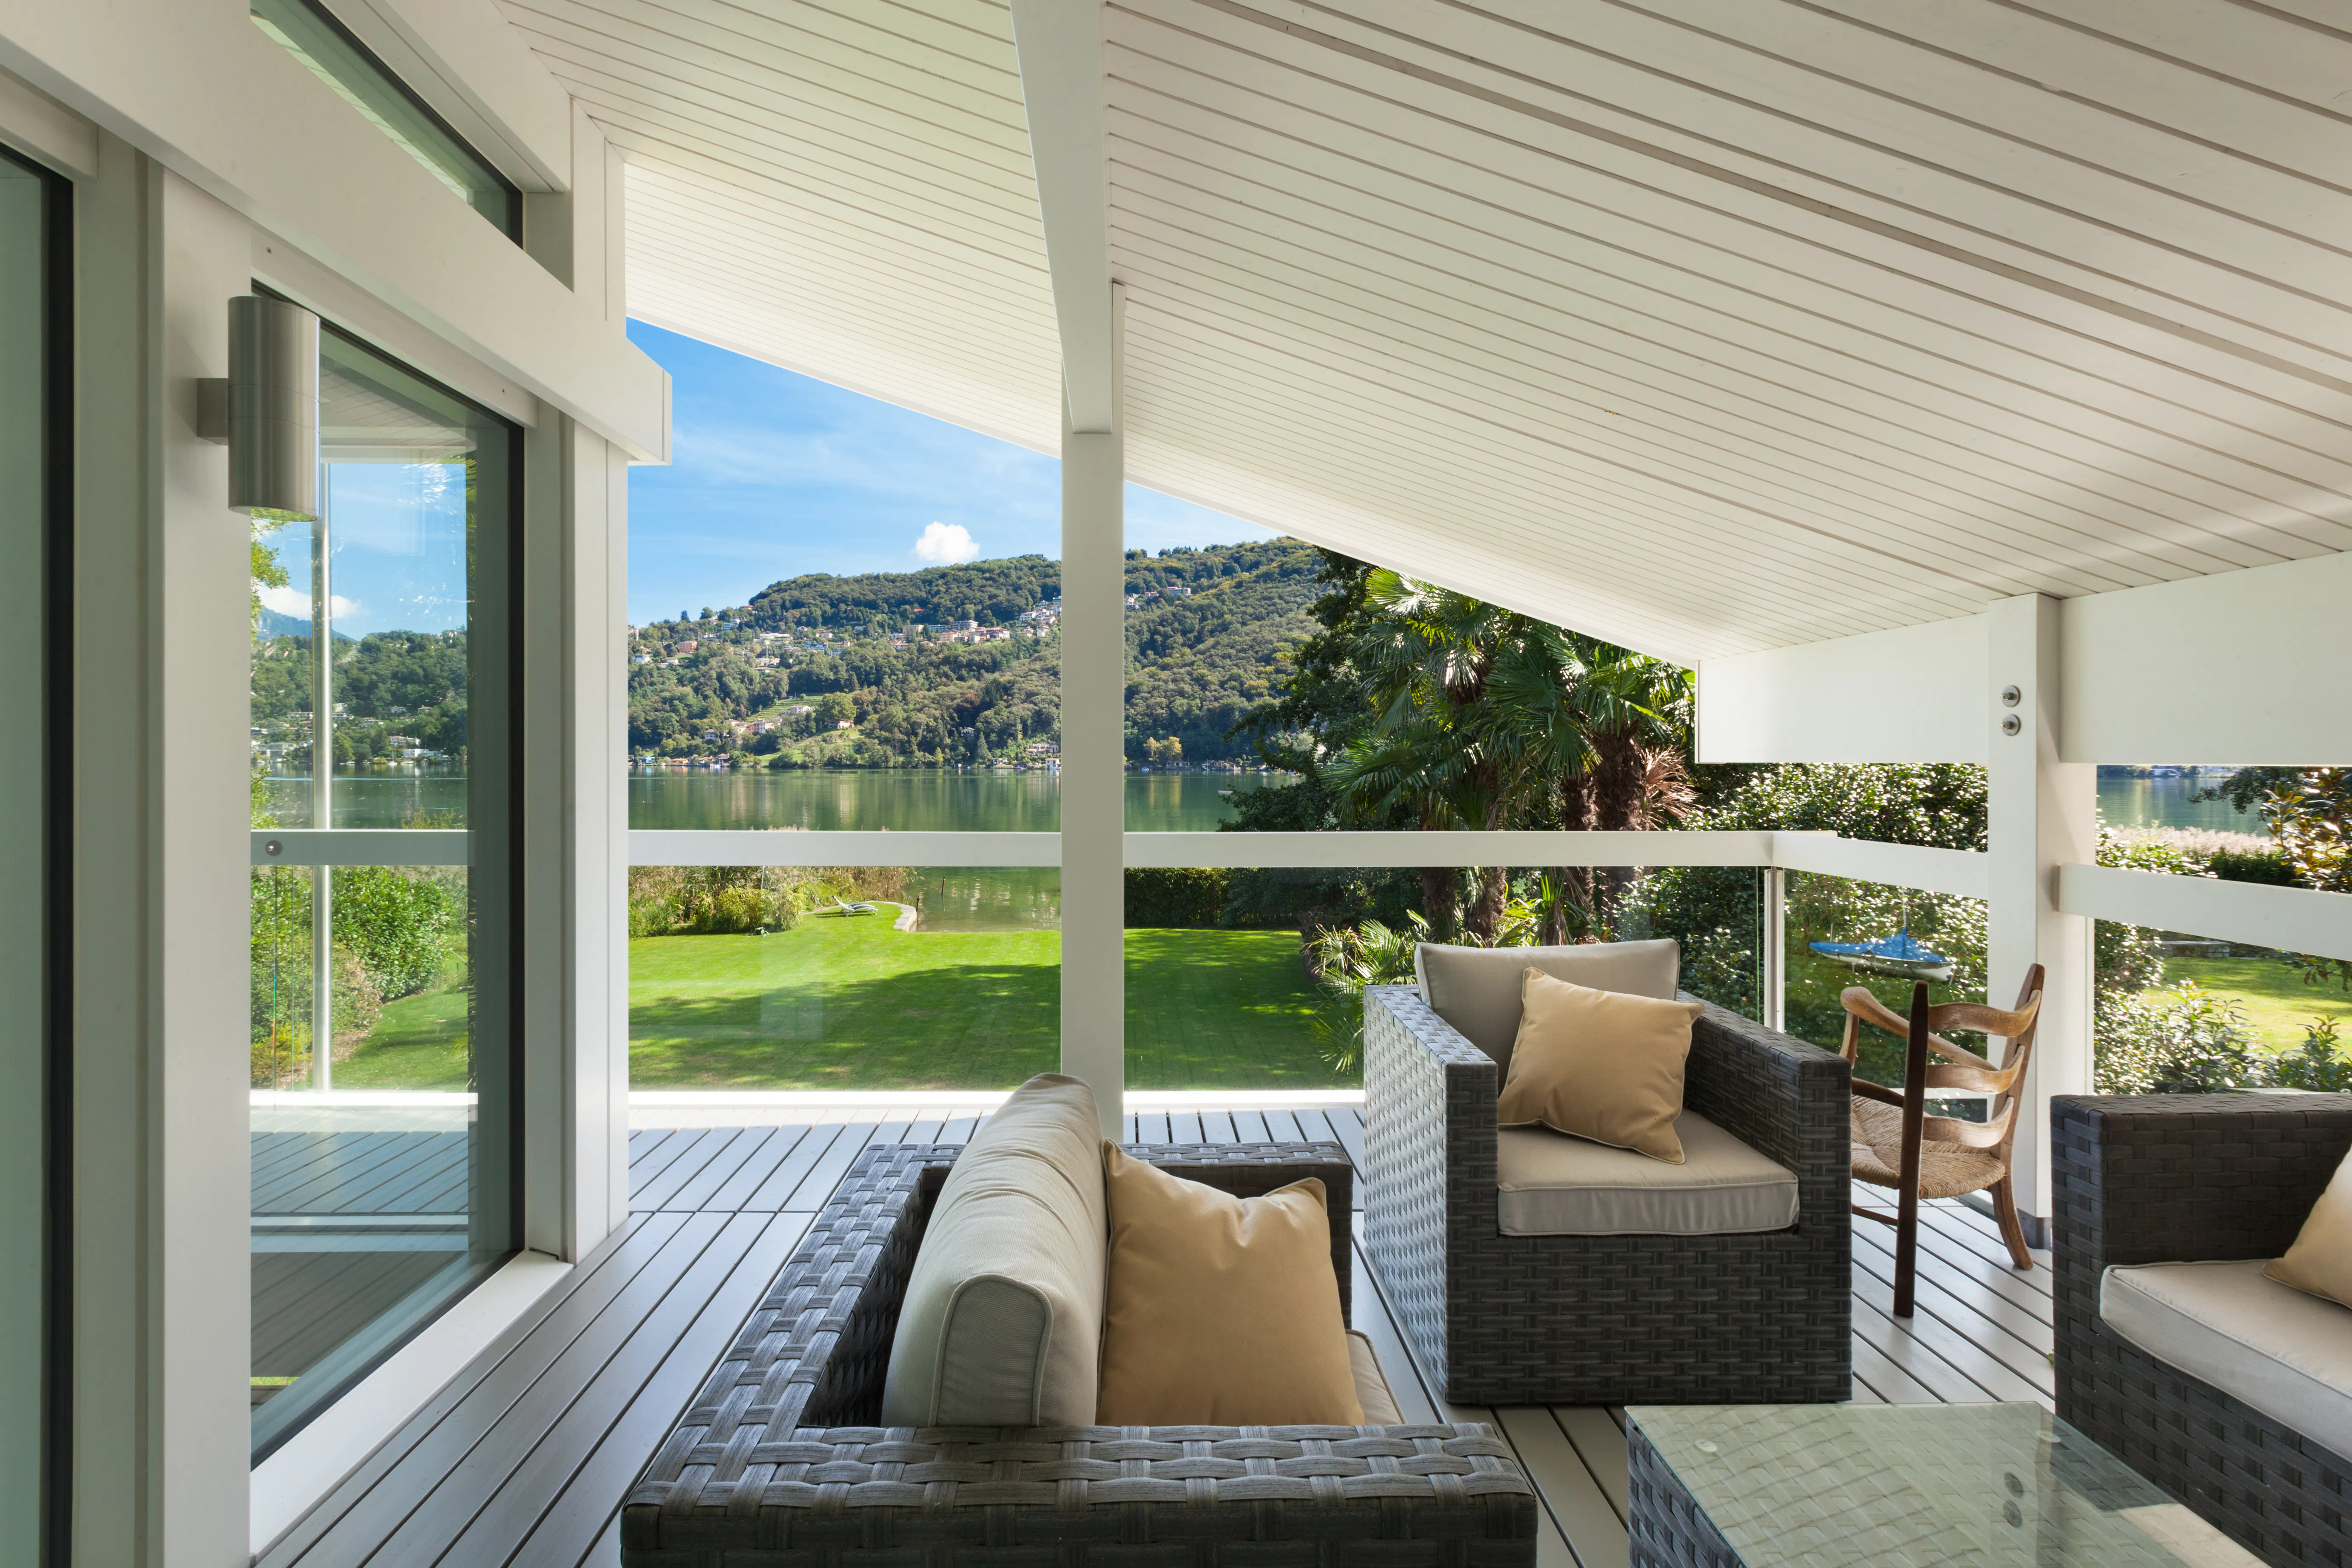
Type of lake access or view
Not all lake features are created equal. A private dock tends to be the most valuable, giving guests direct water access and a place to swim, launch kayaks, or tie up a boat. Shared docks or walkable access still add value, but often at a smaller premium.
The same goes for lake views. A full, unobstructed view often supports a higher nightly rate than a partial or peek-a-boo view. And when a property offers both lake access and a lake view, the impact may stack, boosting price and perceived value.
If you’re comparing properties or thinking about upgrades, it’s worth considering how unique or desirable your access type is within your local market.
Seasonality and guest demand
Lake properties are often seasonal, and understanding that cycle is key to maximizing revenue. In most markets, summer is the busiest season. That’s when guests are looking for warm weather, water activities, and long weekends by the lake.
That said, some mountain-lake markets perform well year-round, especially if listings feature fireplaces, hot tubs, or mountain views that attract winter travelers. A lake house with strong offseason appeal (or one located near ski resorts or fall foliage) can help balance out seasonal dips.
For hosts, the strategy lies in aligning with local travel patterns and finding ways to maximize profits year-round, even as guest demand shifts with the seasons.
Local costs, regulations, and taxes
Finally, the financials behind the scenes matter too. Short-term rental regulations vary widely, and in some lakefront communities, permits are capped or heavily restricted. Lakes with HOAs may also have strict rules around rental use, parking, noise, or access.
On top of that, short-term rental insurance and maintenance costs are often higher near water, especially for homes with docks, seawalls, or erosion risk. Taxes may also be higher depending on the jurisdiction.
How to Estimate Airbnb Lakehouse Income Using AirDNA
Whether you’re just starting to browse lakefront homes or zeroing in on a specific property, AirDNA makes it easy to forecast rental income. With tools to filter by property type, location, and features like water access, you can build a custom comp set and get a clear view of income potential.
Here’s how to use AirDNA to see how much you can earn on Airbnb with a lakehouse:
1. Choose a market
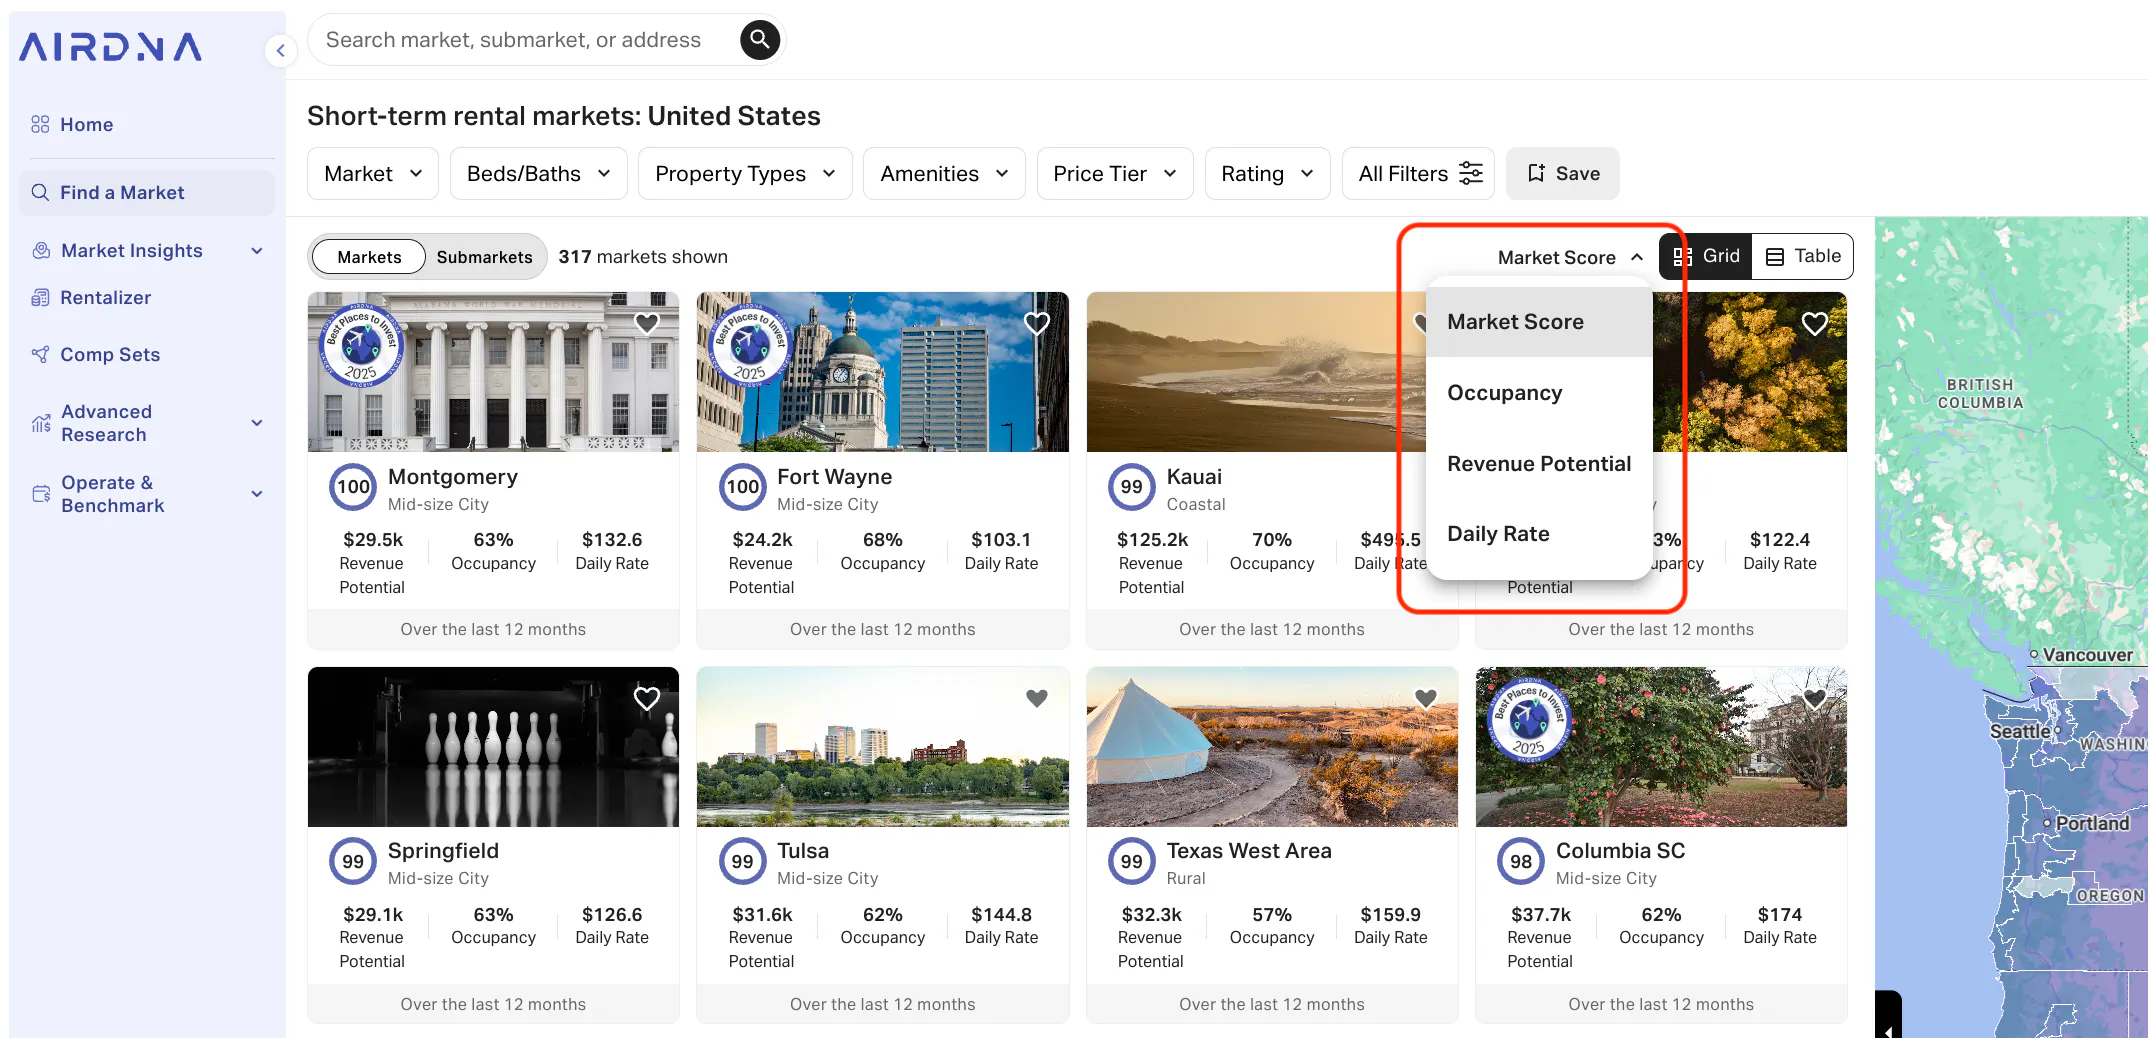
Start by identifying a market you’re interested in. AirDNA's Find a Market page shows top-performing short-term rental markets across the U.S. Markets are automatically sorted by Market Score, an AirDNA metric that captures overall market health on a scale of 40 to 100. You can also sort markets by Revenue Potential to find areas with strong income performance—ideally balanced with a high Market Score for long-term sustainability.
2. Drill down into a submarket
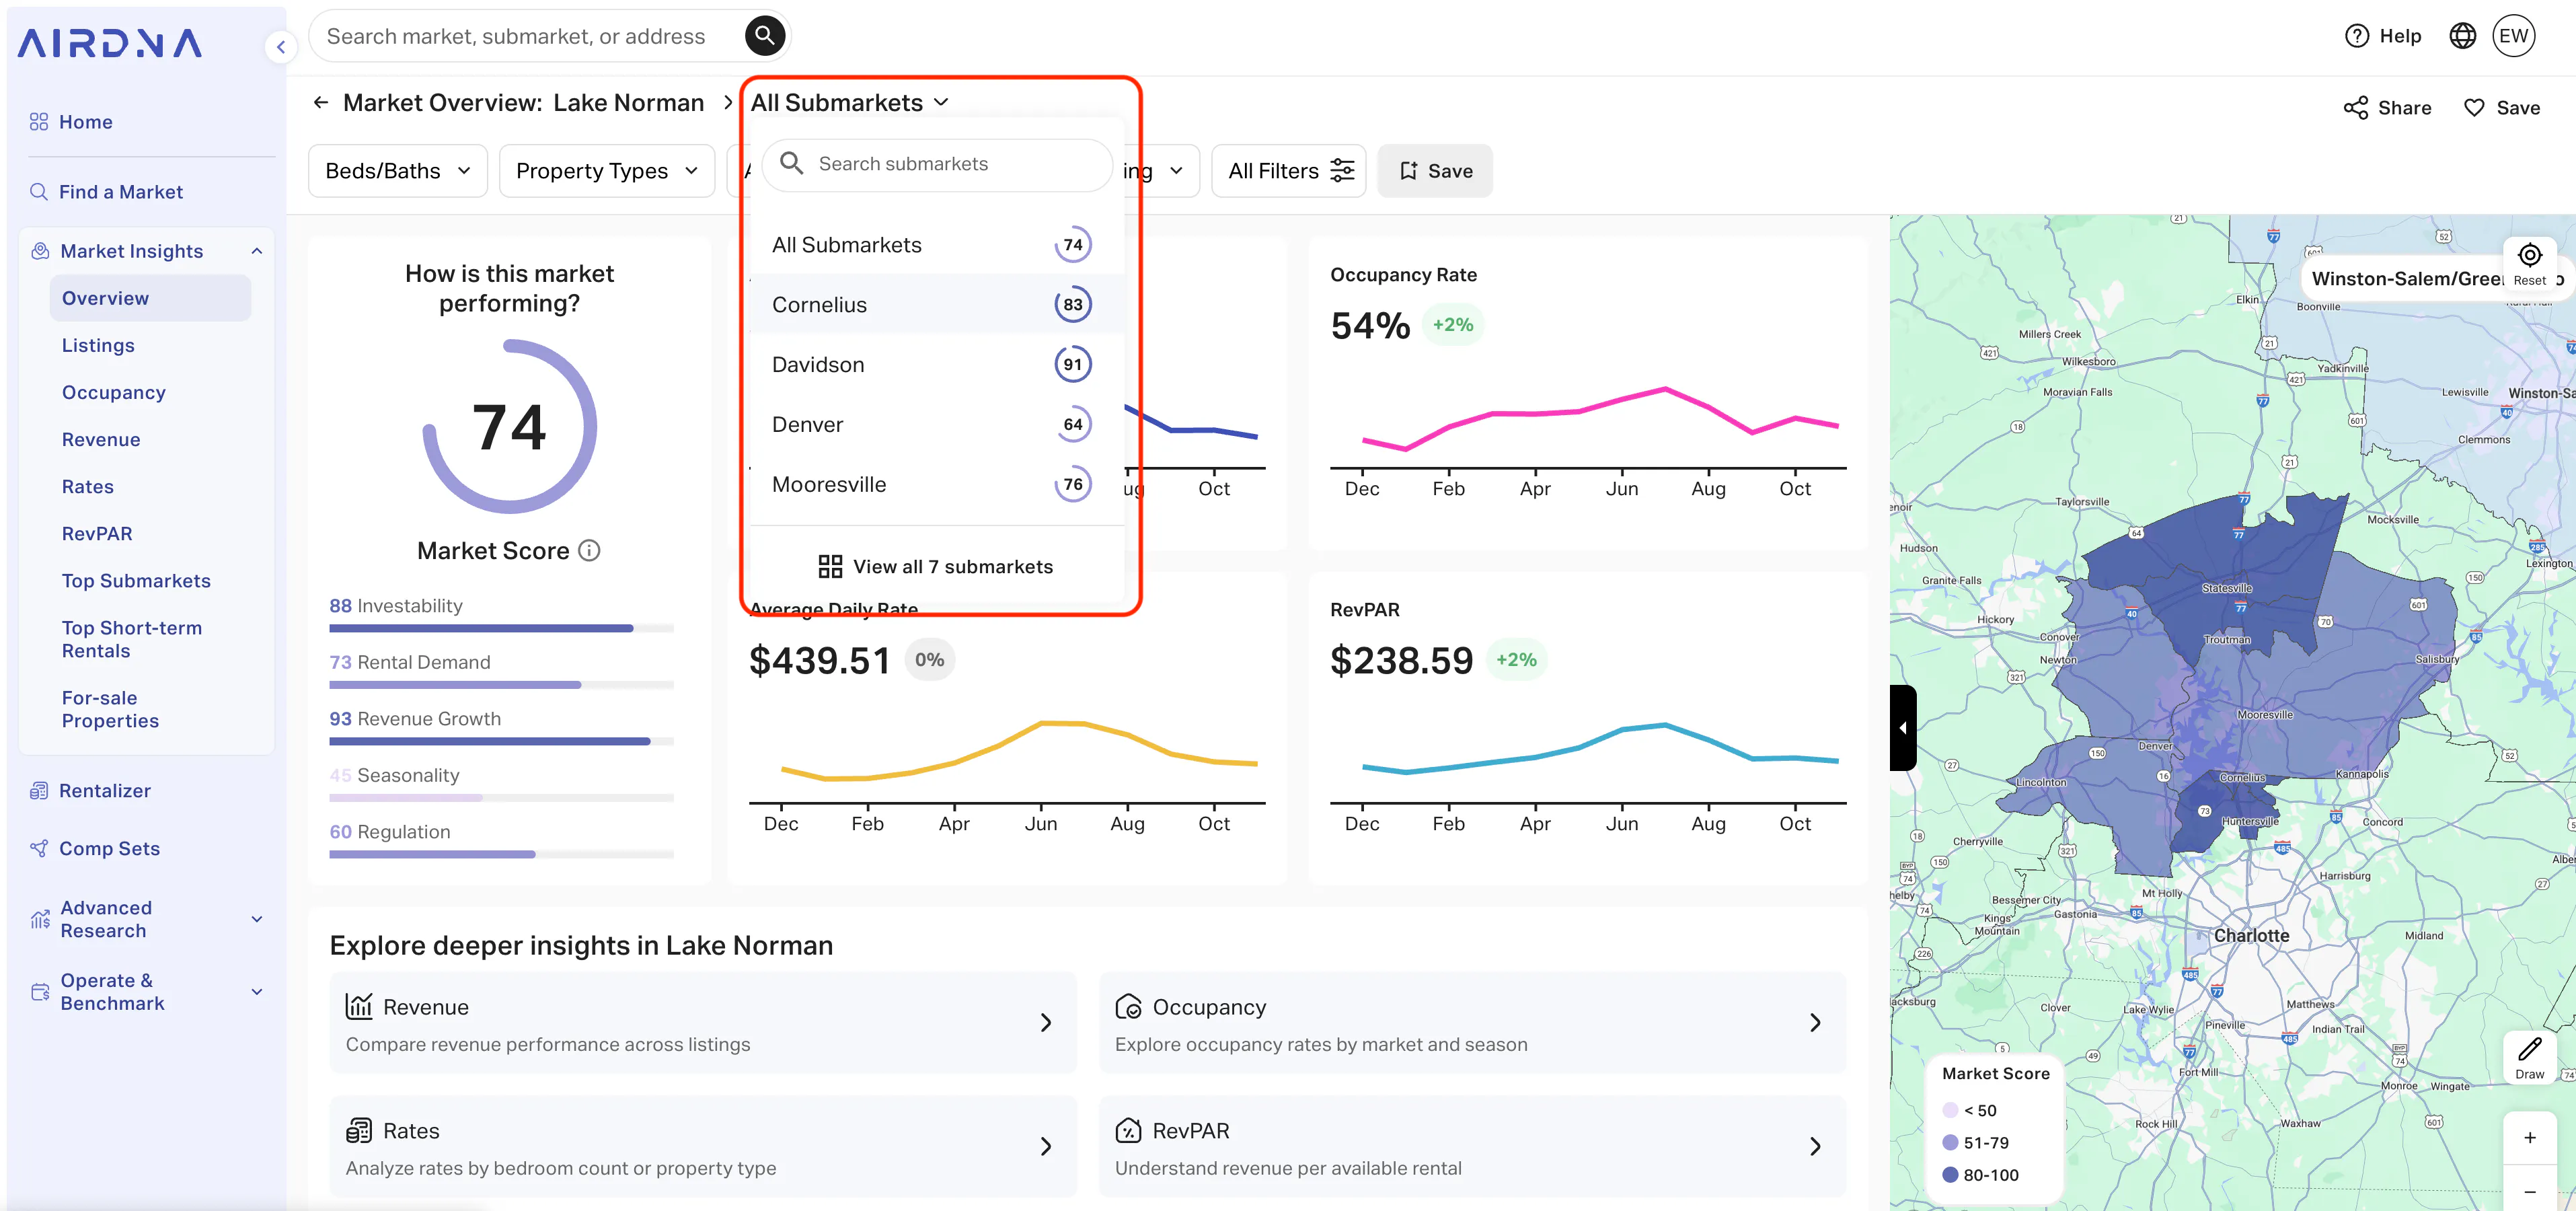
Once you’ve selected a broader market, dig deeper. Many high-performing areas (especially around lakes) have distinct submarkets that perform differently. Look for places where lake access or views are less common. That’s where pricing premiums are more likely to show up. In the case of the Lake Norman market in North Carolina, there are 7 submarkets with Market Scores ranging from 65 at the low end to 98 at the high end.
Notice the color-coded map on the right-hand side of Market Overview results. The map helps you visualize where submarket boundaries are drawn and hints at their performance strength. The darker the purple, the higher their Market Score. For this tutorial, we’ll focus on the submarket of Cornelius.
3. Filter listings to build an accurate comp set
Use filters to narrow your comparison so that you’re focusing on the type of property that you’re actually considering. Applying filters will tailor the performance information to the properties within that market that fit your chosen parameters. Filters help you avoid overestimating based on unrelated features. AirDNA offers 3 filter categories: Listings, Performance, and Amenities.
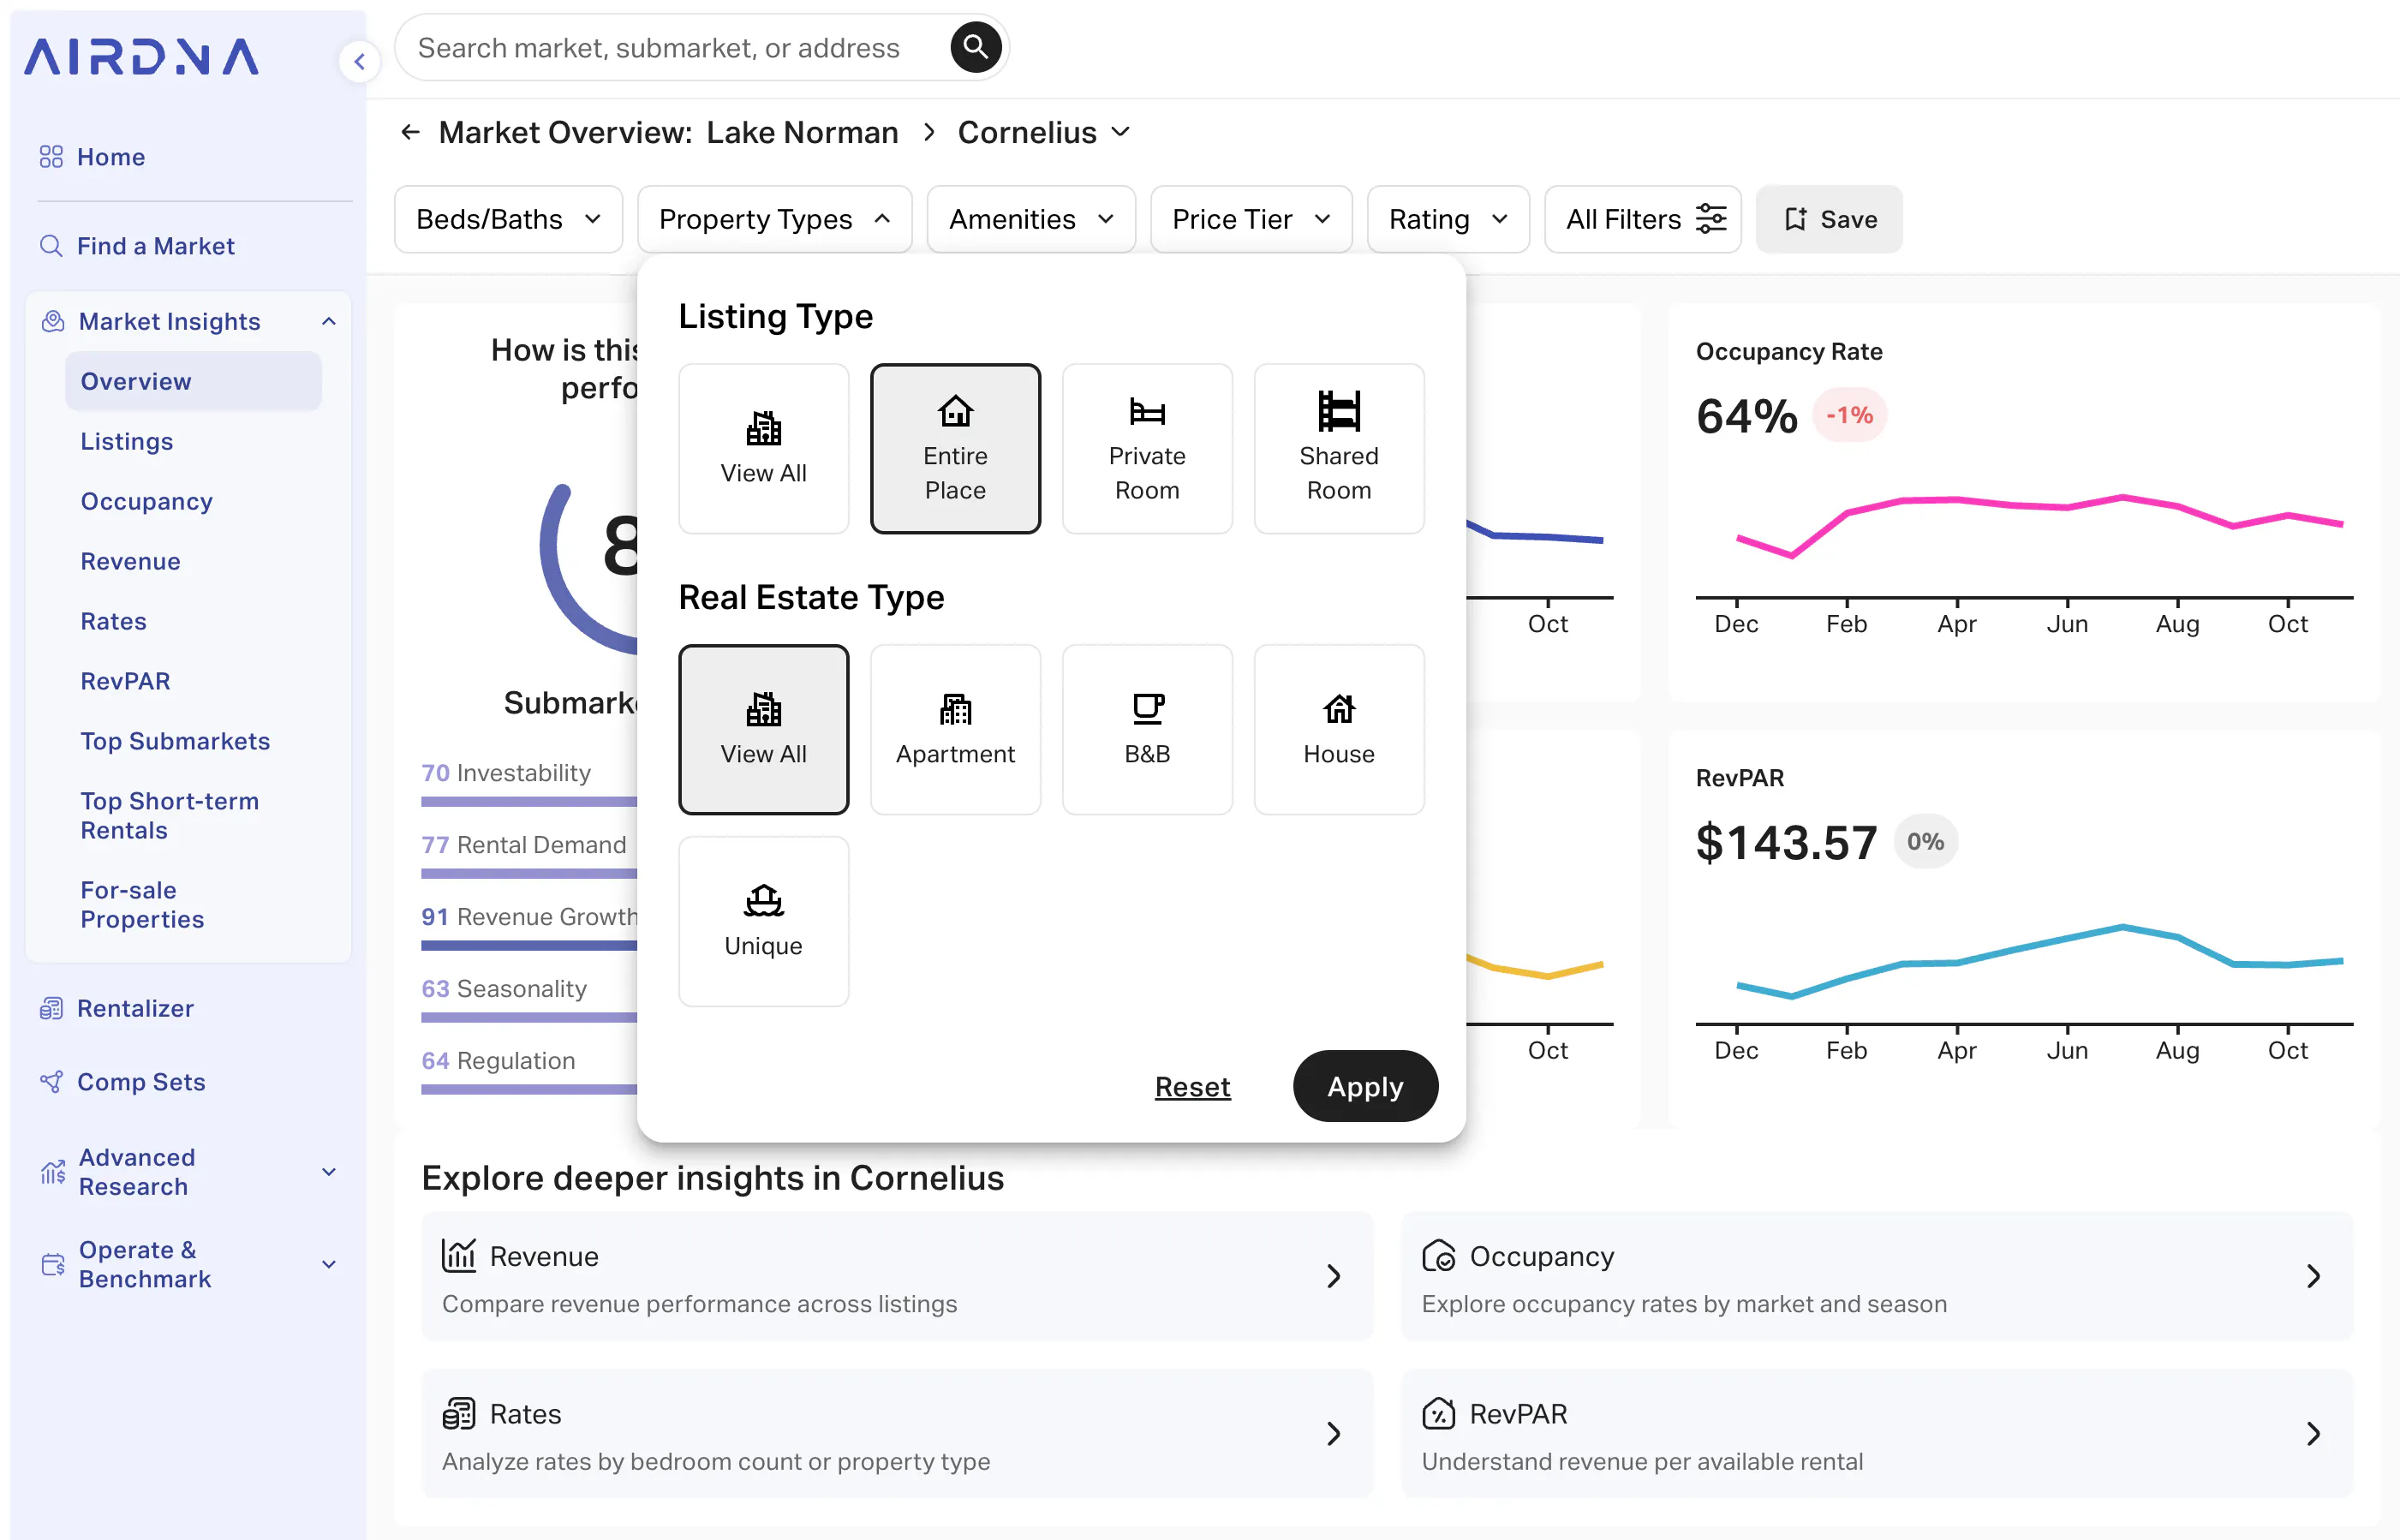
In this example, we’ll assume we plan to rent out an entire property rather than offer a private room within a home. We want the property to operate full-time as a vacation rental. With that in mind, we apply the following filters:
- Listing type: Entire place
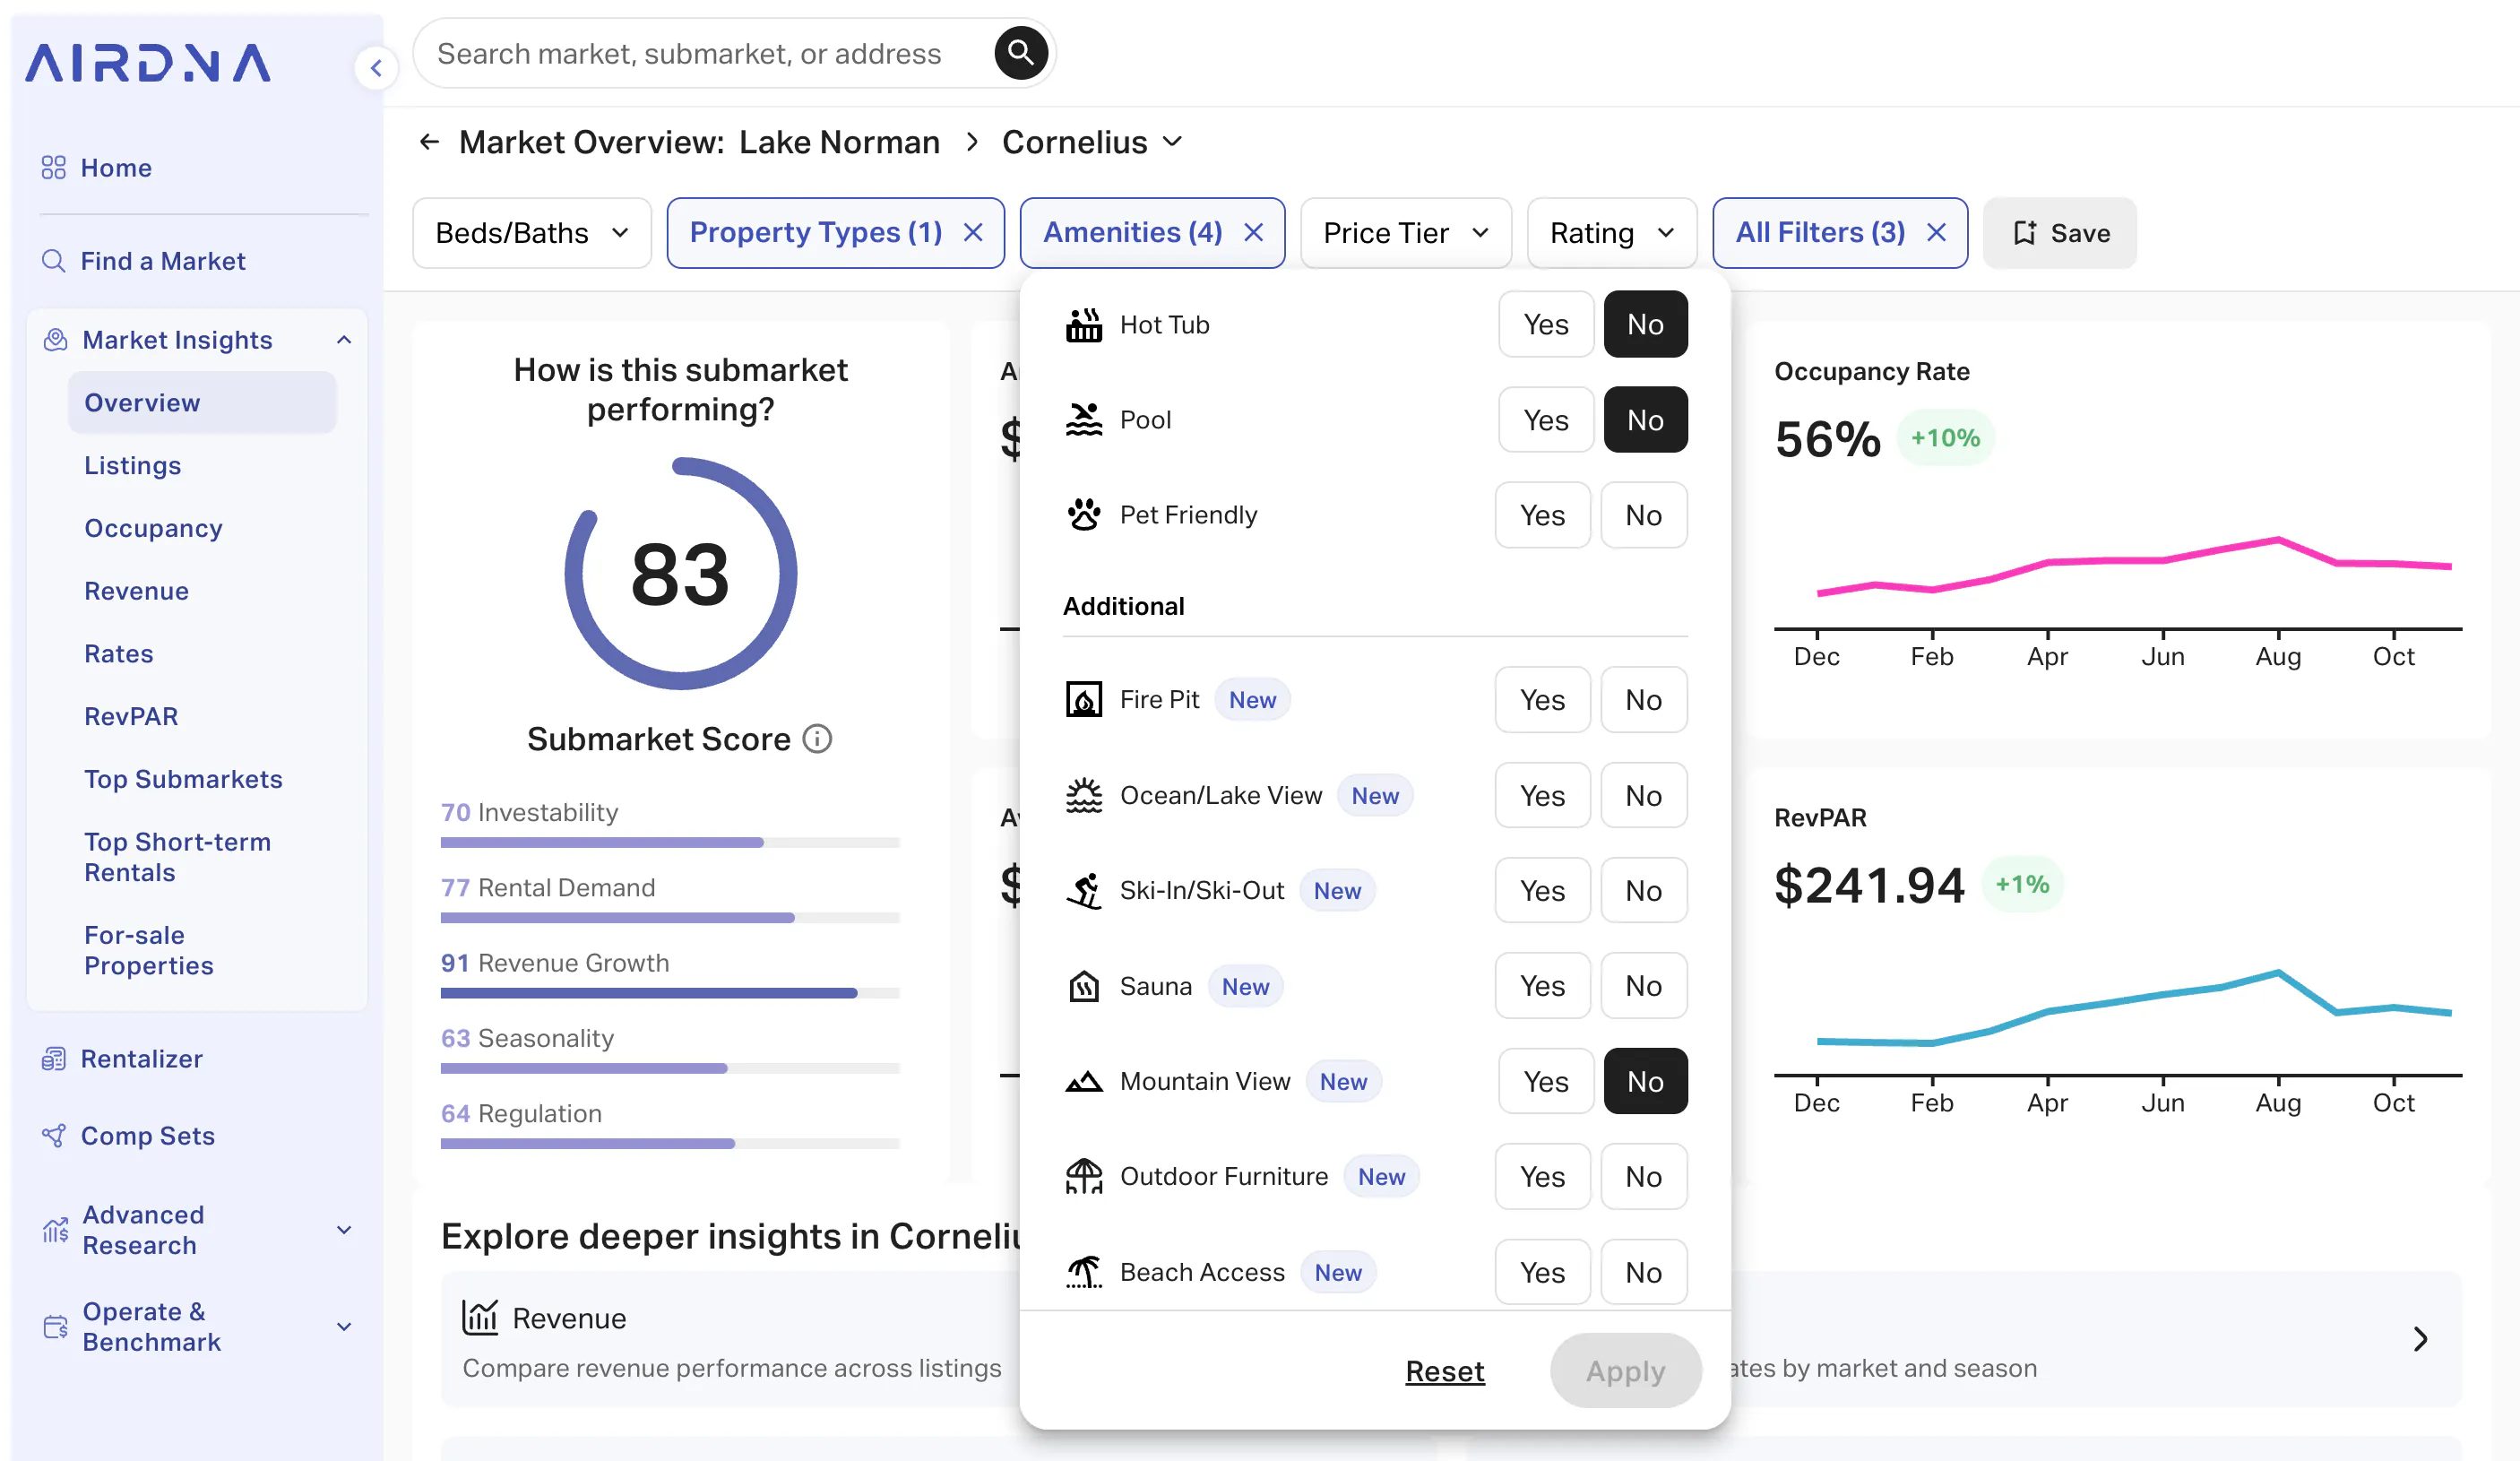
- Remove premium amenities like hot tubs, pools, or mountain views to isolate the value of lake access or a lake view.
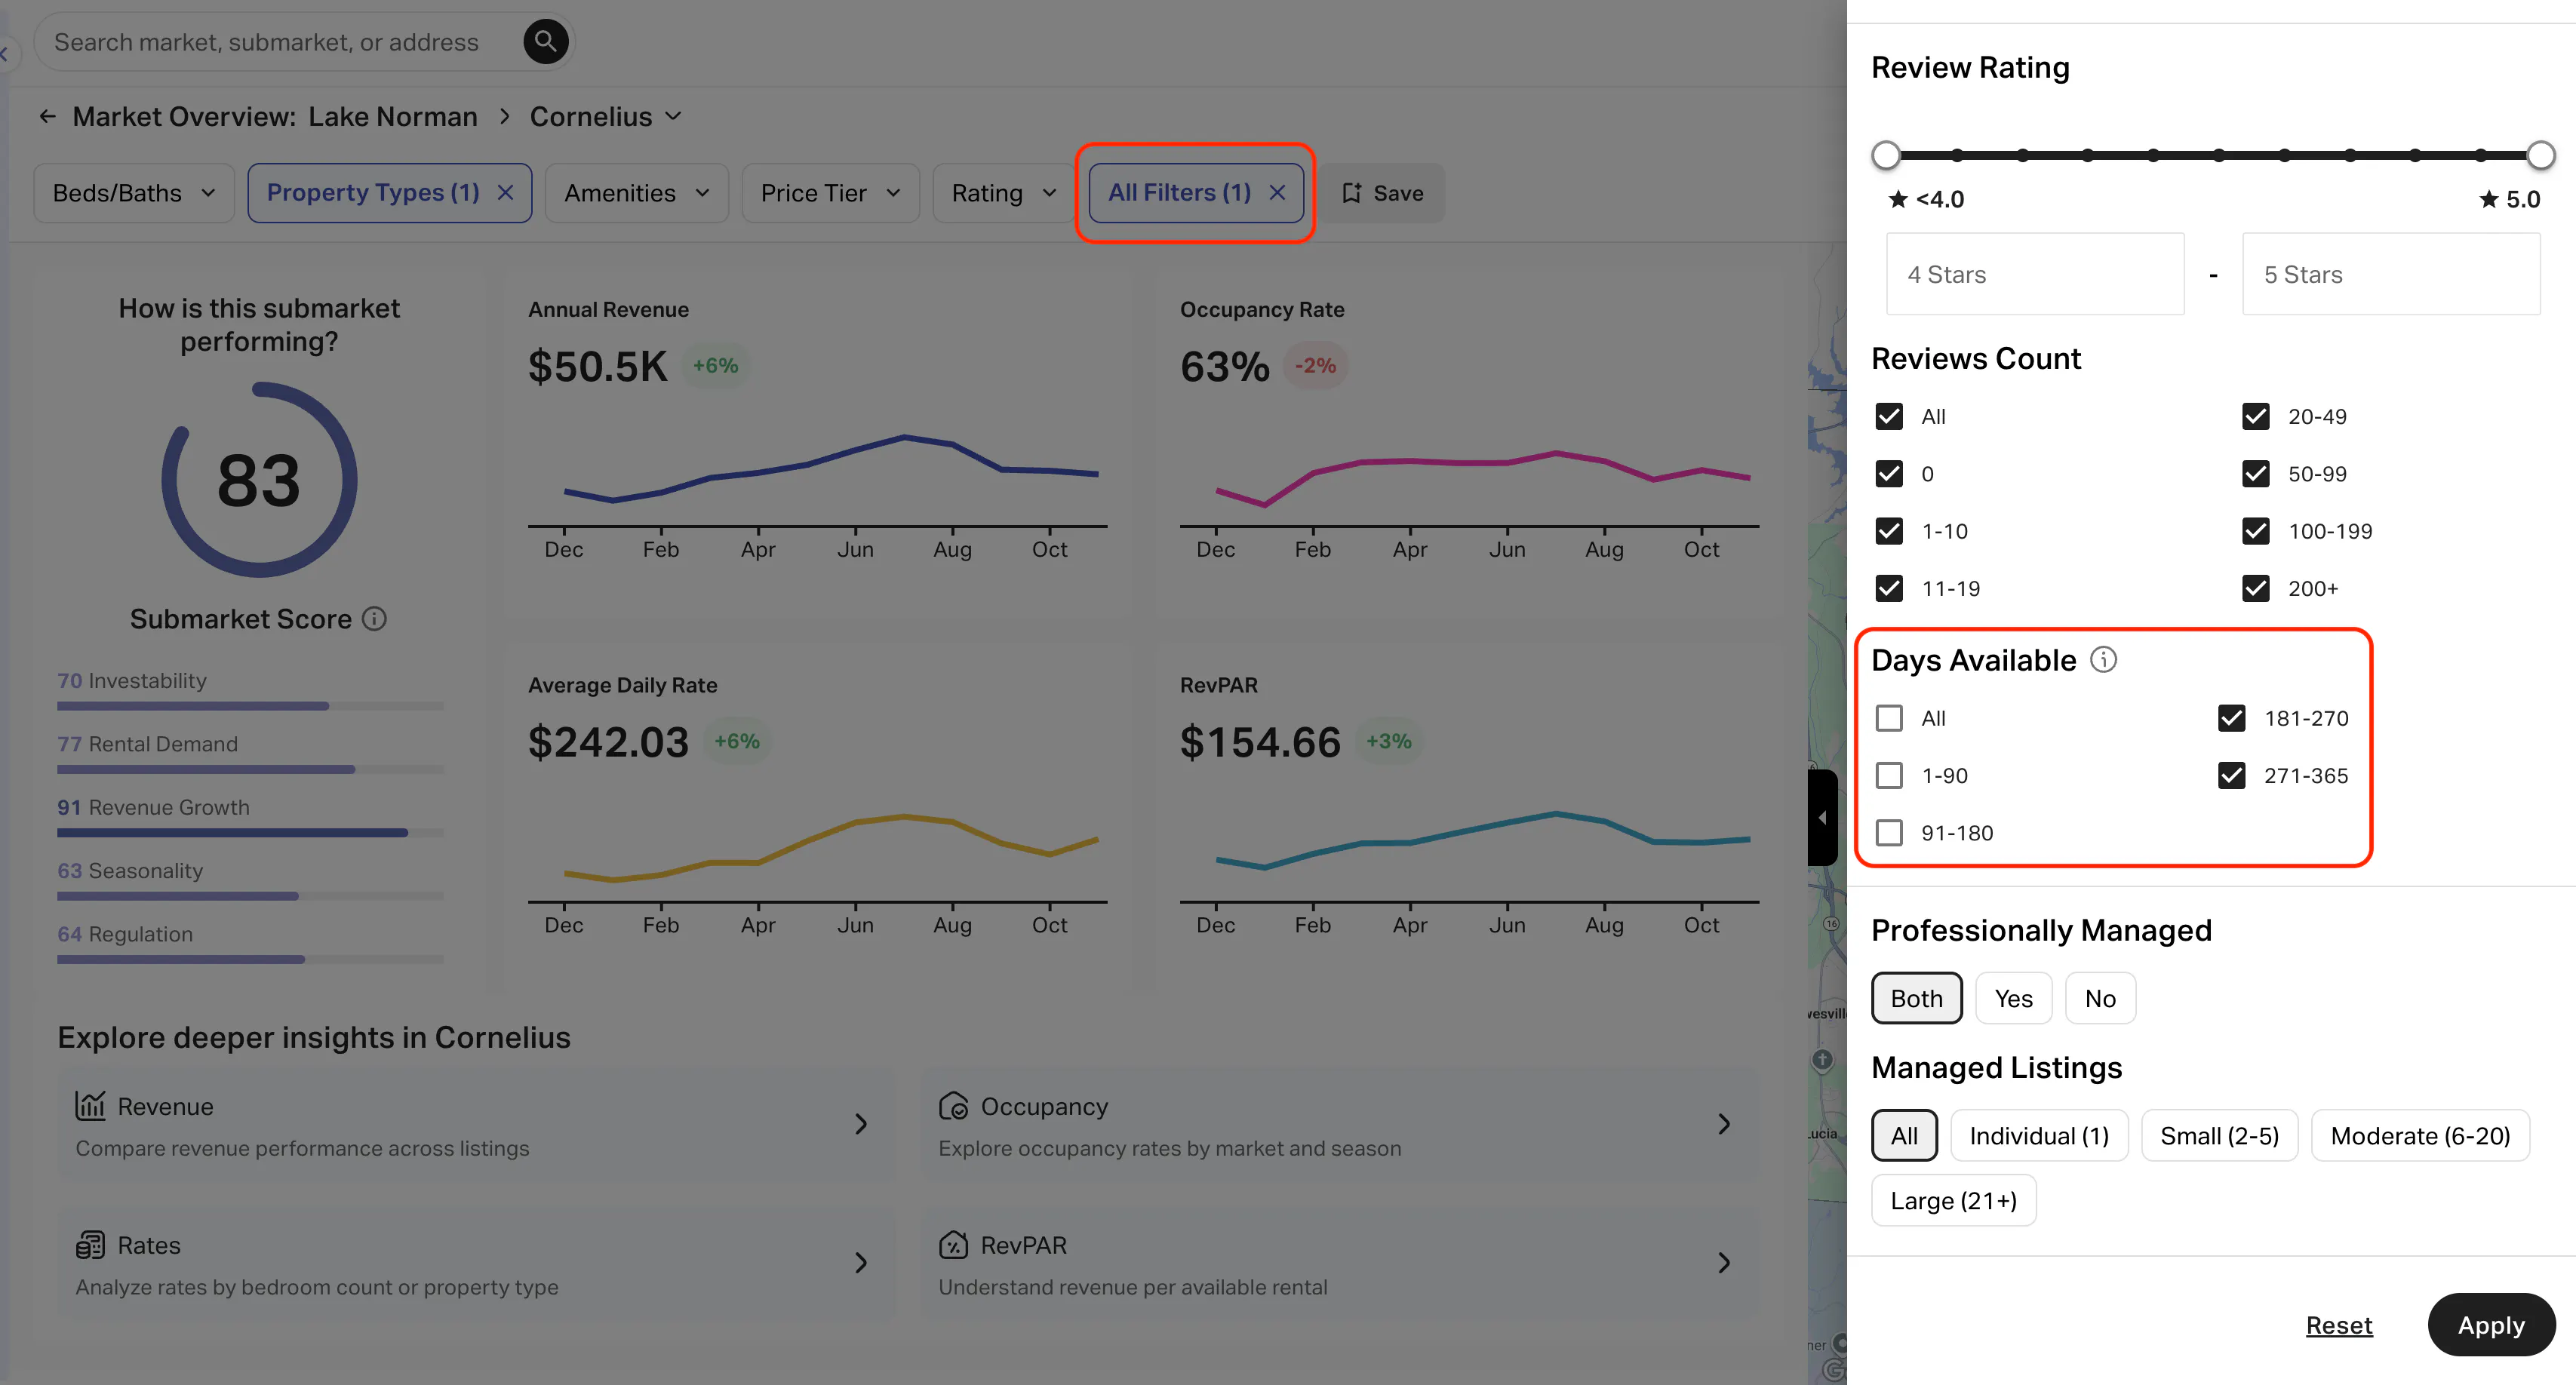
- Days available: 180+ (This captures professional listings, but you can adjust the range based on the seasonality of the market)
Some filters are hidden in the 'All Filters' dropdown menu, which will open on the right handside. Here, you can apply filters for days available, professional management, host portfolio size, and listing channel.
4. Create two custom comp sets
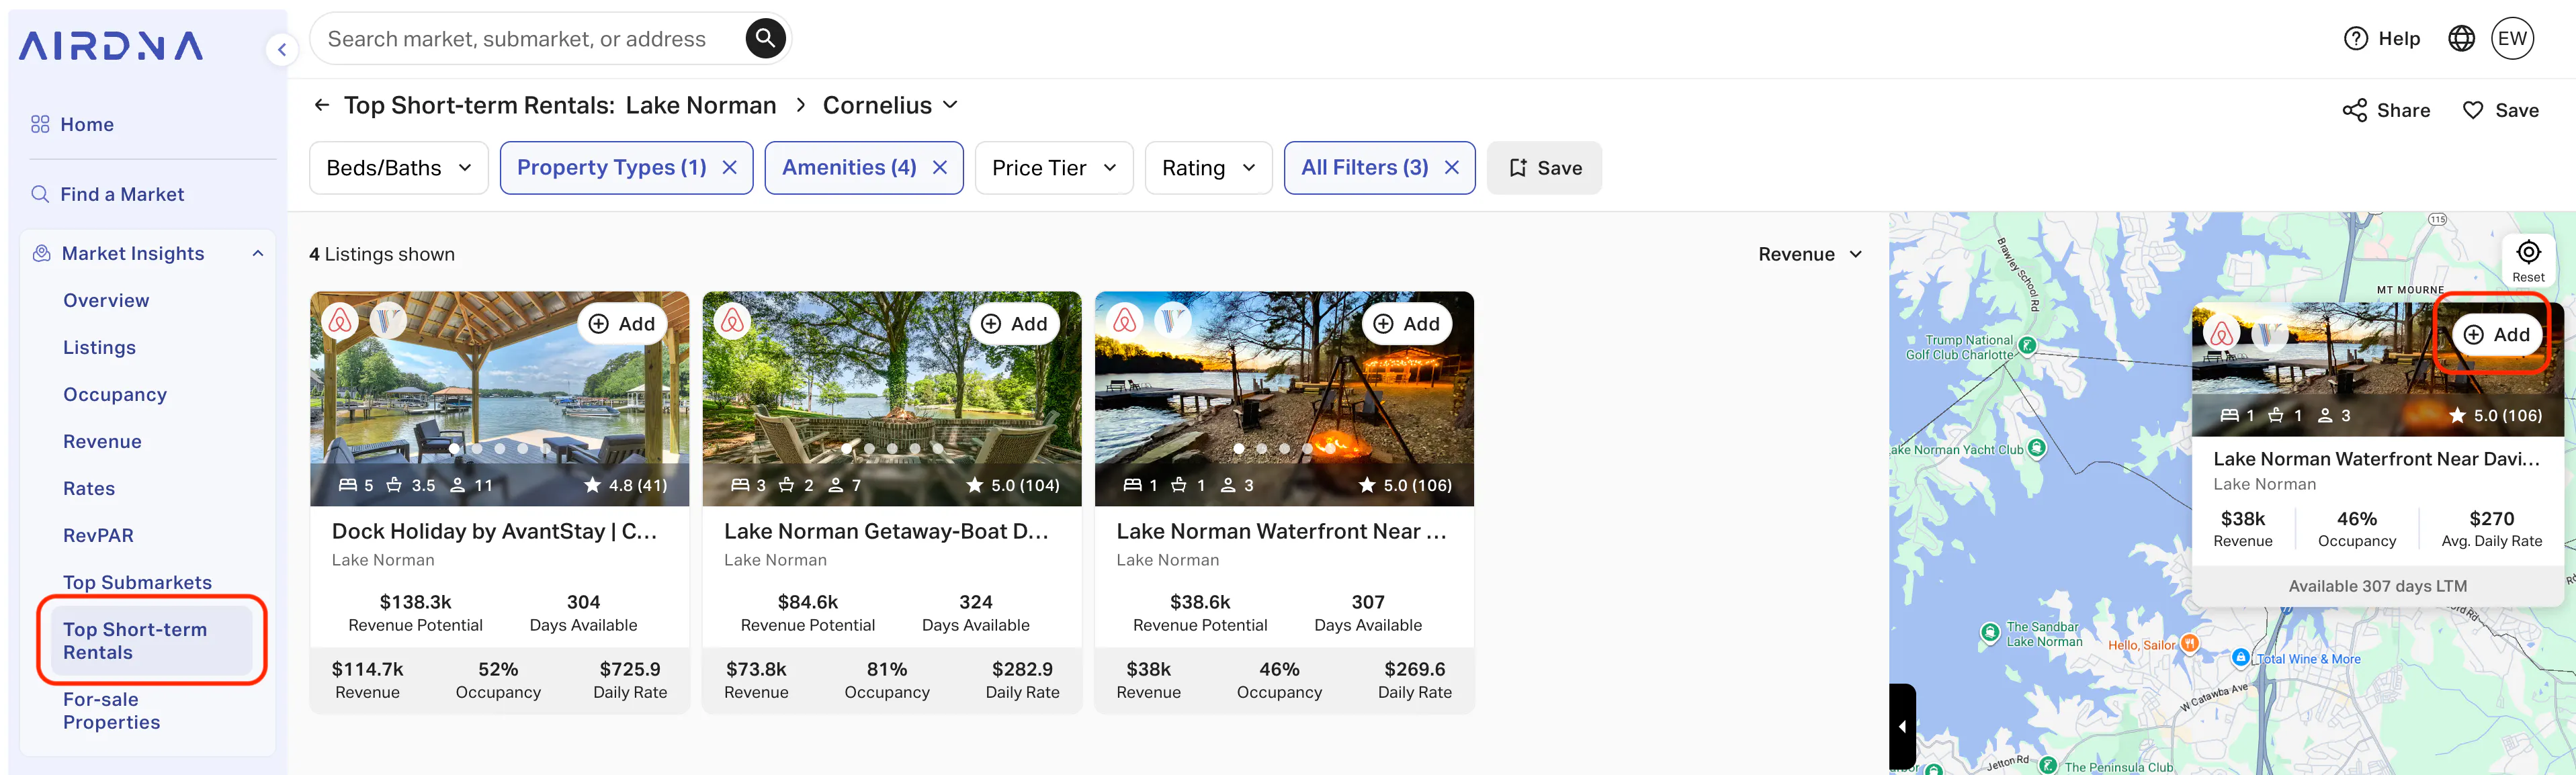
Up to this point, we’ve been looking at the Overview section of the Market Insights page. Now, let’s look at the Top Short-Term Rentals in the area. Remember, the filters we applied are still active here so we’re only seeing home rentals that are available 6 months or more and don’t have any standout amenities.
Notice that all of the active vacation rentals in the Cornelius submarket are also visible on the map as purple dots on the right. From here, you can add individual listings into a comp set folder to isolate the performance of properties on the lake and those set back from the lake.
Since we're trying to isolate the effect of having direct lake access, apply 'yes' to the Waterfront filter under amenities and start adding properties that have direct access to the lake into a comp set folder. You can do this by clicking on the ‘+ Add’ button for that listing in the property tile view on the left of by hovering over the purple dot.
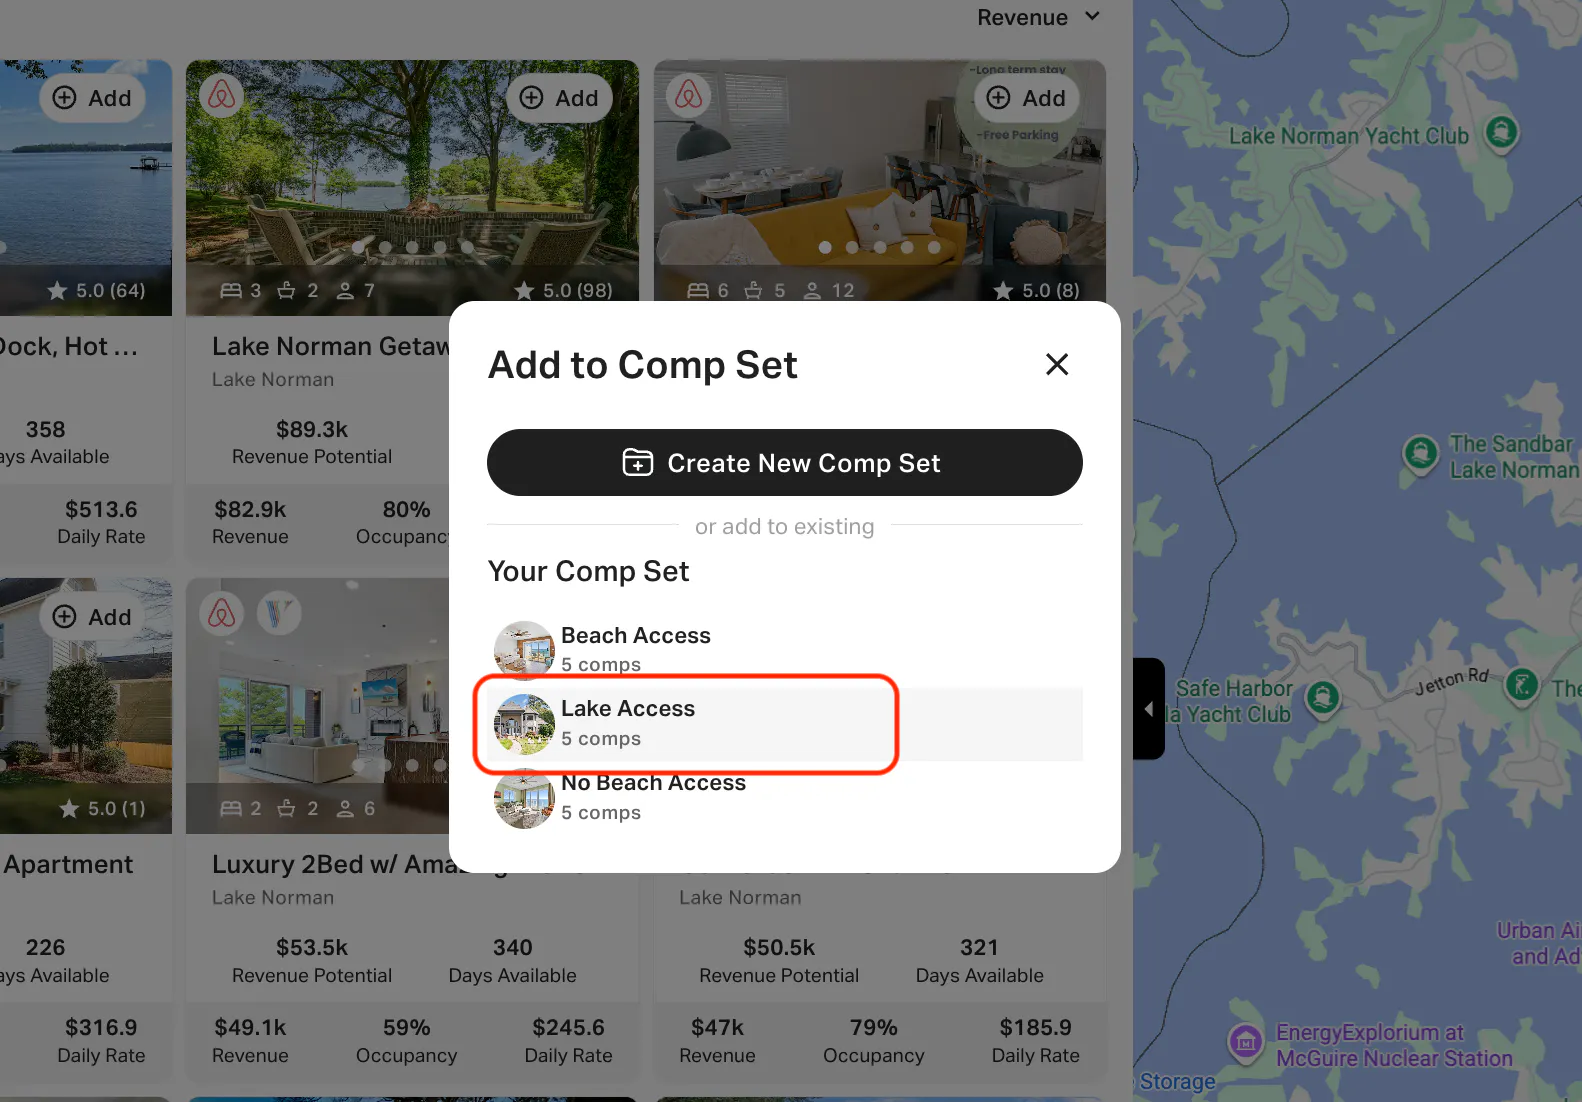
If you’ve already created a folder, it will appear as an option in a pop up window.
If you’re just getting started with this comp set, you’ll need to select ‘Create New Comp Set’ from the pop-up window. Doing so will bring you to a new page that is designed to make it easier to select properties. The properties you’ve already included will appear in the ‘My Comps’ section on the left. Other available short-term rental listings are below in ‘Available Comps.’ Note that your filter selections get lost when you move from the Market Insights page to the comp set builder, so you’ll need to reapply the entire property, available days, and amenities filters.
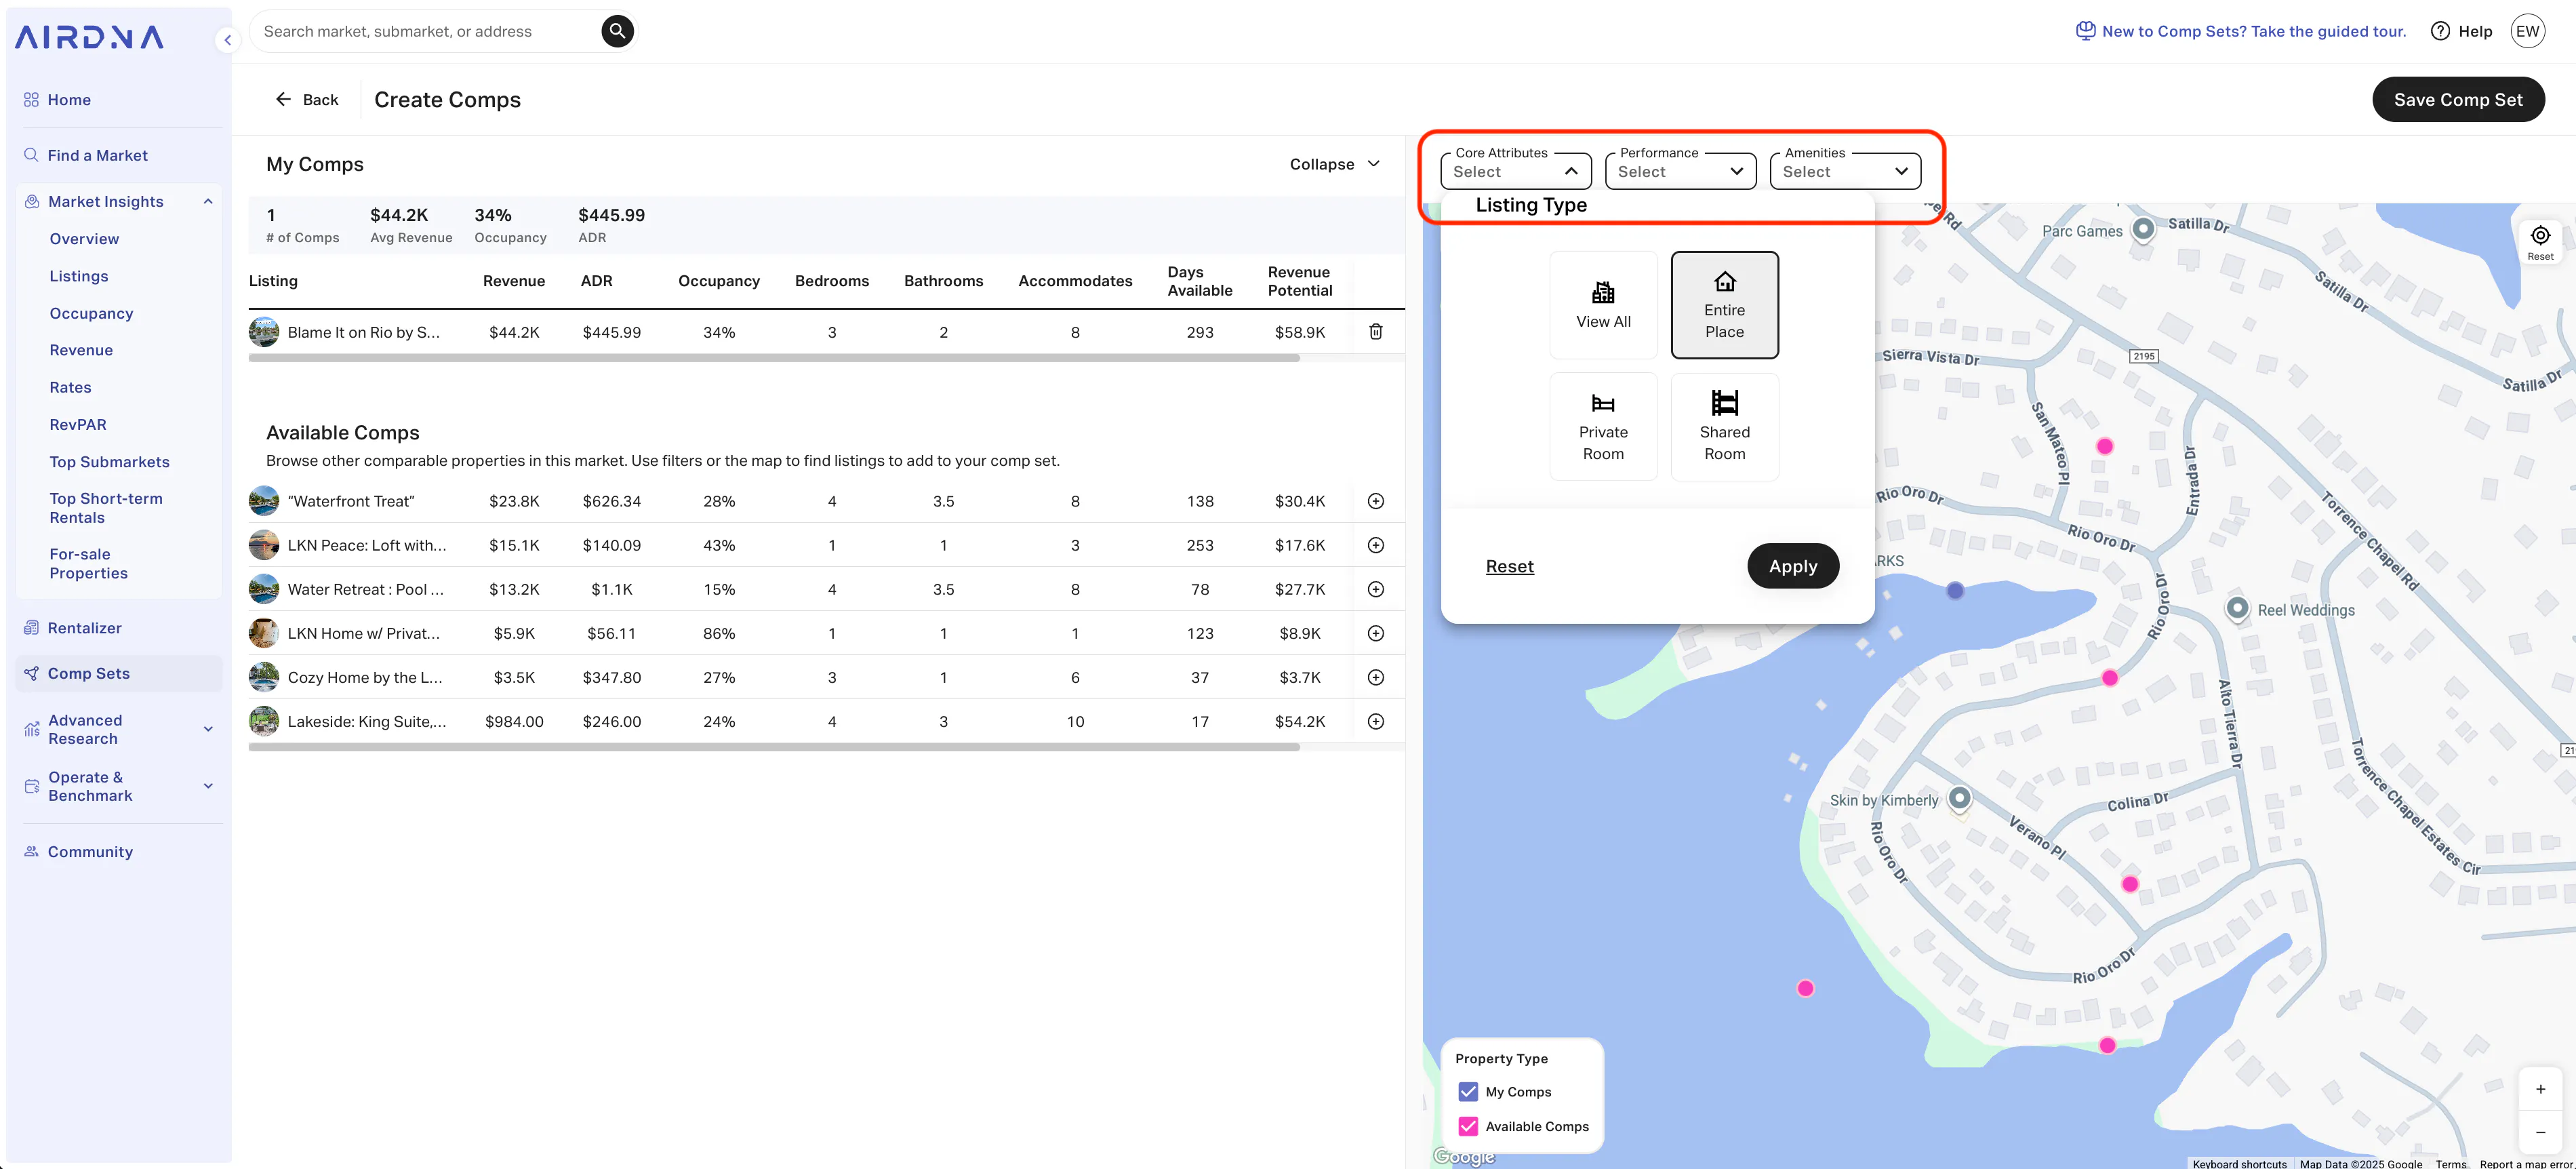
In the case of Cornelius, North Carolina, there is a scarcity of existing lakefront short-term rentals that fit our parameters. In this case, we might need to add some comparable properties from adjacent submarkets to create a comp set that has enough performance data to make the insights meaningful and accurate. You’ll want to aim for 10 or more properties in a comp set
Once you’ve created your comp set for properties on the lake, create a second comp set for those nearby, but without direct lake access. Adjust the Waterfront filter to exclude properties with direct lake access. Try your best to choose short-term rentals that are close to each other and are a similar distance from the lake.
5. Review and compare performance
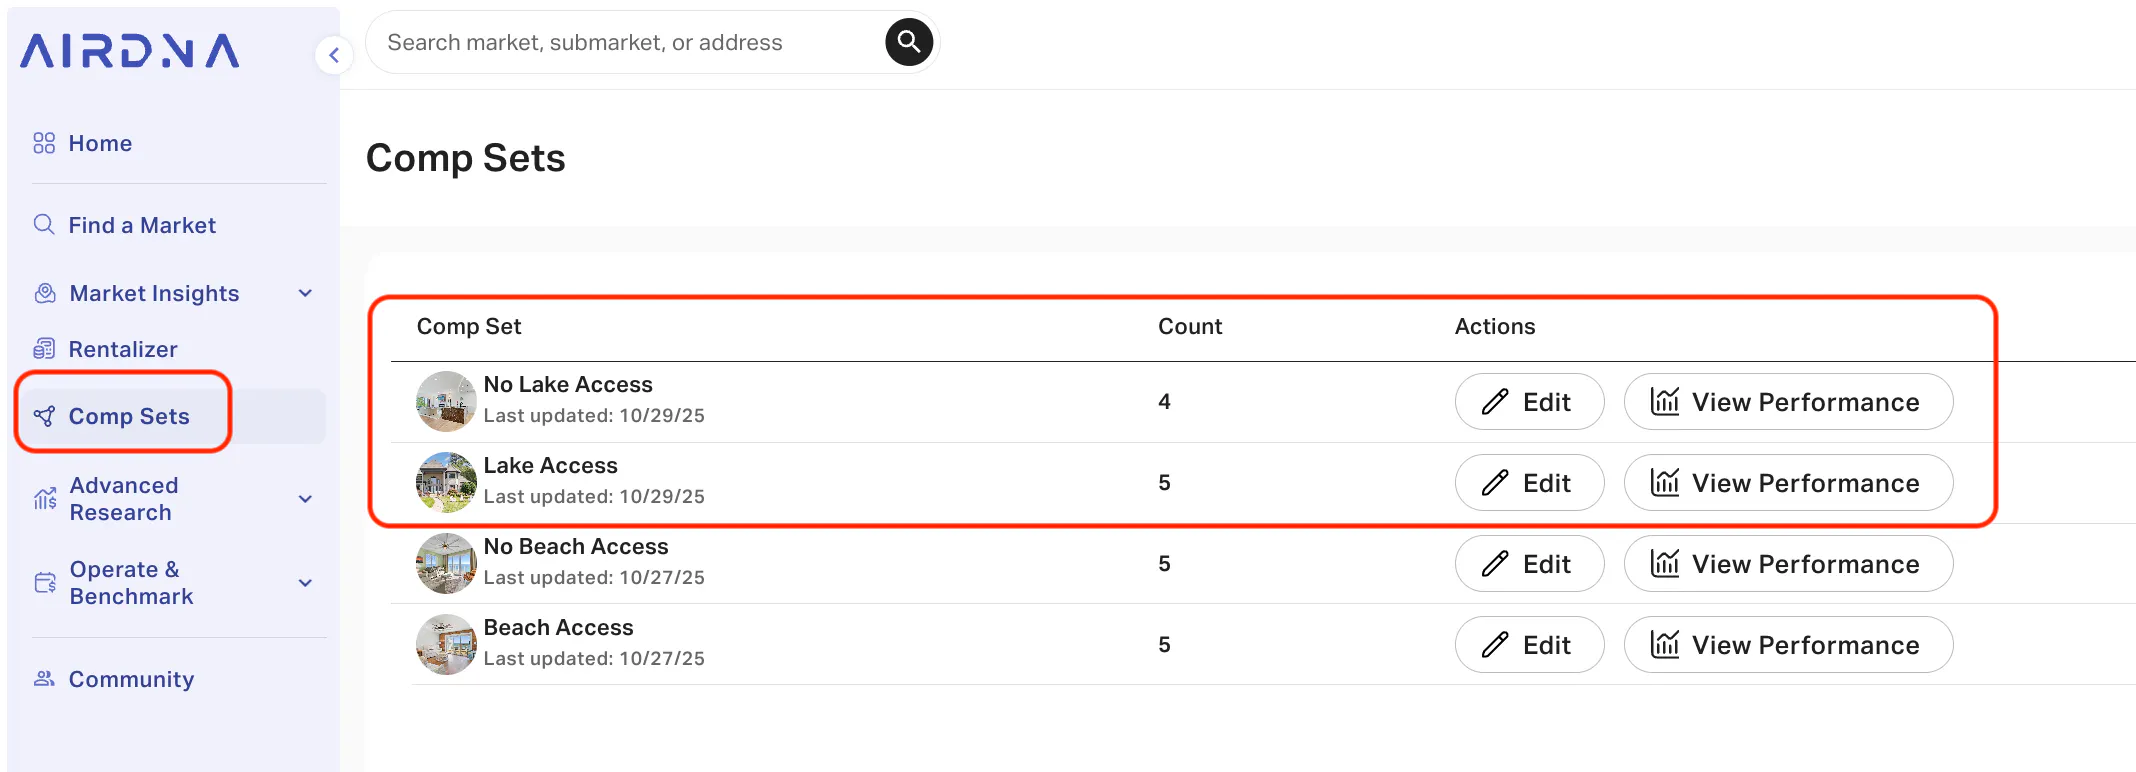
Once your comp set is built, review average RevPAR, occupancy, ADR, and other key metrics. You’ll be able to see how properties with lake access or views are performing and how much of a pricing lift they’re getting compared to similar homes without those features.
AirDNA also lets you edit or refine your comp set at any time, so if you're comparing a few different homes before buying a lake house, you can model each one separately.
Find a prospective Airbnb for sale
Discover your next profitable short-term rental with real market revenue projections.
FAQs
How much can I earn on Airbnb with lake access?
It depends on your market. However, on average, listings with lake access earn 22% more per night than similar properties without it, according to AirDNA data. In top-performing markets, Airbnb lakehouse income can climb even higher, especially when combined with high occupancy during peak seasons. Access adds value because it offers something guests actively search for: direct connection to the water.
What kind of properties benefit most from lake access or views?
Larger lake houses (think 3 to 5 bedrooms) often benefit the most. These properties attract group travelers and families who are booking for vacations centered around the lake. Homes with a private dock, full lake view, or both tend to command the highest rates. Location matters too: in areas where access is rare, it becomes a major distinguishing feature that can justify higher pricing.
What are the top factors affecting lake house rental pricing?
Key lake house rental pricing factors include:
- Access and views (especially if rare in the market)
- Size and layout (more beds = higher earning potential)
- Seasonality and demand (lake markets often peak in summer)
- Local costs and regulations (insurance, permits, HOA rules)
Using AirDNA, you can filter for most of these features and model how each one impacts income.
How do I find affordable lake houses that still perform well?
Start by researching lakefront properties for sale in drive-to destinations with strong seasonal demand. Look for submarkets where lake access is still a standout feature, not something every listing has. Use AirDNA to filter for high RevPAR, moderate home prices, and positive occupancy trends. That way, you can spot lake houses that balance affordability with earning potential.
How much is a lake house?
Lake house prices can vary dramatically based on location, size, condition, and proximity to the water. In most markets, lakefront properties for sale come at a premium, especially those with private docks or unobstructed lake views. However, those same features often translate into higher short-term rental income.
With AirDNA, you can browse lake houses for sale and see their revenue potential as an Airbnb, helping you understand whether the added cost of lake proximity is likely to pay off.
ARTICLE SUMMARY
Lake access and views can boost Airbnb income . . . but by how much, and where does it really pay off? This guide dives into national data, regional trends, and how to estimate what a lake house could earn as a short-term rental using AirDNA.
Jamie Zhang
AirDNA Data Analyst
Jamie Zhang is a Data Analyst at AirDNA, leveraging her background in data science and analytics to uncover key trends in the short-term rental industry. Before joining AirDNA, she worked as a data analyst at Shanghai Disney, where she specialized in revenue forecasting and financial planning . She holds a Master’s degree in International Economics and International Relations from Johns Hopkins. Jamie enjoys cycling to explore different corners of the city.
