What It Takes to Be Among the Best: Inside the Top 10% of US Short-Term Rentals
Published: November 4, 2026

Camilo Schmid Rivas
Annual revenue for full-time short-term rental listings in the US has stayed below its 2022 peak for four years, leaving hosts and operators to decide whether to grow their portfolio, upgrade the property or change how they run it. AirDNA examined how the top 10% of earners, the top Airbnb hosts in every market, held their position through that period, and whether scale and amenities, two advantages often credited for it, explain the gap. Scale turned out to matter mostly through the habits that come with it, and only a handful of amenities, led by hot tubs and private pools, carried a meaningful revenue premium. That points hosts toward decisions they can make without buying more property.
AirDNA compared the top 10% with the typical listing in the same market and with the same number of bedrooms, so location and size are held constant and what remains is mostly how a property is run. In the twelve months to September 2026, the typical full-time listing earned less than at the market’s 2022 peak, while the top 10% held close to theirs. The leaders kept their revenue through a wave of new supply that pushed the middle and the bottom of the market down, and they did it with pricing, calendar rules and guest reviews more than with scale or amenities.
Key takeaways
- The top 10% earned 1.75 times the typical listing in the same US market and bedroom count in 2026, up from 1.67 times in 2021.
- Three habits were each worth $8,000 to $12,000 a year: dynamic pricing, structured minimum stays and review scores of 4.95 or higher.
- Only hot tubs (+30.8%) and private pools (+21.1%) still carried a large revenue premium. Air conditioning is now table stakes.
- Two settings, pricing and minimum stays, explain about three-quarters of the large-operator revenue premium.

The Middle Declined While the Top 10% Barely Moved
Gatlinburg: Competition nearly doubled in five years
Full-time listings in Gatlinburg and Pigeon Forge, Tennessee, nearly doubled (+93.4%) from 6,804 in the twelve months to September 2021 to 13,161 in the twelve months to September 2026. Over the same five years, annual revenue fell −14.5% for the bottom quarter and −12.9% for the typical listing, while the top 10% declined just −3.9%, in the same market and with the same guests.
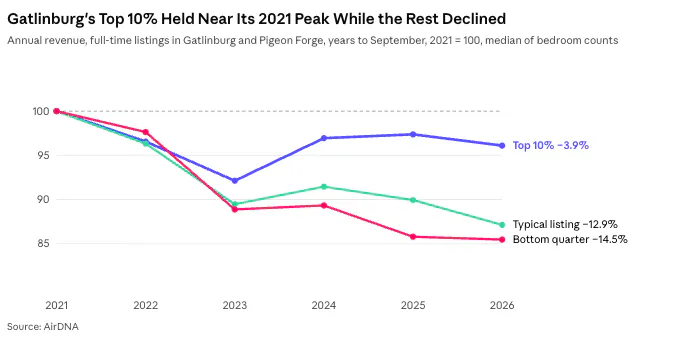
Every tier below the top 10% gave back part of the pandemic boom, and the further down the ranking, the larger the decline. That points to the new supply taking its share mostly from the middle and the bottom rather than from the leaders.
Not only a Tennessee story
Across the US, annual revenue was lower in 71.4% of market and bedroom segments in the twelve months to September 2026 than in the twelve months to September 2022, the national peak. For the typical listing, it was −4.6% below that peak, while the top 10% was just −1.2% below. Gatlinburg peaked a year before the country, consistent with leisure markets booming and cooling ahead of the rest, so the national pattern is the same sorting at a slower pace.
The top 10% now earns 1.75 times the typical listing
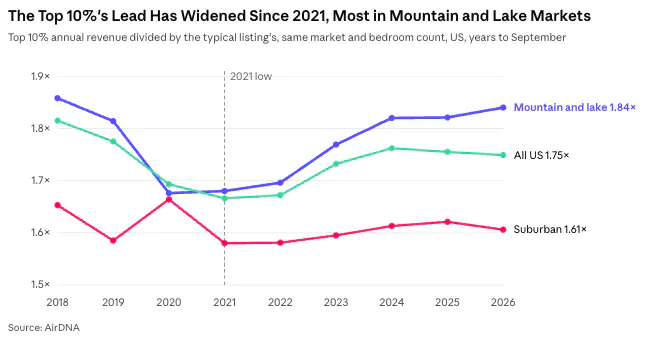
The bar did not rise. The middle declined beneath it. The top 10% earned 1.75 times as much as the typical listing in the same US market and bedroom count in the twelve months to September 2026, up from 1.67 times in 2021 and down from 1.82 times in 2018. The multiple widened faster in mountain and lake markets, from 1.68 to 1.84 since 2021, where demand swings by season and a well-run listing has more peaks to capture. Suburban markets widened least, from 1.58 to 1.61, which suggests that flatter demand leaves less for a better-run listing to capture.
Top Earners Adopted Active Pricing Faster Than Their Markets
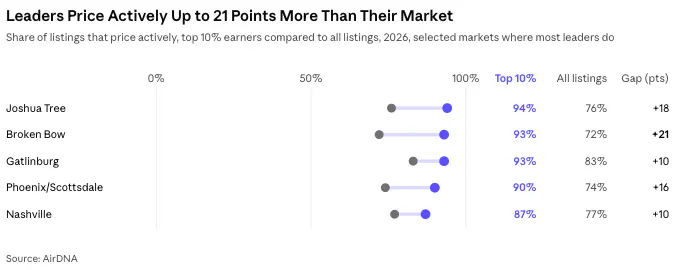
In Broken Bow, Oklahoma, 93% of top 10% listings were priced actively in 2026, meaning their nightly prices changed often across the calendar, compared to 72% of all listings. That 21-percentage-point gap shows the leaders adopted active pricing more widely, and the rest of the market has not caught up. Gatlinburg’s gap was 10 percentage points, so active pricing there has become standard practice rather than an edge.

Jackson Hole Leads 55 Markets Where Active Pricing Is Still an Edge
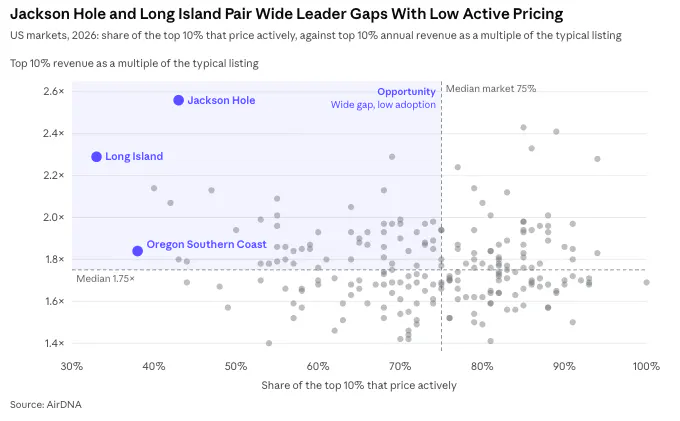
Active pricing is already common among the leaders in most US markets. In the median market, 75% of the top 10% priced actively in 2026, and in Gatlinburg and Broken Bow 93% did. A smaller group of markets breaks that pattern, with fewer leaders pricing actively and a top 10% that still earns far more than the typical listing. Those are the markets where active pricing can still set a host apart.
The clearest example is Jackson Hole, Wyoming, where the top 10% earned 2.56 times the typical listing in the twelve months to September 2026, the widest gap of any US market, ahead of the Northern Sierra Mountains (2.43). Yet just 43% of those leaders priced actively, fewer than the 45% of all listings in the market. They earned their premium on rate instead, with an ADR of $1,068 compared to $446 for other listings.
Jackson Hole is one of 55 US markets, about a quarter of the 214 AirDNA compared, that fit this pattern. In each, the top 10% earned at least 1.75 times more than the typical listing, a lead at least as wide as in the typical US market, yet fewer than 75% of those leaders priced actively, a lower share than in the typical market. These markets fill the shaded corner of the chart below. In the clearest cases, Jackson Hole, Long Island, New York (33% of leaders pricing actively) and the Oregon Southern Coast (38%), the leaders win on higher ADR, location and reviews rather than on active pricing. That leaves an opening for hosts who add active pricing to an already strong property, because most of the leaders they compete with have not.
Hot Tubs and Private Pools Are the Only Amenities With a Large Premium
Because AirDNA compares listings within the same market and bedroom count, location and size are held constant, and what remains at property level is mostly the amenities a host can add. Most of these no longer set the leaders apart. Air conditioning is now in nearly every listing, and only a few amenities, led by hot tubs and private pools, still carry a large revenue premium.
Air conditioning became table stakes
Air conditioning was listed by 91.5% of top 10% listings in 2026, up from 74.2% in 2018, and by 89.6% of all other listings, a gap of 1.9 percentage points. Guests still expect it, but because nearly every listing has it, it no longer separates the top 10% from the rest.
Two amenities carry the premium
A hot tub was associated with annual revenue +30.8% higher than a comparable US listing without one in the twelve months to September 2026, and a private pool with +21.1%. Both comparisons hold the market, bedroom count, property type and other high-value amenities constant.
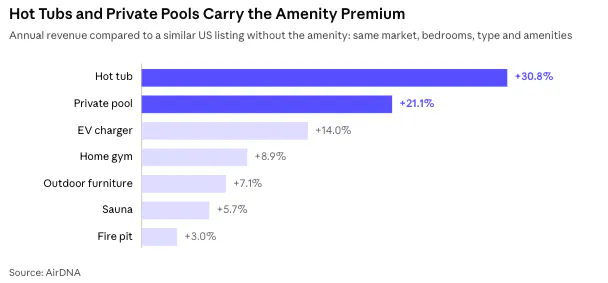
Hot tubs also mark the leaders: 36.1% of top 10% listings across the US had one in 2026, compared to 18.5% of all listings. In Gatlinburg, nearly all of the top 10% have had a hot tub since 2018 (99.0% then, 96.6% in 2026), and 81.8% of all listings have one, so there it has become table stakes in the same way air conditioning has nationally. These premiums are associations. Top earners tend to have these amenities, which does not guarantee that adding one moves a listing into the top 10%.
Three Habits Worth $8,000 to $12,000 a Year
Beyond location, size and amenities, the clearest differences between the top 10% and everyone else lie in how a listing is run: how it is priced, how its calendar is set and how guests rate it.
Three habits were each associated with $8,000 to $12,000 a year in extra revenue in the twelve months to September 2026, compared to a similar listing in the same submarket, of the same size and property type and run by an operator of the same scale. They are dynamic pricing (+$8,300), minimum-stay rules that change by season, day of week or booking window (+$8,400), and review scores of 4.95 or higher compared to below 4.85 (+$11,700). Just 6.4% of listings did all three, so most hosts still have at least one of them available.
Dynamic pricing adoption rises with every revenue decile
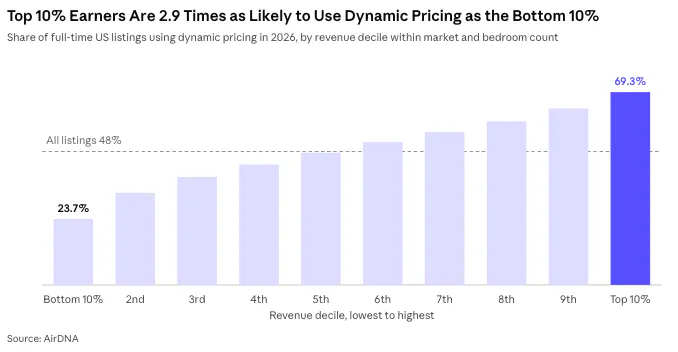
Dynamic pricing, meaning nightly prices that change often and by large amounts rather than a summer rate and a winter rate, was used by 48.4% of full-time US listings in 2026. Adoption rose with every step up the revenue ranking, from 23.7% of the bottom 10% to 69.3% of the top 10%, with no point where it suddenly switches on. That makes it one of the clearest predictors of where a listing ranks.
Structured minimum stays lift RevPAR +12.1%
Protect the calendar, not just the price. Among listings that already price dynamically, 82.6% never shorten their minimum stay as the arrival date approaches. The one in six that do earned RevPAR (revenue per available night) +12.1% higher in the twelve months to September 2026 than comparable dynamic pricers matched on submarket, size, property type, operator scale and reviews. Almost all of it came through occupancy (+8.9%) rather than ADR (average daily rate, +1.7%). Most pricing tools already support these rules, so for many hosts the change is a setting rather than an investment.
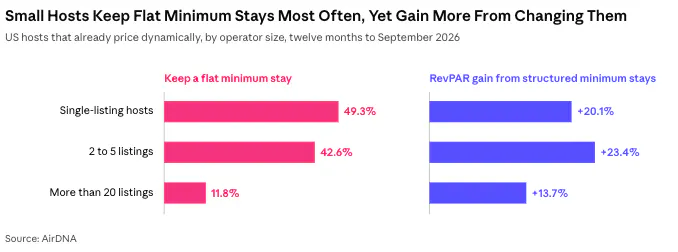
Minimum-stay rules pay more for small hosts than for large operators, yet small hosts are the least likely to use them. Among hosts that already price dynamically, 49.3% of single-listing hosts and 42.6% of hosts with two to five listings kept a flat minimum stay in 2026, compared to 11.8% of operators with more than 20 listings. Structured minimum stays were associated with RevPAR +20.1% higher for single-listing hosts and +23.4% for hosts with two to five listings, compared to +13.7% for operators with more than 20. The hosts most likely to leave the minimum stay flat are among those it pays most.
Reviews decide who climbs
Ratings mattered more for climbing than for holding a place. Among 520,000 US listings tracked from the twelve months to September 2025 to the twelve months to September 2026, 17.8% of those rated 4.97 or higher rose out of the bottom half, compared to 11.5% of those rated below 4.6. Within the top 10%, 74.3% of listings rated 4.97 or higher stayed there, compared to 56.7% of those rated below 4.6. Reviews are a route up for listings not yet among the leaders, not only a way to stay there.
Habits, Not Size, Explain Most of the Large-Operator Premium
Operating at scale became an advantage only after 2021, and most of that advantage comes from the habits large operators adopt rather than from their size. Comparing operators with more than 20 listings to single-listing hosts in the same submarket shows what scale buys, what it costs in reviews and where small hosts can close the gap.
Getting big is not the lever
Operators with more than 20 listings earned +22.2% more annual revenue per listing than single-listing hosts in the same submarket and with the same bedroom count in the twelve months to September 2026, while in the twelve months to September 2021 they earned −9.4% less. How hosts operate, more than portfolio size, explains that gap.
Among listings with a measured pricing and minimum-stay strategy, holding minimum-stay rules fixed cuts the large-host premium from +20.5% to +13.3%, and holding pricing behavior fixed as well cuts it to +5.3%. Two settings explain about three-quarters of the size premium. A single-listing host using both dynamic pricing and structured minimum stays earned about the same as the average operator with more than 20 listings in the same submarket and bedroom count (−0.4%), which suggests the premium belongs to the habits rather than to size.
Scale buys the tools but not the reviews
| 2026 | Single-listing hosts | Operators with more than 20 listings |
|---|---|---|
| Structured minimum stay | 25.5% | 59.1% |
| Instant book | 32.2% | 80.1% |
| Listed on two or more channels | 46.5% | 90.0% |
| Dynamic pricing | 32.3% | 69.9% |
| Strict cancellation policy | 10.1% | 16.8% |
| Rating of 4.90 or higher | 66.7% | 26.2% |
| Airbnb Guest Favorite | 76.1% | 32.5% |
| Median number of reviews | 80 | 51 |
Large operators switched on each tool at 1.7 to 2.5 times the rate of single-listing hosts, but a single-listing host was 2.5 times as likely to hold a rating of 4.90 or higher. Reviews are the one habit of the three that cannot be bought or switched on, and it is the one where small hosts start ahead.
Four Decisions That Separate Top Airbnb Hosts From the Rest
Closing the gap with the top 10% does not require buying more property or rebuilding a house. The habits that separated the leaders, from how a listing is priced to how its calendar is set and how guests rate it, are decisions most hosts can make with the tools they already have.
Reaching the top 10% in the twelve months to September 2026 depended more on decisions than on investment, and four of them stand out:
- Compare a listing to its real competition, the same submarket, size and property type, and separate table stakes from what still sets it apart.
- Price dynamically, the simplest single predictor of a listing’s revenue rank.
- Set a minimum-stay strategy rather than a single number.
- Judge performance by rank within the market, not by the market’s growth.
Hosts asking whether they are getting worse or the market is getting better have a third answer. The market is sorting listings by how they are run, and most of what it rewards is within a host’s control.
FAQs
What do top Airbnb hosts do differently?
They run their listings differently more than they own better ones. In the twelve months to September 2026, three habits were each associated with $8,000 to $12,000 a year in extra revenue: dynamic pricing (+$8,300), minimum-stay rules that change by season, day of week or booking window (+$8,400), and review scores of 4.95 or higher (+$11,700). Just 6.4% of US listings did all three.
How much more do the top 10% of short-term rentals earn?
The top 10% earned 1.75 times as much as the typical listing in the same US market and bedroom count in the twelve months to September 2026, up from 1.67 times in 2021. The gap was widest in mountain and lake markets (1.84 times) and in Jackson Hole, Wyoming, where the top 10% earned 2.56 times the typical listing.
Do hot tubs increase Airbnb revenue?
A hot tub was associated with annual revenue +30.8% higher than a comparable US listing without one, and a private pool with +21.1%, holding market, bedroom count, property type and other high-value amenities constant. These are associations, so adding one does not guarantee a listing moves into the top 10%.
Can a single-listing host compete with large operators?
Yes. A single-listing host using both dynamic pricing and structured minimum stays earned about the same as the average operator with more than 20 listings in the same submarket and bedroom count (−0.4%). Single-listing hosts were also 2.5 times as likely to hold a rating of 4.90 or higher.
How can I increase my Airbnb revenue without buying more property?
Focus on decisions rather than capital projects. Compare your listing to its real competition, price dynamically, set a minimum-stay strategy rather than a single number, and judge performance by your rank within the market rather than by the market’s growth.
ARTICLE SUMMARY
What do top Airbnb hosts do differently? AirDNA compared the top 10% of US short-term rentals with the typical listing in the same market and bedroom count in the twelve months to September 2026. The leaders earned 1.75 times as much, and pricing, minimum-stay rules and reviews explained more of the gap than scale or amenities.
Camilo Schmid Rivas
Senior Research Analyst
Camilo Schmid Rivas is a Senior Research Analyst at AirDNA who brings a uniquely well-rounded perspective to short-term rental analytics. With a background that spans investment, real estate, and business analysis—including roles at Stayery and Sollers Consulting—Camilo has worn many analyst hats, each sharpening his ability to turn complex data into clear, actionable insights. A graduate of École hôtelière de Lausanne, he now channels his multidisciplinary expertise into uncovering trends that drive smarter STR decisions. In his free time, he enjoys playing tennis or scuba diving in or around Barcelona.