

 Calculate Revenue
 Research Markets
 Find For Sale Properties
 Compare My Listing
 STR Revenue Calculator
 Custom Comp Sets
 Submarket Insights
 Custom Search Filters
 Rate Recommendations
 Performance Benchmarking
 Competitor Comparison
 Owner Contact Details
 Property-level performance data
 Tourism Insights
 Real Estate Investment Analytics
 About Us
 Sales
Sales Support
 Press
PressU.S. Review February 2025: Occupancy Holds, Prices Climb, and April Takes Off
Published: March 20, 2025

Bram Gallagher
Key Takeaways:
- Occupancy remained stable, with a slight -0.8% year-over-year (YOY) dip, but held within historical February levels, marking a pause in recent occupancy growth trends.
- ADR climbed 6.1% YOY, with urban markets seeing the fastest pricing acceleration and strong gains in key event-driven locations like New Orleans (+35.0%) and Breckenridge (+24.1%).
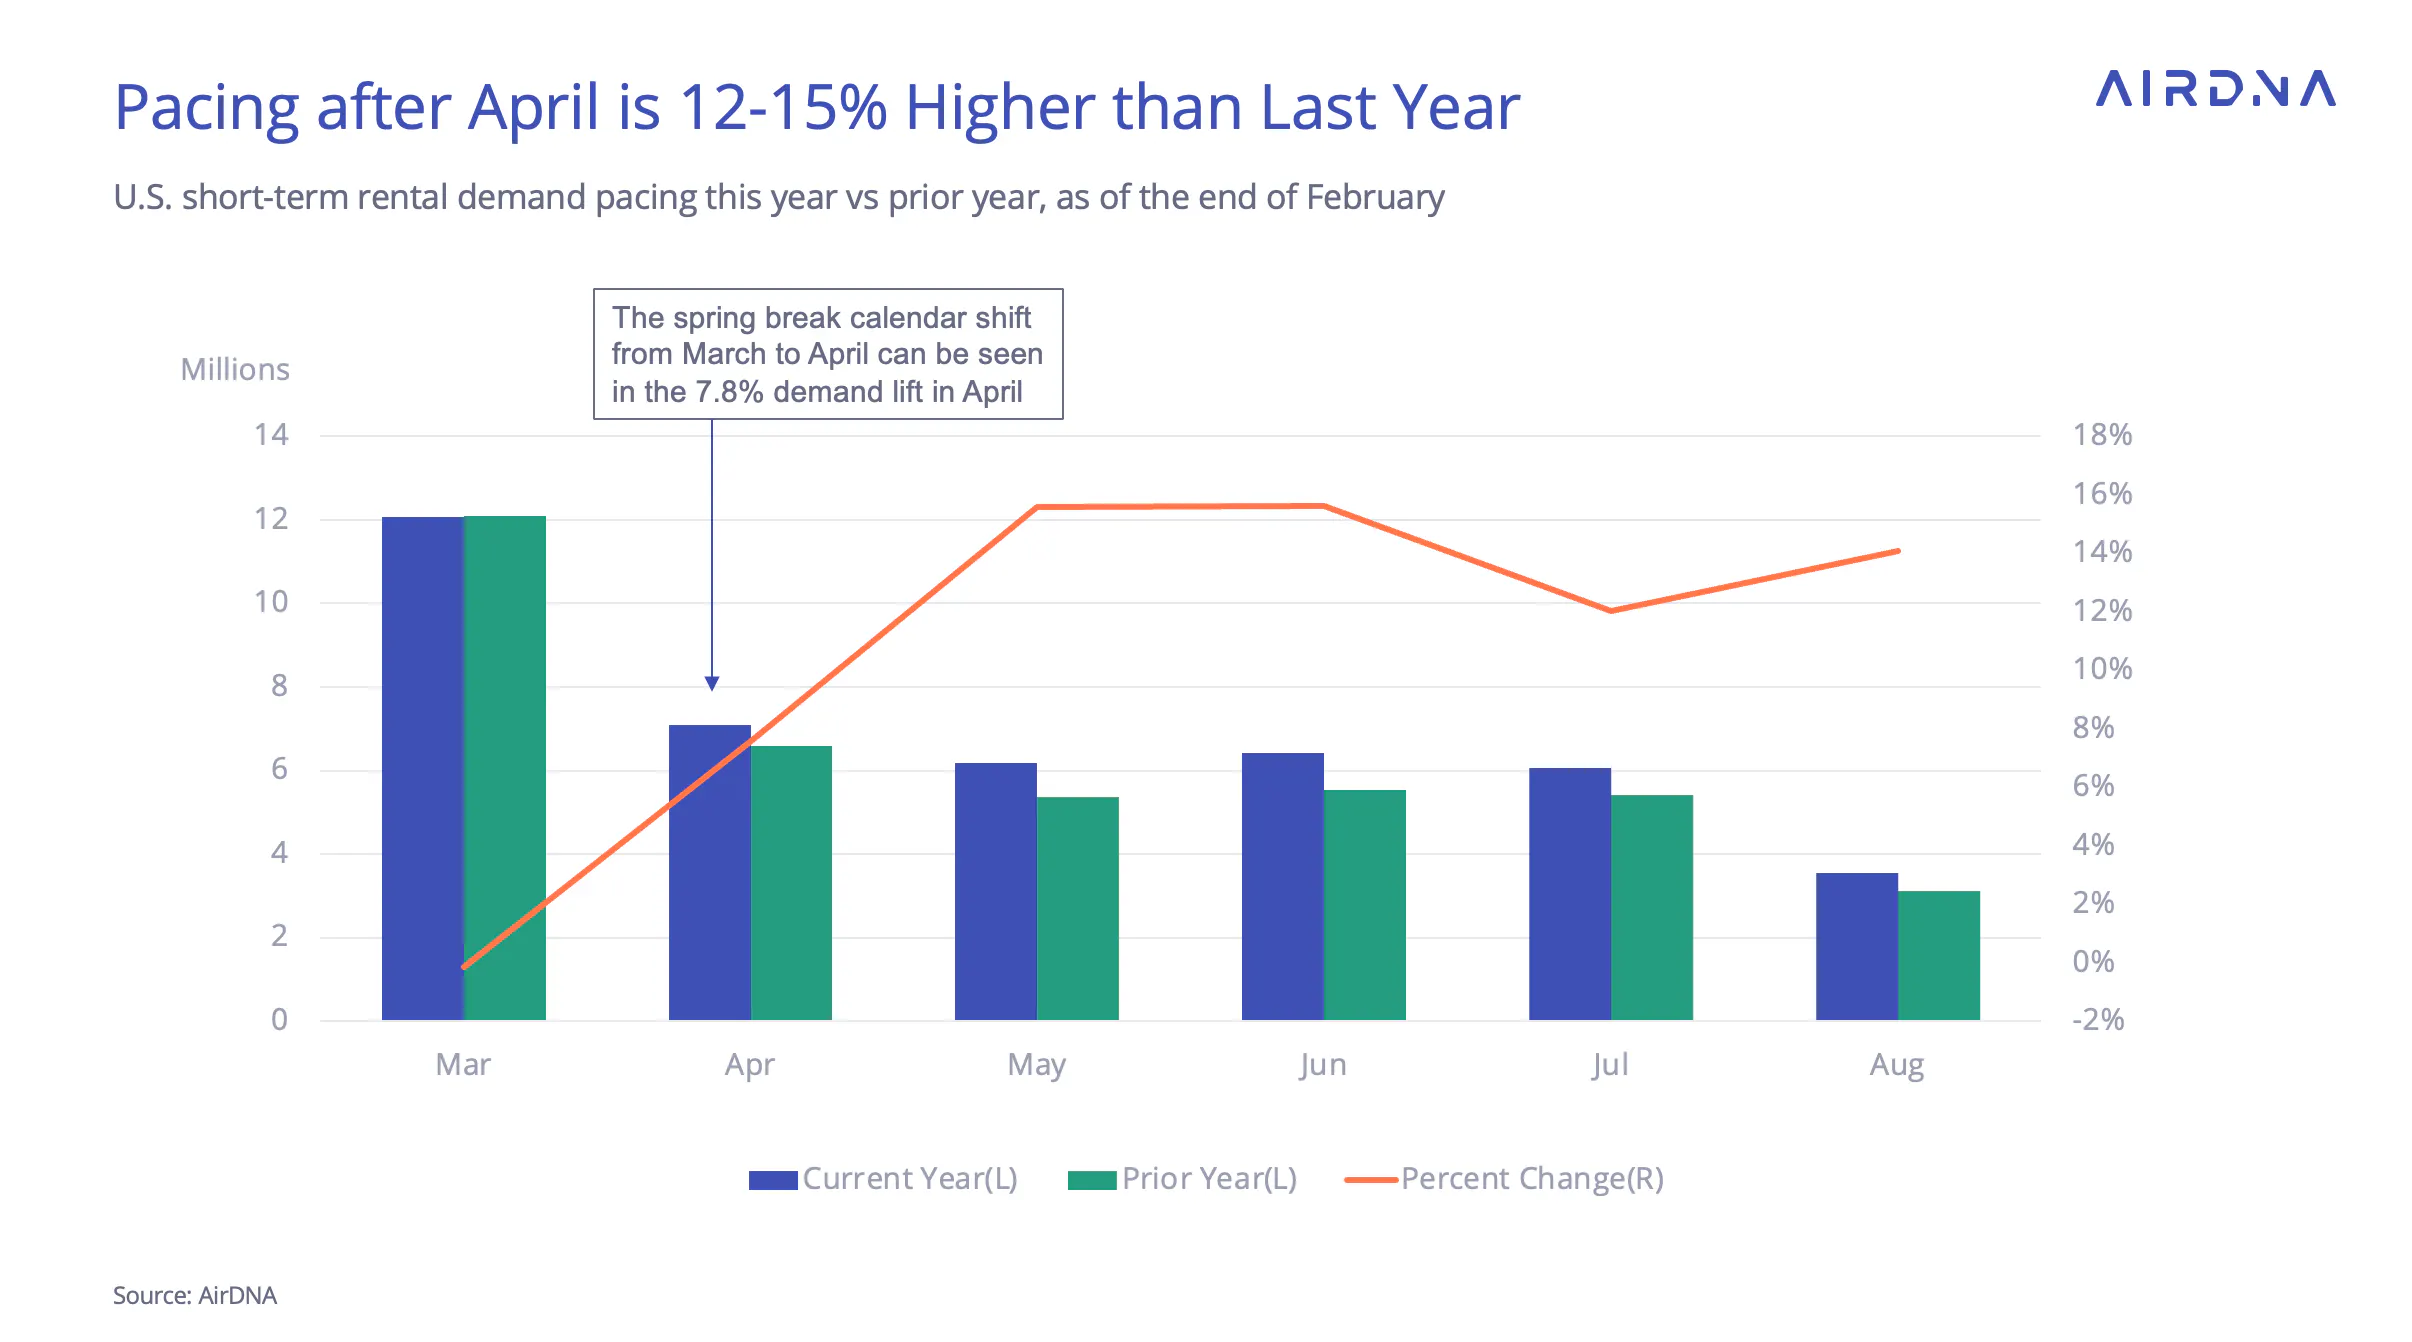
- April pacing is up 7.8% YOY, as the calendar shift reverses, while Saint Patrick’s Day bookings extend into midweek, reflecting evolving travel patterns.
February 2025 continued the short-term rental (STR) market’s steady trajectory, but with notable shifts beneath the surface. While occupancy dipped slightly, -0.8% year-over-year (YOY), it remained within historical February levels, suggesting stability rather than a downturn. Meanwhile, ADR climbed 6.1% YOY, marking another month of strong pricing power across most location types.
However, the biggest story may be what’s ahead. The calendar shift that boosted March demand last year is reversing, leading to flat March pacing but a 7.8% YOY demand surge in April. Meanwhile, Saint Patrick’s Day is shaking up booking trends, with travelers extending their stays into the week rather than concentrating visits over the weekend.
With shifting seasonal demand, a recovering supply landscape, and evolving pricing trends, February’s data offers key insights into where the market is headed next.
Employment and Inflation’s Impact
February’s job market remained steady despite economic uncertainty. The U.S. economy added 151,000 jobs, slightly below expectations but in line with recent trends. Unemployment ticked up to 4.1% from 4.0% in January, though it remains within the range seen over the past eight months. While federal employment declined following recent policy changes, the overall labor market showed little immediate impact.
The bigger question is confidence. The announcement of new international tariffs and federal job cuts has created uncertainty about the economy’s future. While some tariffs were delayed, key measures—including those on metal imports—took effect in mid-March. Retaliatory actions from Canada and the EU are under discussion, but their full impact remains to be seen.
Equity markets reacted sharply, with a significant selloff on March 10. Stock market declines often weigh on high-income and older travelers, two key demographics for short-term rentals, potentially affecting their summer travel plans.
On the inflation front, consumer prices cooled to 2.8% YOY in February, down from 3.0% in January. Shelter costs remained a major driver, but falling gasoline prices helped offset inflation. However, the decline in fuel costs stems partly from weaker global economic activity, raising concerns about slowing demand in the months ahead.

At a Glance: Key U.S. STR Performance Metrics for February 2025
- Revenue per Available Rental (RevPAR) increased 5.2% year-over-year (YOY) to $177.74
- Available listings were 1.55 million, up 3.9% YOY
- Total demand (nights) rose 5.0% YOY (+1.3%*)
- Occupancy was 0.8% lower YOY at 54.2%
- Average Daily Rates (ADR) increased 6.1% YOY to $328.06.
- Repeat Rent Index (RRI) increased by 6.1% YOY
- Nights booked increased 3.3% YOY (-0.2%*)
*- Unadjusted for leap day.
Supply Growth Stops Freefall
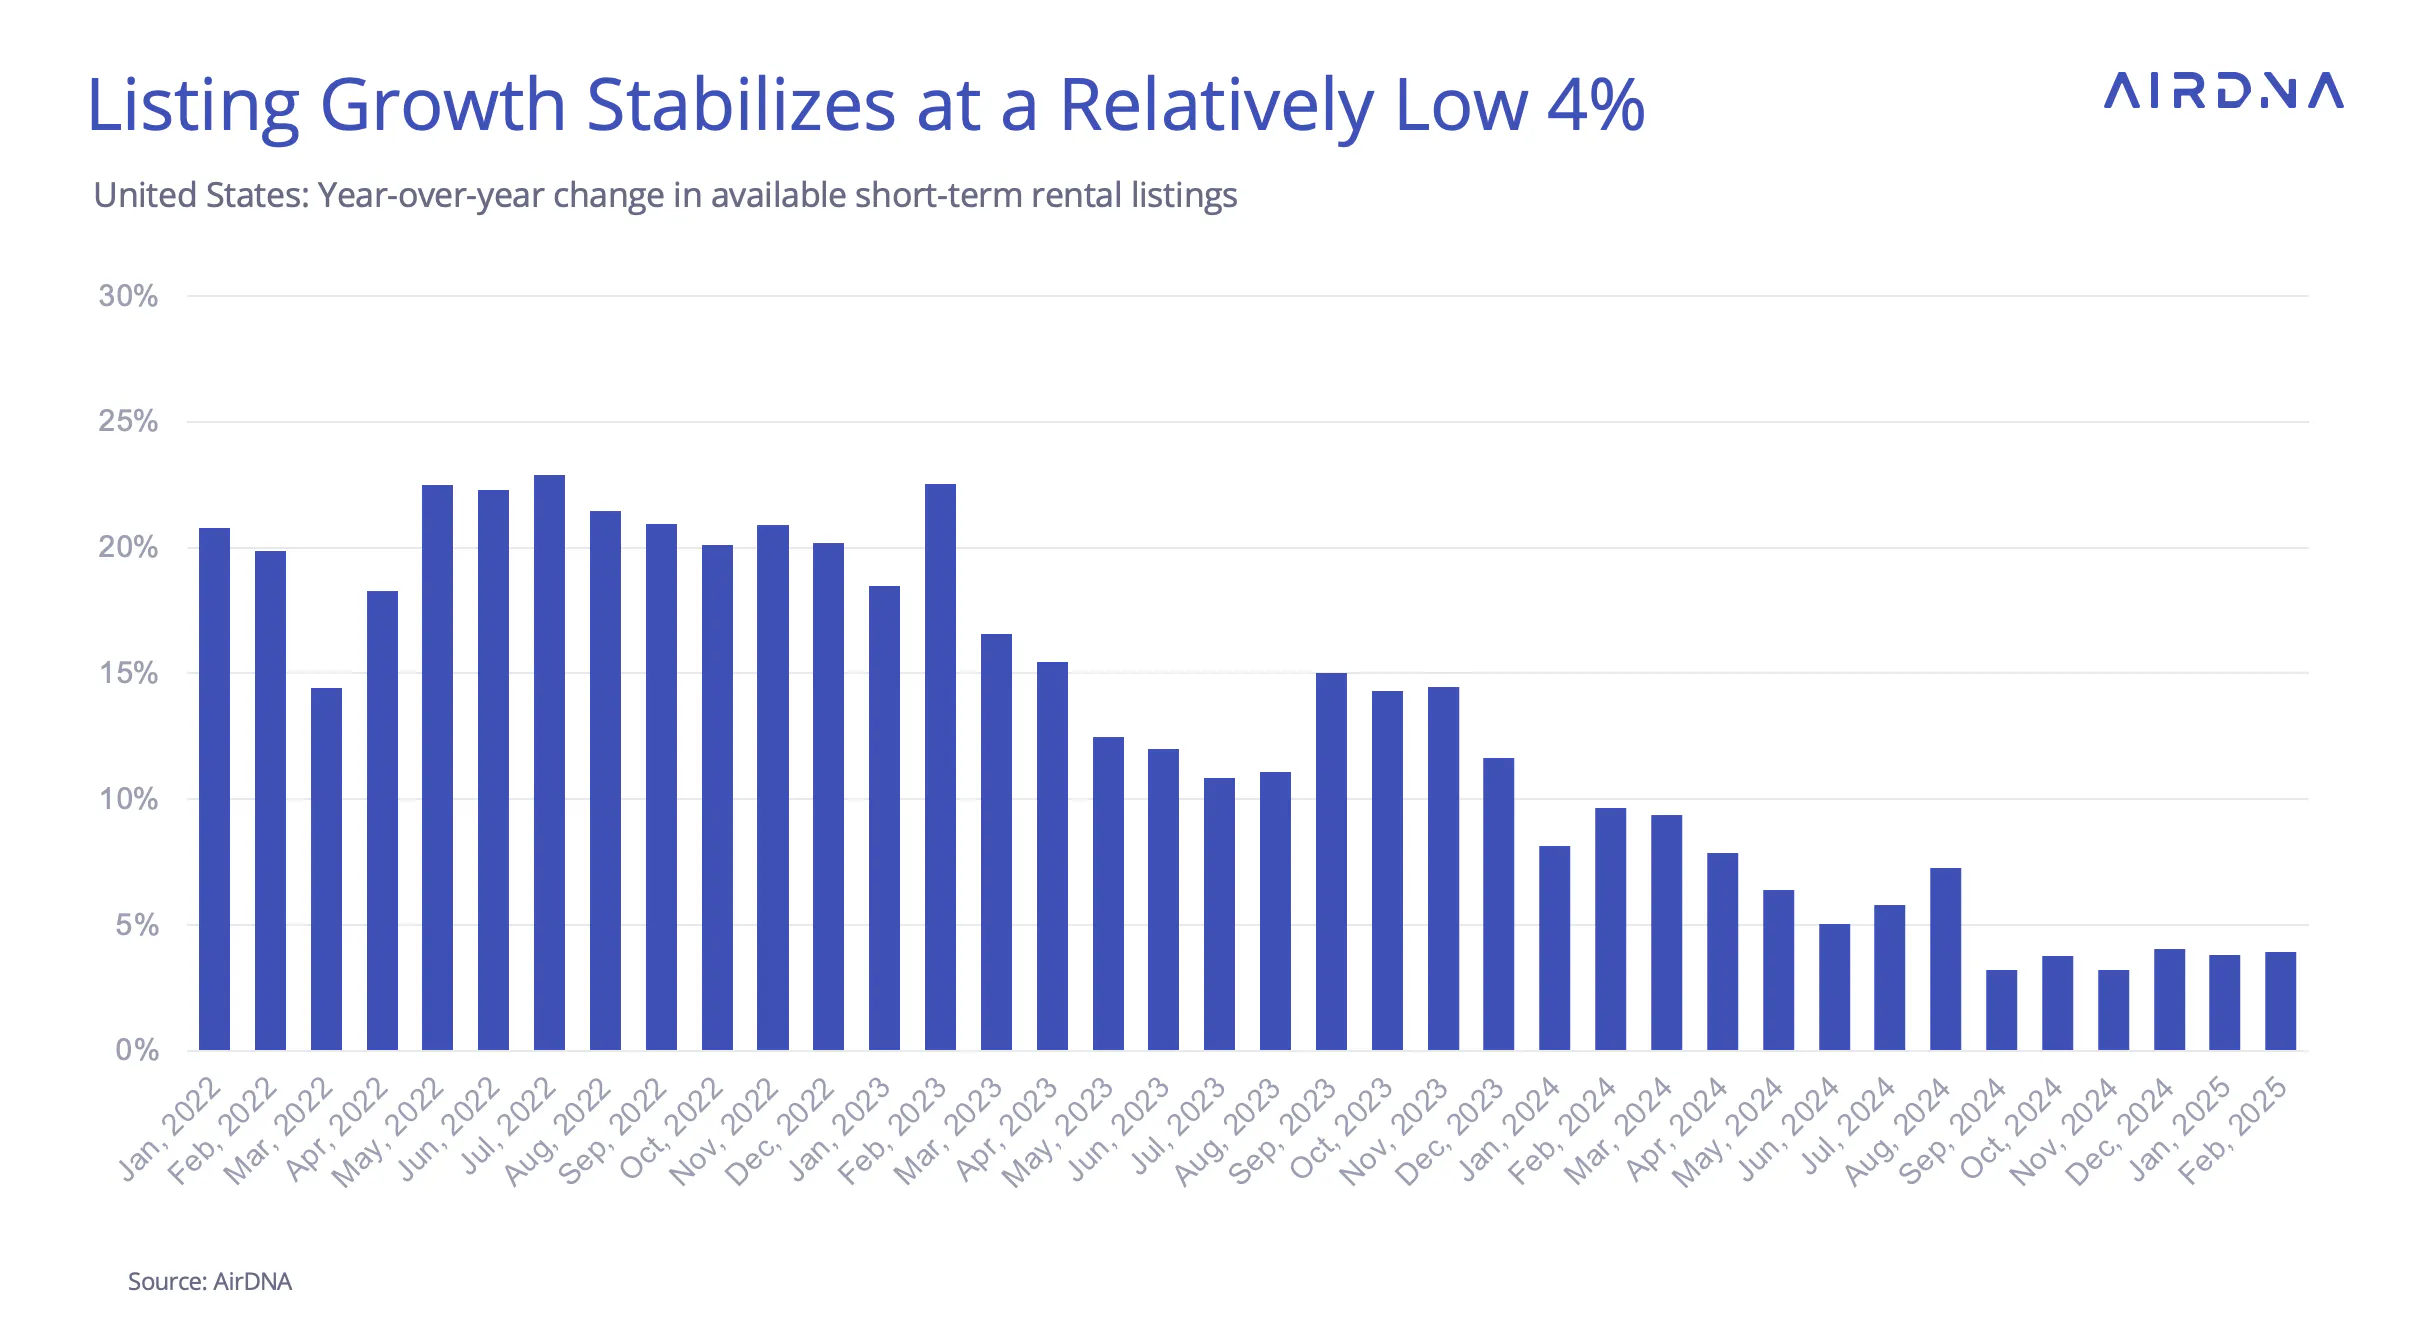
After a surge in new rentals in 2021 and 2022, driven by low interest rates and pent-up demand, short-term rental (STR) supply has been cooling. High interest rates, elevated housing prices, and moderate occupancy levels have slowed listing growth. In February, supply increased by 3.9% year-over-year (YOY), aligning with the steady 4% growth seen over the past three months—an improvement from the September and November 2024 lows of 3.2%.
While the investment landscape remains challenging, supply growth appears to have stabilized. The outlook for interest rates remains uncertain, as tariffs could push inflation higher, while slower growth may have a deflationary effect. Current forecasts from Oxford Economics suggest a single rate cut near the end of the year, meaning financing constraints will likely persist for the foreseeable future.
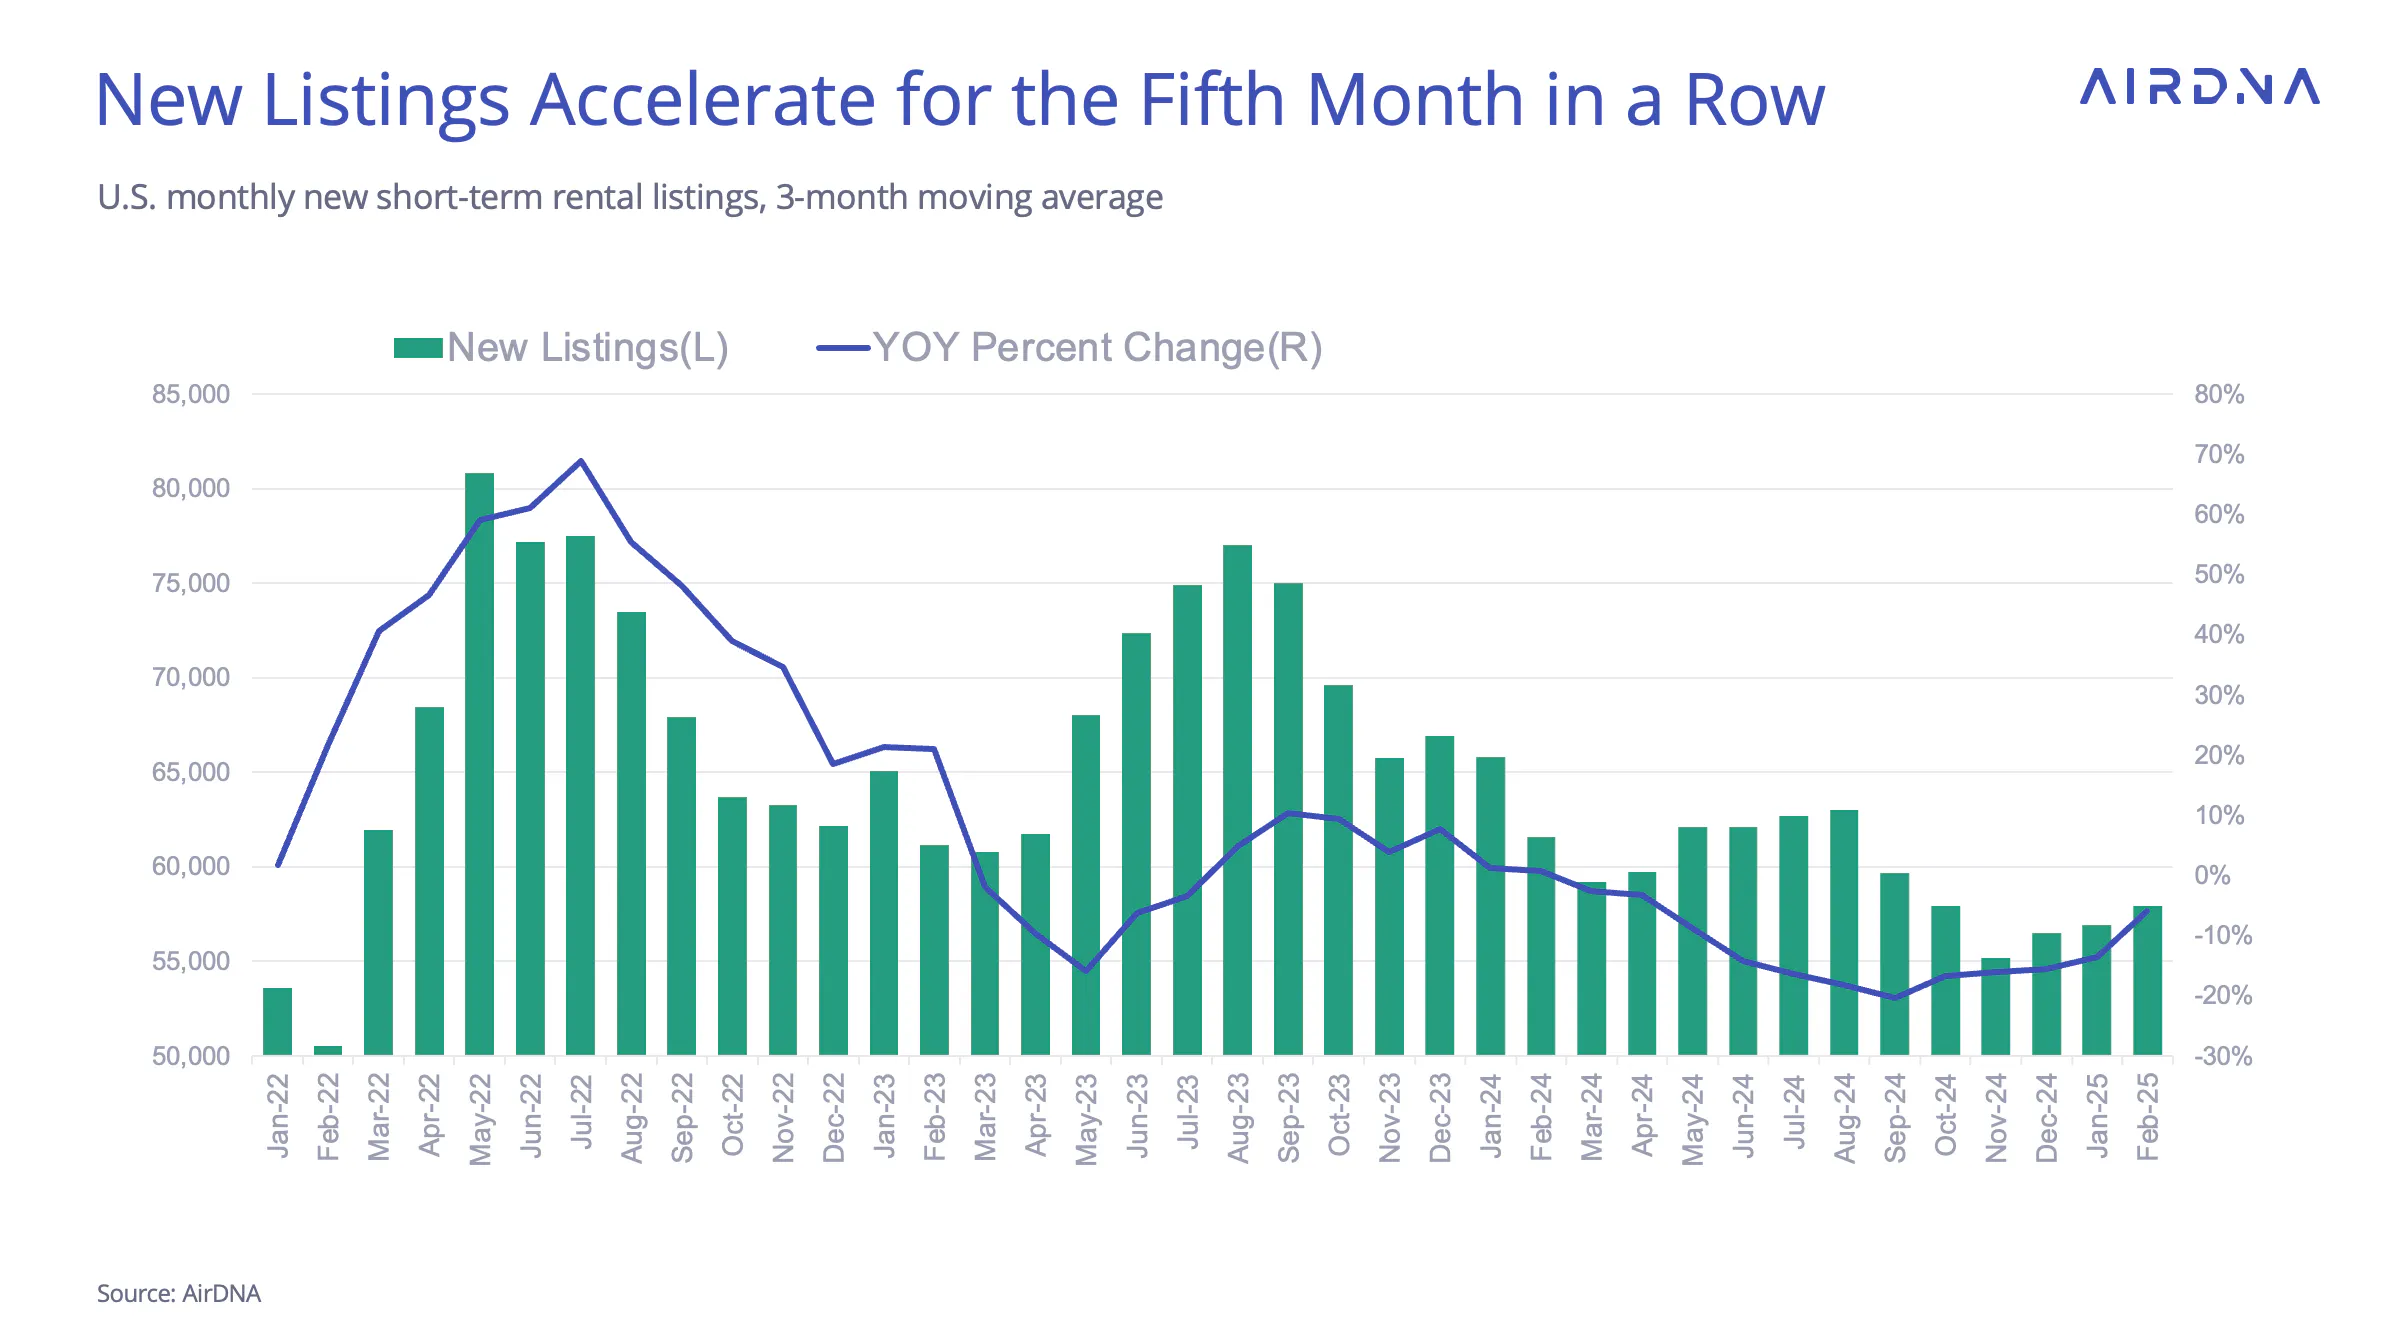
One of the biggest drivers of slowing supply growth has been the decline—and eventual contraction—of new listings. In September 2024, new listings hit their lowest point, down 20.4% YOY. However, the trend has steadily improved in recent months, with February’s decline narrowing to -5.9%, a significant jump from -13.5% in January.
If this momentum continues, it could signal renewed investor confidence in short-term rentals, likely driven by improved unit-level performance in 2024.
Adjusting Demand and Bookings for Leap Day
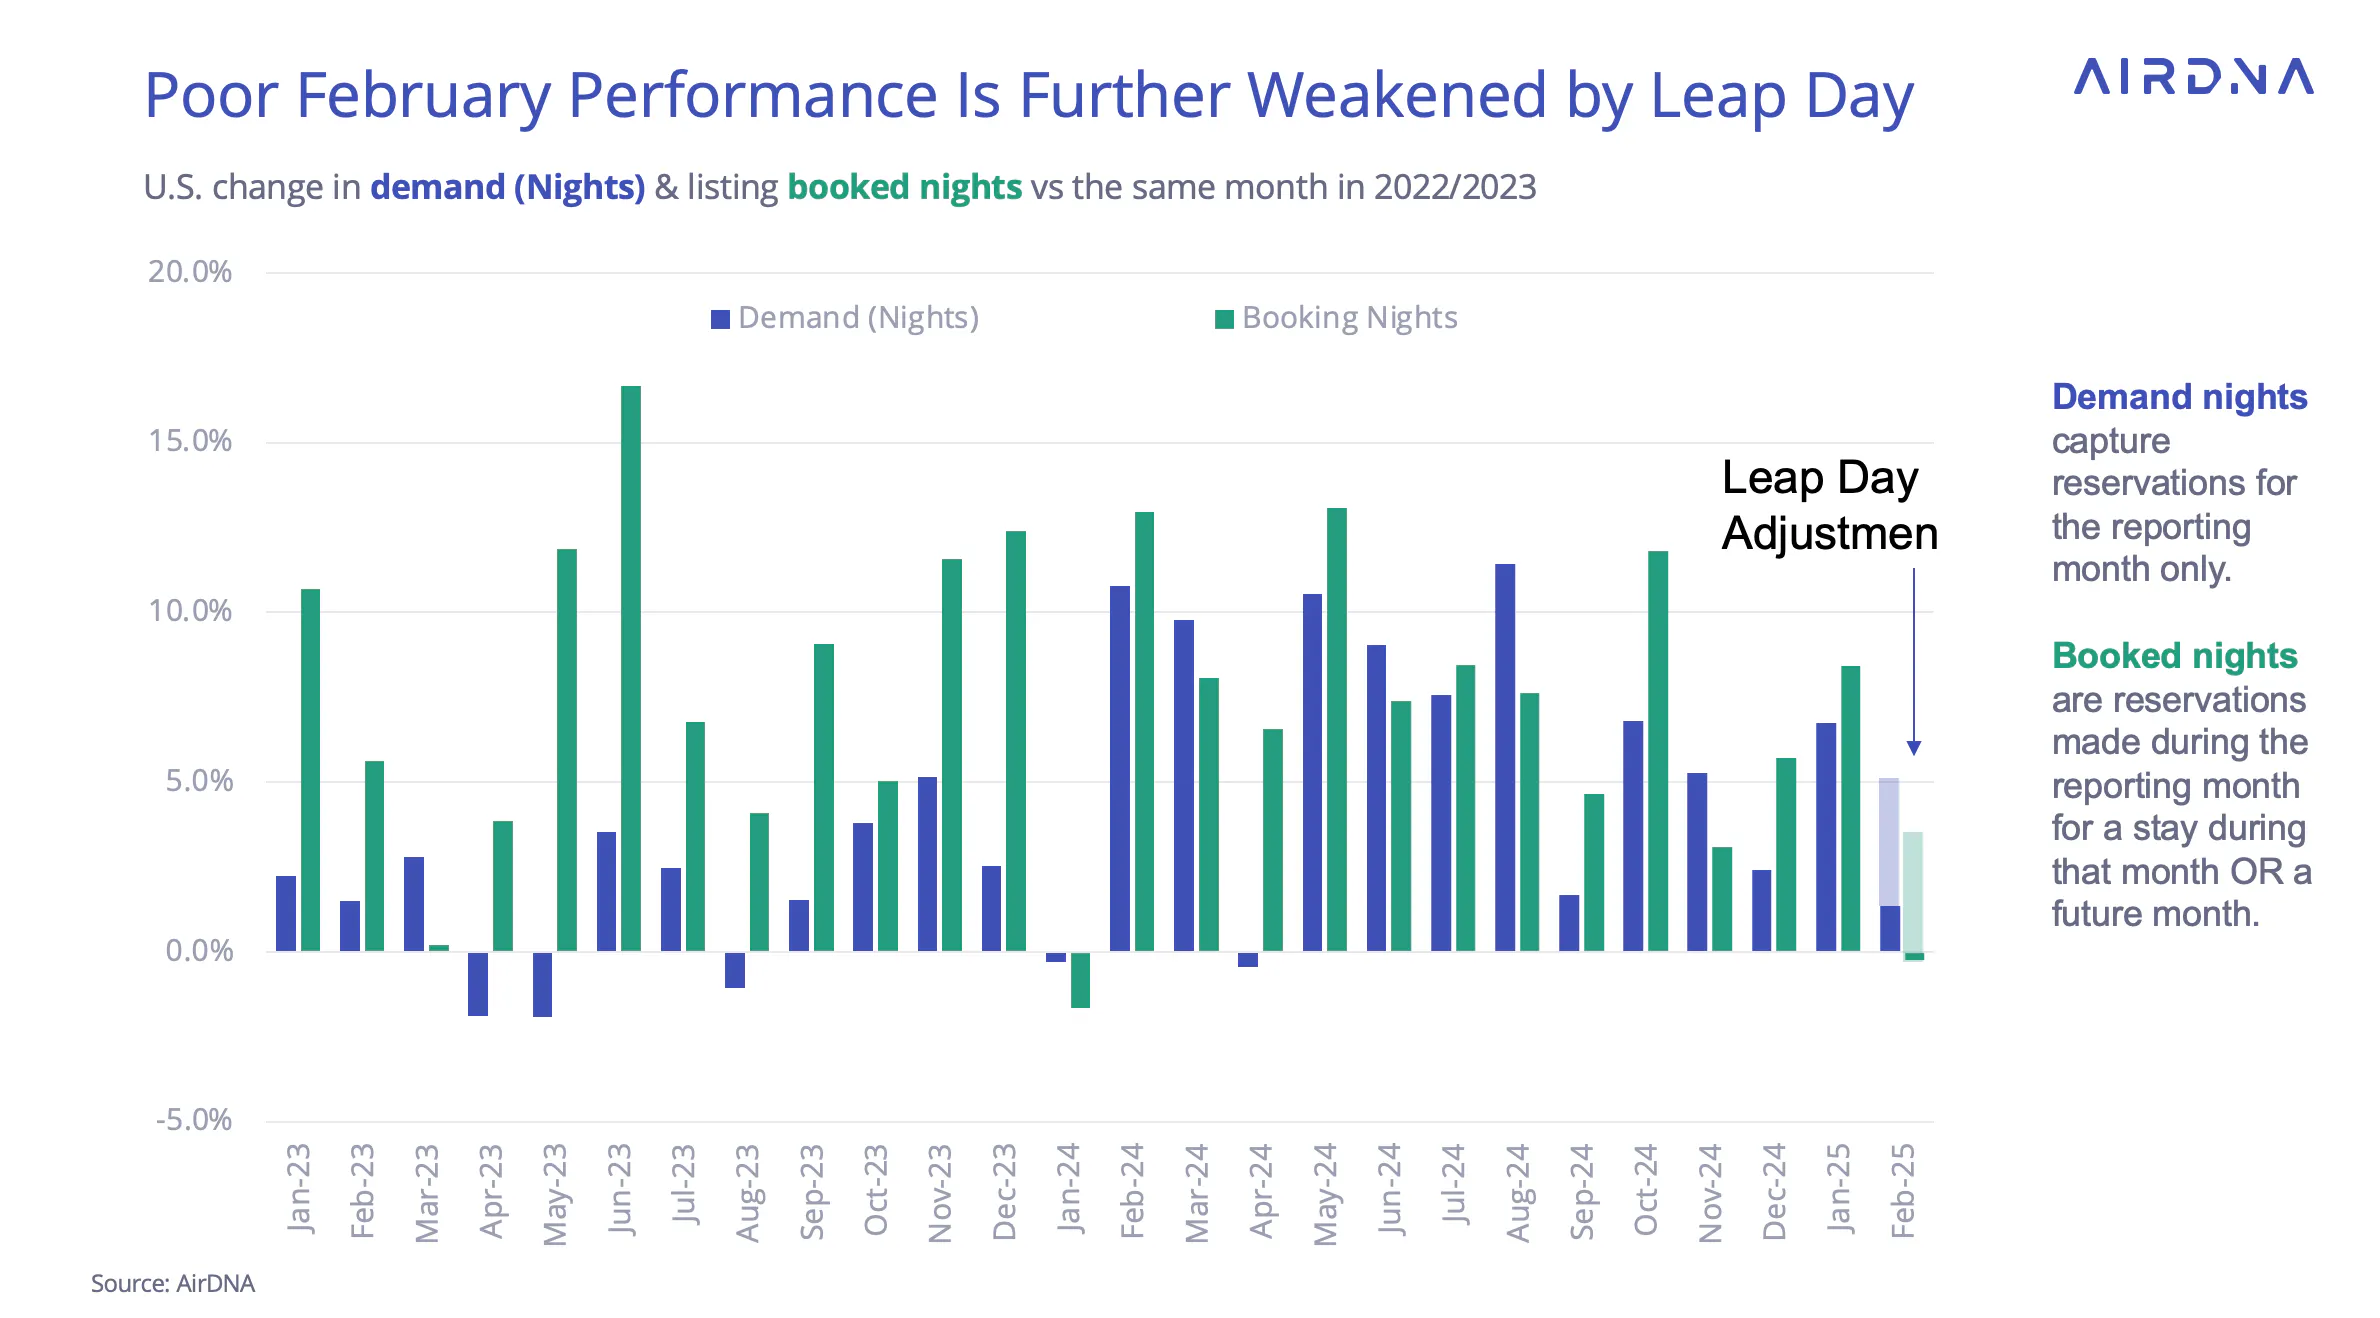
When analyzing February’s short-term rental (STR) performance, it’s important to account for the extra day in 2024. With one fewer day this year, growth metrics may appear artificially lower than they actually are.
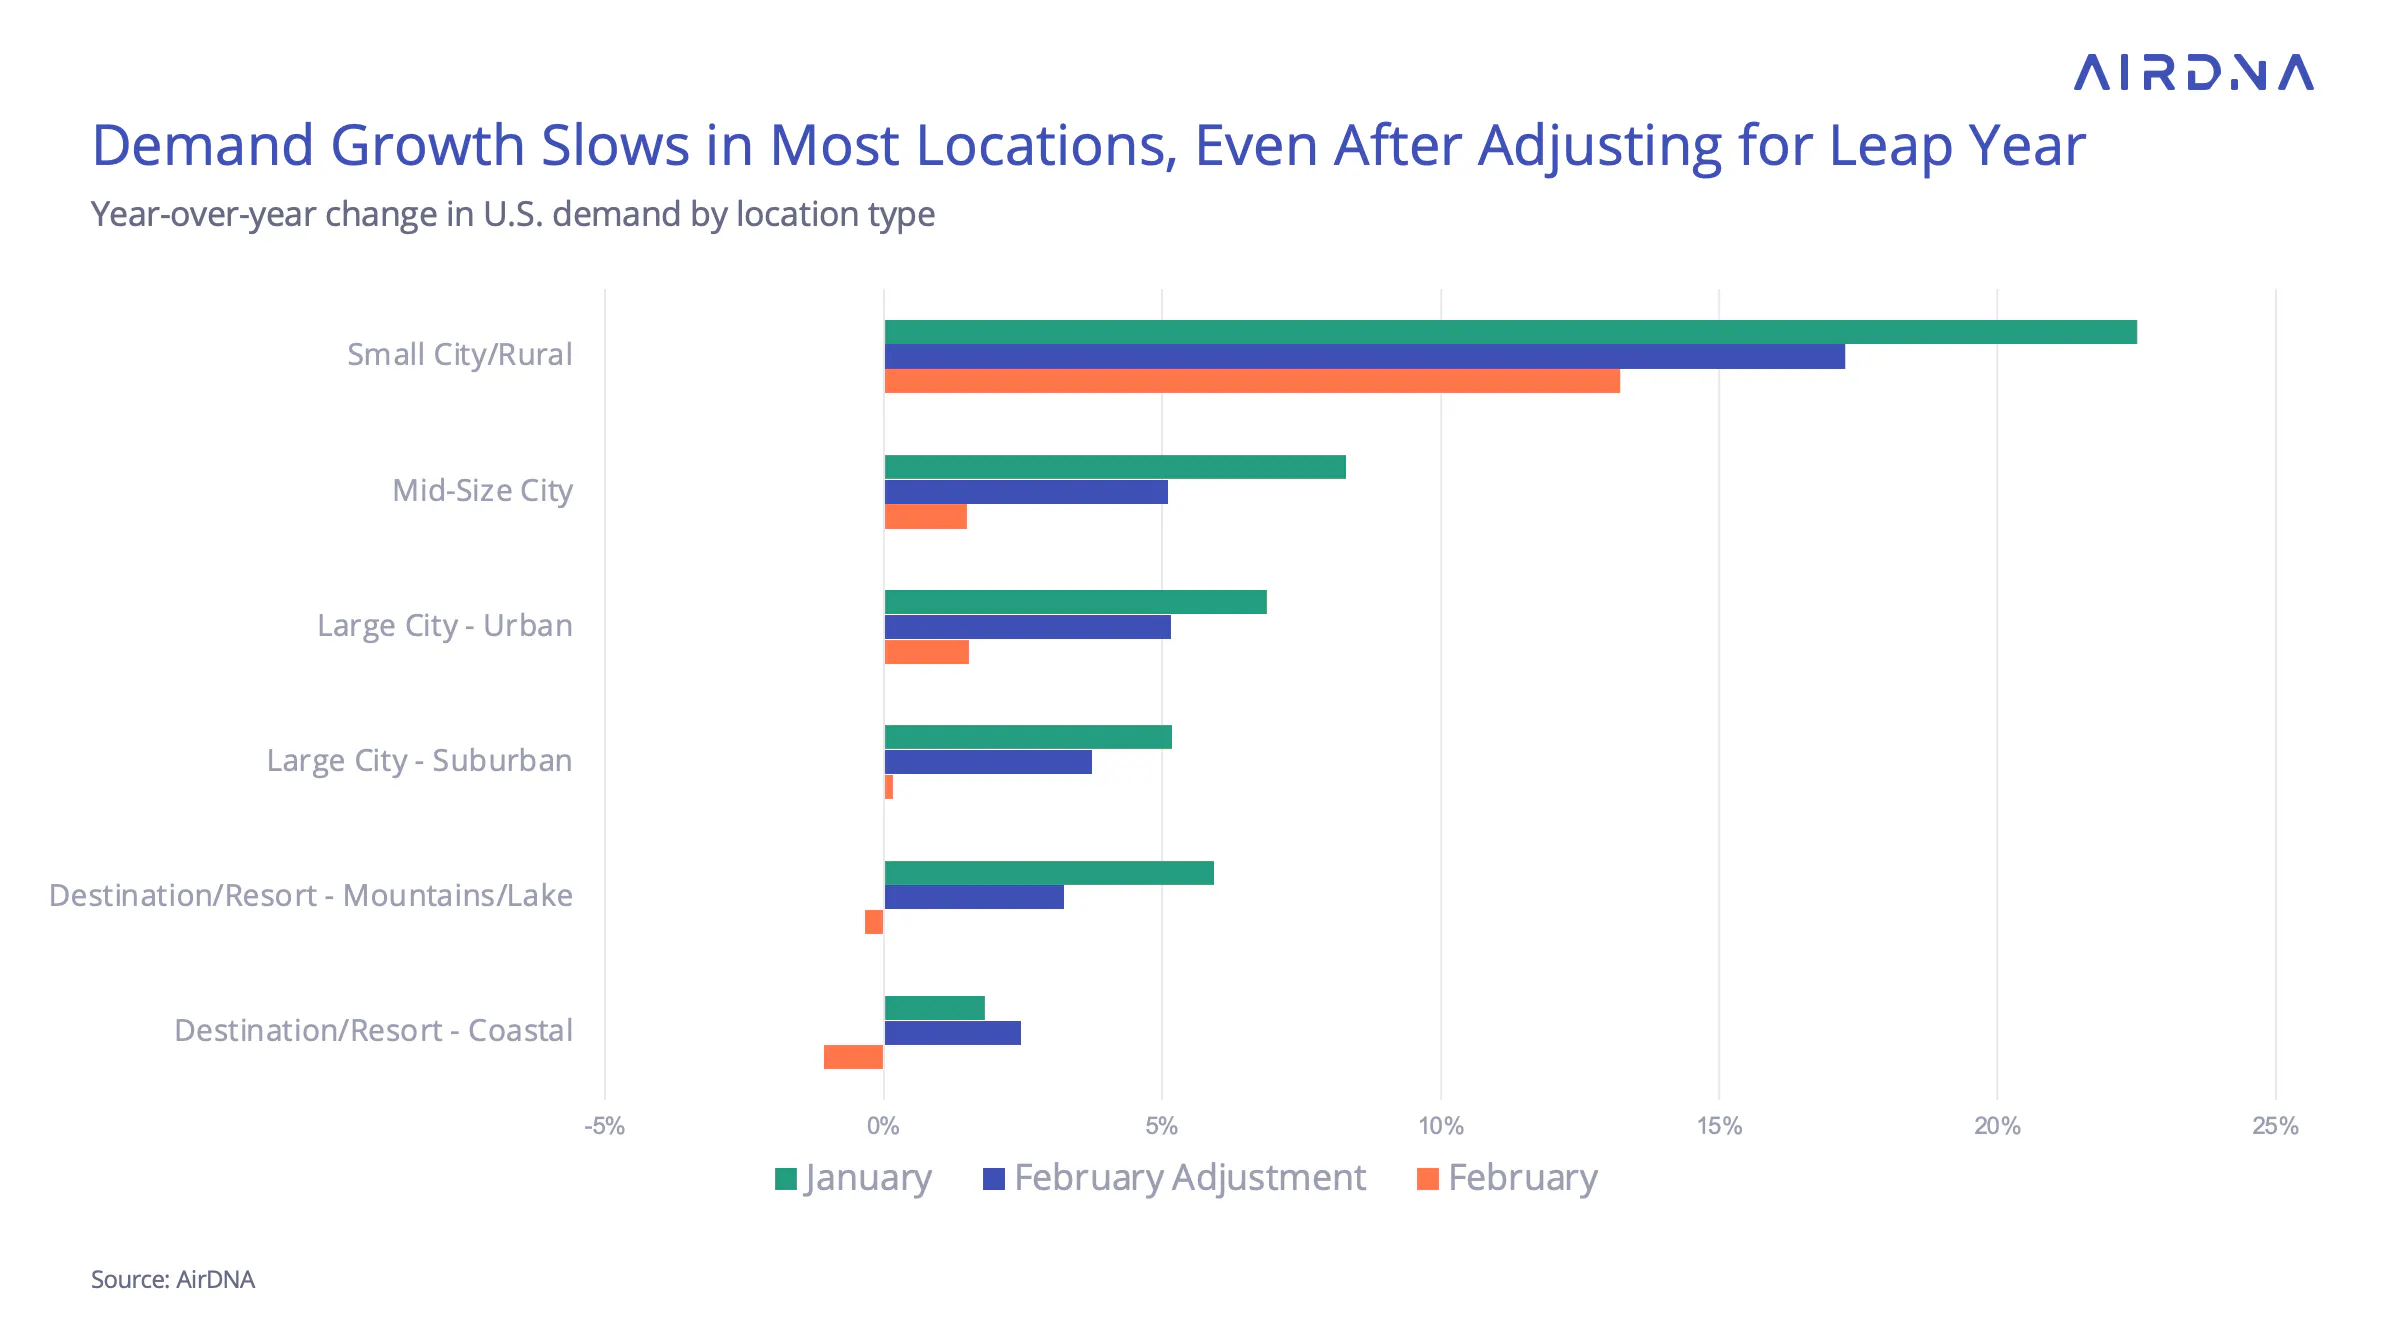
Even with this adjustment, February’s demand growth was slightly below January’s, though not as much as the raw numbers suggest. Demand increased 1.3% YOY, but adjusting for Leap Day, the true growth rate was 5.0%. Similarly, bookings showed a -0.2% YOY decline, but on an adjusted basis, they actually grew 3.3%.
Some of January’s strong demand may have been influenced by poor snow conditions in early 2024, making year-over-year comparisons easier. Likewise, February appears weaker even after adjustments, largely due to an exceptionally strong February last year.
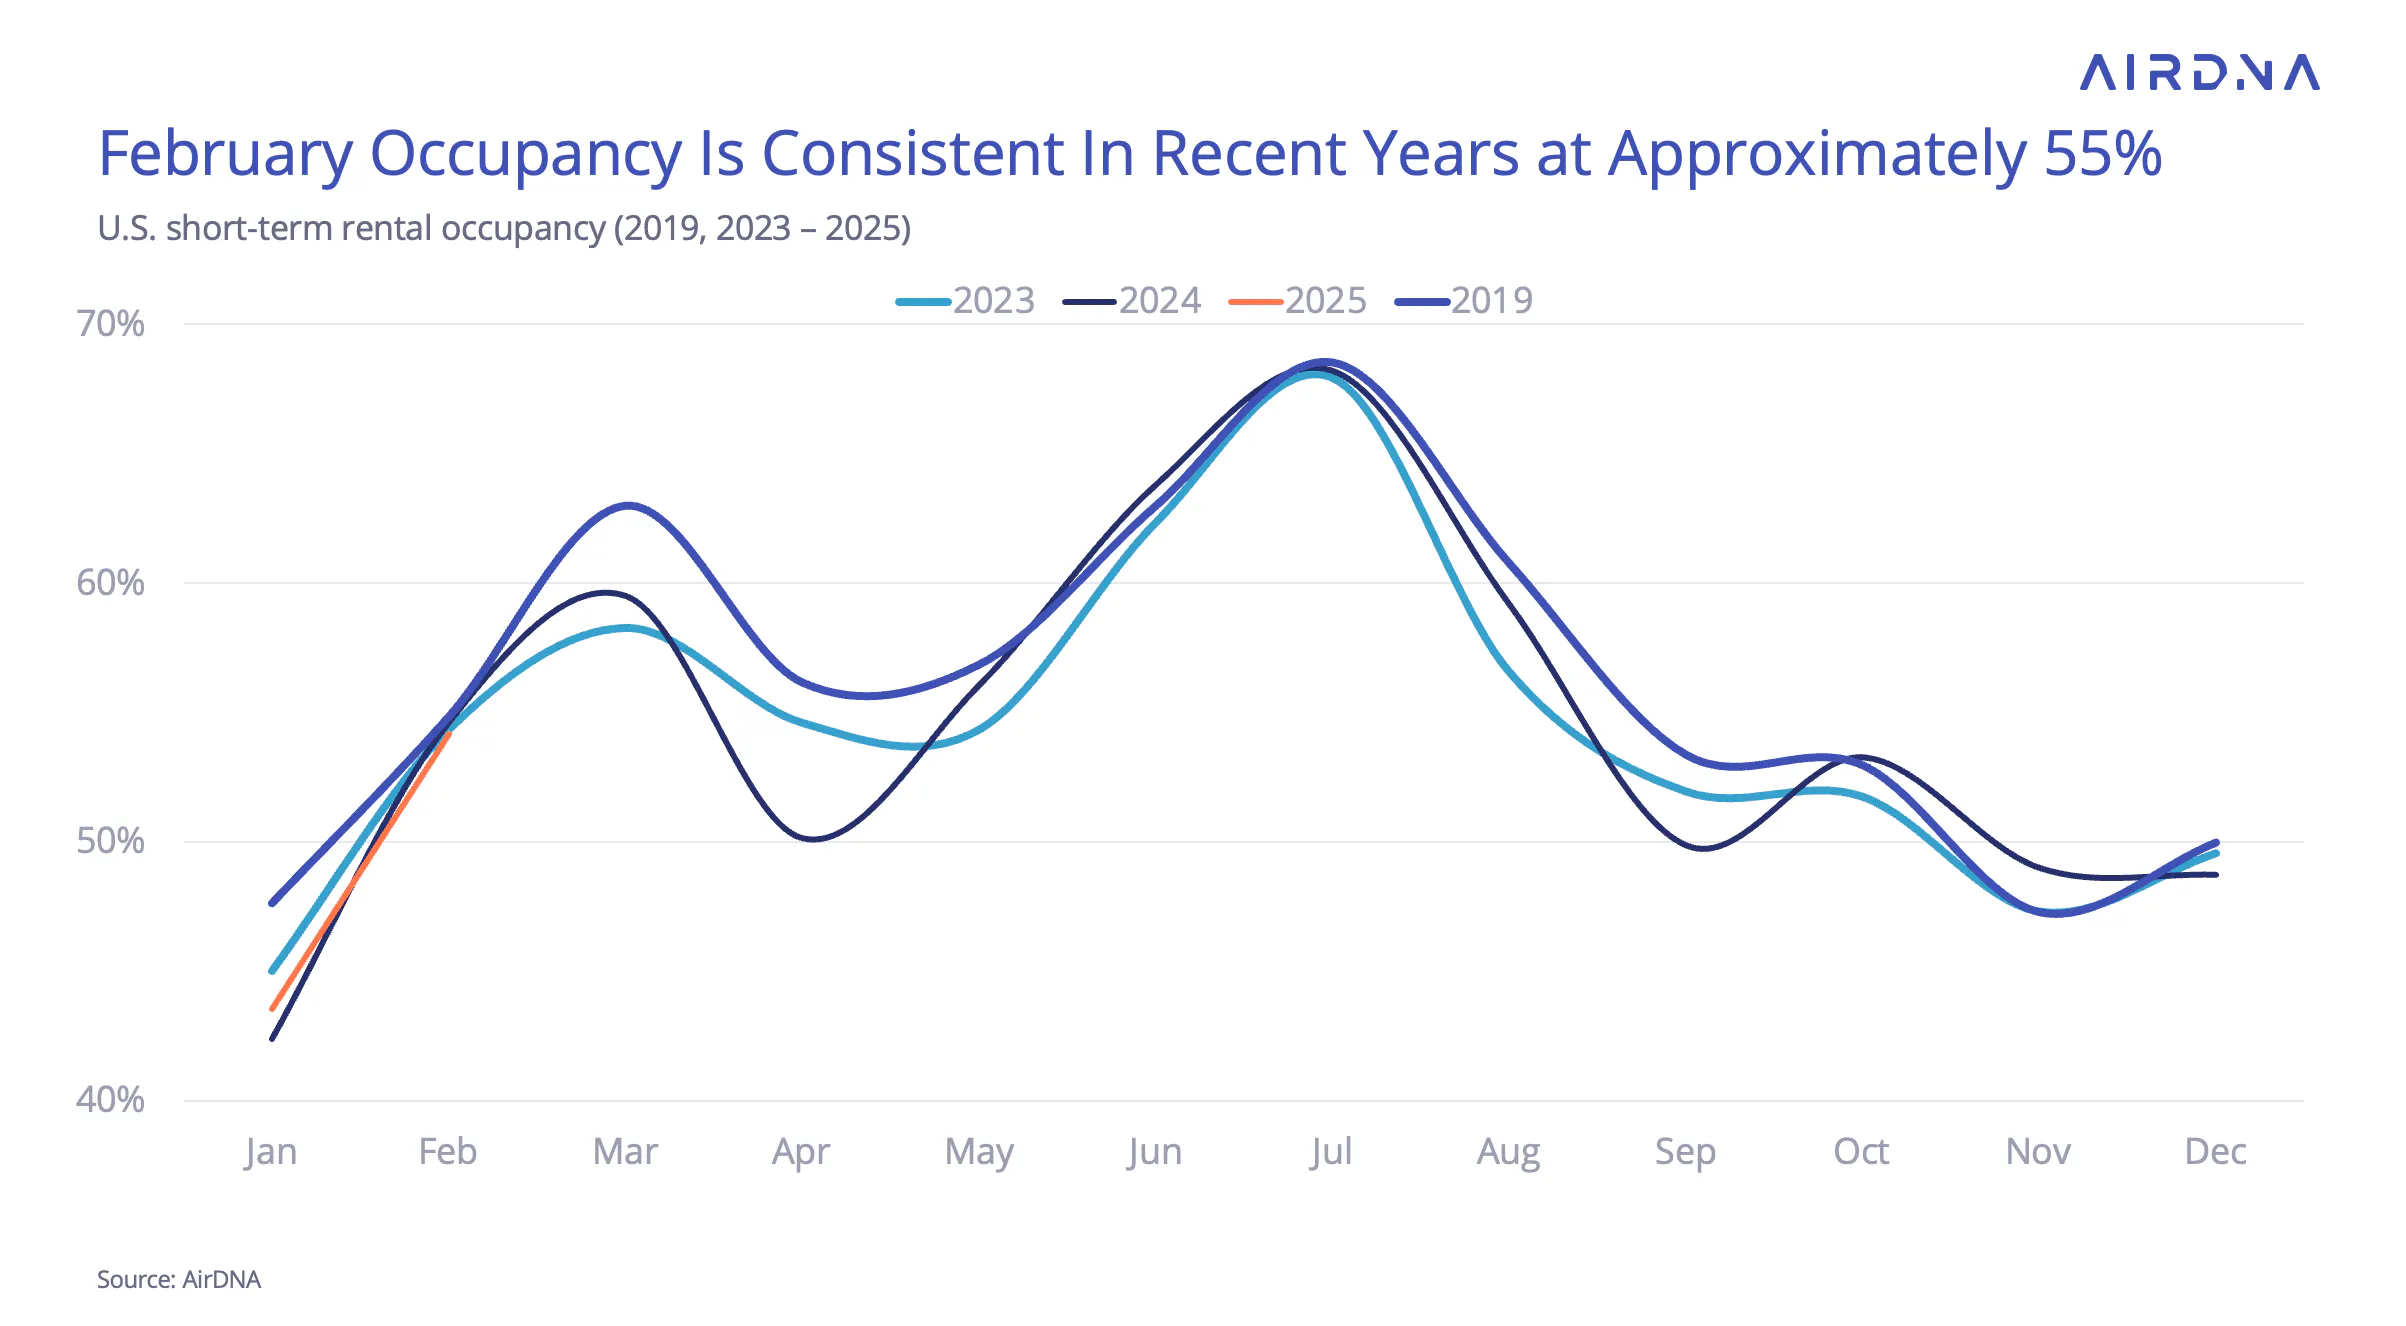
January saw the first year-over-year occupancy increase in four years, raising questions about whether this momentum would continue. While February’s occupancy technically declined 0.8% YOY, it remained within a narrow historical range of 54.3%–54.8%, effectively creating a four-way tie with February figures from 2019, 2023, and 2024.
It may take time to get a clear picture of annual occupancy trends, especially with the Easter and Spring Break calendar shift reversing this year—potentially impacting peak seasonal demand patterns.
Still, demand growth slowing was a widespread trend among the location types in February, even after accounting for Leap Day. Coastal resorts were the only exception, with adjusted demand growth ticking up to +2.5%, compared to +1.8% in January. However, this still marked the slowest adjusted growth of any location type.
Small city and rural locations maintained the fastest growth, continuing their strong performance. Meanwhile, urban locations rebounded, overtaking mid-size cities as the second-fastest-growing category—likely due to stabilization following last year’s New York STR enforcement and other regulatory changes.
ADR and RRI Growth Align in February
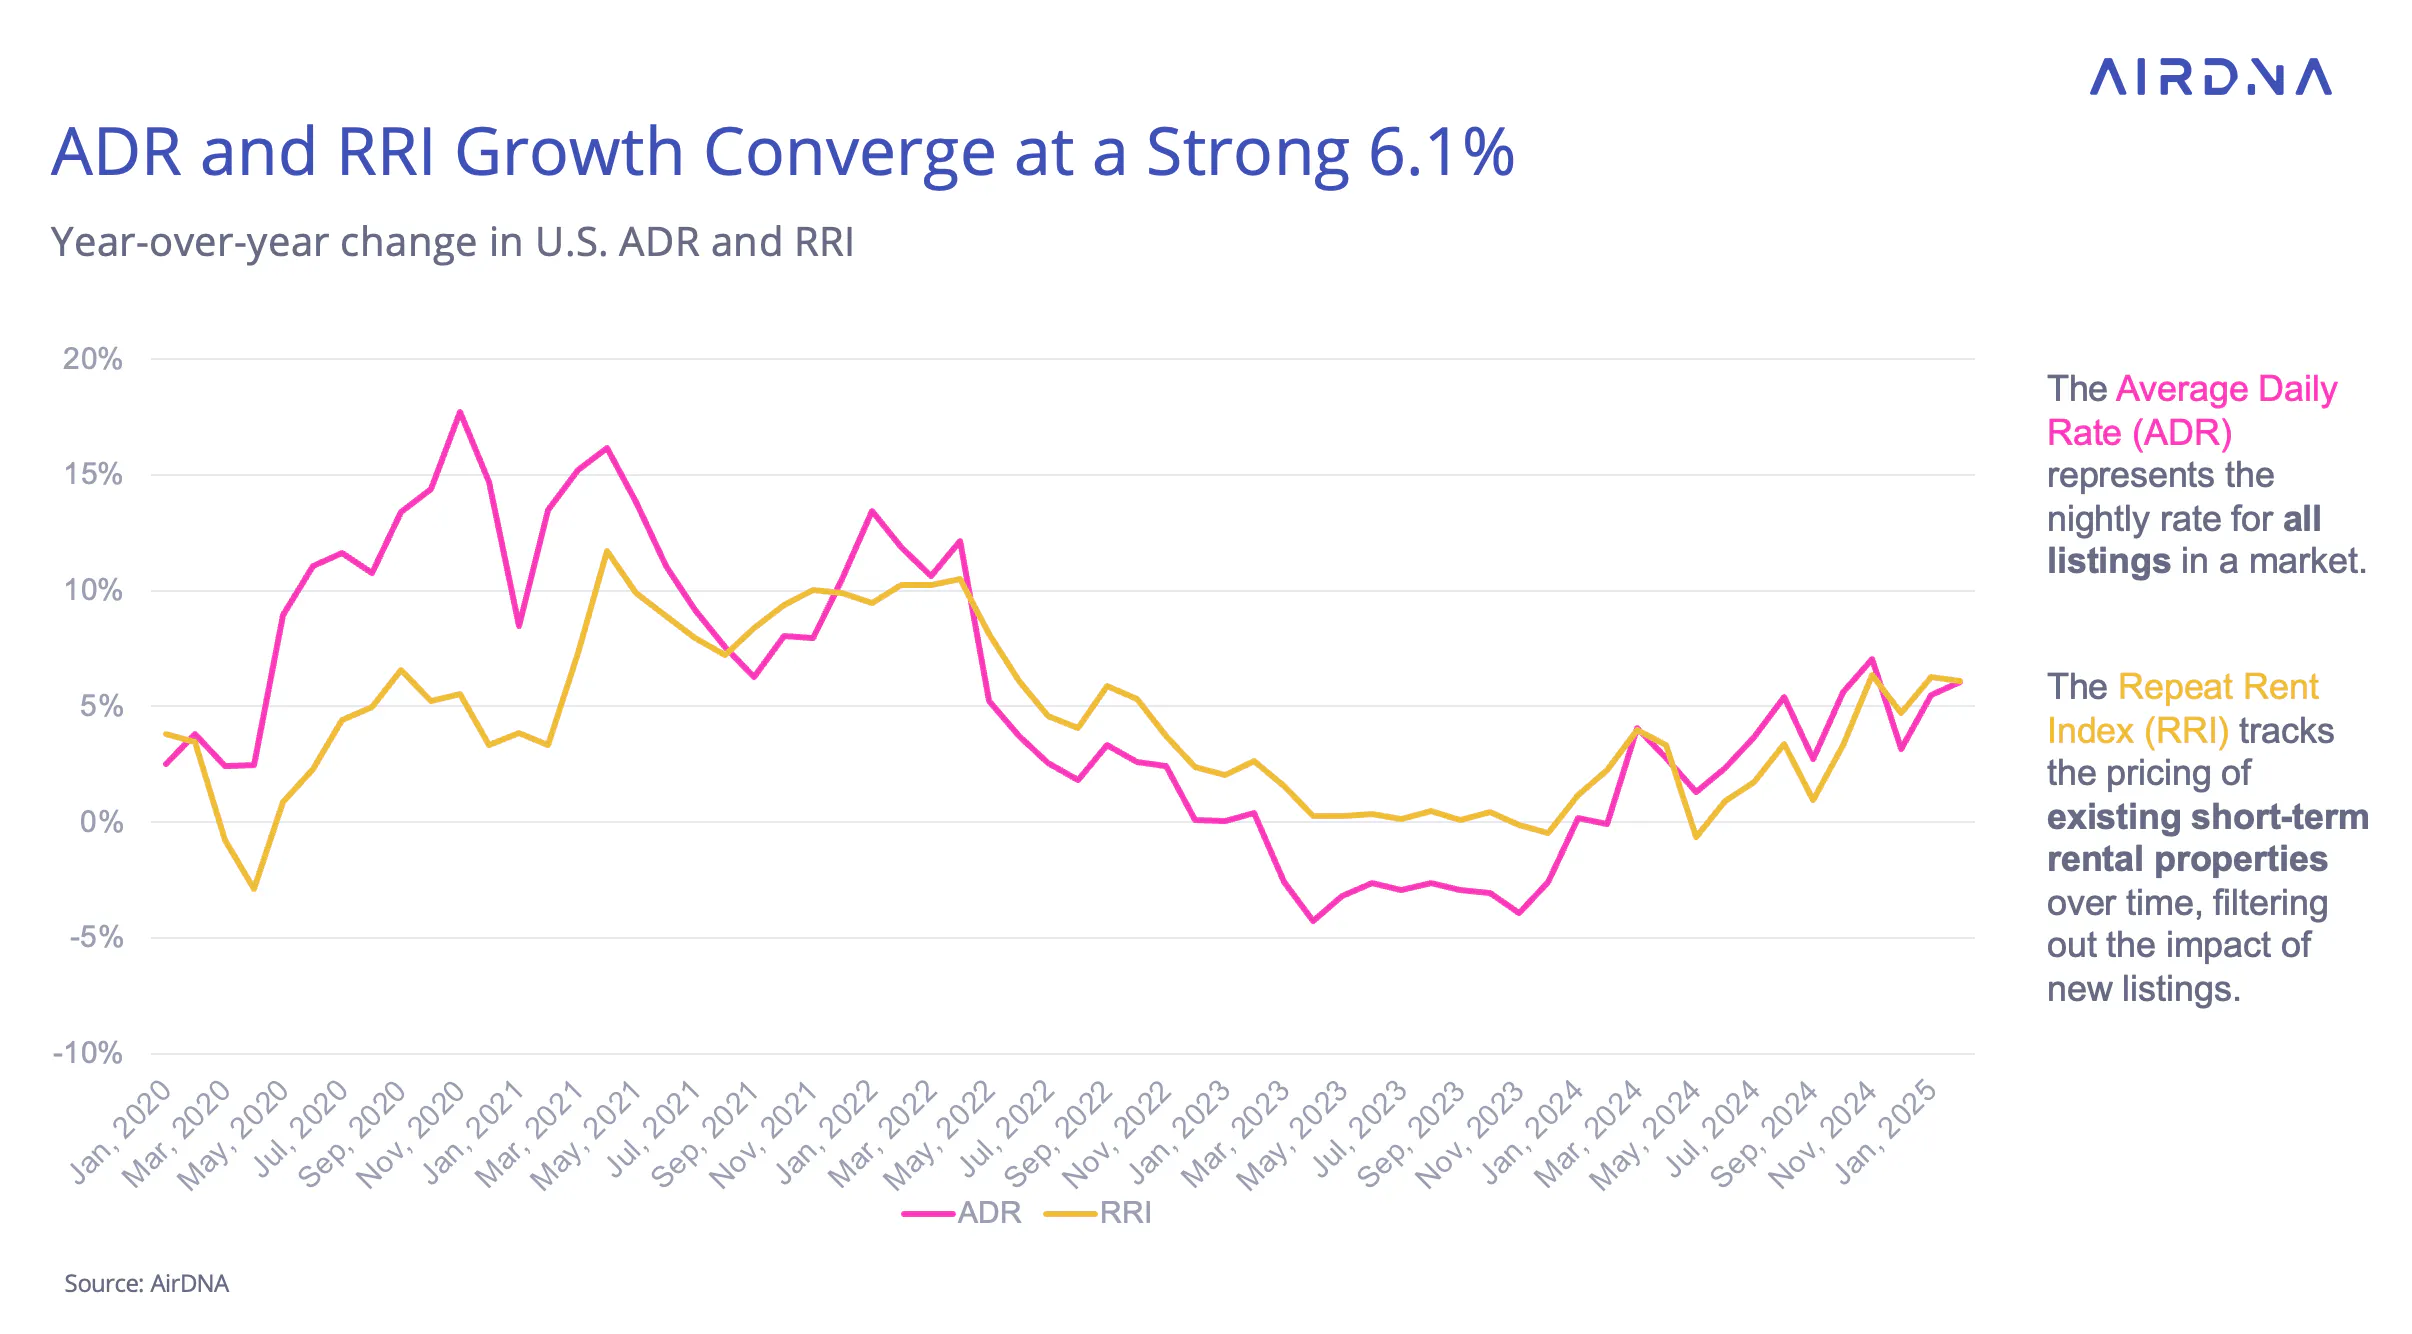
After a year of slowing average daily rate (ADR) growth, 2024 saw a return to steady gains—a trend that has carried into 2025. In February, ADR increased 6.1% YOY, matching the growth rate of the AirDNA Repeat Rent Index (RRI). While ADR tracks the prices of all listings in a market, RRI looks exclusively at the nightly rates of existing listings. Since new listings can skew the ADR average higher or lower, RRI is a useful metric for tracking long-term pricing power.
This alignment indicates that market-wide price increases were not driven by mix shifts—meaning new STR additions were, on average, priced similarly to existing listings, rather than skewing toward higher or lower rates.
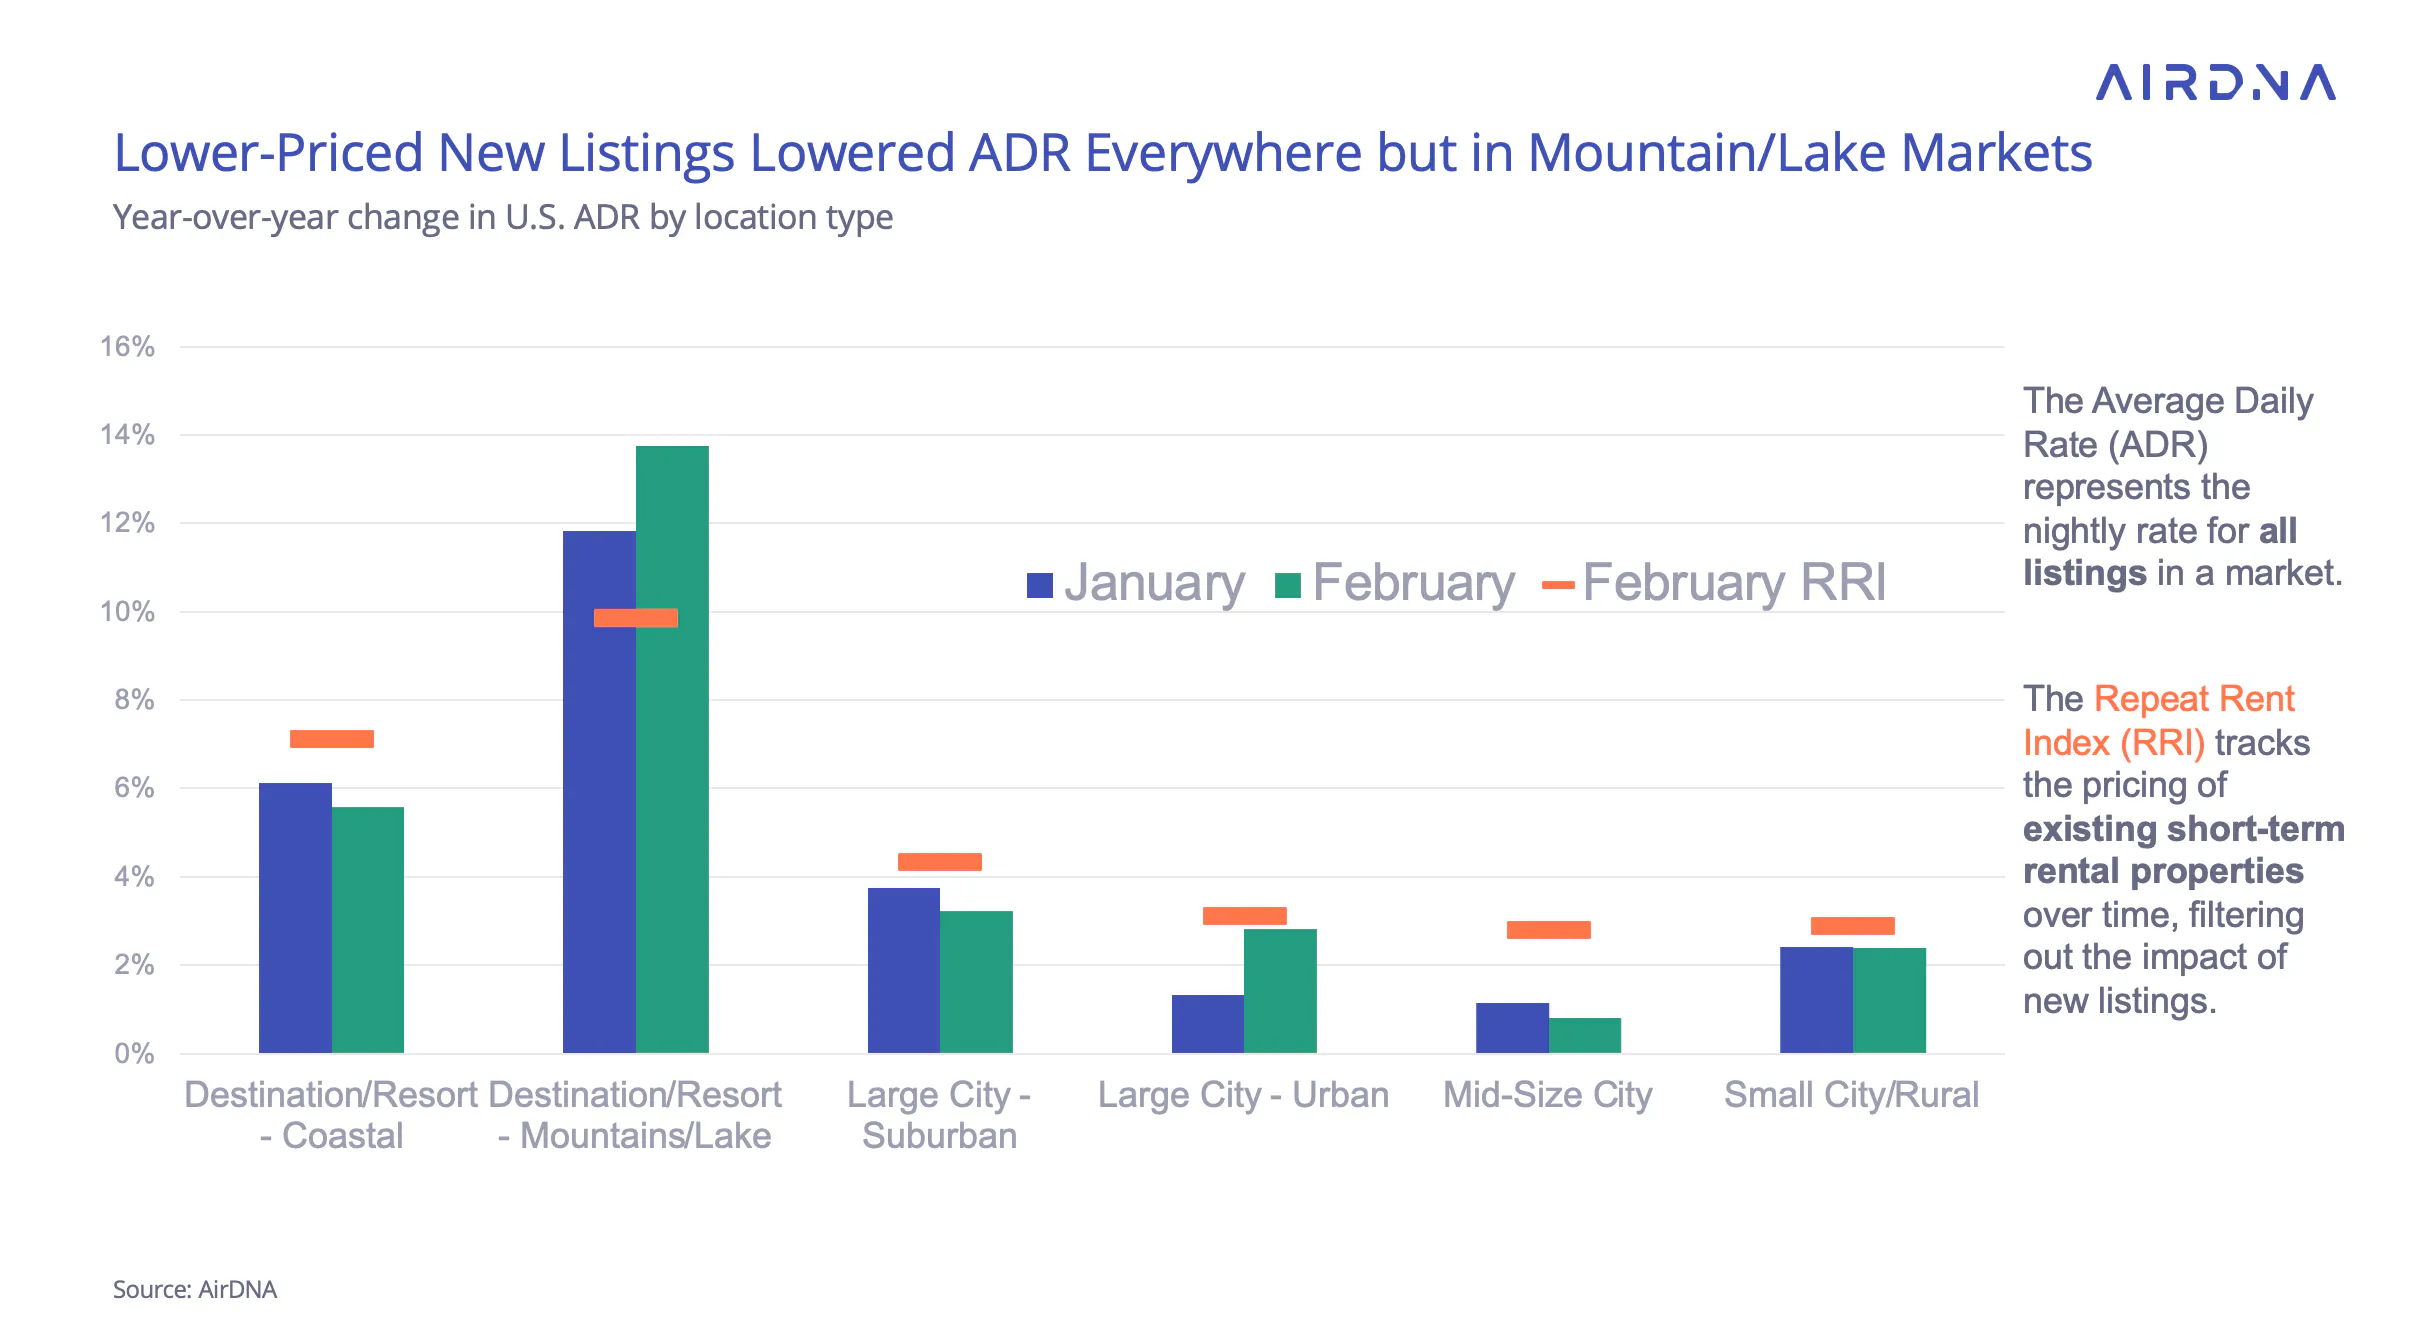
While overall ADR and Repeat Rent Index (RRI) growth aligned in February, a closer look at individual locations reveals variations beneath the surface. In every location type except Mountain/Lake resorts, RRI growth outpaced ADR growth. This suggests that either new listings were priced lower than existing ones, or higher-priced properties exited the market—or both.
Mountain/Lake resorts saw the opposite trend, where ADR grew faster than RRI, indicating that new listings were priced higher, or lower-cost properties left the market.
Across all location types, ADR growth remained largely steady from January to February. However, urban markets saw the most significant shift, with ADR growth accelerating from +1.3% in December to +2.8% in February—suggesting a strengthening pricing environment in city markets.
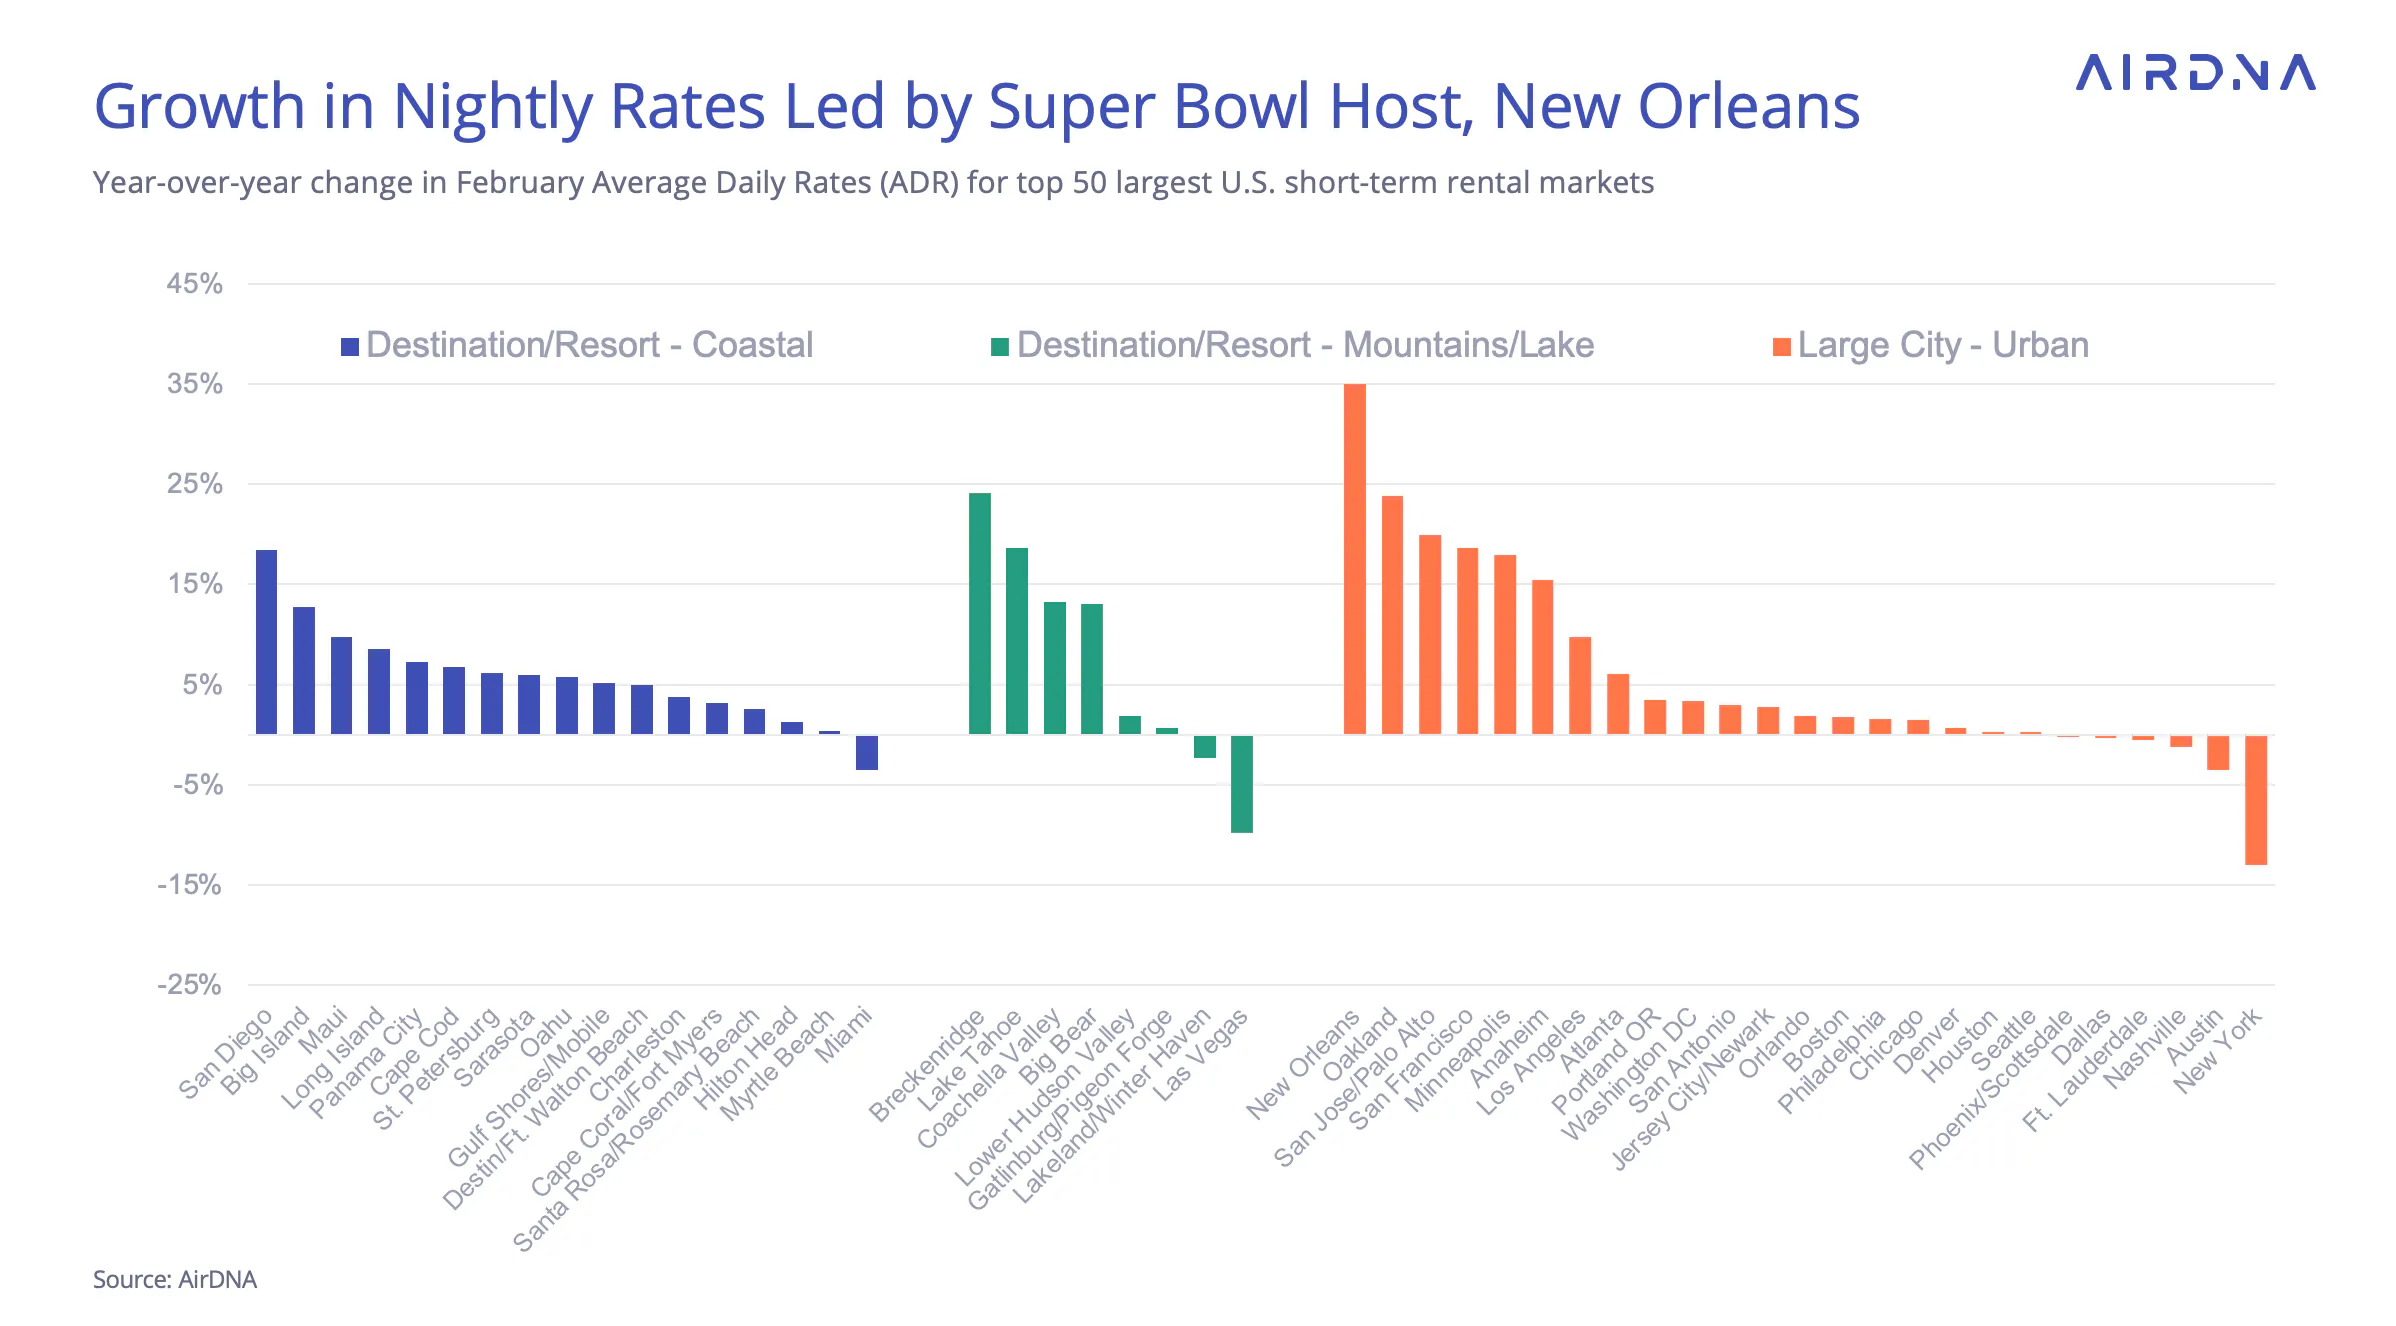
While ADR growth remained steady overall, individual markets saw notable price shifts, particularly in urban and resort locations. New Orleans led all markets with a +35.0% ADR increase, fueled by an exceptional February events calendar—starting with the Super Bowl and rolling straight into the Mardi Gras festivities.
Winter destinations also saw strong pricing power. Breckenridge, Colorado recorded a +24.1% ADR jump, following a mid-month storm that delivered much-needed snowfall across Colorado’s ski resorts.
Coastal locations weren’t far behind. San Diego posted an +18.5% ADR increase, while Hawaii’s Big Island (+12.8%) and Maui (+9.8%) saw steady rate growth as tight supply and rising occupancy made a February getaway even more exclusive.
St. Patrick's Day & Beyoncé's Tour Bring in Bookings
This momentum extends into future pacing trends, where the impact of 2024’s calendar shift is becoming clear. March demand remains flat, reflecting last year’s earlier Easter and Spring Break timing. However, April is set for a strong rebound, with pacing up 7.8% YOY as holiday schedules return to their usual patterns. Beyond April, demand continues to build, tracking 12–15% ahead of last year, signaling strong momentum heading into the peak travel season.

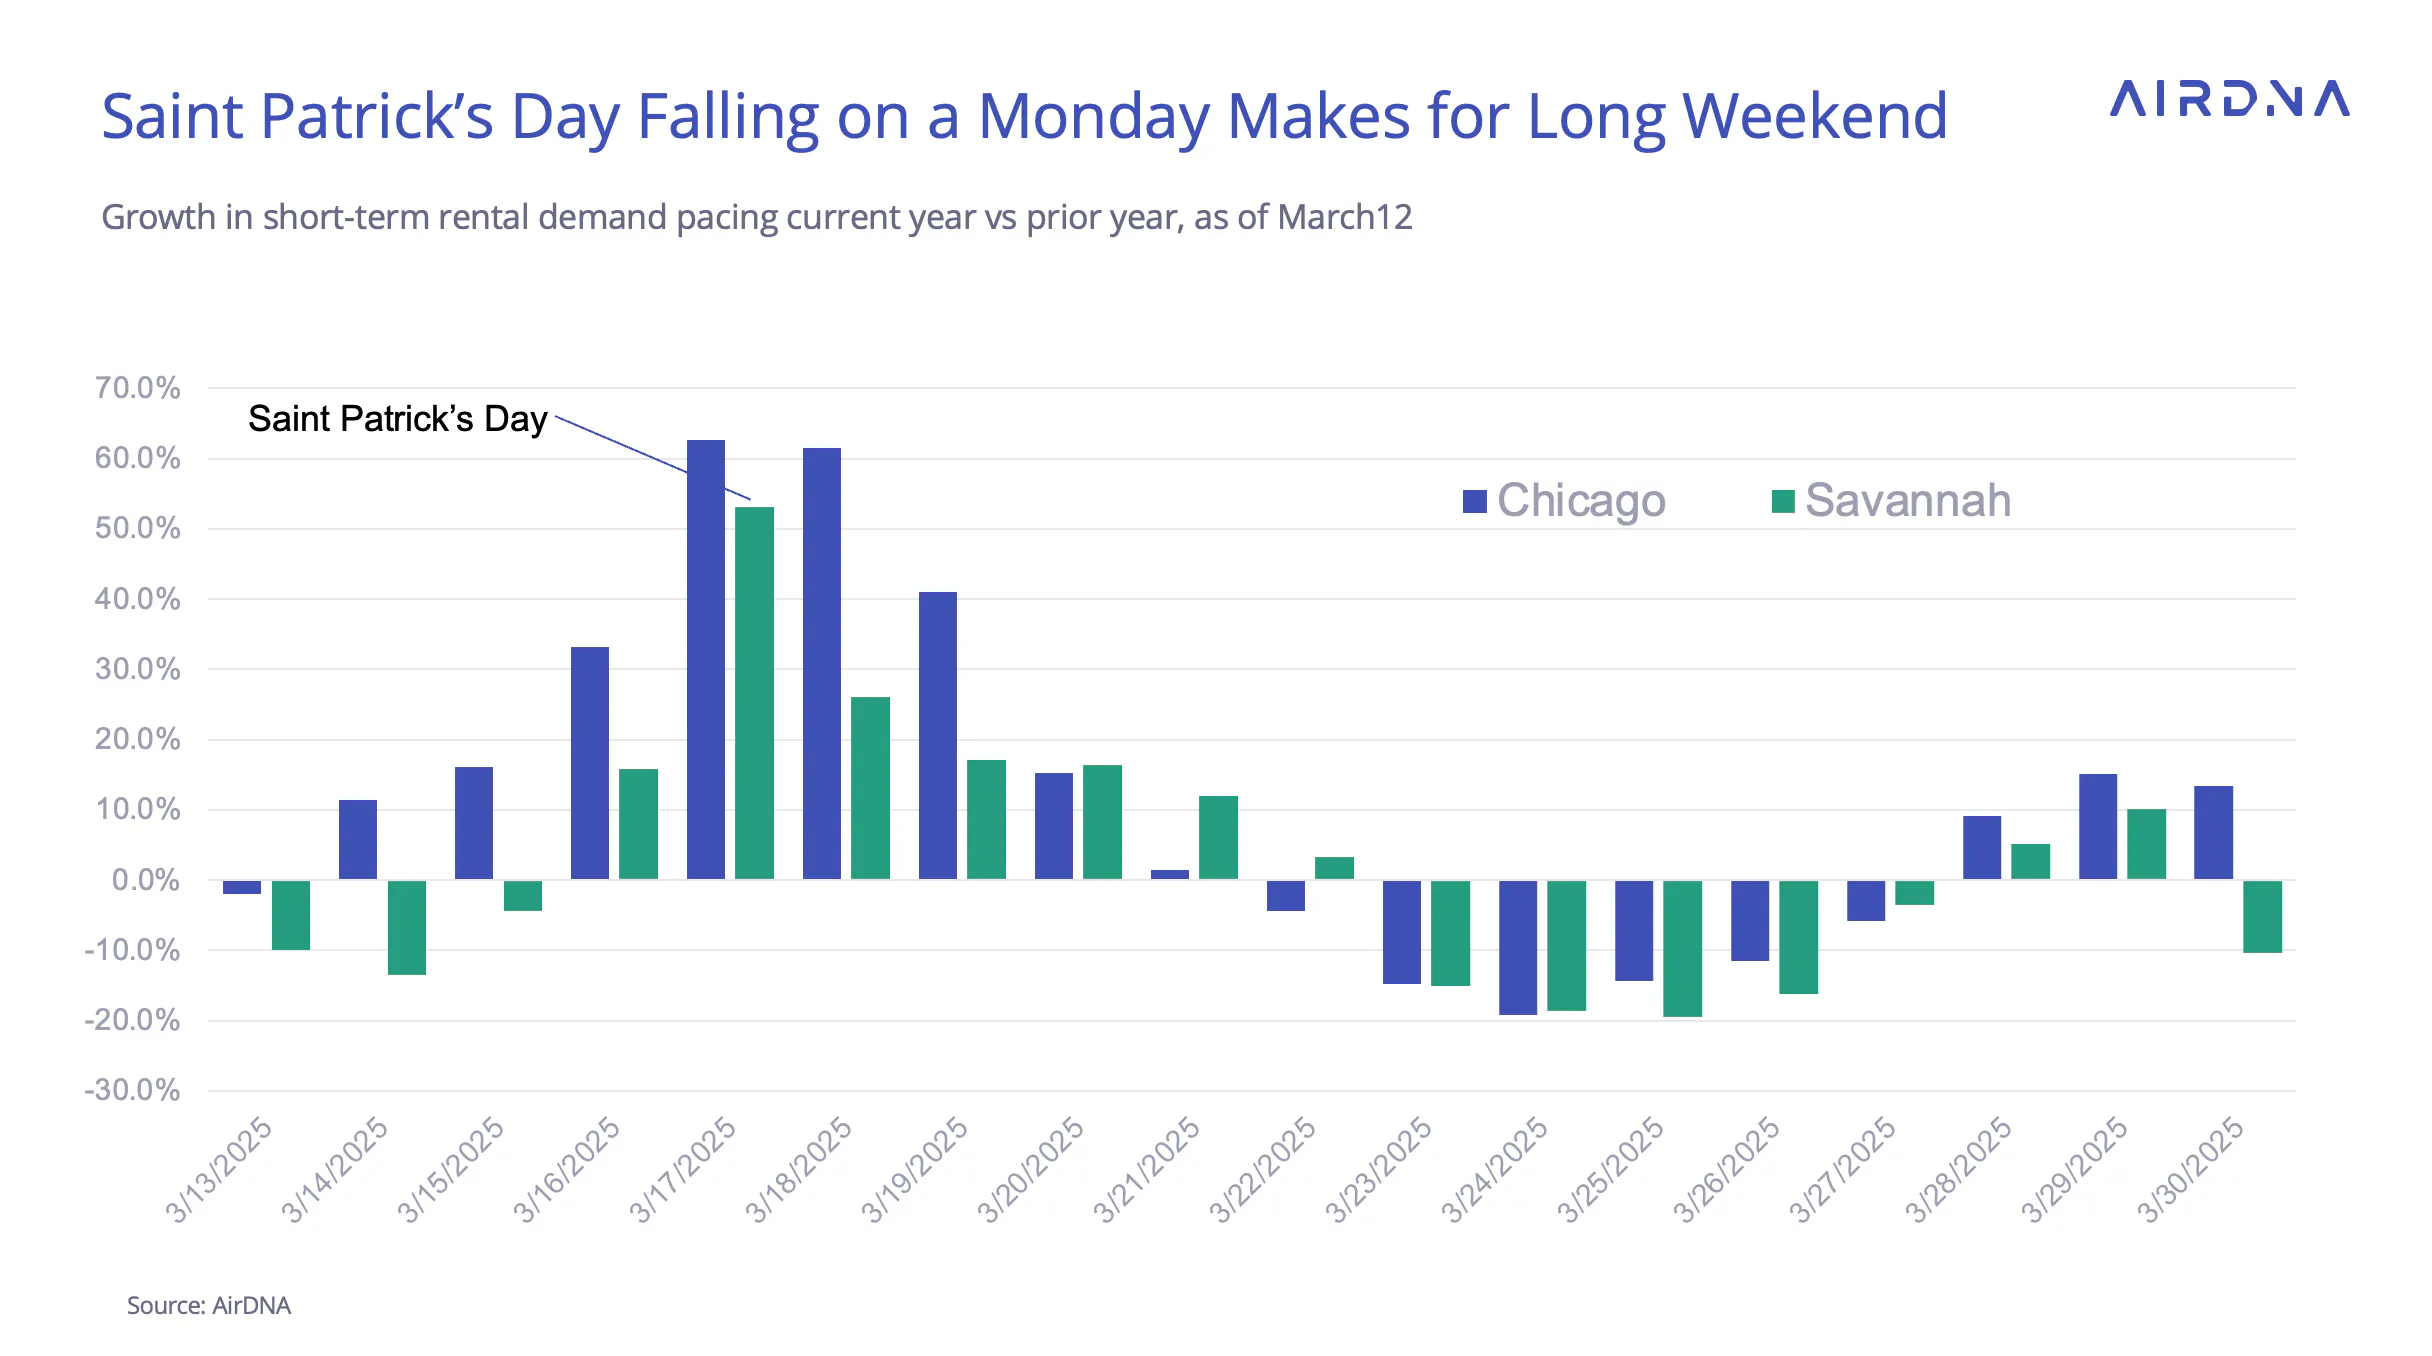
While not a universal tourism driver, Saint Patrick’s Day plays a significant role in select markets like Chicago and Savannah, Georgia, where celebrations attract large crowds. Last year, the holiday fell on a Sunday, driving strong weekend demand. In 2025, it lands on a Monday, shifting the pattern of bookings.
Weekend growth in these cities has been muted, with Savannah even seeing fewer nights booked compared to this time last year. However, demand has picked up significantly on Monday, Tuesday, and Wednesday, suggesting that travelers are extending their stays into the week rather than concentrating visits over the weekend.
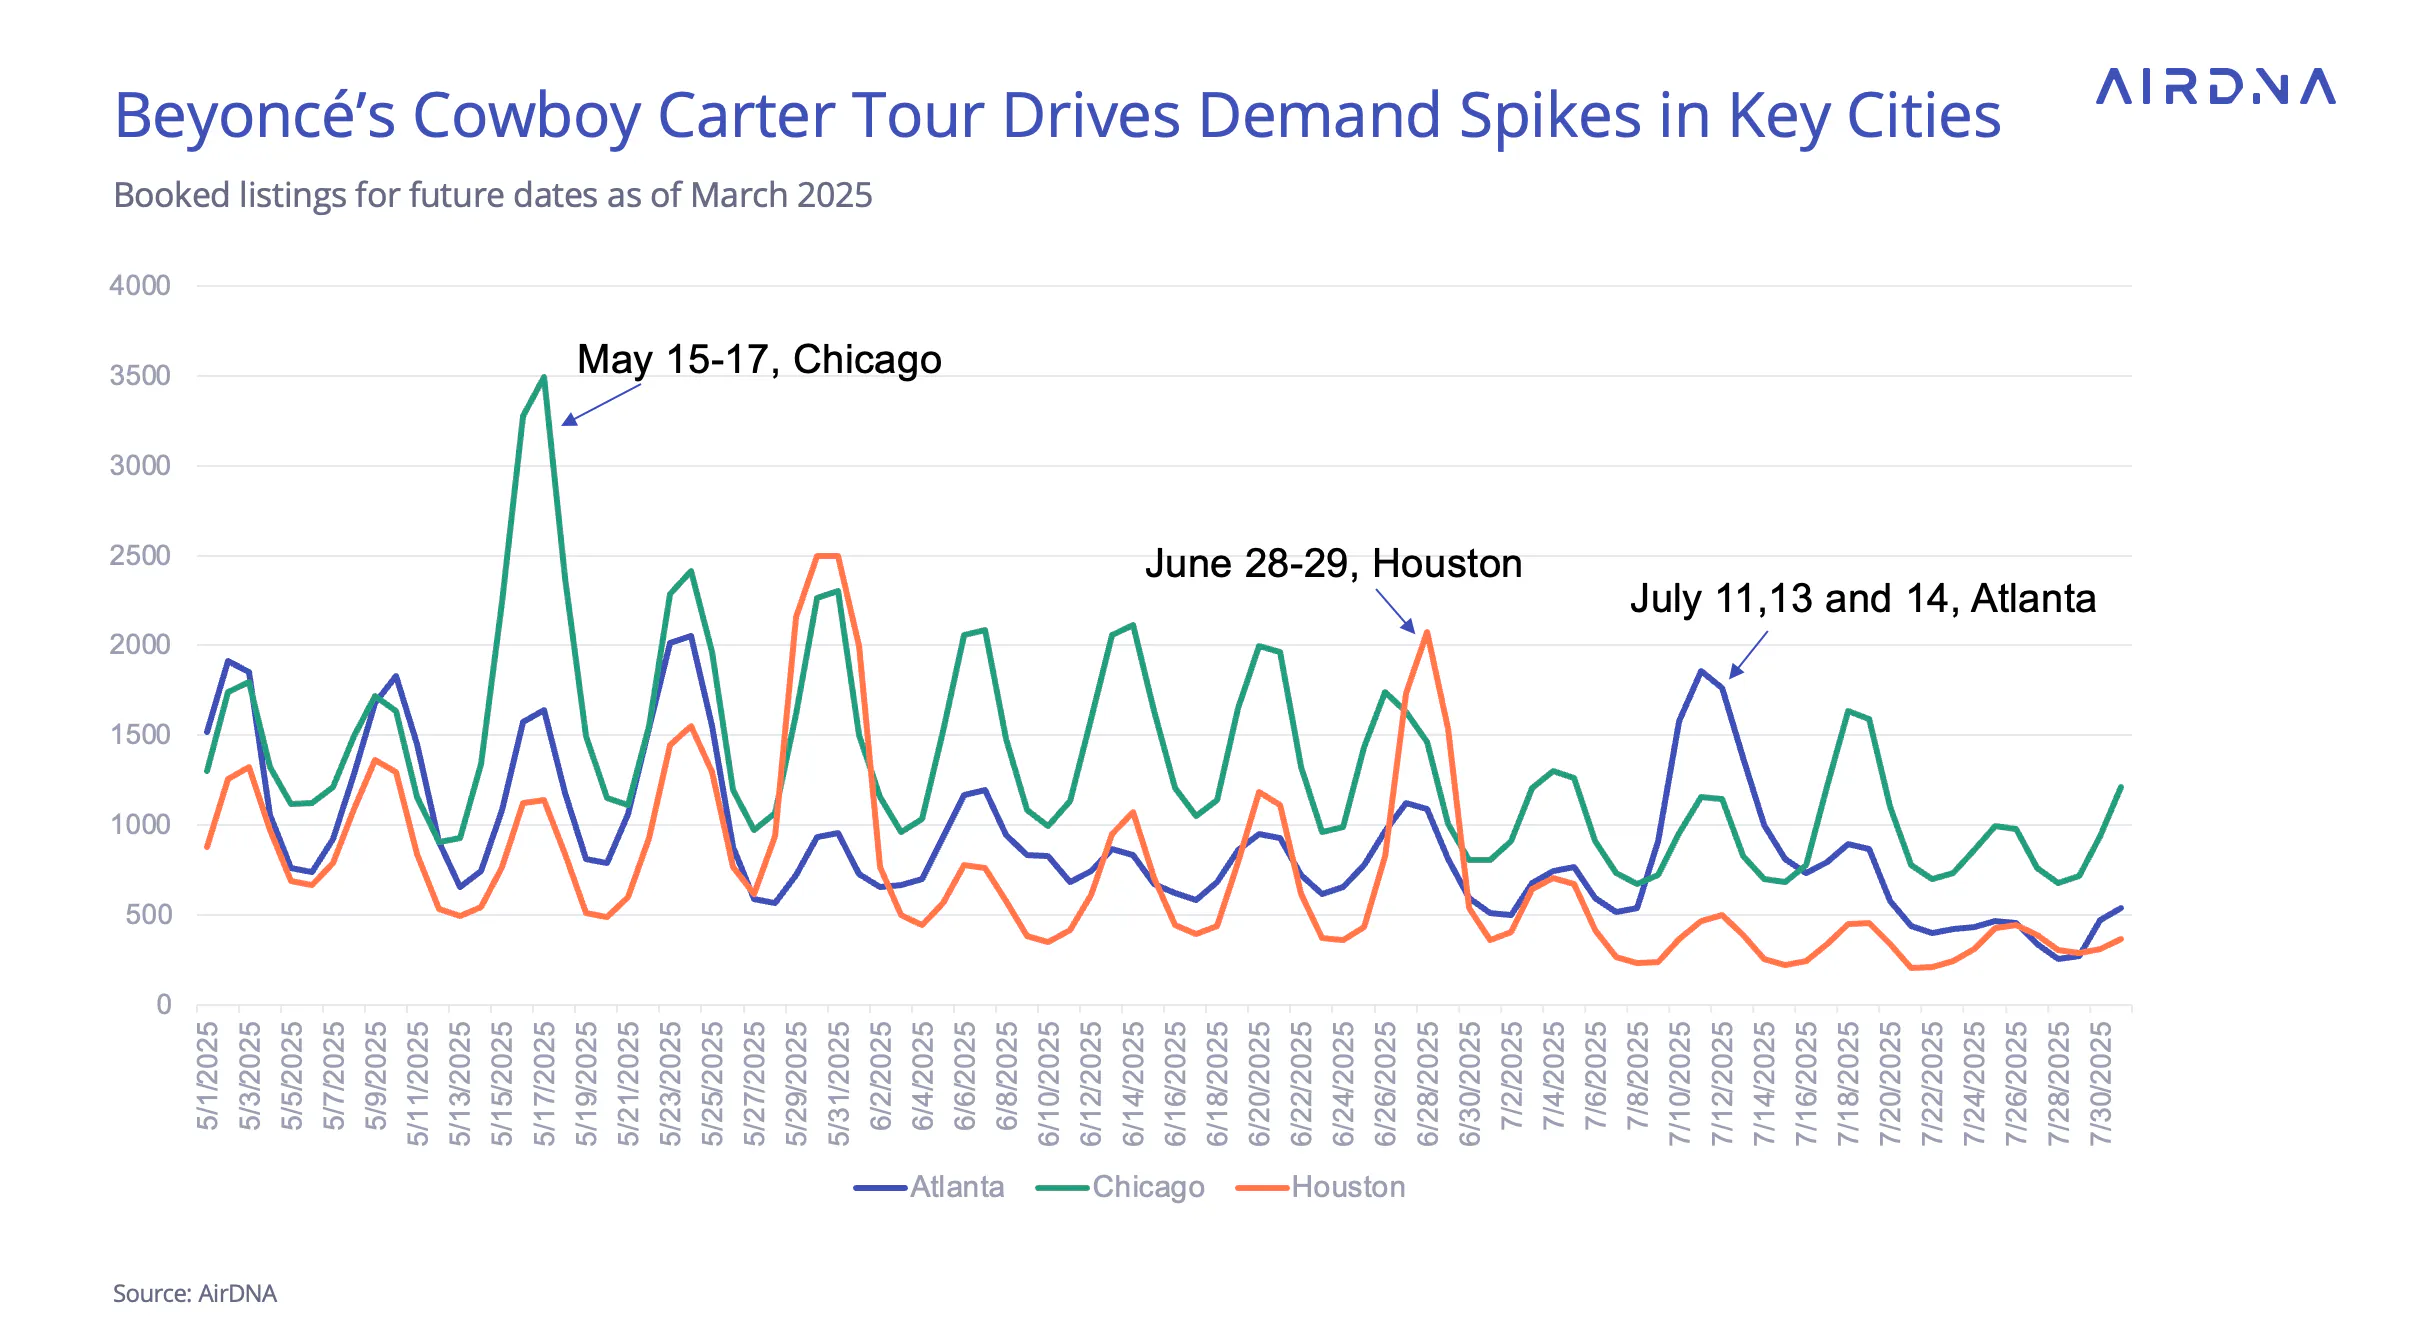
Finally, a new mega-tour, Beyoncé’s highly anticipated Cowboy Carter Tour, is already creating waves in future booking. Although still too early to give a definitive estimate of how high demand will go in these host cities, noticeable demand spikes are beginning to appear in forward reservations in these cities. Those looking to see the famous diva “just for fun” may not want to wait long to book.
ARTICLE SUMMARY
With Spring Break shifted to April this year, March demand is looking flat but gains strong momentum in April and onwards. Plus, how St. Patrick's Day travel and Beyoncé's highly anticipated Cowboy Carter tour is benefitting hosts in key cities.
Bram Gallagher
AirDNA Director of Economics and Forecasting
Bram Gallagher is an Economist at AirDNA, specializing in uncovering insights that drive smarter short-term rental decisions. He put his Ph.D. in Economics from the University of Georgia to work researching and forecasting hotel data with CBRE prior to joining AirDNA, as well as teaching economics at a number of universities. In his spare time, Bram enjoys making wooden furniture with hand tools.
