


European Review January 2026: A Cooler Start as Demand Slips and Supply Builds
Published: February 17, 2026
Last updated: February 23, 2026

Camilo Schmid Rivas
Key Takeaways
- Europe’s STR market is normalizing after an unusually strong 2025, with softer January demand and rising supply signaling a return to more typical seasonality rather than structural decline.
- Booking behavior continues to shift toward shorter windows and off-season travel, redistributing demand across the calendar and putting pressure on highly seasonal coastal markets.
- RRI remains a bright spot, with existing operators maintaining pricing power even as headline ADR stays flat, highlighting resilience among established listings.
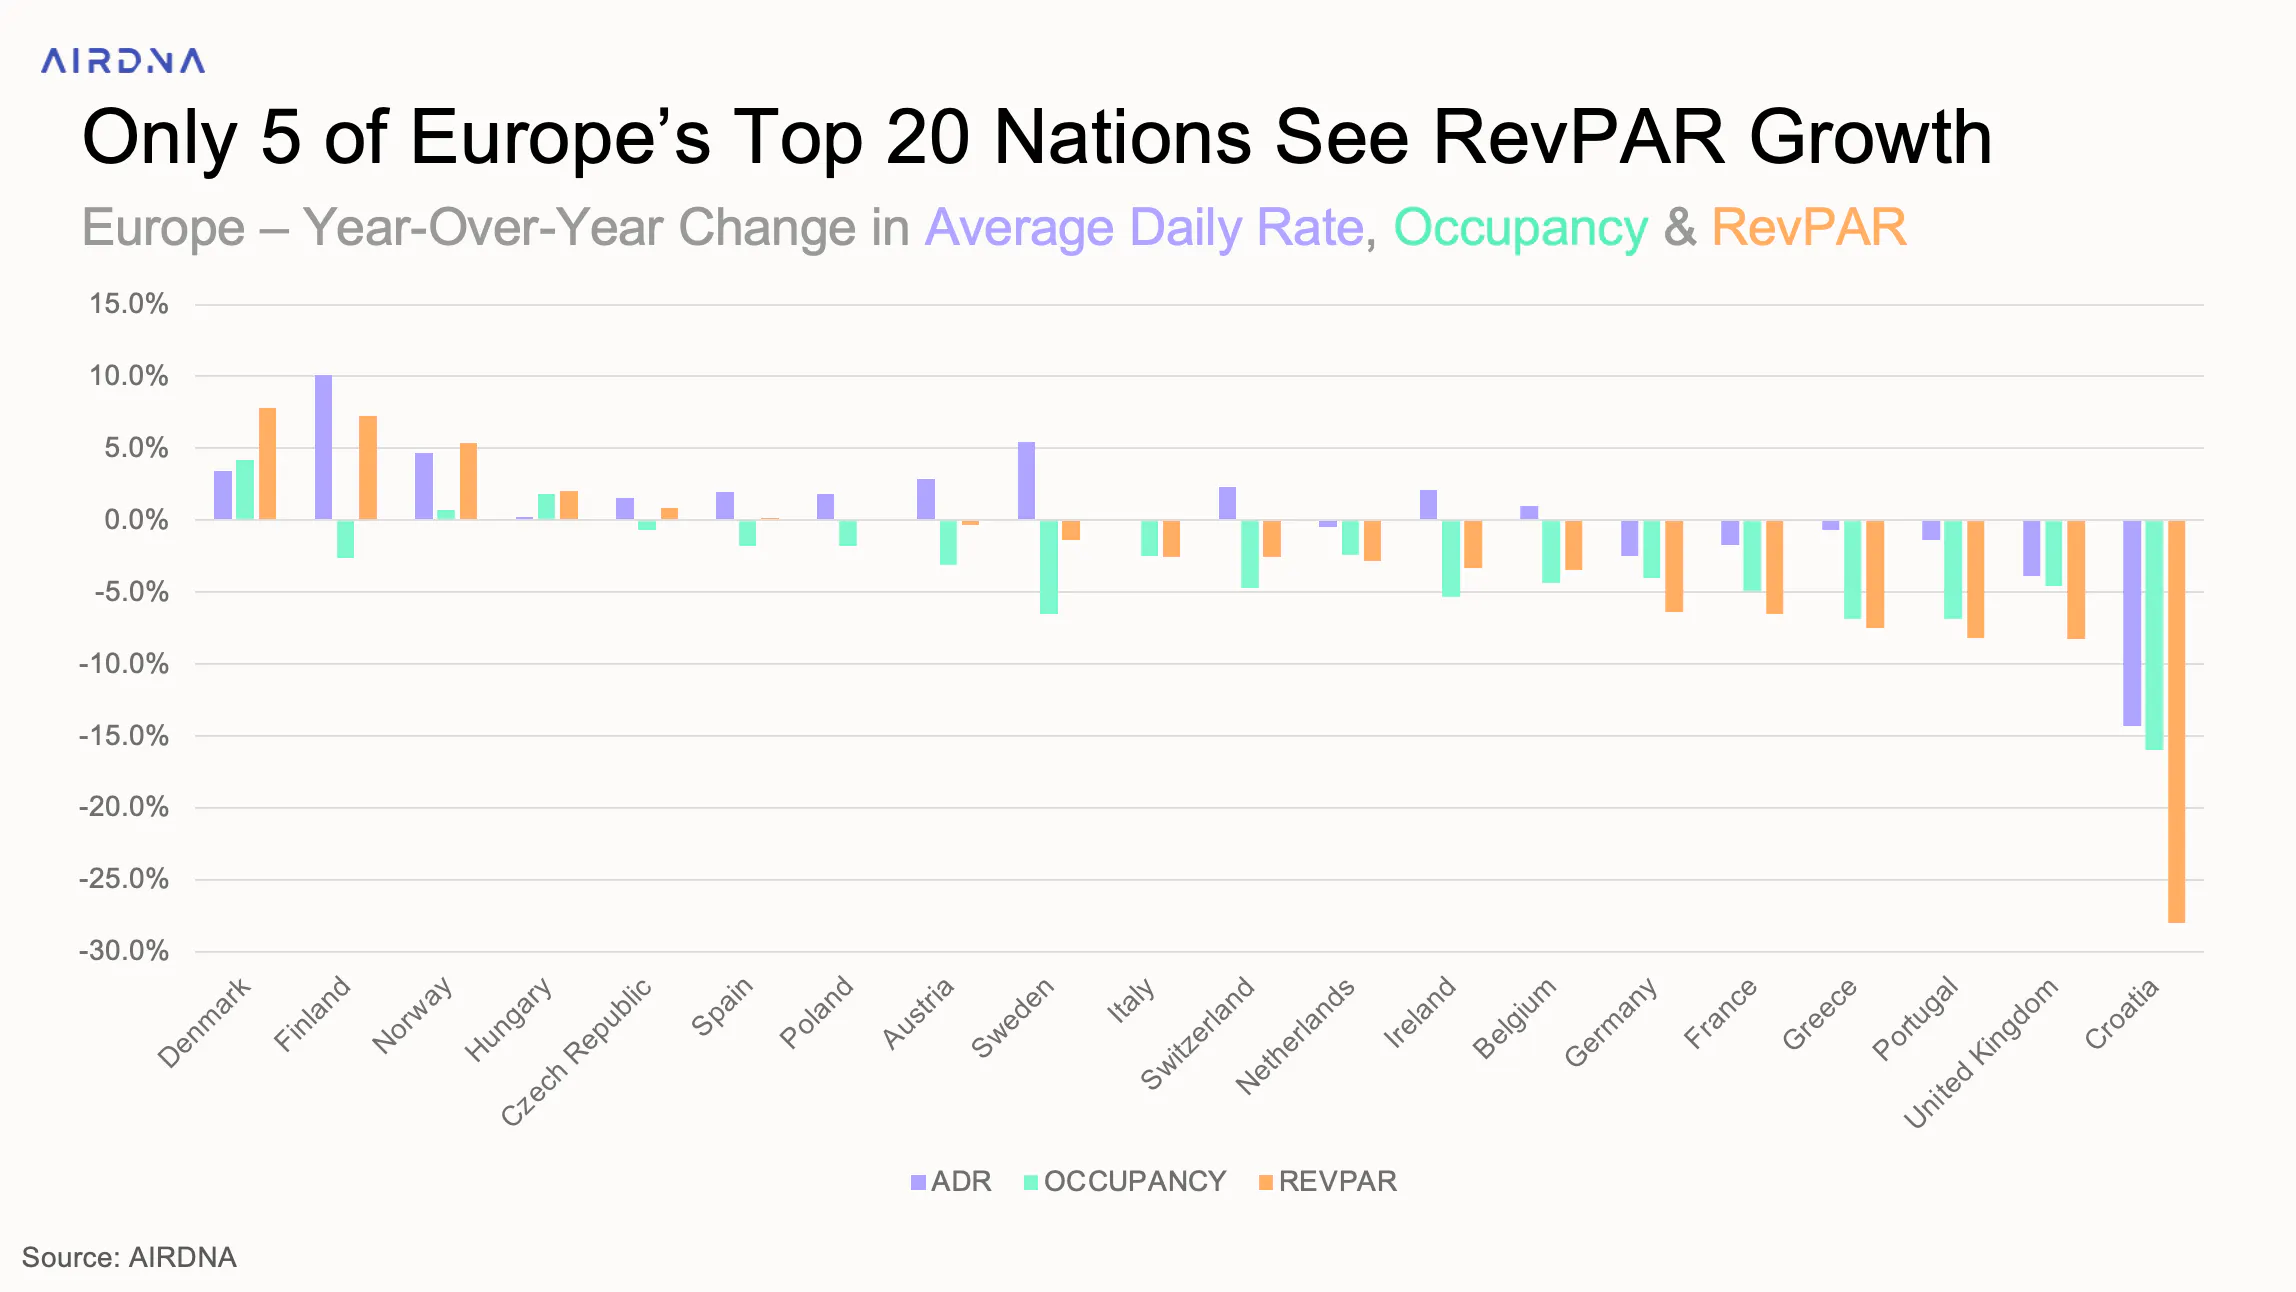
Supply increased steadily by 3.5%, while demand declined across Europe in January. This is due in part to severe weather, causing occupancy to drop 4.1%. The fall in demand coincided with a slight decrease in ADR of 0.6% and a 4.7% decline in RevPAR. Only 5 of Europe’s top 20 countries recorded gains in RevPAR. Despite this, the Repeat Rent Index (RRI) continued to grow.
RRI is a proprietary measure that tracks repeat rent performance for comparable STR listings over time. While the RRI reflects underlying rent stability for consistent properties, ADR growth includes the impact from new listings entering the market. RRI growth in January suggests stronger pricing power among existing operators than new entrants.
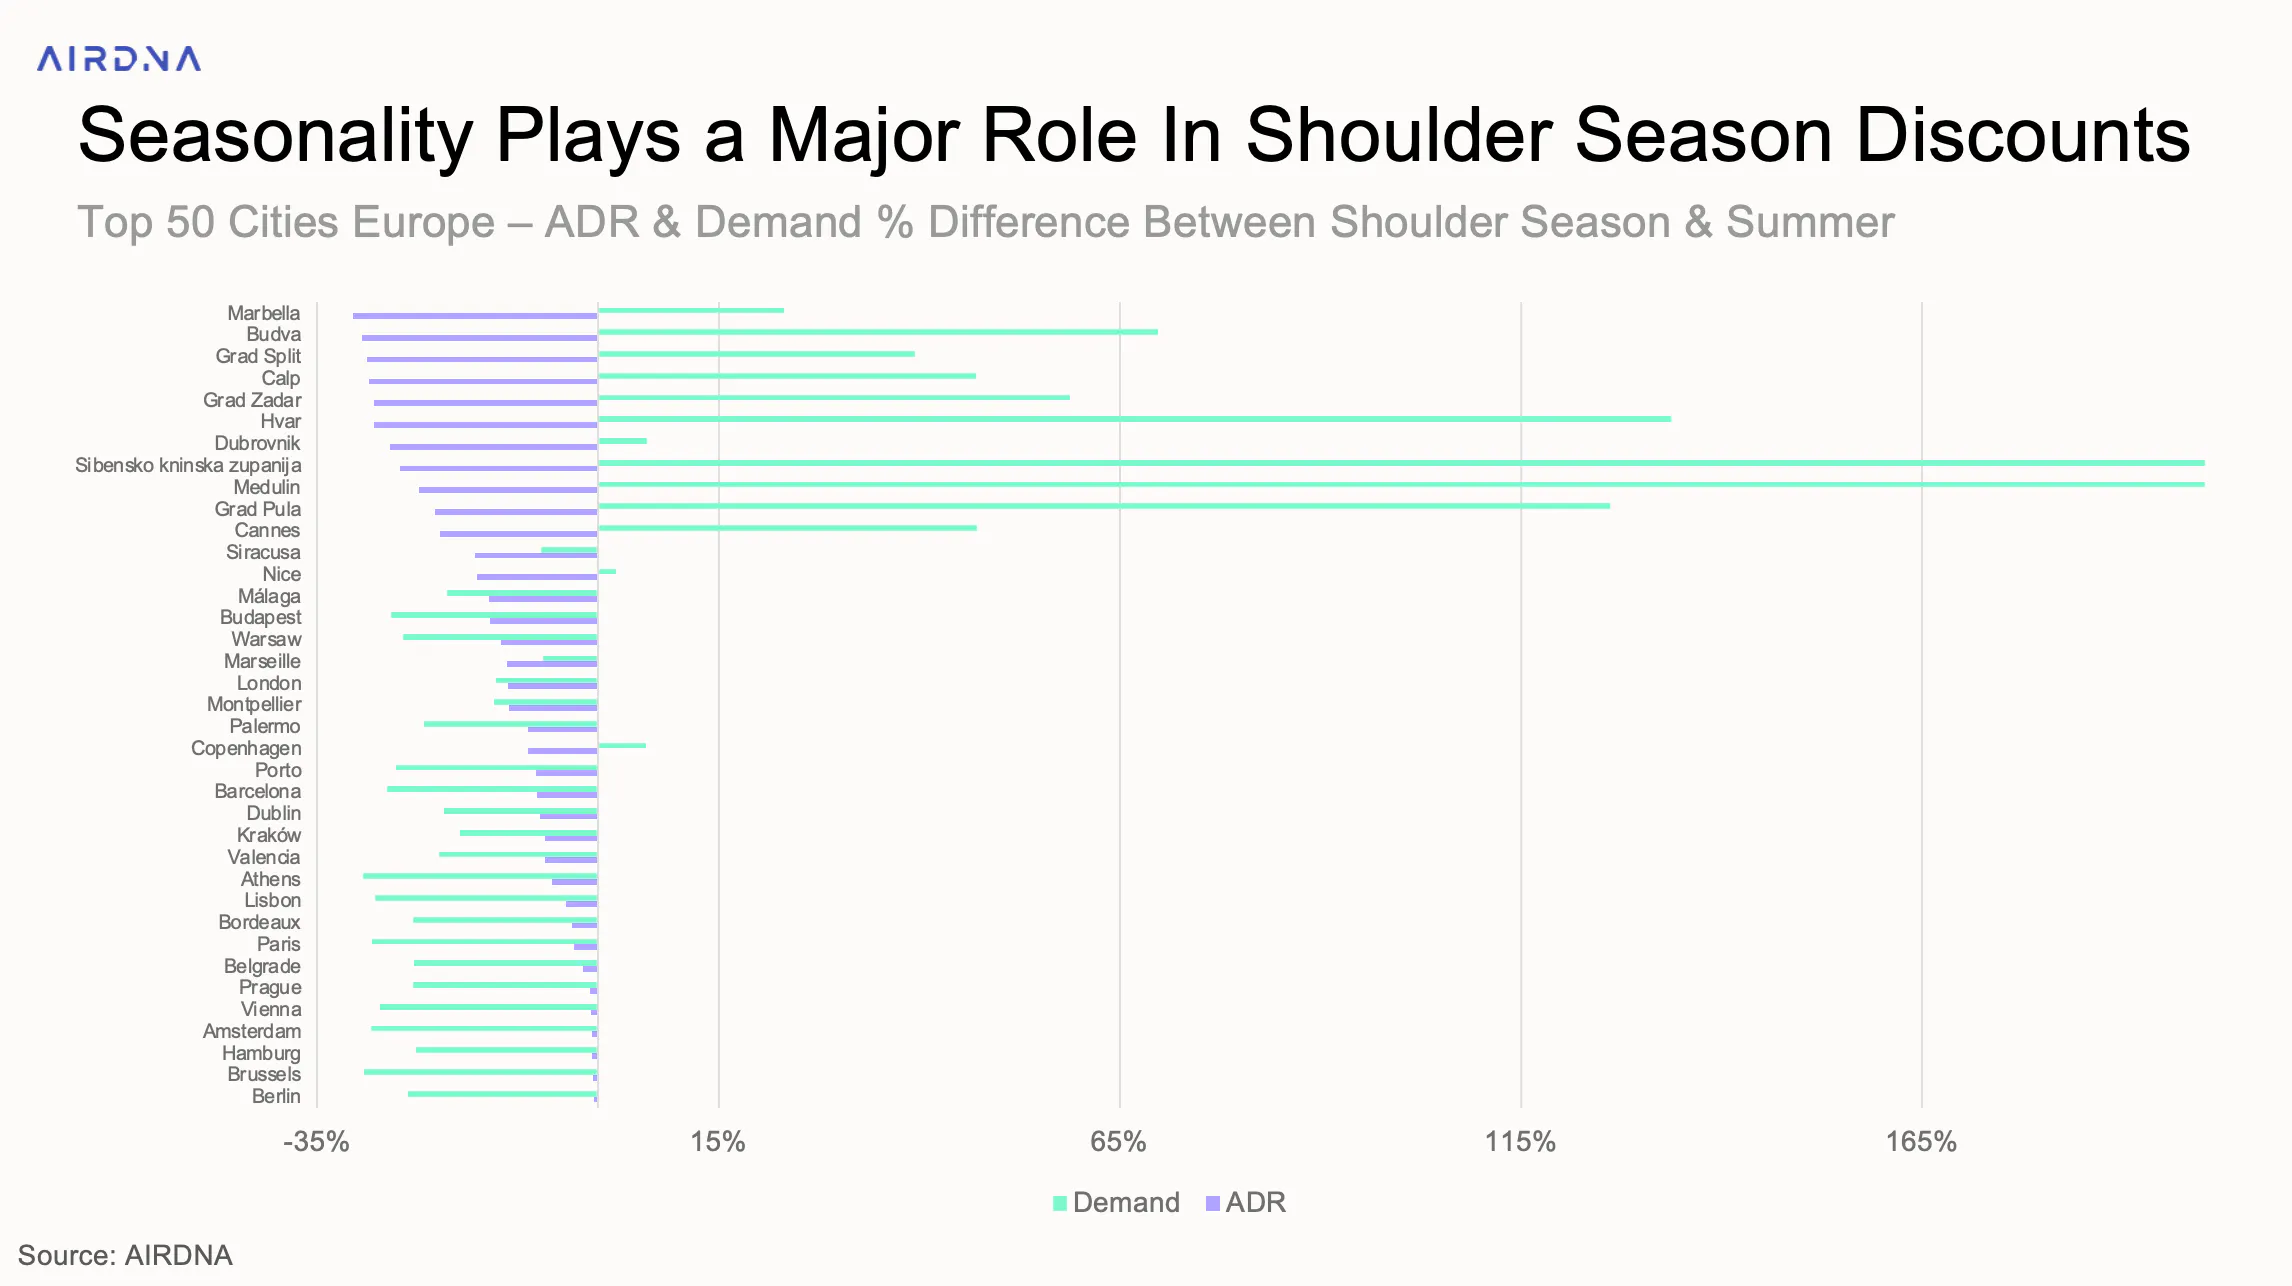
With more travel taking place during the shoulder season, a growing number of travellers are opting for off-season trips to benefit from lower prices and reduced congestion. Even with this shift, coastal markets continue to offer notably discounted rates, while urban destinations and major markets with strong year-round demand see only minimal changes in ADR.
At a Glance: January 2026 STR Performance in Europe
- Available listings reached 3.4 million, an increase of 3.5% YoY
- Demand Nights declined by 3% YoY to a Total of 25 million
- Average daily rates (ADR) decreased slightly by 0.6% YoY to €117
- Average occupancy rate declined to 42%, down 4.1% YoY
- Revenue per Available Rental Night (RevPAR) decreased by 4.7% YoY to €50
January 2026 saw occupancy decline as supply rose and demand fell across Europe. ADR also slipped, despite continued growth in RRI. Performance across the top 20 countries remained mixed, with only some converting demand into higher RevPAR.

The State of the European Economy
After a year marked by political uncertainty, tariffs, and broader economic pressure, 2026 began without a clear, positive shift in outlook. Despite this, growth persisted at a moderate pace, with Euro Area GDP increasing by 1.5% and EU GDP by 1.6%. Inflation remained stable at 2.1% in the Euro Area and 2.45% in the EU, close to the ECB’s medium-term target of 2%. Unemployment also remained stable, at 6.3% in the Euro Area and 6% in the EU, with only minor fluctuations over the year.
Looking ahead, the European Central Bank’s Survey of Professional Forecasters expects inflation to remain stable, projected at 1.8% for 2026 and 2% for 2027. Real GDP is forecast to grow 1.2% in 2026, slightly below 2025 levels, before rising to 1.4% in 2027. This reflects a 0.1% upward revision from the previous survey, driven by stronger-than-expected GDP in Q3 2025. Unemployment is expected to remain stable at 6.3%, before easing slightly to 6.2% in 2027.
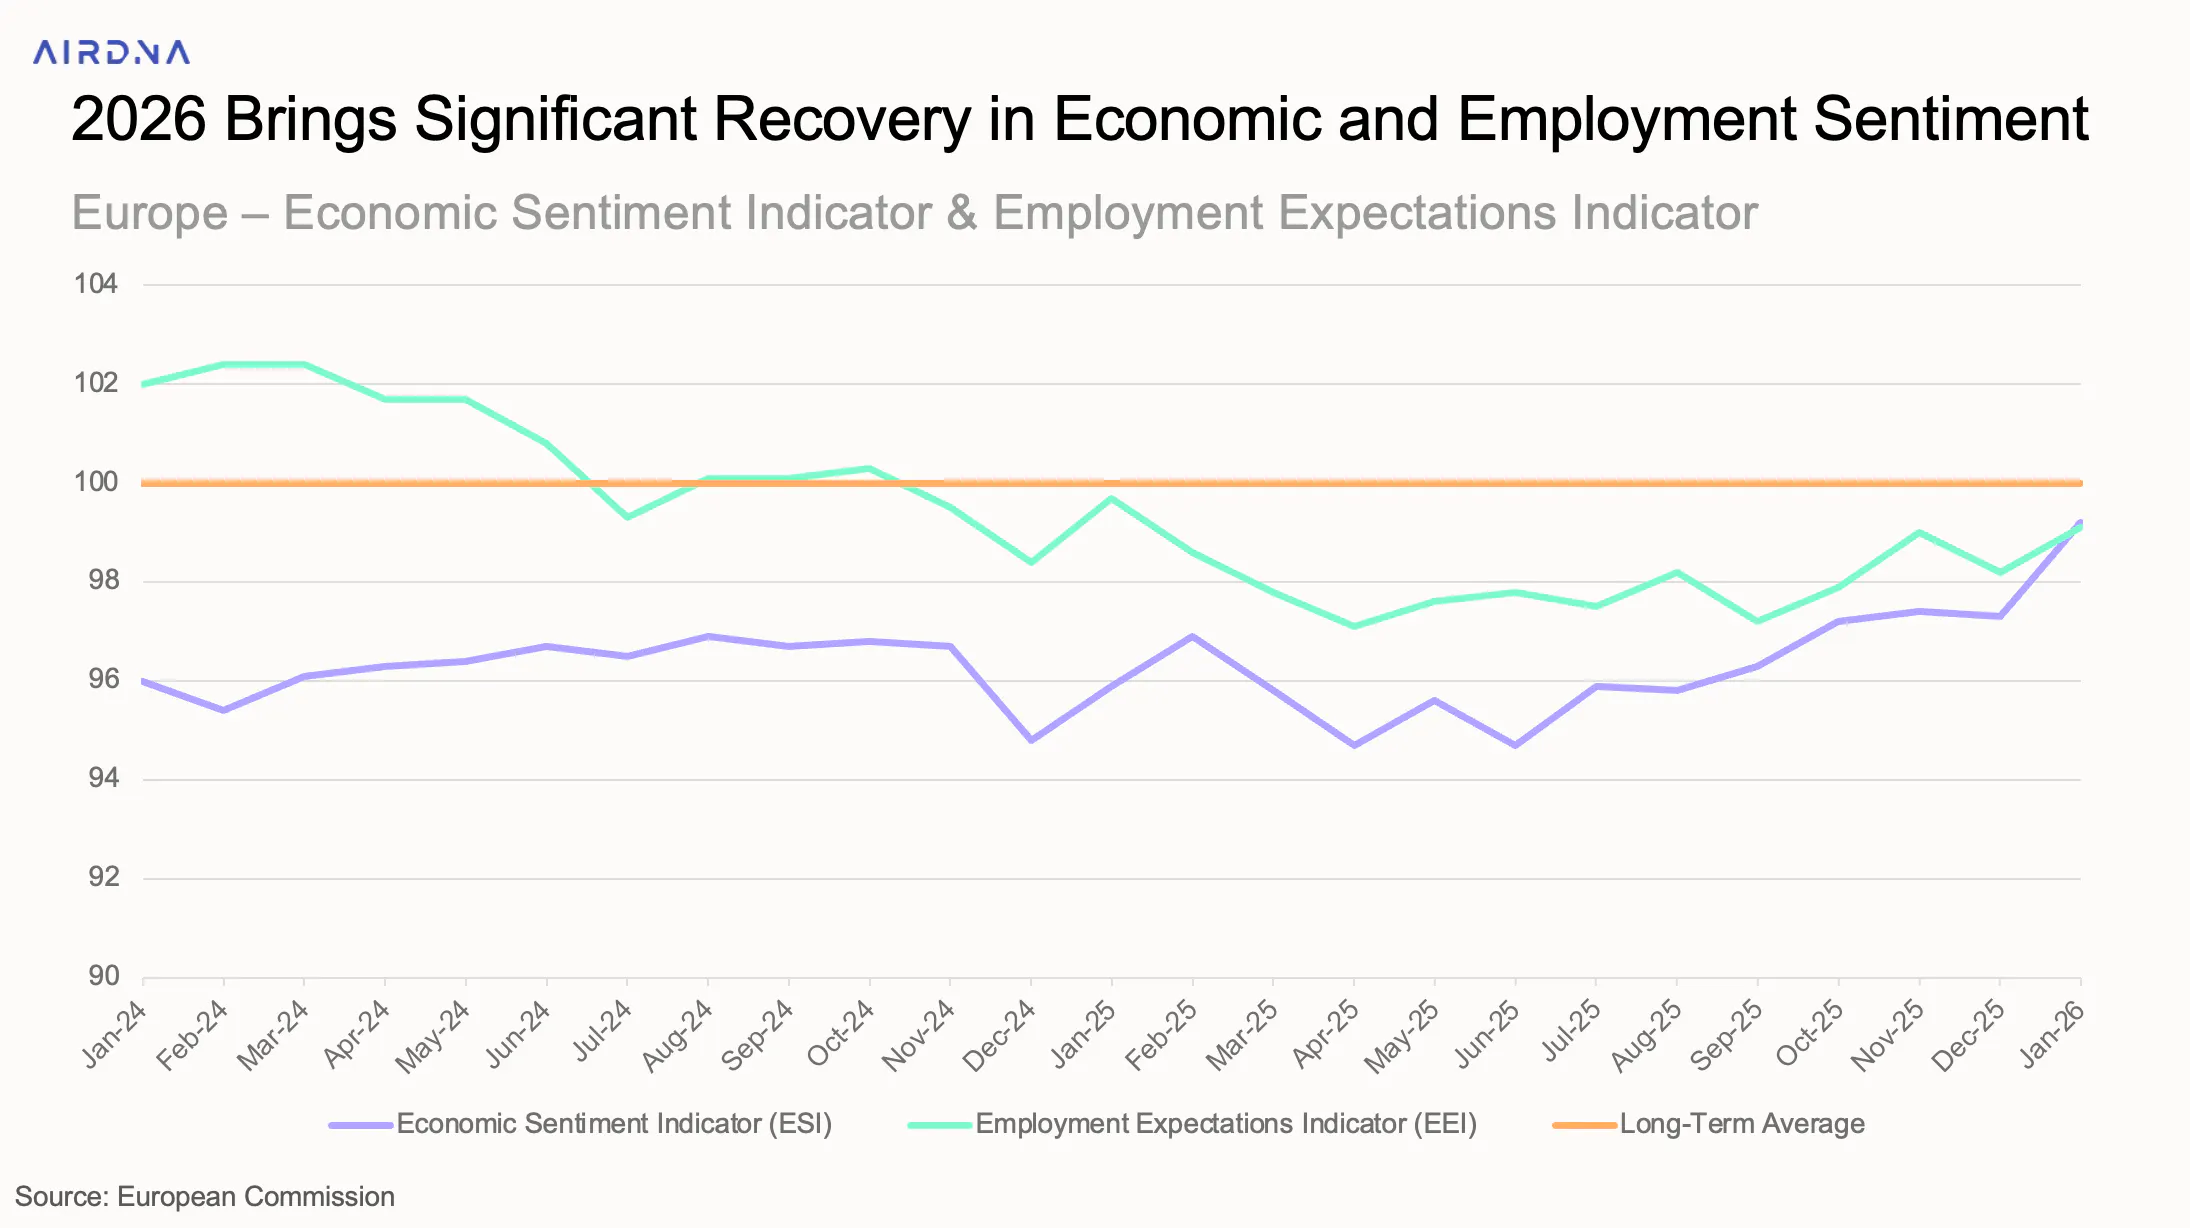
With relative stability expected in 2026, both the Economic Sentiment Indicator and the Employment Expectations Indicator improved in January. While both remain below their long-term averages and still lower than 2024 levels, they recorded year-over-year increases. The Economic Sentiment Indicator rose 5%, suggesting improving confidence and a greater willingness to spend on travel.
New Listings See Year-Over-Year Growth
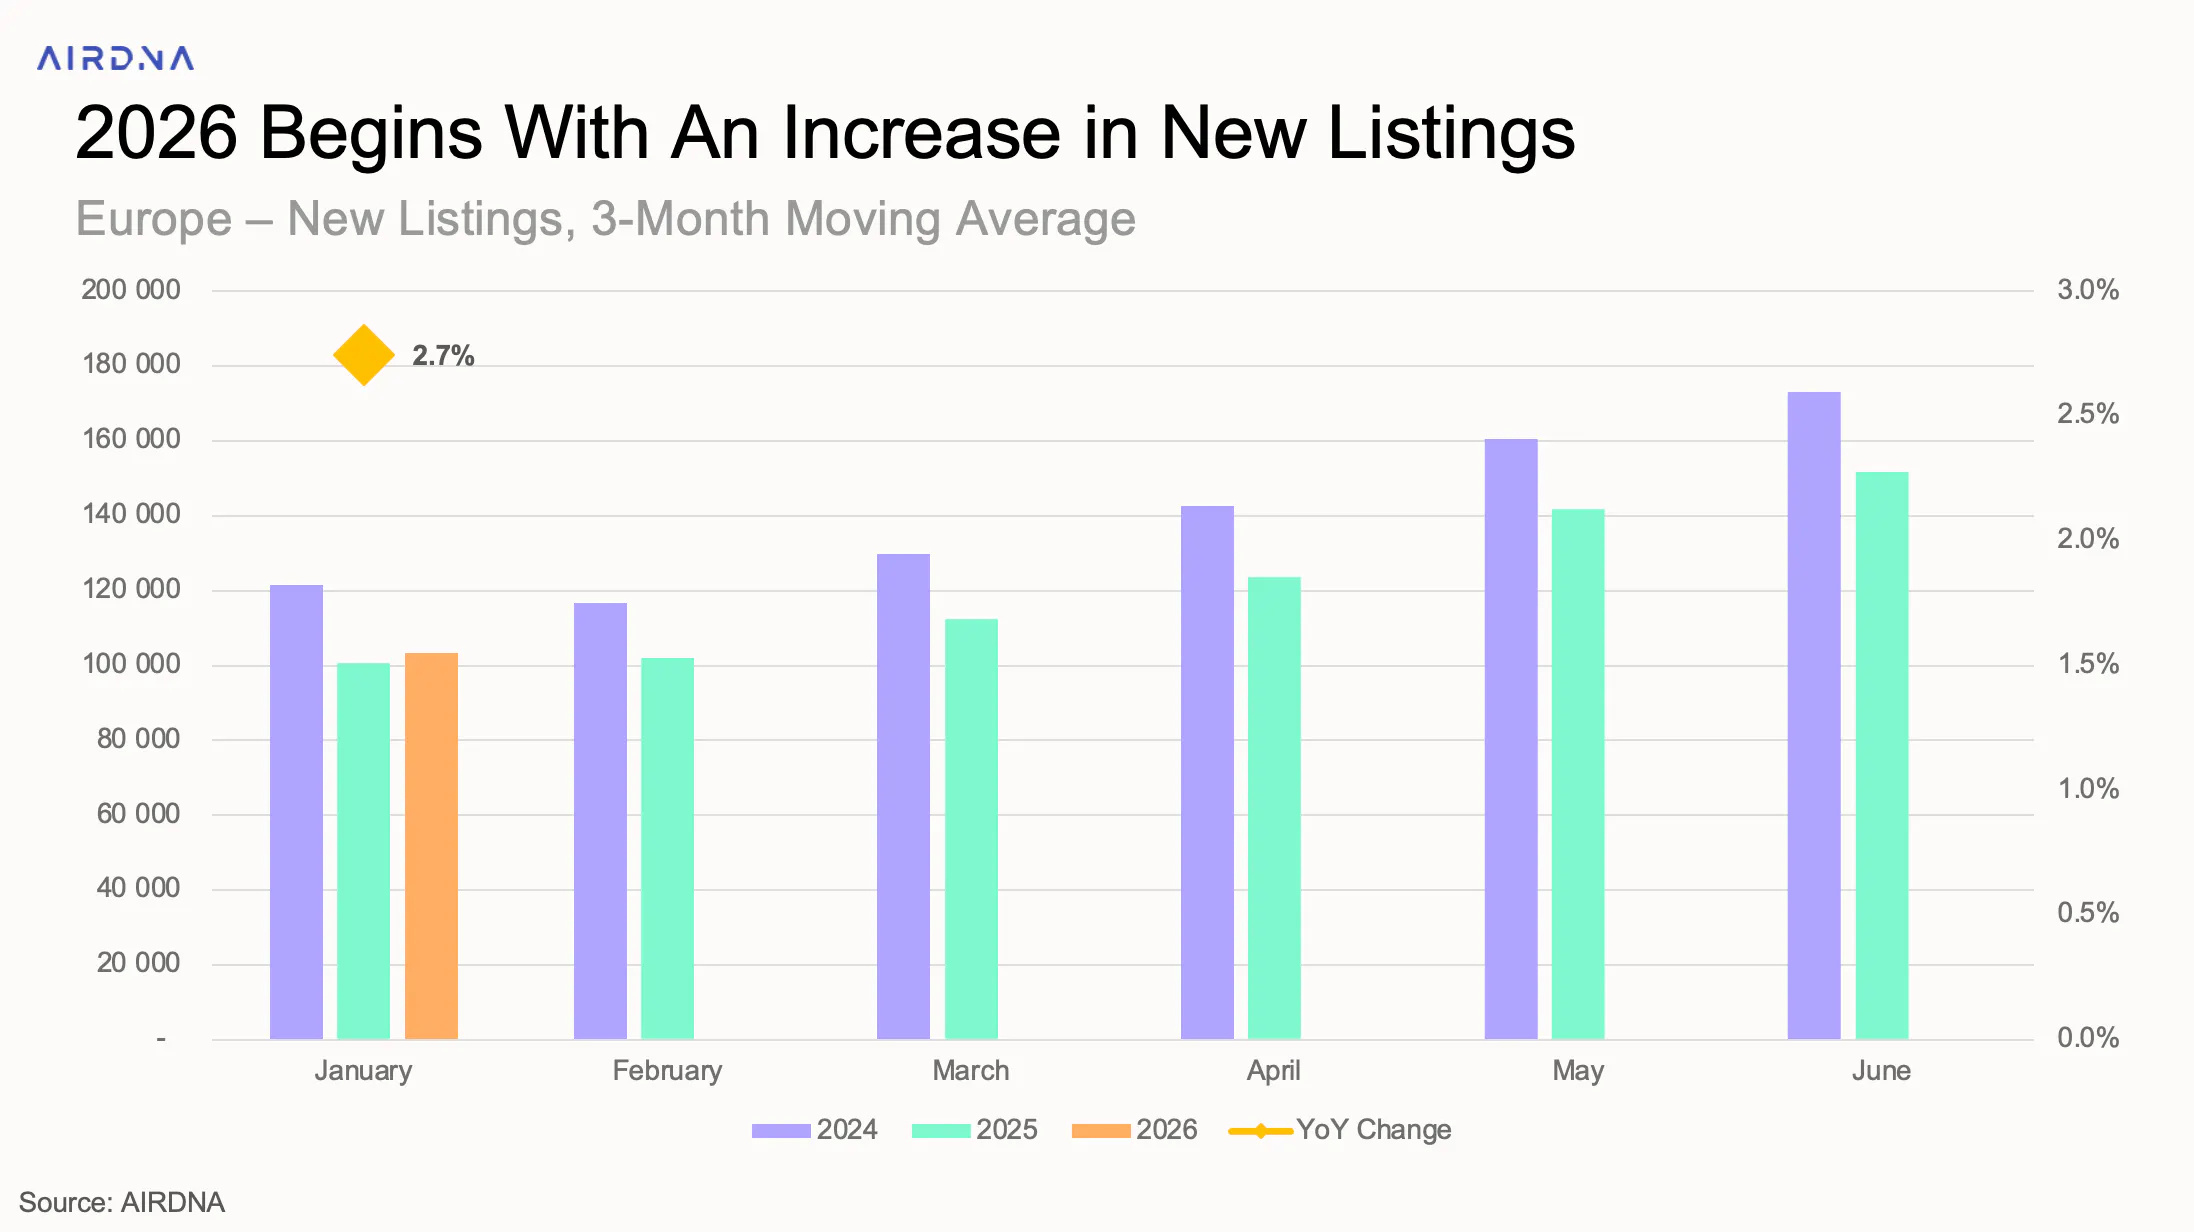
New listings, which track properties entering the market for the first time, slowed significantly in 2025, following the strong supply expansion that defined 2024. In January 2026, however, new listings returned to growth, rising 2.7% year-over-year. While this increase is partly supported by a lower comparison point and a broader slowdown in supply growth across Europe, it may also signal stabilizing listing growth.
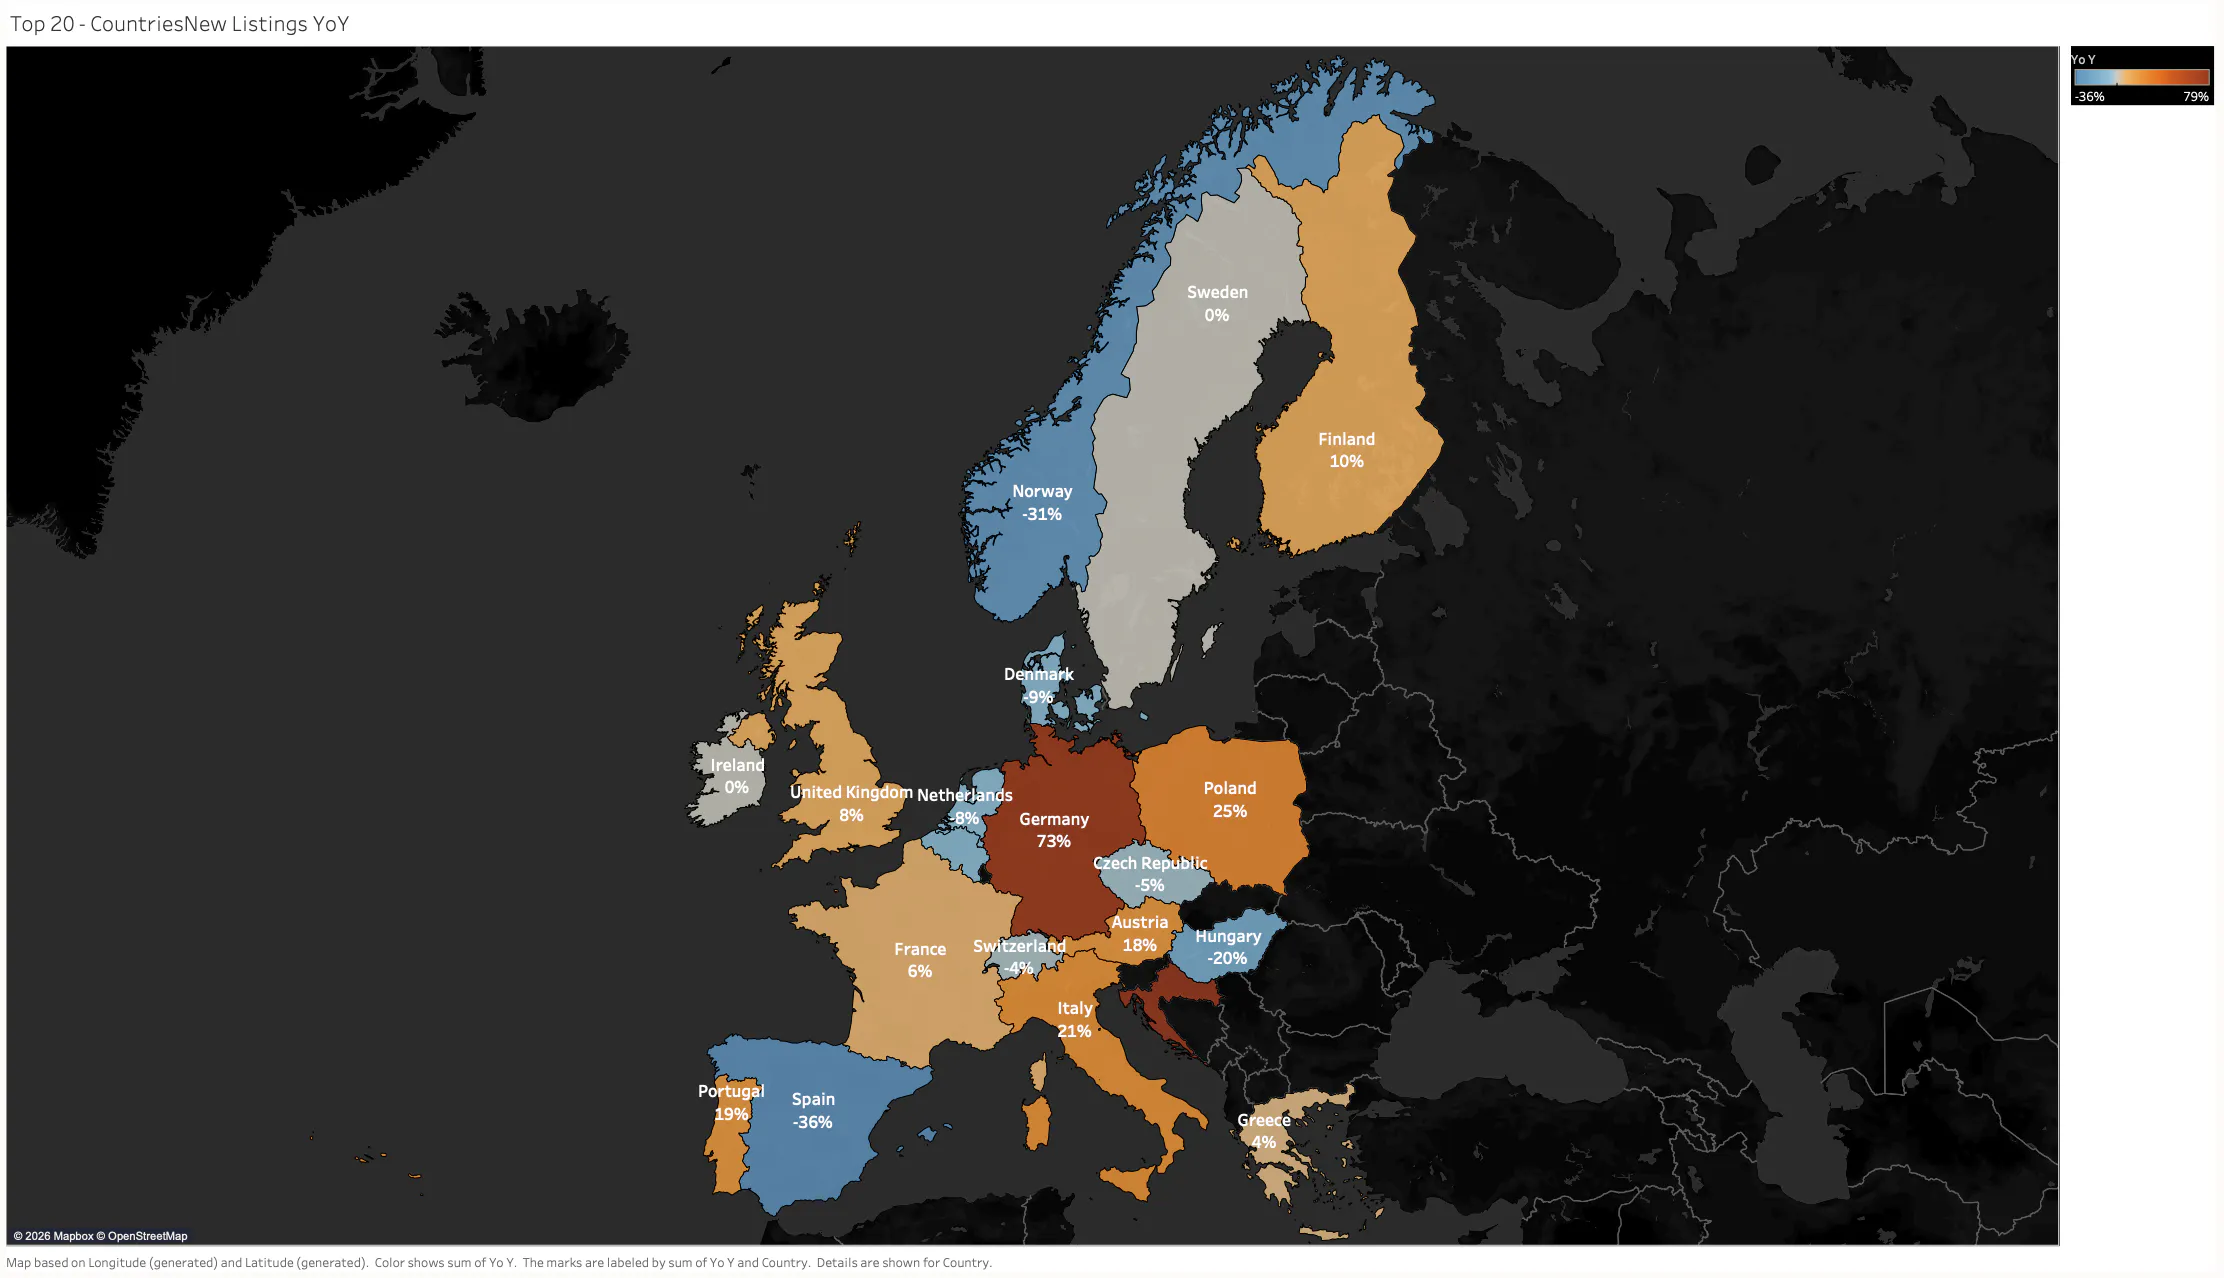
Looking at Europe’s top 20 countries, there are clear contrasts. The strongest growth in new listings came from:
- Croatia (79%)
- Germany (73%)
- Italy (21%)
Although January accounted for just 7.4% of total new listings in 2025, several trends stand out. Croatia recorded a sharp rise in new listings despite a weaker 2025, with declines in both available listings and demand nights, suggesting continued market confidence in an otherwise uncertain year.
Germany continues its growth trend, supported by a 9.6% increase in available listings in 2025, and looks set to maintain that momentum with strong new-listing growth in January.
Italy also saw an increase in new listings ahead of the Winter Olympics, as hosts position themselves to benefit from rising demand and ADR. This trend is particularly pronounced in Milan, where new listings doubled and accounted for 10% of Italy’s total new listings in January.
By contrast, the following countries saw declines in new listings in January:
- Spain (-36%)
- Norway (-21%)
In Spain, available listings fell by 2.2% in 2025 following regulatory action targeting non-compliant properties. From August onwards, tens of thousands of listings were removed, leading to an average 8% drop in available supply. This is a trend that has continued into 2026 and contributed to the sharp decline in new listings in January.
Norway, meanwhile, saw strong supply growth in 2025, with available listings rising 17.4%. The January 2026 decline likely reflects a high comparison base rather than a structural slowdown, with more moderate growth expected this year.
Demand Nights & Nights Booked
While total demand nights in Europe increased by 4.4% year-over-year (YoY) in 2025, recent data shows a slowdown through the second half of the year. That trend has continued into 2026, with January marking the fifth consecutive month of decline, as demand nights fell 3% YoY.
This stands in clear contrast to January 2025, which saw double-digit growth in both demand nights and bookings. It’s also weaker than early 2024, which recorded mid-single-digit growth.
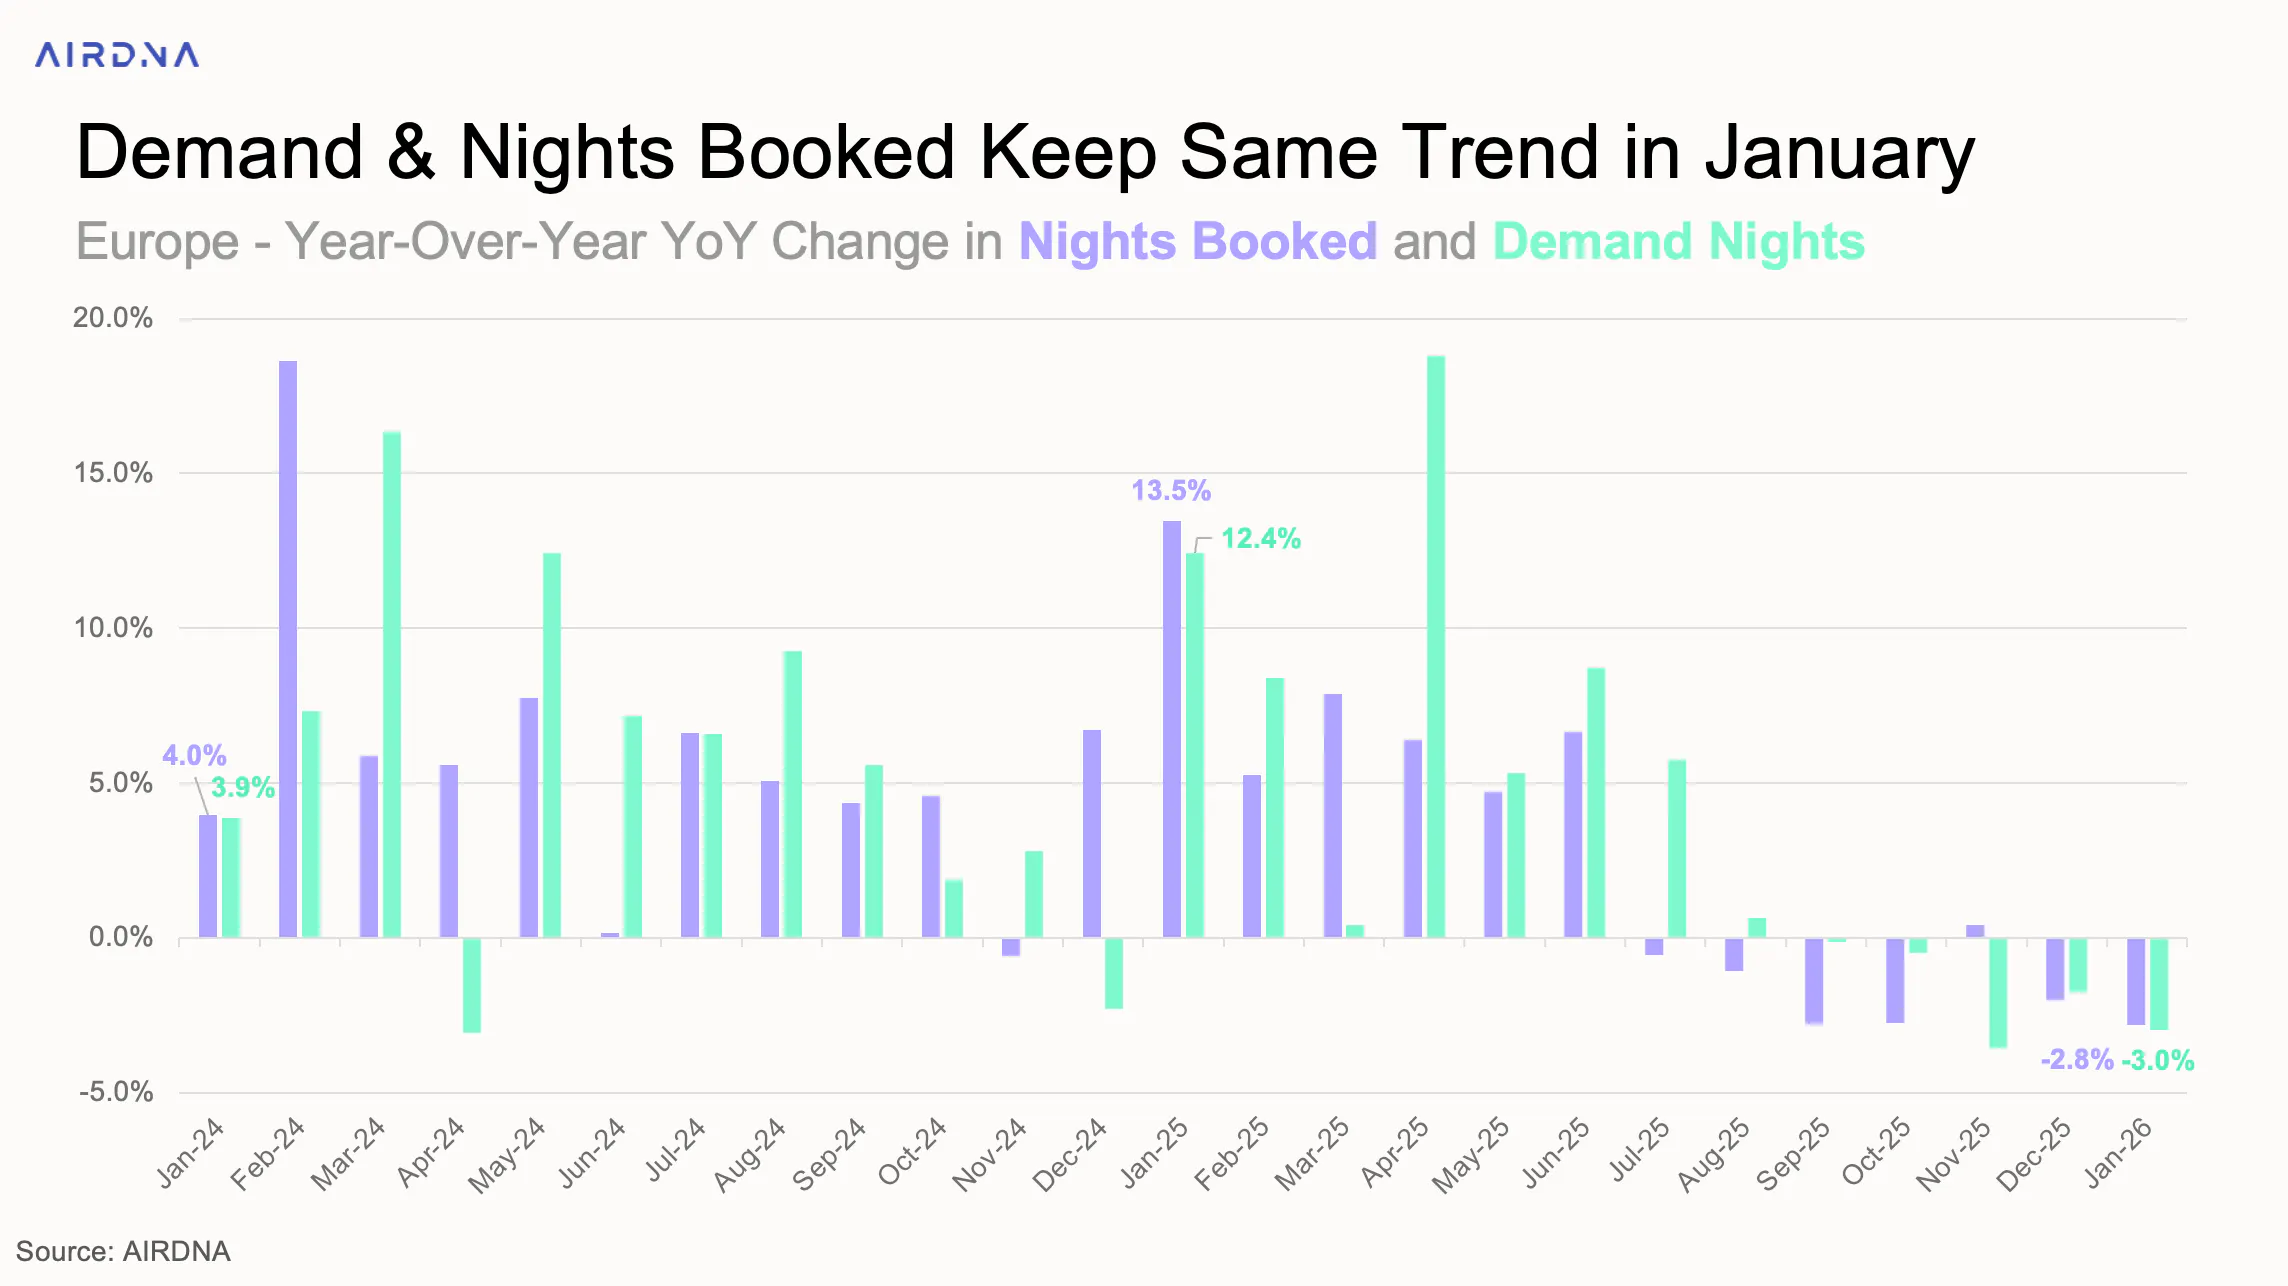
Nights booked in January, which include reservations made during the reporting month for stays in current or future months, also declined by 2.8% YoY. The decline is more pronounced among the five largest European markets (France, Germany, Italy, Spain, and the United Kingdom), with nights booked down 3.8% and demand nights down 3.9%.
Although January accounts for just 5.5% of total annual demand, it plays an important role in setting the pace for the year ahead. In a typical year, nearly 10% of all annual nights are booked in January, making it the single largest booking month.
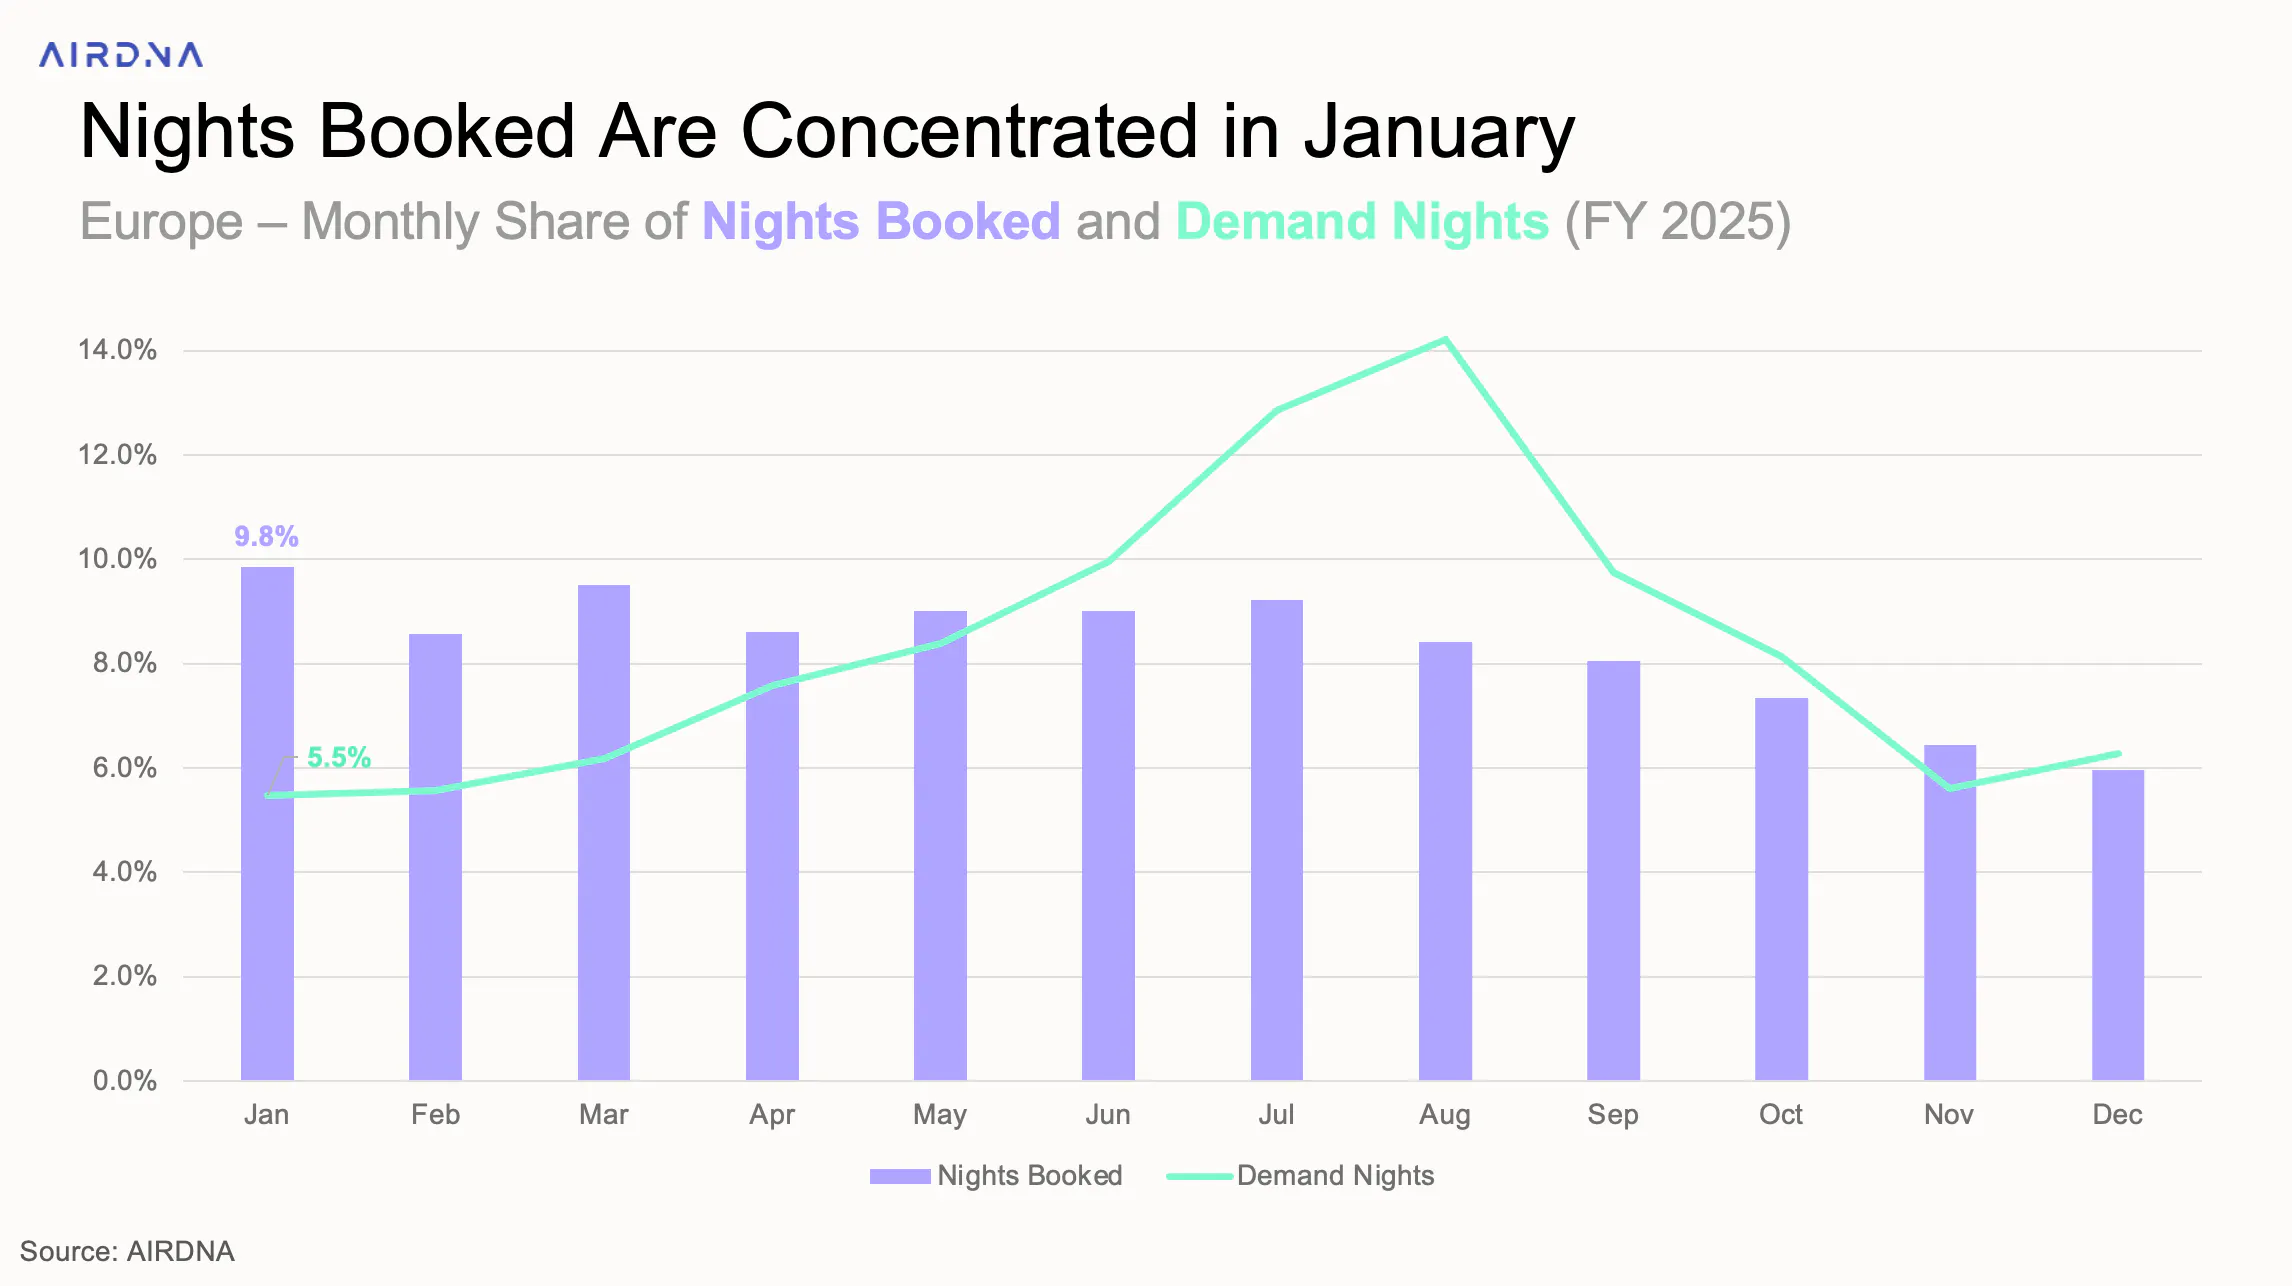
Shorter booking windows and a growing preference for last-minute deals and off-season travel are likely influencing this trend. Rather than signalling structural weakness, the pattern more closely resembles 2024, when 45% of bookings occurred between May and September and January accounted for 9% of annual bookings, slightly below the 9.8% share recorded in 2025.
Supply Growth Drives Occupancy Declines
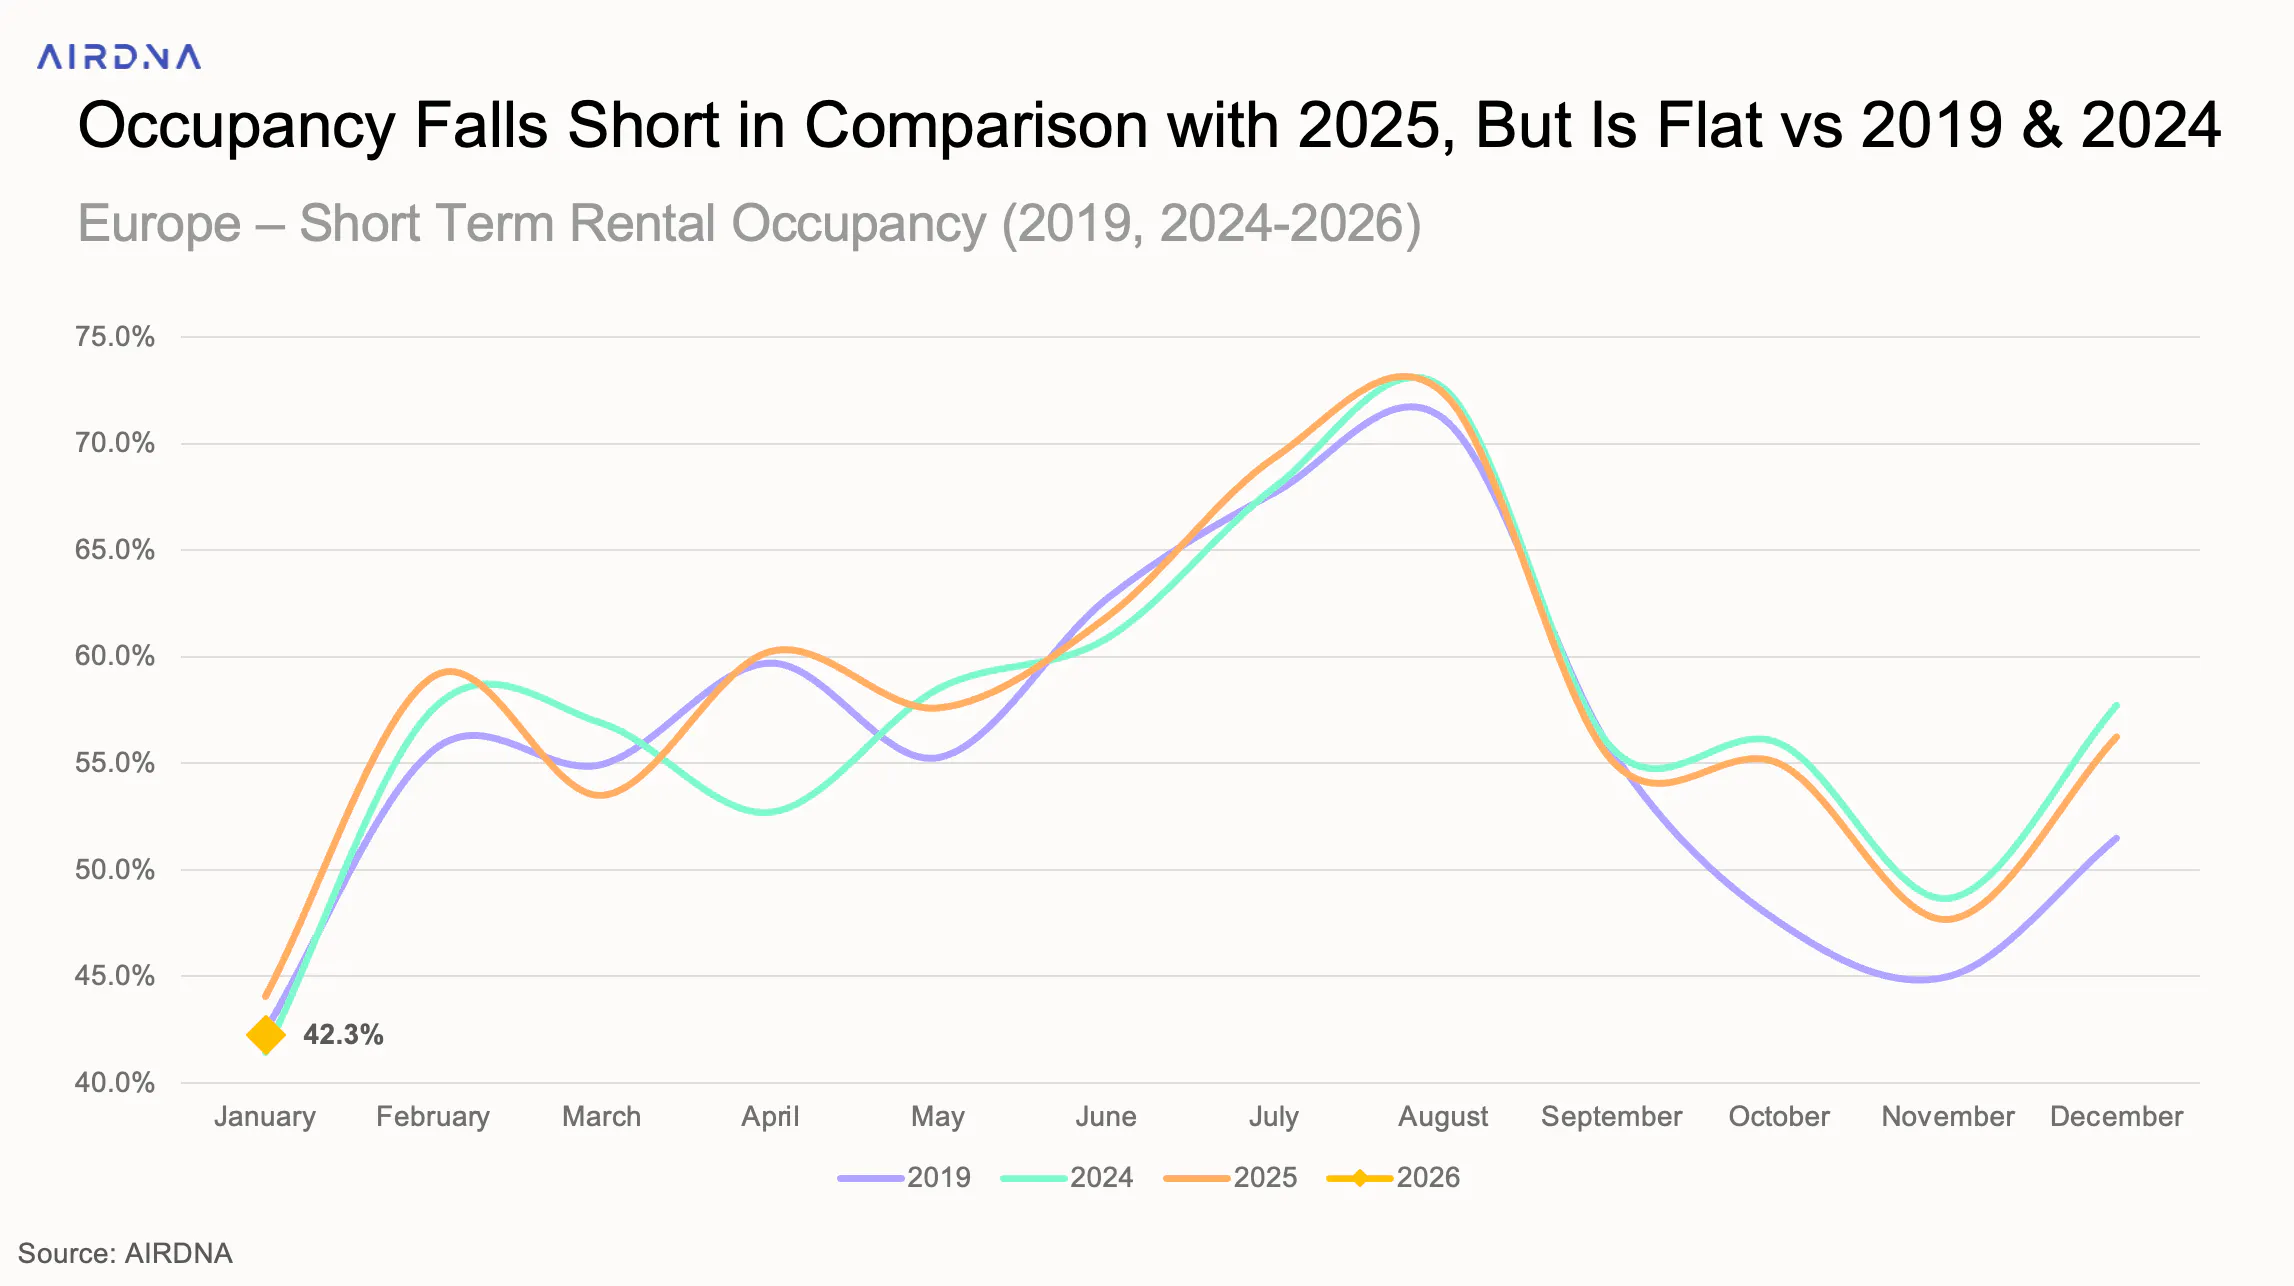
As available listings increased across Europe and demand declined, overall occupancy fell 4.1% to 42% in January. While January is typically the lowest occupancy point of the year, the 42% rate is below 2025’s 44% and aligns more closely with 2019 and 2024. This suggests 2025 was an unusually strong year, with 2026 returning to a more typical pattern.
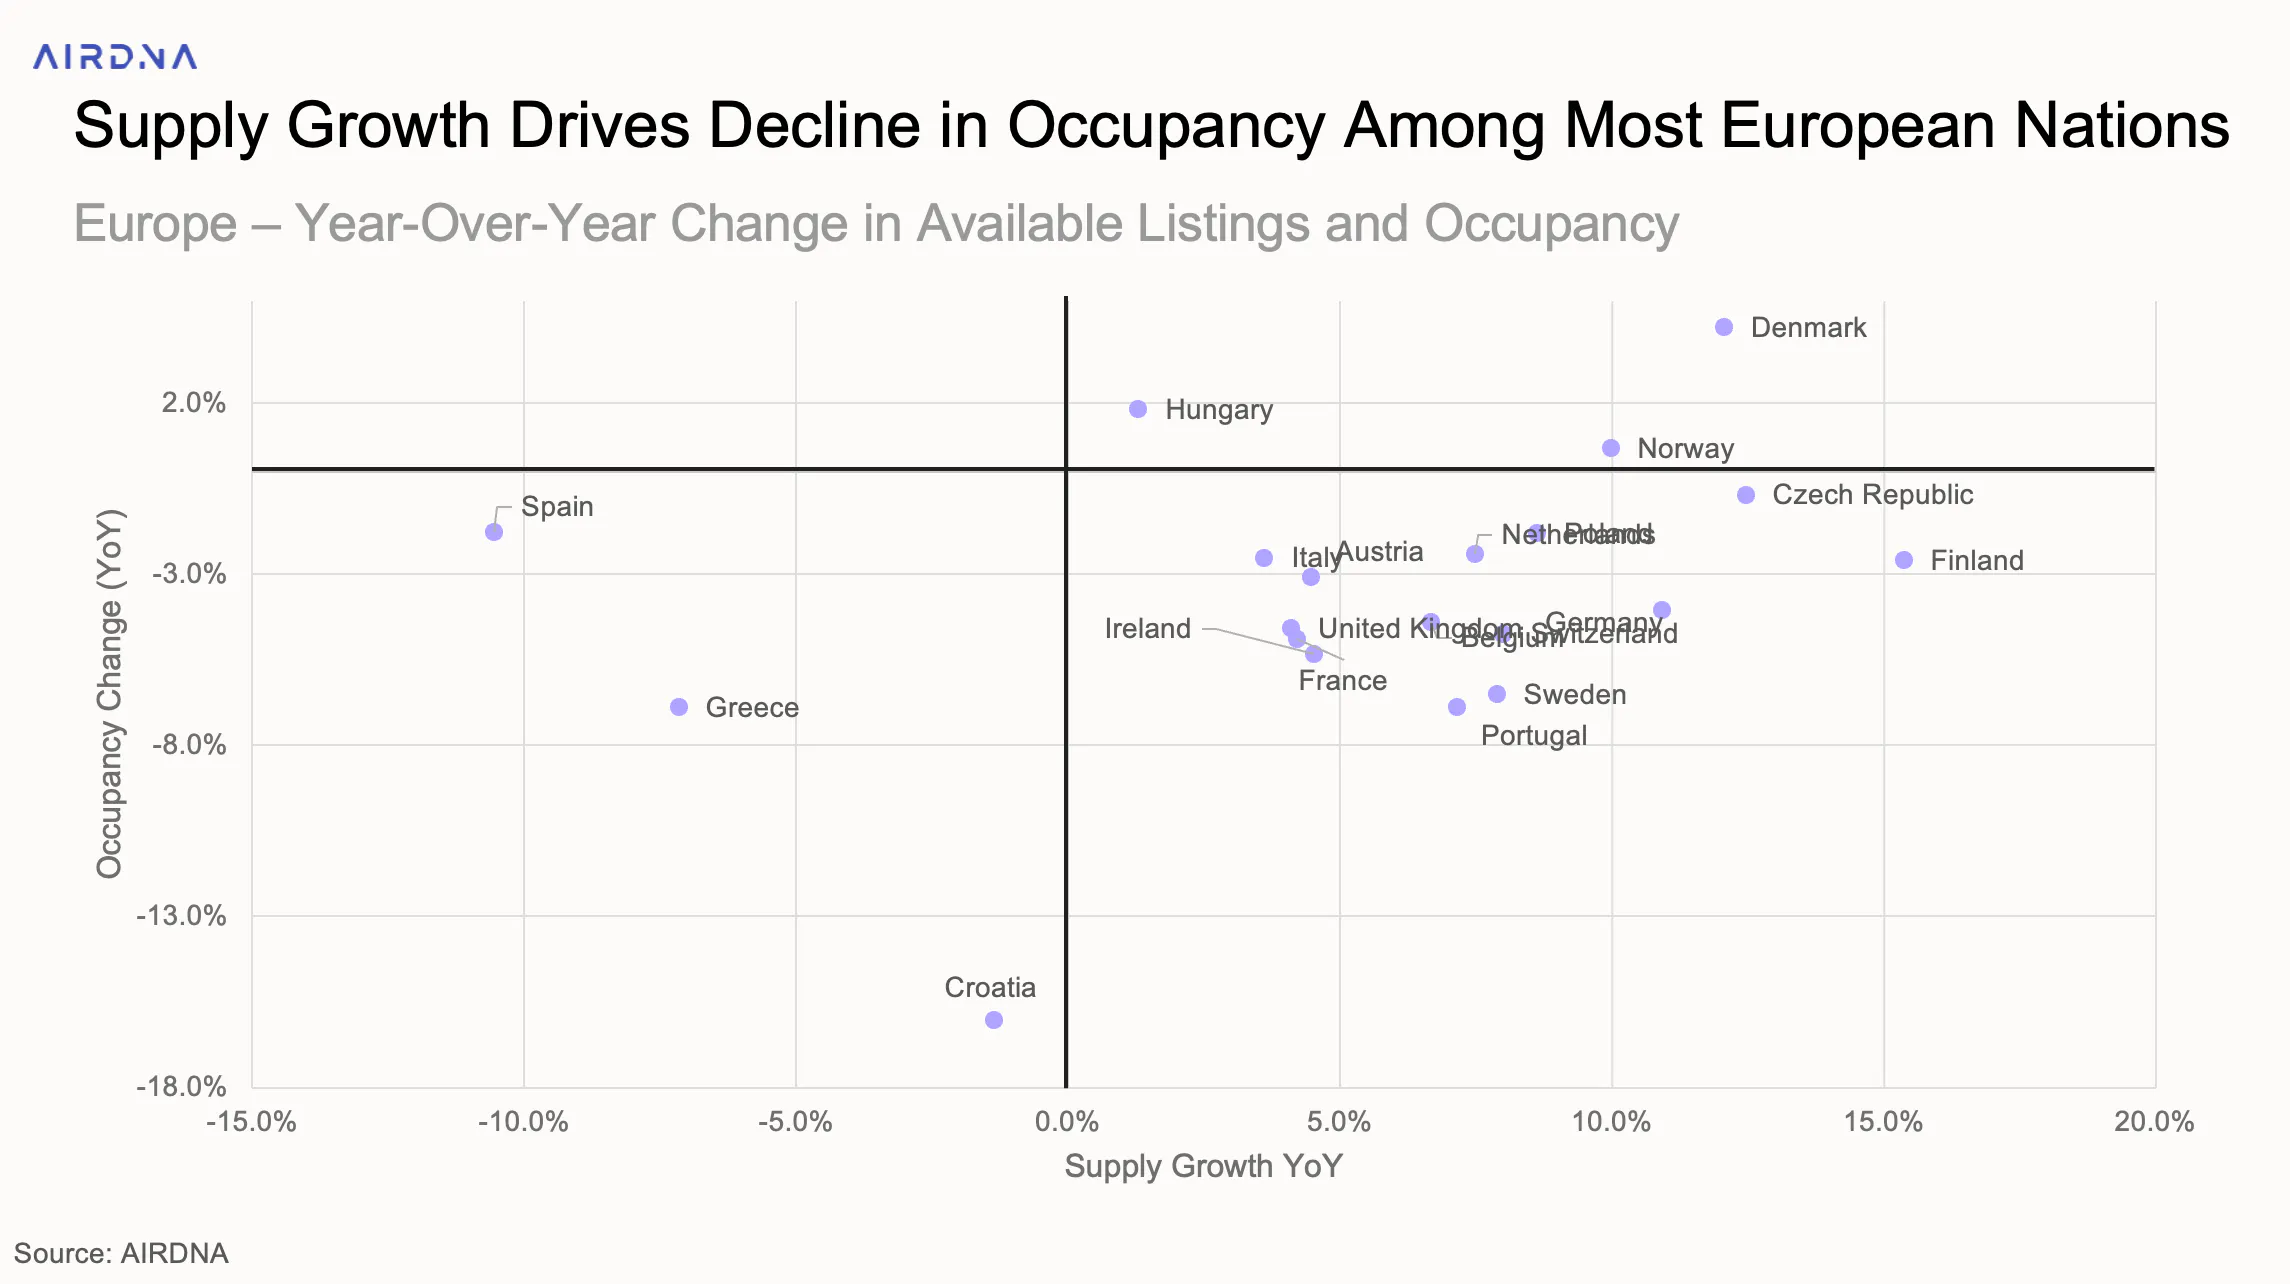
Across Europe’s top 20 markets, 17 countries recorded declines in occupancy, with only Denmark (+4.2%), Hungary (+1.8%), and Norway (+0.7%) posting year-over-year occupancy gains.
In Denmark (+8%) and Norway (+10.8%), demand growth outpaced supply increases, supporting higher occupancy. Hungary saw minimal supply growth and stable demand, but a reduction in active listing nights during the off-season kept occupancy flat overall.
Most countries fall into a clear pattern: supply growth outpaced demand, leading to occupancy declines. Across the continent, demand nights fell in 15 of the top 20 countries, with a 3% year-over-year drop overall.
A few markets stand out. Spain (-1.8%), Greece (-6.9%), and Croatia (-16%) all recorded occupancy declines despite falling supply. In Spain, ongoing regulation led to a 10.6% drop in available listings in January. Demand also fell 8.5%, keeping occupancy declines relatively moderate. Greece followed a similar pattern, with reduced supply cushioning the impact of a 10% decline in demand nights.
Croatia saw the sharpest occupancy drop, driven by a 22% decline in demand nights. Major destinations such as Dubrovnik (-27%), Split (-38%), and Zagreb (-6%) all recorded steep declines. While January is typically the low season, Croatia’s demand slowdown extends beyond seasonality. Full-year demand in 2025 was down 7% YoY.
RRI Continues Growing as ADR Remains Flat
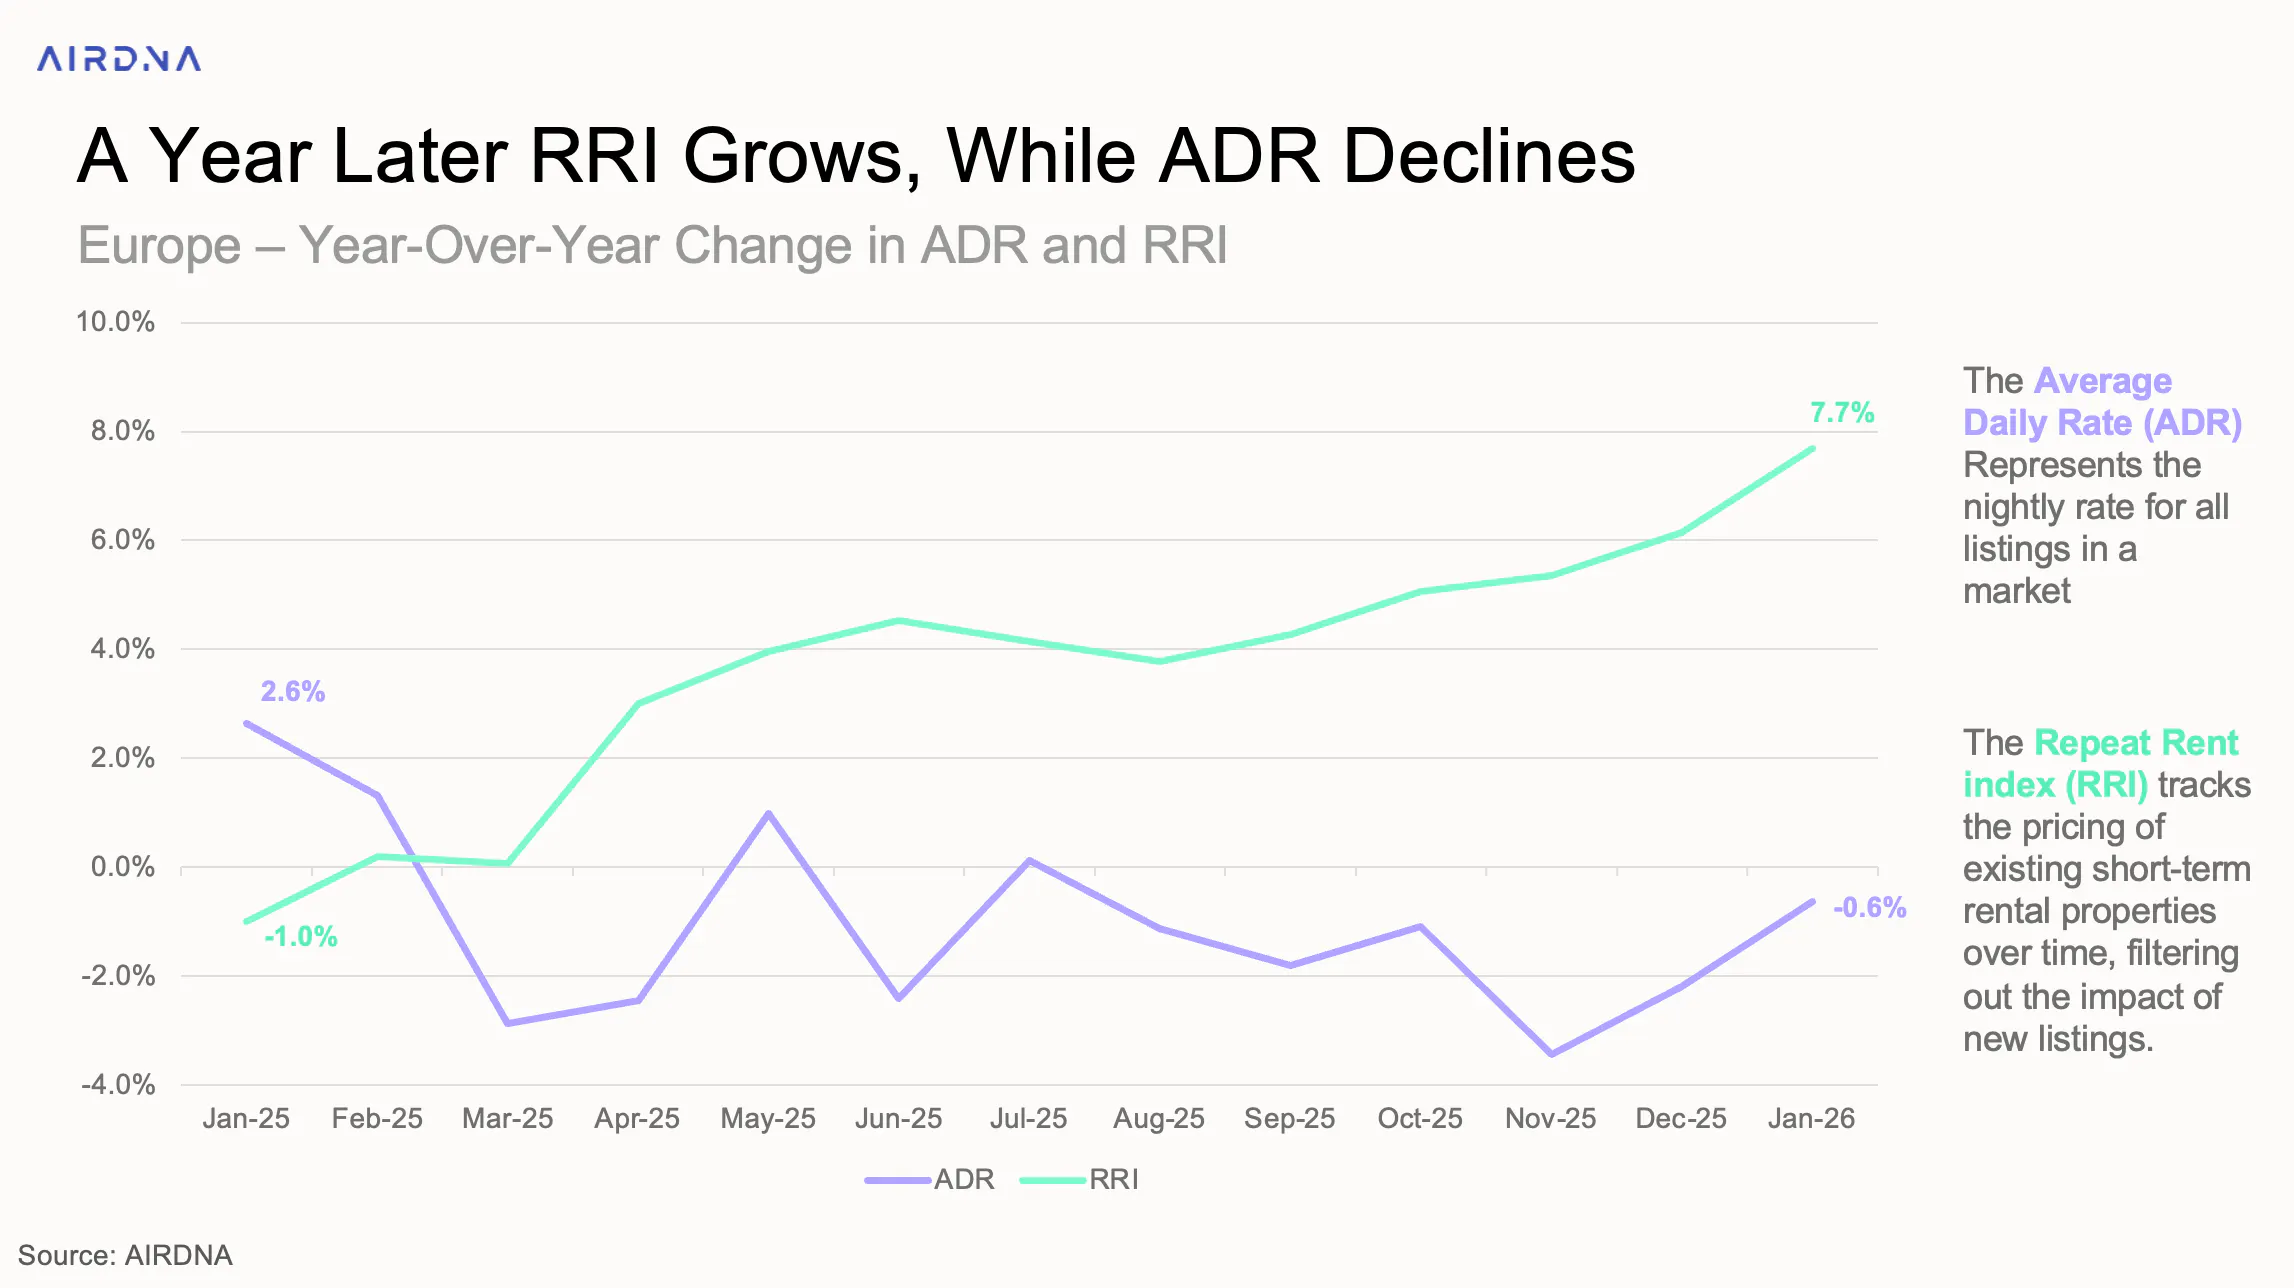
Average daily rates (ADR) in Europe declined slightly, falling 0.6% year-over-year. This is a smaller drop than in previous months, when ADR had been down by an average of 1.9% between August and December. As a result, Europe’s ADR now stands at €117.
Despite this modest decline, the Repeat Rent Index (RRI), which tracks pricing changes among existing operators and excludes the impact of new listings, presents a more positive picture. RRI has continued to rise since April 2025 and reached 7.7% year-over-year growth in January, the highest level since October 2024.
Over the past year, ADR and RRI have moved in different directions. While ADR shifted from growth to decline between January 2025 and January 2026, RRI recovered from a slower start in early 2025 and has maintained steady year-over-year growth.
This gap suggests that existing listings, particularly in premium segments such as ski markets, are driving price growth, rather than new supply entering the market. It also reflects the impact of recent regulations that have removed lower-priced listings from the market.
Performance Was Mixed Among the Top 20 European Nations
With ADR largely flat and occupancy down 4.1% across Europe, performance among the top 20 countries was mixed. Only five countries recorded RevPAR growth.
Northern markets led the gains. The following countries all saw RevPAR increases driven primarily by ADR growth:
- Denmark (+7.8%)
- Finland (+7.2%)
- Norway (+5.4%)
Finland stood out, with ADR rising 10% despite a 2.6% decline in occupancy, still delivering overall RevPAR growth.
The only other countries to post gains were Hungary and the Czech Republic. Hungary’s growth came from higher occupancy with stable pricing. The Czech Republic saw RevPAR increase mainly due to a 1.5% rise in ADR, despite a 0.7% drop in occupancy.
Across most other markets, the pattern is clear: declining occupancy is putting pressure on pricing and pulling RevPAR down. This is particularly evident in larger markets such as Germany, France, and the United Kingdom, where falling occupancy has been the primary driver of weaker performance.
Spain stands out among the major markets, with RevPAR holding steady year-over-year. A sharp reduction in supply, driven by the removal of lower-priced listings, allowed remaining operators to raise ADR enough to offset occupancy declines.
At the other end of the spectrum, Croatia underperformed significantly, with declines in ADR, occupancy, and RevPAR (-28%), alongside a 22% drop in demand nights. After peaking in 2023, the Croatian market appears to be entering a period of correction as competing destinations such as Greece and Albania attract more demand.
Seasonality & Shoulder Season Discounts
Travel during Europe’s shoulder season has grown in recent years. While demand remains highest in summer, it is now spread more evenly throughout the year. With baby boomers retiring, more flexible work patterns, and rising summer temperatures and crowds, many travelers are choosing to visit outside peak season in search of lower prices and fewer visitors.
To identify where travellers can find the largest shoulder season discounts, we analysed 2025 data across the top 50 European markets, comparing ADR and demand in the summer months (June to August) with shoulder season periods (April to May and September to October).
The results show a clear pattern. Markets with the largest ADR drops between shoulder season and summer also see the biggest spikes in demand during peak season. These tend to be coastal and highly seasonal destinations, where pricing and occupancy are closely tied to summer travel.
By contrast, large urban markets show much smaller seasonal price variation. Strong year-round demand reduces the need for deep discounts, keeping ADR relatively stable throughout the year. Even so, these cities still see some softening in summer, as travellers shift toward coastal and mountain destinations or adjust travel dates to avoid peak periods and extreme heat.
ARTICLE SUMMARY
In this January 2026, European supply continued to grow while demand softened, leading to lower occupancy across the continent. Despite flat ADR, RRI remains strong, pointing to pricing resilience among existing operators as travelers shift toward off-season and last-minute booking behavior.
Camilo Schmid Rivas
Senior Research Analyst
Camilo Schmid Rivas is a Senior Research Analyst at AirDNA who brings a uniquely well-rounded perspective to short-term rental analytics. With a background that spans investment, real estate, and business analysis—including roles at Stayery and Sollers Consulting—Camilo has worn many analyst hats, each sharpening his ability to turn complex data into clear, actionable insights. A graduate of École hôtelière de Lausanne, he now channels his multidisciplinary expertise into uncovering trends that drive smarter STR decisions. In his free time, he enjoys playing tennis or scuba diving in or around Barcelona.
