Calculate Revenue
 Research Markets
 Find For Sale Properties
 Compare My Listing
 STR Revenue Calculator
 Custom Comp Sets
 Submarket Insights
 Custom Search Filters
 Rate Recommendations
 Performance Benchmarking
 Competitor Comparison
 Owner Contact Details
 Property-level performance data
 Tourism Insights
 Real Estate Investment Analytics
 About Us
 Sales
 Support
 Press
U.S. Review March 2026: Demand Rebounds as Forward Bookings Signal Strong Summer Season
Published: April 21, 2026

Scott Sage
Key Takeaways:
- The U.S. STR market is beginning to stabilize as demand rebounds and supply growth levels off, with occupancy gradually improving despite remaining slightly below last year’s levels.
- Booking activity remains strong even as broader economic uncertainty persists, suggesting travelers are continuing to plan ahead while adjusting to shifting conditions.
- Forward pacing signals a stronger Q2, with Spring Break travel, summer seasonality, and major events like the World Cup driving increased demand in the months ahead.
March 2026 saw the U.S. short-term rental market begin to stabilize, with demand rebounding after a weaker start to the year and supply growth showing signs of leveling off. While occupancy remained slightly below last year’s levels, the gap has continued to narrow as booking activity improved and demand strengthened across most location types.
Much of this shift reflects a normalization in travel patterns following the volatility of late 2025, with demand becoming more responsive to seasonal drivers and external factors such as weather. At the same time, broader economic uncertainty, particularly rising inflation driven by energy prices, continues to weigh on consumer sentiment and may influence short-term travel decisions.
Despite these pressures, forward pacing points to a more positive outlook. Stronger bookings tied to Spring Break travel, major summer events, and the upcoming World Cup are already supporting demand growth into Q2. As a result, while near-term performance remains mixed, the underlying signals suggest a more stable and potentially stronger market in the months ahead.
At a Glance: Key U.S. STR Performance Metrics for March 2026
- Revenue per Available Rental (RevPAR) increased 2.3% year-over-year (YoY) to $165.14
- Available listings reached 1.68 million, a 3.3% increase YoY
- Demand nights were up 2.0%
- Occupancy averaged 61.3%, down -0.3% YoY
- Average Daily Rates (ADR) climbed to $269.34, up 2.6% from last year
- The Repeat Rent Index (RRI) rose 5.1% YoY
- Total nights booked were up 5.2% from 2025
Economic Outlook
The continuing conflict in Iran dominated much of the economic discussion in March, with fears that disruptions to oil shipping could reignite inflation seeming to be borne out. Inflation, which had dropped to a relatively cool 2.4% in January and February, rose by nearly a full point to 3.3% in March. This dramatic swing, producing the highest inflation rate in nearly two years, was driven primarily by the food and energy segment, in particular gasoline. Still, core inflation, which strips out food and energy prices, also increased to 2.6%, up from 2.5% in February.
Inflation concerns have weighed heavily on consumers and markets since very high rates following supply chain disruptions post-Covid crimped budgets. In 2025, the Trump Administration’s “Liberation Day” tariff increases again pushed inflation higher, as international producers passed on significant portions of the tax burden to consumers. These effects were expected to be transitory and had largely passed by the beginning of March. Now, a new supply chain disruption in the Strait of Hormuz is again pushing inflation up.
While tax returns in 2026 reflected additional cuts and initially had stimulatory promise, these returns may eventually be consumed by higher prices instead. Currently, gasoline prices have increased, but over time additional price increases will pass through to goods from higher input costs such as raw materials, freight, and energy. Not only does the additional expense of inflation cause direct harm, but it also motivates the Federal Reserve to either delay additional rate cuts or, if inflation reaches a high enough threshold, begin raising rates again.
At the beginning of the year, AirDNA observed falling interest rates and predicted that declining mortgage rates would follow, creating a lift to STR investment and increasing supply. Since the end of February, when mortgage rates dipped slightly below 6% according to Freddie Mac, rates climbed quickly, ending March around 6.5%. These rates have since declined slightly, but the outlook for home sales and eventual STR listing growth has weakened. For existing operators, this means the moat around the market has widened somewhat and, barring significant deterioration in consumption, may help occupancy rates.
The labor market seems to be holding on for now, with 178,000 jobs added in March. Still, even this measure, which far outstripped most expectations, came with some caveats. The jobs report for February was revised down by approximately 40,000 jobs, and about 35,000 of March’s new jobs were from healthcare workers returning from a strike. The unemployment rate ticked down from 4.4% in February to 4.3% in March, but the labor force participation rate also declined slightly, from 62.0% in February to 61.9% in March. The labor market is reportedly tight, but real wages fell 0.6% in March. In short, the labor market hasn’t yet collapsed, but isn’t a source of comfort either.
Listing Growth Flattens as March Sees a Modest Boost
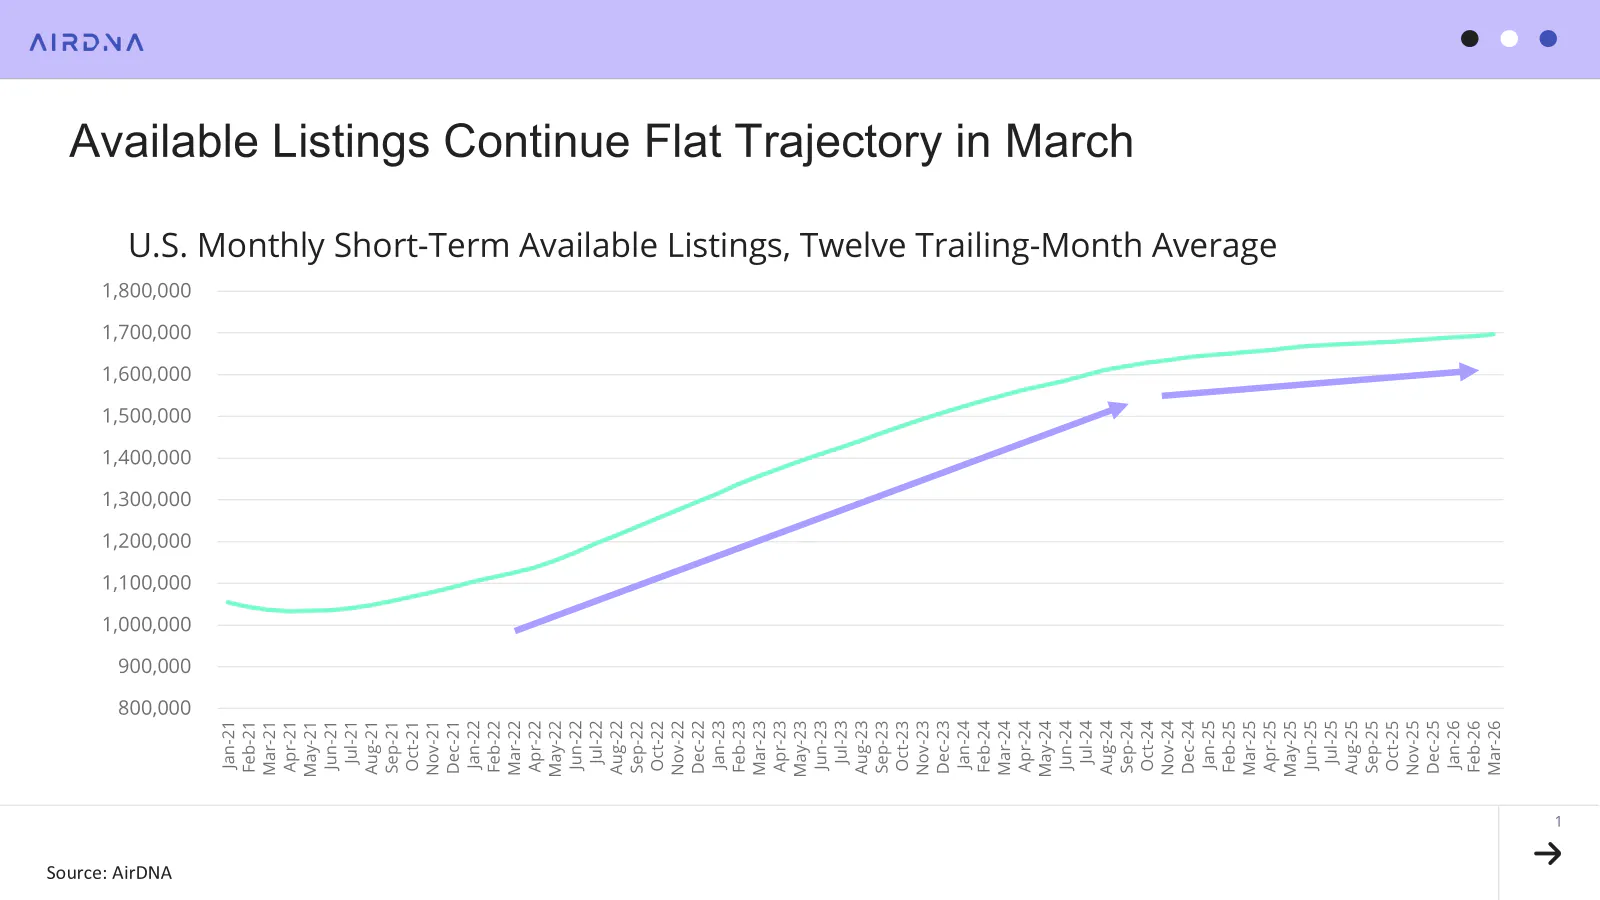
Available listing growth in the U.S. STR market accelerated again after a slightly more tepid February, rising to 3.3% from 2.2%. This was the fastest rate of growth since last June, and part of a choppy but undeniable acceleration since growth hit a low of around 1.5% in September of last year.
After the Federal Reserve made several interest rate cuts in 2025, mortgage rates declined by nearly an entire point from the beginning of 2025 to the beginning of 2026, improving investment prospects. This, along with stable occupancy, stimulated marginal new supply. While rates increased substantially in March as the war in Iran renewed inflation concerns, there is considerable lag between interest rates and new supply, as the process of acquiring and outfitting homes is lengthy.
Still, in comparison to past years, supply growth since the beginning of 2025 has maintained a much flatter trajectory than in the years following the 2020 Covid outbreak. Partly due to the fast reactivation of listings closed during the pandemic and partly due to enthusiasm for a new market, extremely swift, transformative growth had for years been a characteristic of the STR market. A stagnant population, decreasing incoming international travel, higher mortgage rates, and inflation will likely cement the current era as one of more sedate expansion, not terrible news for operators who have been used to continuous additions of fresh competition.
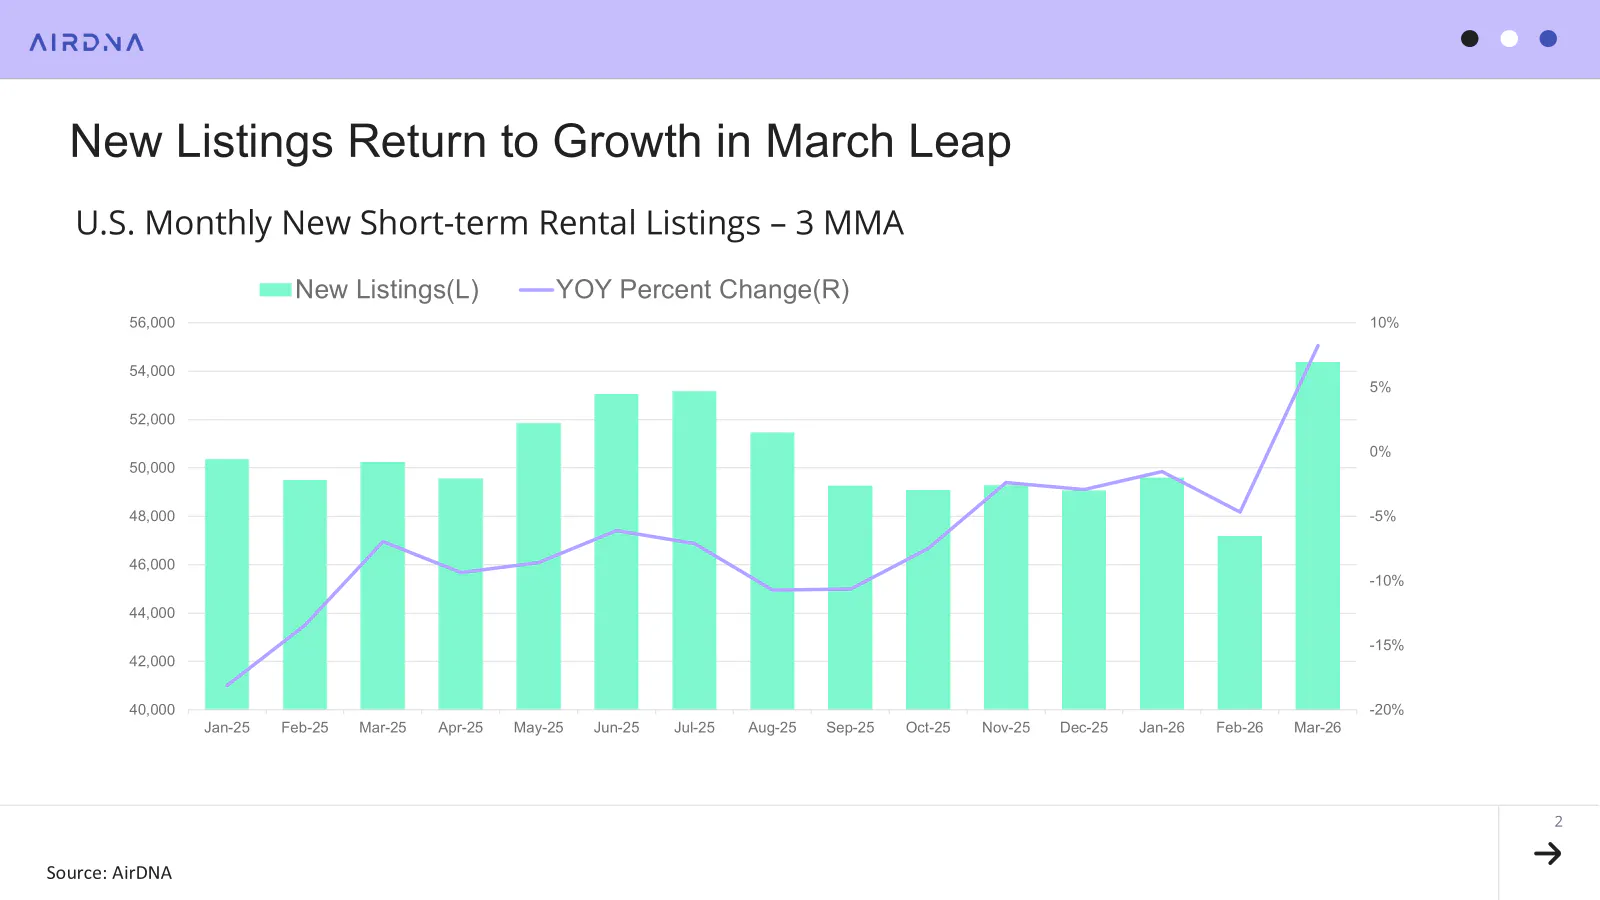
Still, March expressed signs of modest reacceleration, and new listings growth gave strong indication of upward trajectory. After hovering around zero and briefly turning negative in February, New Listings grew dramatically, at +8.2%, a little over 4,000 more new listings than March 2025.
Demand Growth Strengthens and Bookings Maintain
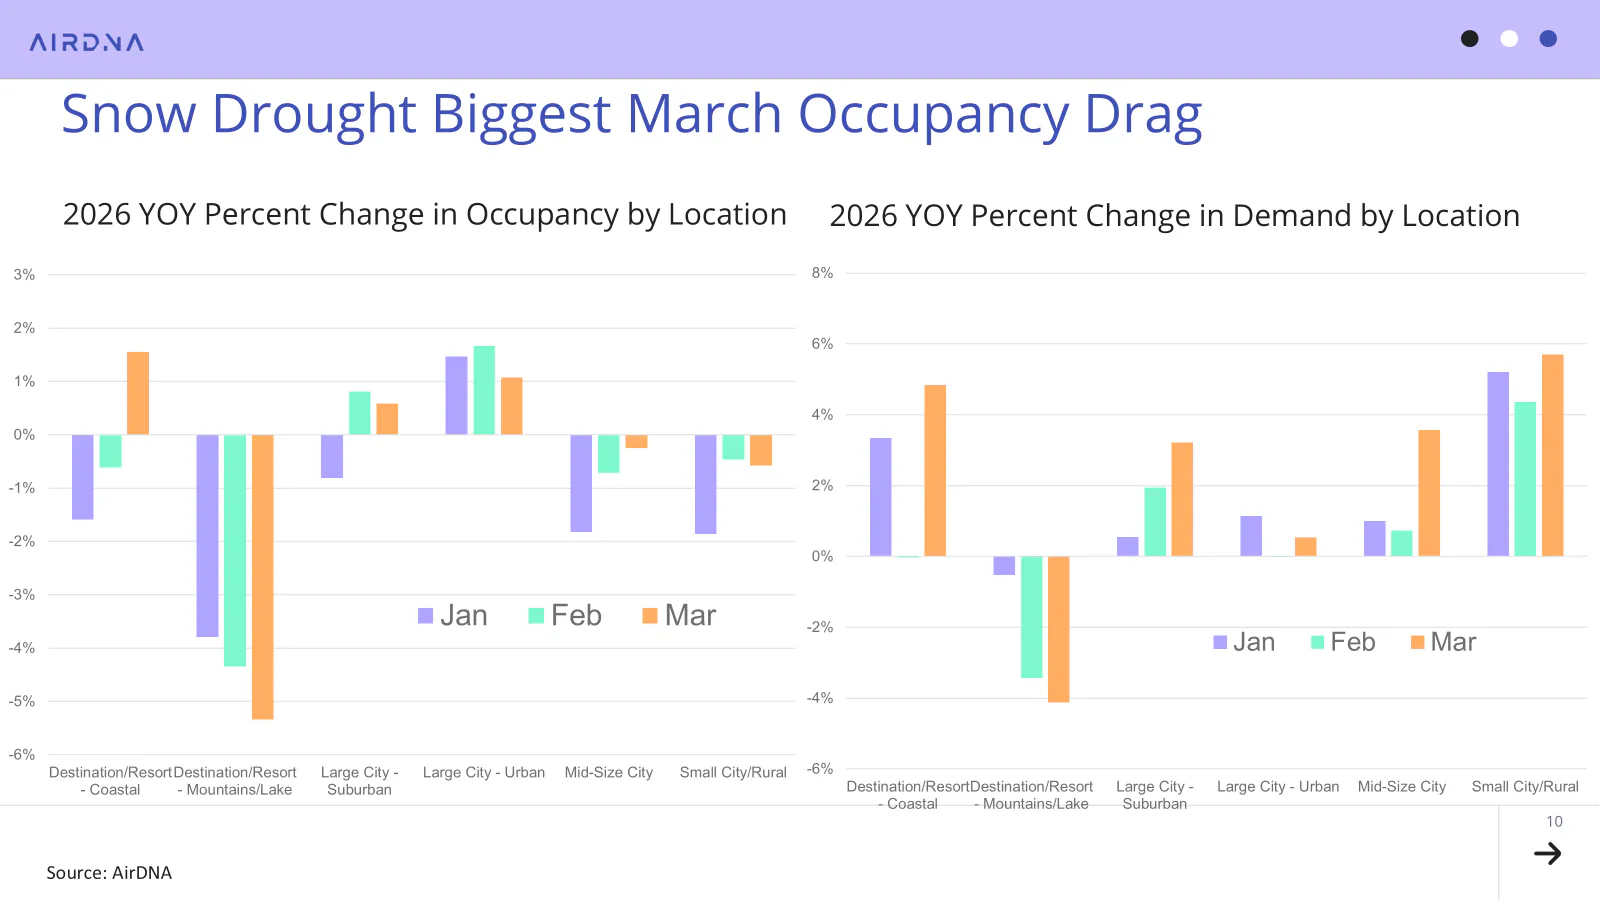
February saw demand growth grind to a halt as poor weather kept people indoors and a severe snow drought left even skiers disappointed, usually a group prepared for winter weather. March saw a rebound in demand growth to 2%, the highest growth rate since October last year. Bookings for current and future demand also grew robustly, albeit at a slightly slower rate than in February (+5.2%, down from 6.4% in February). Anticipation for March and April Spring Break and increasing World Cup reservations helped contribute.
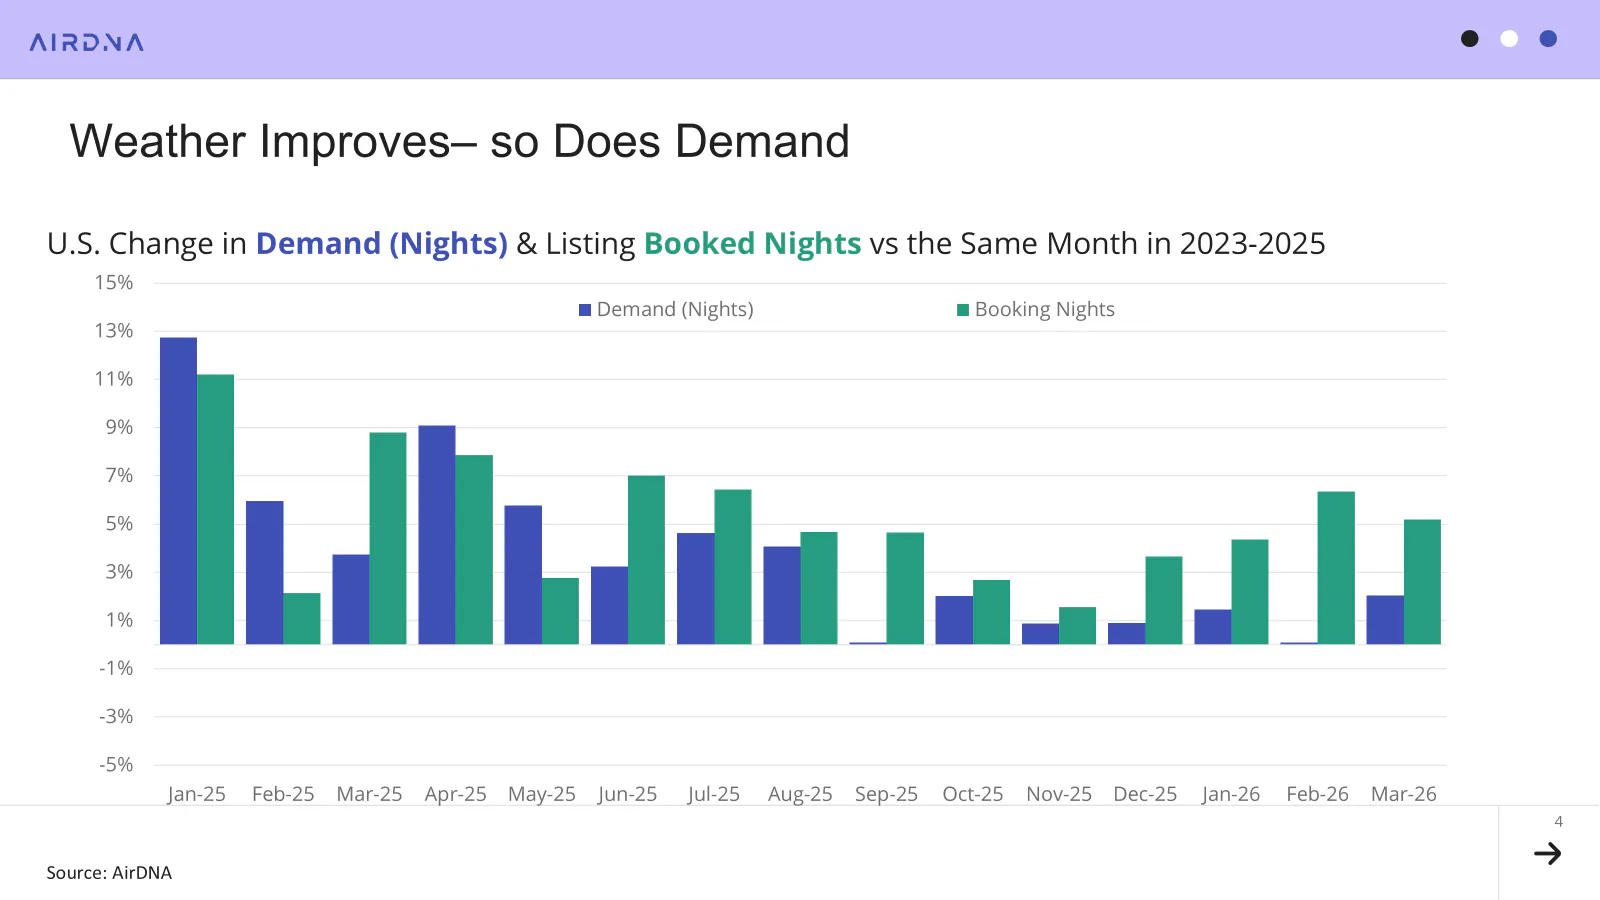
Demand and booking growth fell significantly during the latter half of 2025. The year had started with exceptionally robust growth but soured as it wore on, giving rise to a year of performance AirDNA characterizes as “a Tale of Two Halves.”
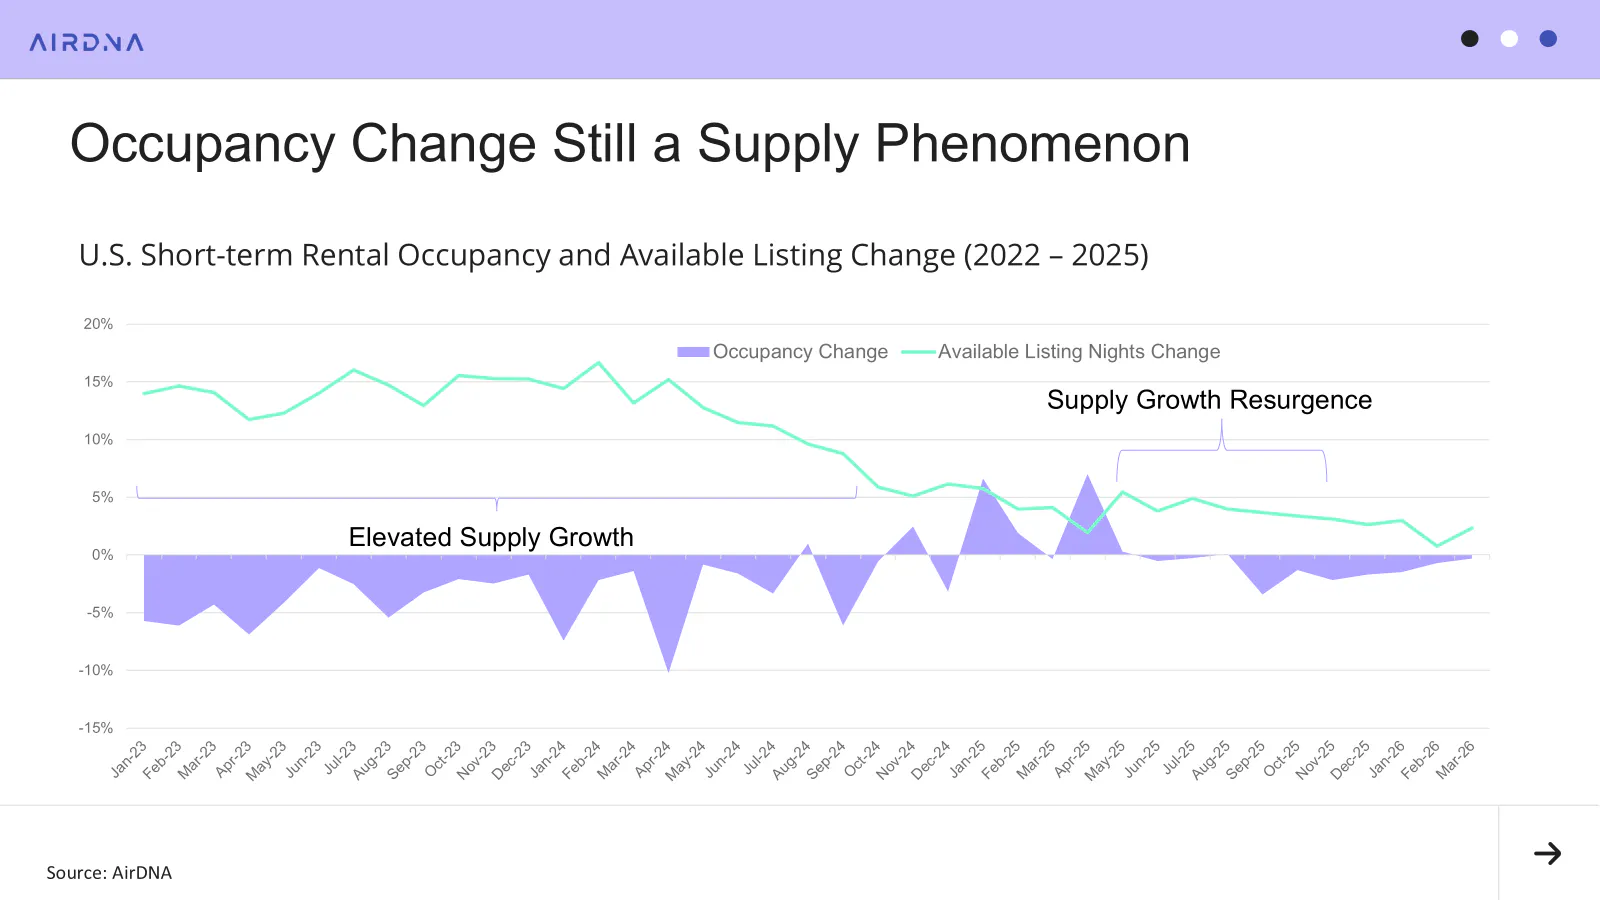
This corresponded with a small resurgence in available listing growth that began in May, creating a reversal from the high occupancy growth seen in March and April. In this sense, occupancy changes can still be thought of as a supply phenomenon, and occupancy growth has recovered as listing growth resumed its pattern of decline. March occupancy was essentially level with March 2025, at only 0.3% lower, and marked the fourth straight month of occupancy growth improvements.
In fact, turning to location types, we can see that barring the snow drought, occupancy would already have returned to growth. Coastal markets and both large city suburban and urban markets had higher occupancies in March (+1.5%, +0.6%, and +1.1%, respectively). All locations except mountain/lake resorts had year-over-year demand growth as well. Without the large decline in mountain/lake occupancy (-5.3%), the remainder of the STR market saw slight growth in occupancy (+0.6%).
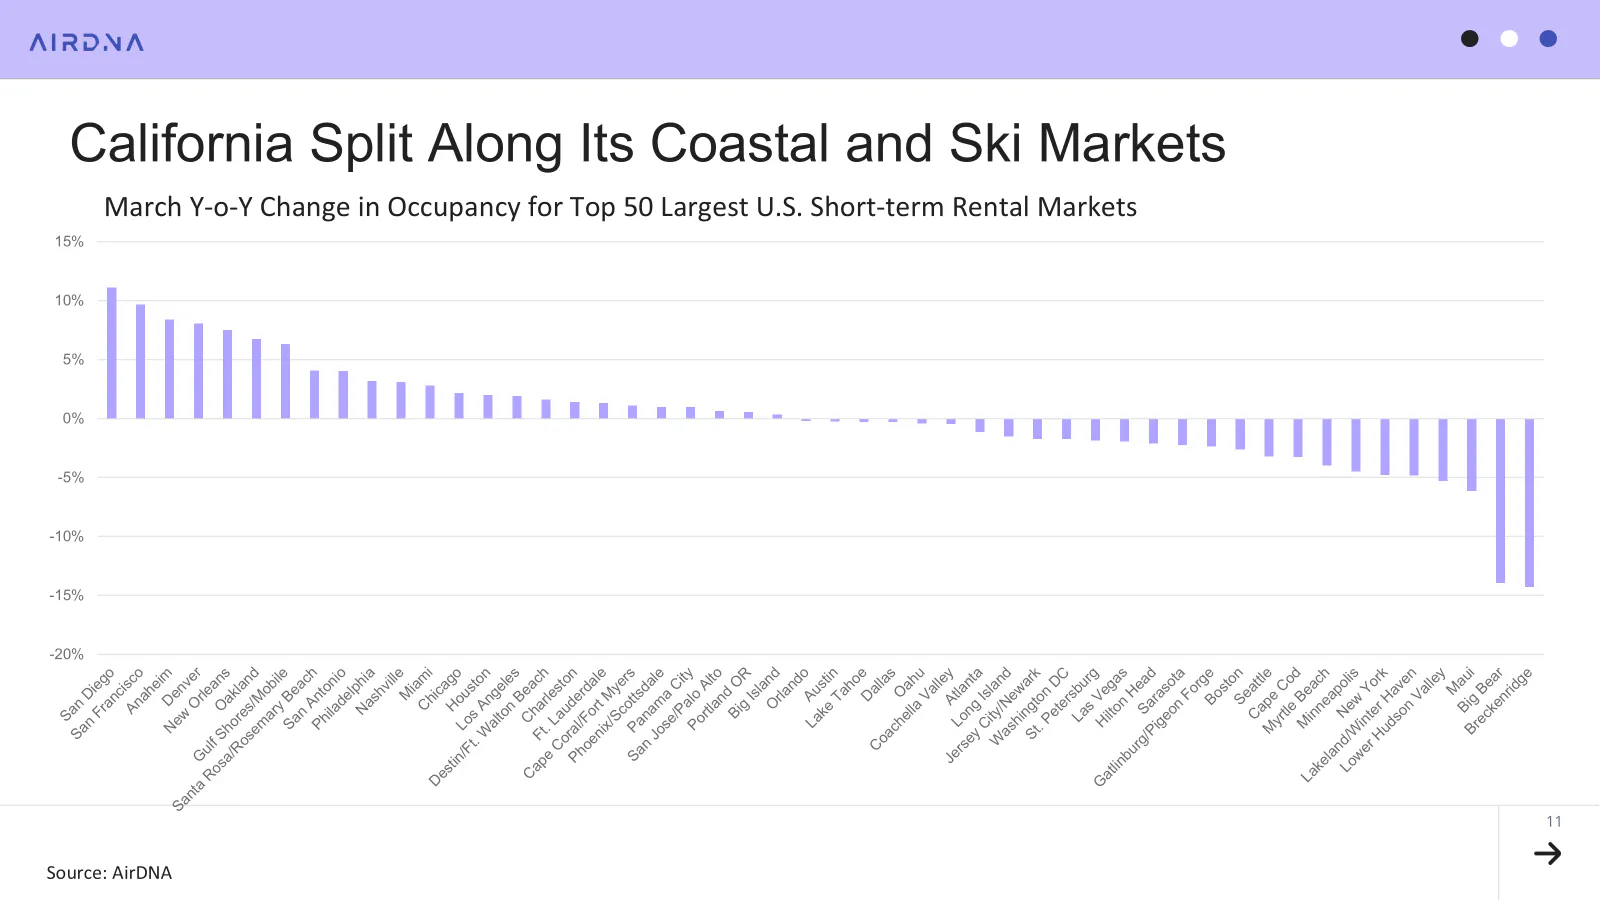
Looking specifically at markets, the divergent performance can be seen within a single state in California. Its coastal markets had the highest occupancy gains of the top 50 U.S. STR markets (San Diego: +11.1%, San Francisco: +9.7%, and Anaheim: +8.4%), whereas its premier ski market, Big Bear (-14.0%), had among the lowest. Colorado also had a notable division across an urban market (Denver +8.1%) and a ski market (Breckenridge -14.3%). Latent travel demand, that is, people’s willingness and ability to travel, may not be quite as poor as the top-line data suggests, weather permitting.
ADR Growth Dips Below Inflation, RRI Maintains Real Growth
Inflation has been a persistent feature of the U.S. economy since the very high rates seen during the pandemic aftermath. Supply chain snarls reduced the amount of goods and services available to be bought with a rapidly expanding money supply, as record-low rates were put in place to bolster a collapsing economy. Since then, pass-through of tariffs has increased the price of both international goods and inputs to domestic production. Now, the war in Iran has led to the quickest run-up in gasoline prices ever.
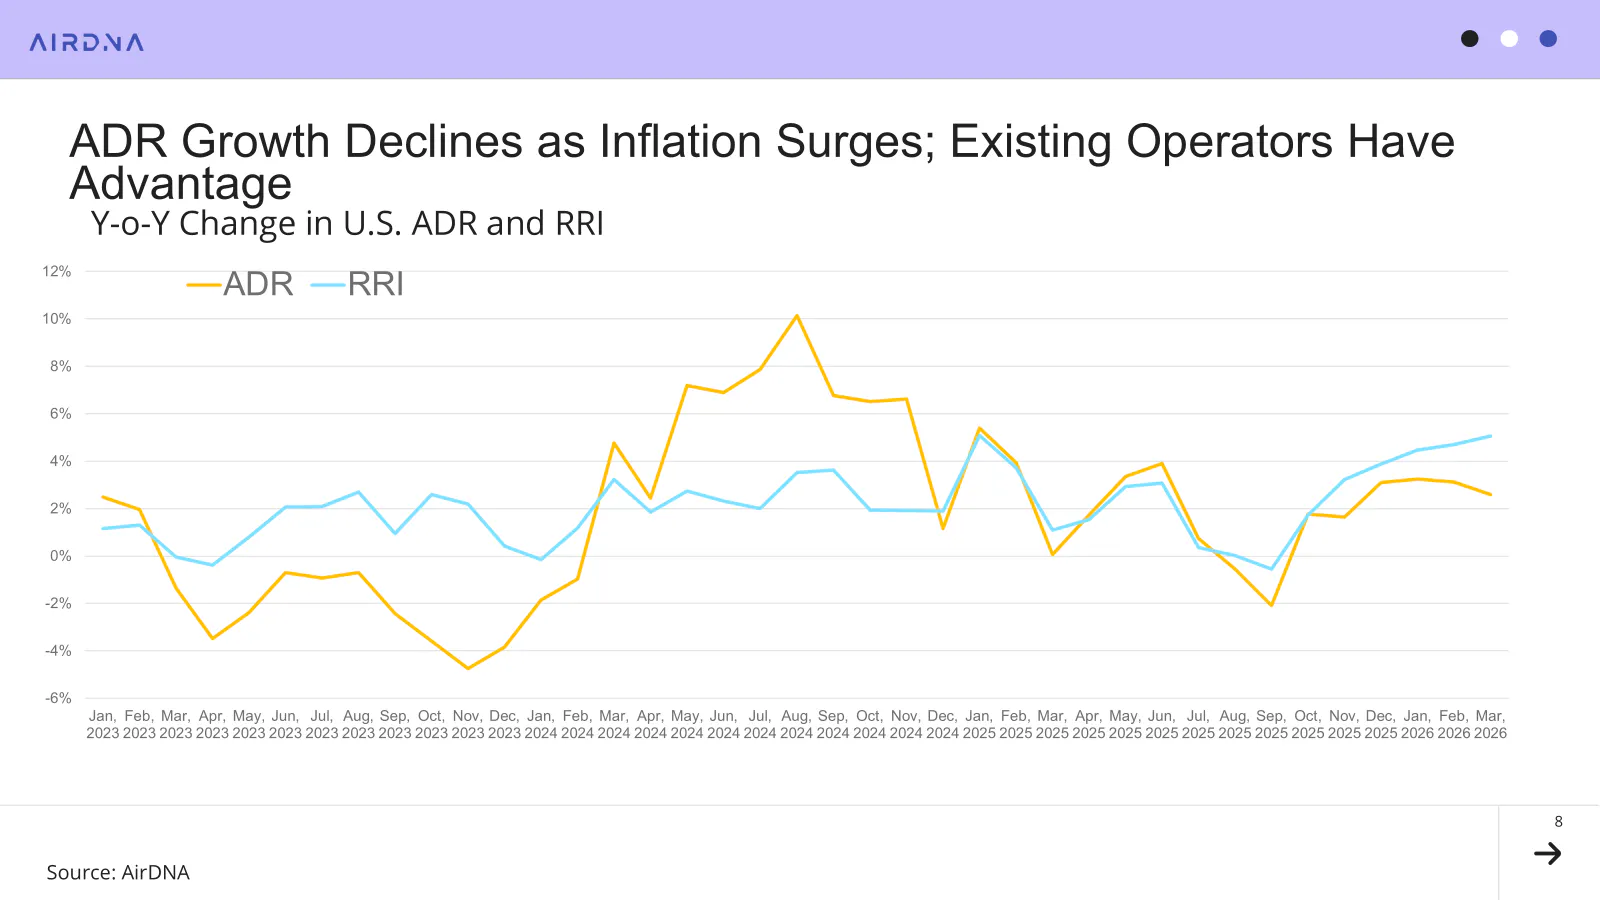
Although hospitality pricing is sometimes seen as insulated against inflationary pressures compared to other commercial real estate, there is an offsetting effect from price shocks when wages remain stagnant. Short-term adjustments to necessities such as food and gasoline are difficult to make, whereas adjustments to leisure activities can be made more readily. This means that inflation increases consumer price sensitivity for STRs. This can be observed in 2023, when, following an annual inflation rate of about 8.0%, ADR decreased by 1.6% on an annual basis.
Fortunately, even a prolonged increase in gasoline prices is unlikely to produce the price increases seen in 2022. Still, ADR growth slowed to +2.6% in March, down from 3.1% in February, and below the inflation rate of 3.3%. ADRs are being depressed by new entrants positioning their listings for affordability, as evidenced by the AirDNA Repeat Rent Index (RRI) accelerating in March, increasing 5.1%, up from 4.7% in February. Existing operators, on the other hand, may have some pricing power from repeat business and a strong rating history, which is especially important as travelers look to mitigate uncertainty in other parts of their lives with certainty in their accommodations.
Forward Pacing Sees Big Summer Bump
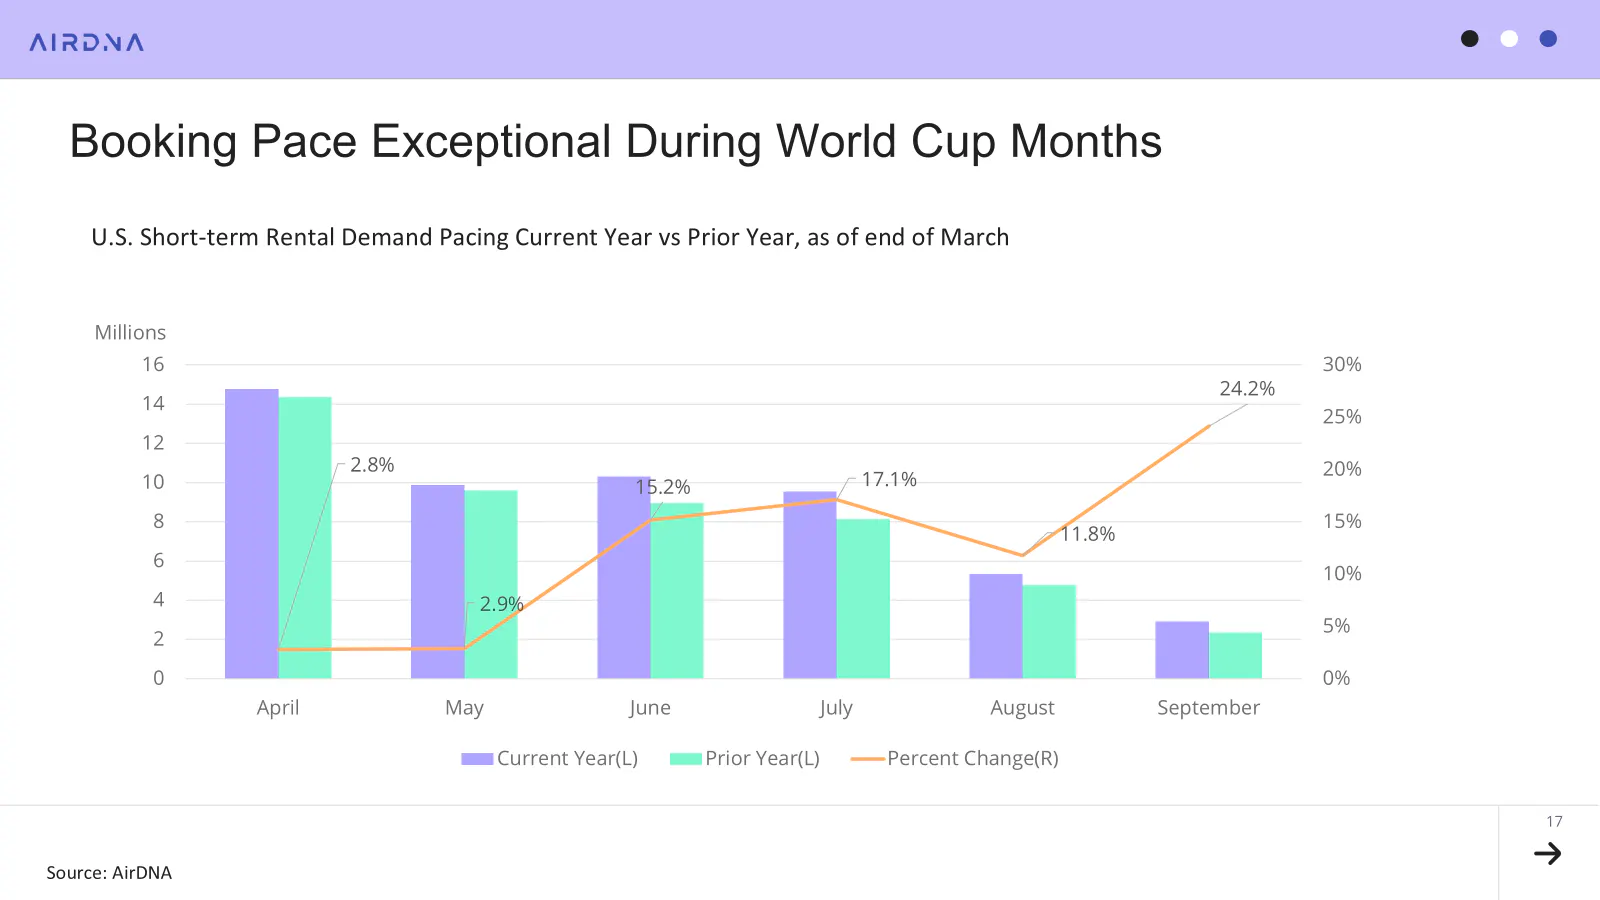
April (+2.8%) and May (+2.9%) demand are currently pacing slightly ahead of March’s demand growth, but as expected, the real acceleration in demand occurs in June (+15.2%) and July (+17.1%).
Along with what may be extra-special 250th anniversary Independence Day celebrations, the highly anticipated World Cup games begin in June and continue through July. While there is some speculation about energy prices and international unrest disrupting the games, so far there hasn’t been much evidence of cancellations or reduced STR demand to support these concerns.
On the other hand, a high volume of early September reservations (+24.2%) may indicate some seasonal bargain-hunting, as well as a calendar shift reversal that moves some Labor Day weekend travel from August back into September.
ARTICLE SUMMARY
In March 2026, demand rebounded and supply growth showed signs of stabilizing, helping occupancy begin to recover. While ADR growth slowed below inflation, strong booking activity and forward pacing driven by Spring Break, summer travel, and major events point to improved performance in the months ahead.
Scott Sage
Senior Vice President, Marketing & Customer Experience
Scott is an Airbnb Superhost and industry pro, having founded Home Base BnBs—a short term rental management company that scaled to 200+ units. Scott combines his experience and passion for hosting to empower AirDNA customers' success. When he's not thinking about STRs, he is hiking, playing basketball, or playing pickleball.