Highest Airbnb Occupancy Rates by Country (and How to Check Them Yourself)
Published: December 1, 2025
Last updated: May 6, 2026

Jamie Zhang
Key Takeaways
- Occupancy averages can hide seasonality and big differences between neighborhoods, so always look deeper than the headline rate.
- Regulations can inflate occupancy by reducing supply and making the remaining listings look busier than the market actually is.
- AirDNA shows you what occupancy could look like not only in your target market, but for any individual property as well.
Occupancy rate is one of the quickest ways to get a heat-check on a short-term rental market.
The average occupancy rate of a market tells you a lot, including how often listings are booked and how well the market supports short-term rentals overall. A consistently high occupancy rate might reflect a market where listings match guest expectations, pricing is on point, and competition isn’t crowding everyone out. A lower occupancy rate could hint at oversupply, seasonal slowdowns, or something else worth digging into.
We’ve put together a snapshot of the highest Airbnb occupancy rates across the U.S. and internationally, based on the past year of data, so you can see which markets are consistently putting up solid numbers.
Keep in mind, though, that a great Airbnb occupancy rate doesn’t tell the full story. In this guide, we’ll break down what occupancy rate can’t tell you, and how to use AirDNA to dig deeper, so you can move from broad benchmarks to sharper, more strategic decisions.
Top U.S. Cities With the Highest Airbnb Occupancy Rates in 2025
Trying to choose the right market for a short-term rental? You could go with your gut . . . or you could look at how often places actually get booked. After all, high nightly rates sound great, but they don’t mean much if no one’s showing up.
To get a pulse on which U.S. markets are leading the pack with the highest Airbnb occupancy rates on average, we pulled data from thousands of active Airbnb and Vrbo listings over the past year (through October 2025). Here's what we found:
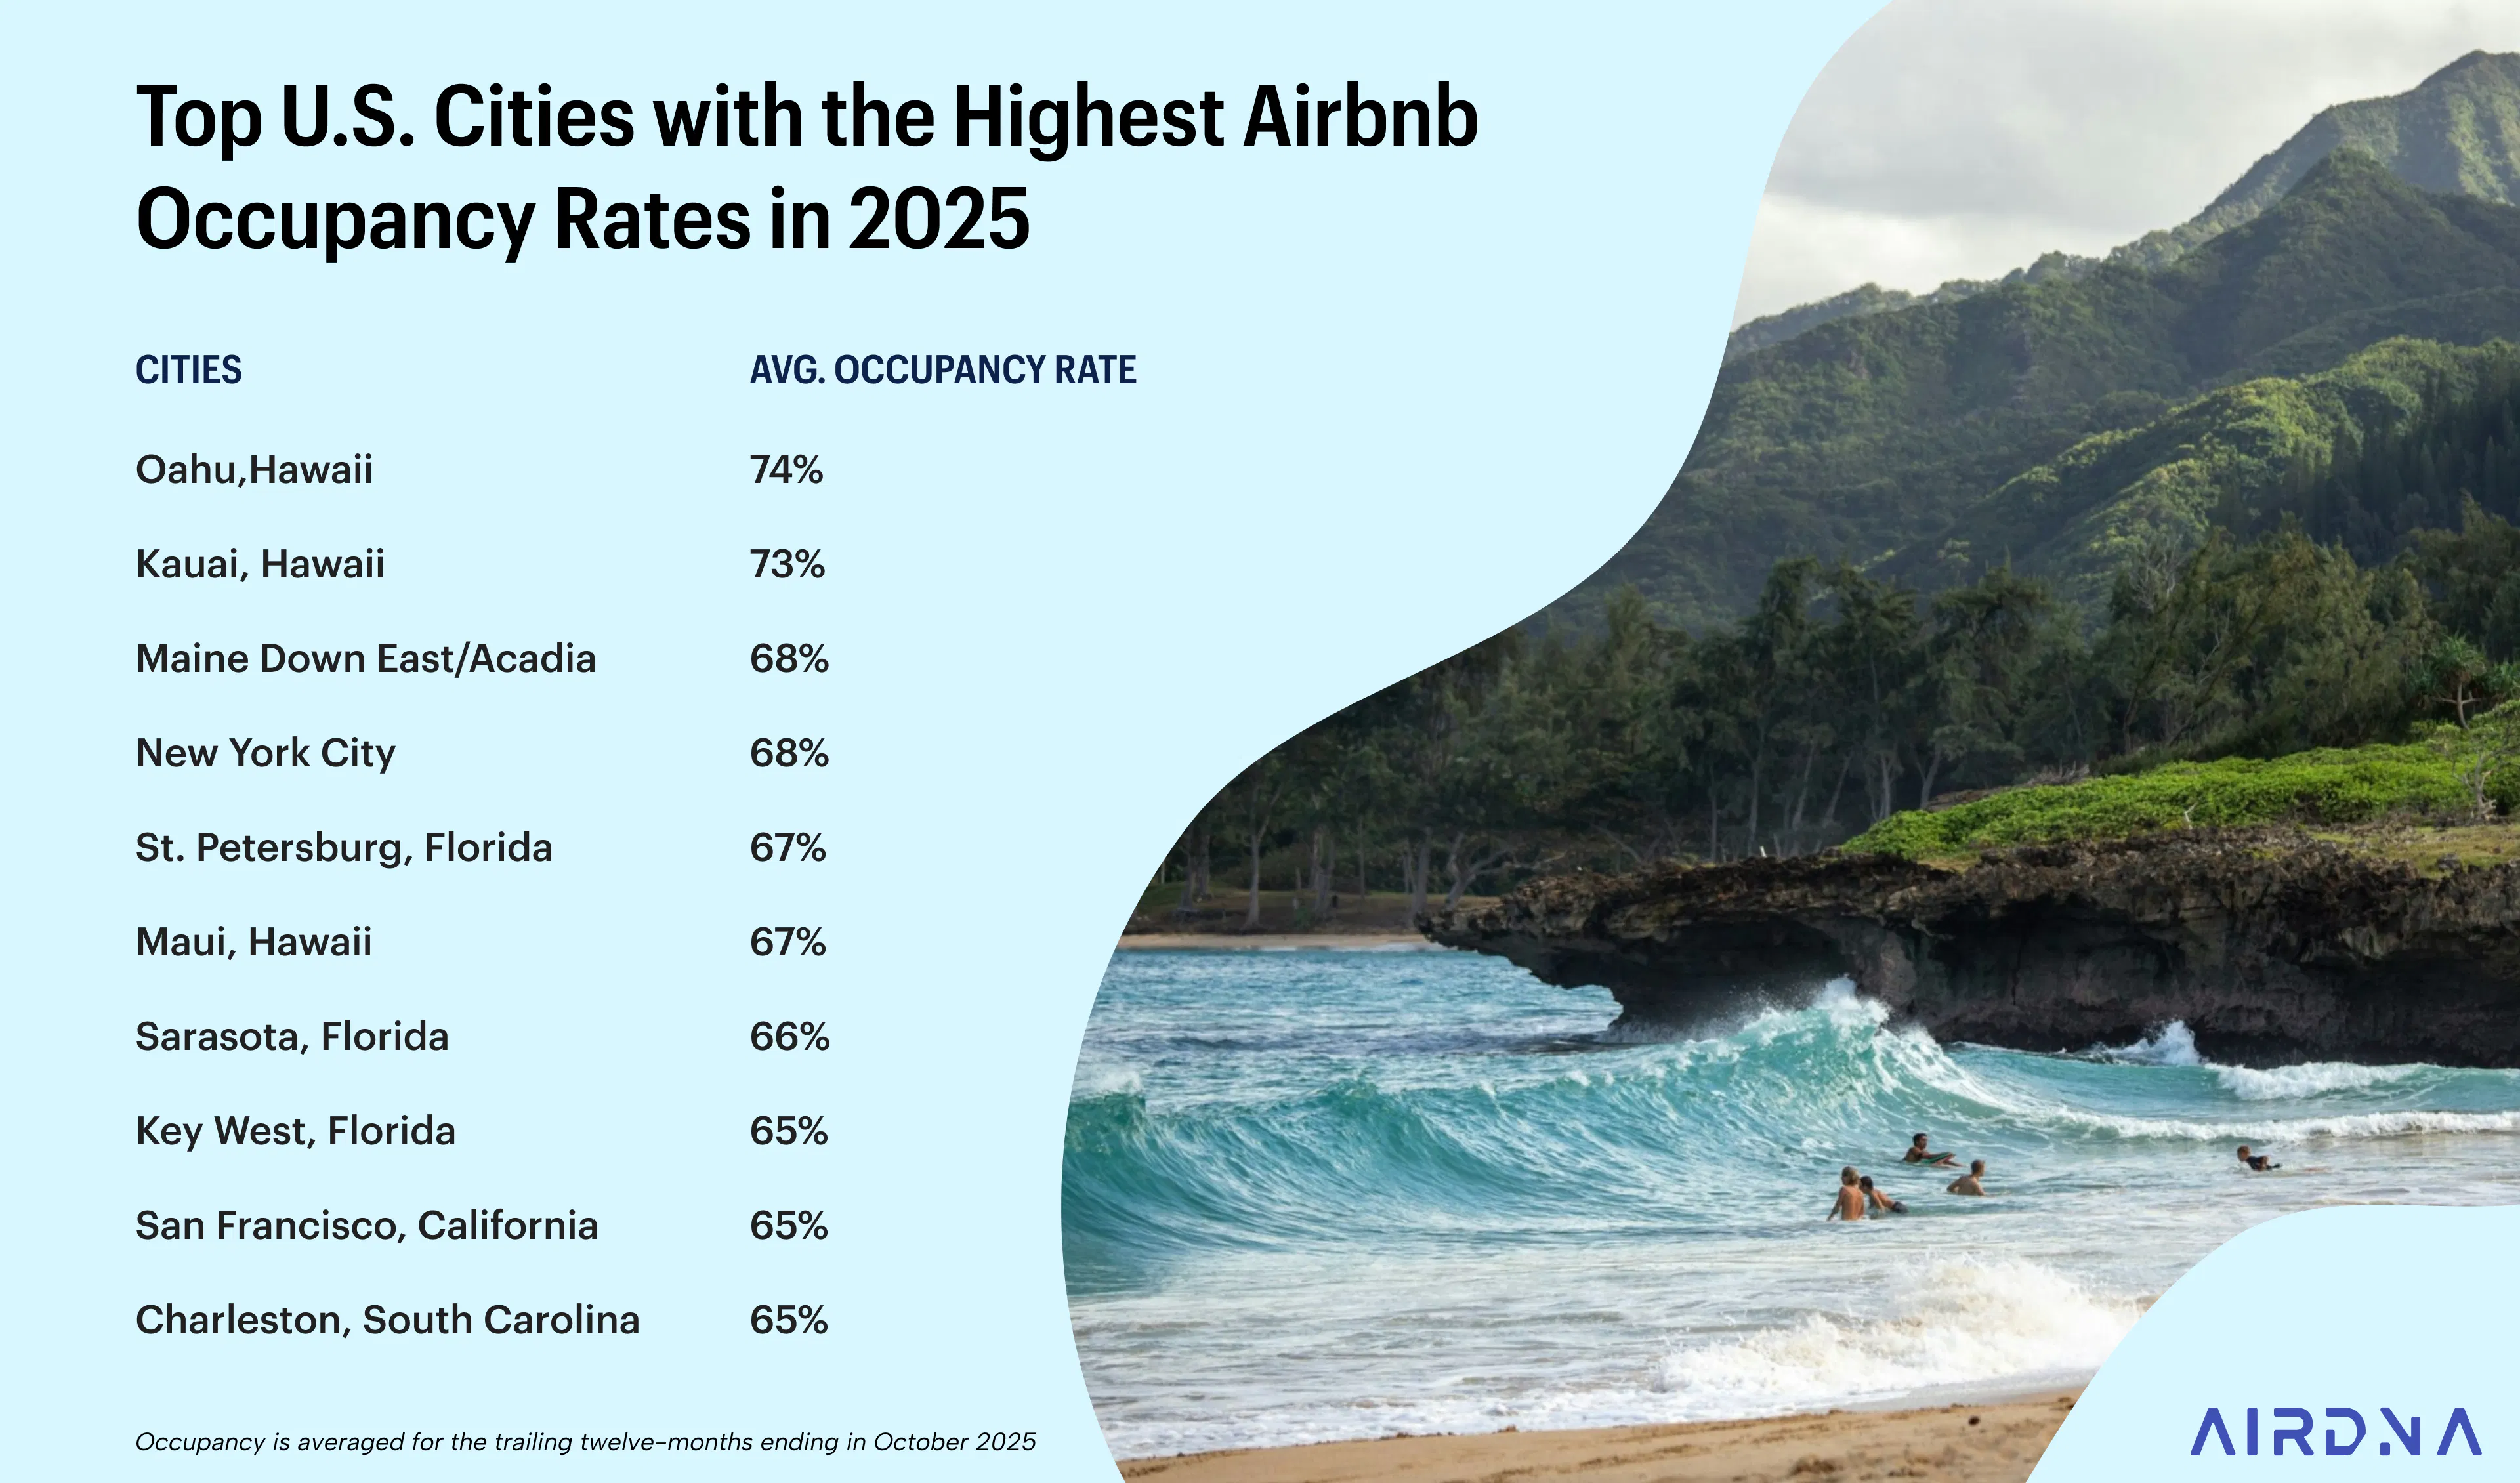
Start at the top of the list, and you’ll spot a clear theme: Hawaii dominates. Oahu, Kauai, and Maui all make the top 10, with average occupancy rates between 67% and 74%. That’s the result of consistent year-round demand in a market with limited housing supply and no real “off-season.” Guests show up for the beaches, and they show up all year.
Florida’s coastline is also well represented, from St. Petersburg to Sarasota to Key West. These markets offer warm weather and easy access by car. They also have broad guest appeal, whether it’s family vacations, weekend escapes, or snowbirds settling in for the season. In other words, plenty of reasons to visit, and plenty of months when people do.
Then there are the urban powerhouses like New York City and San Francisco, where demand isn’t driven by the seasons but by the constant hum of city life. Business travel, major events, and international tourism all play a role. While those cities may never sleep, the people in them do—and plenty of travelers are choosing Airbnbs.
Regulations can inflate occupancy rates, especially in cities
There’s another reason both New York City and San Francisco show up with strong average occupancy rates in the data: tight short-term rental regulations can artificially inflate occupancy among the listings that remain active.
In New York City, Local Law 18 dramatically reduced the number of legal short-term rentals by restricting unhosted stays and requiring strict registration. When thousands of listings left the market almost overnight, the remaining legal, registered listings saw an immediate surge in demand. Fewer available options meant more bookings for the hosts who remained compliant. This pushed occupancy rates higher across the board, even though total supply dropped. This effect is well-documented in AirDNA’s analyses of the NYC crackdown, which show a sharp supply contraction accompanied by higher average occupancy for the surviving listings.
A similar dynamic plays out in San Francisco, where hosts must meet primary-residence requirements and are limited to 90 nights of unhosted short-term rental stays per year. These restrictions shrink the pool of available entire-home rentals. With fewer properties operating year-round, demand consolidates into a smaller number of listings.
In both cities, high occupancy doesn’t necessarily signal a booming short-term rental environment. Instead, it reflects a supply-constrained market, where regulation reduces the number of active listings, making the remaining ones appear exceptionally busy. For investors evaluating highly regulated cities, it’s essential to understand whether high occupancy stems from genuine demand strength or from a regulatory squeeze.

Occupancy averages can mask big fluctuations
We’d also like to point your attention to Charleston, South Carolina. It looks great on paper, but that steady average is hiding something.
At first glance, Charleston’s 65% average occupancy rate puts it right in line with other top performers. Zoom in, however, and Charleston turns out to be a highly seasonal market. Occupancy dips below 40% in January, then climbs to around 80% by July, a swing that the annual average doesn’t reflect.
It’s a reminder that high averages often obscure meaningful patterns. If you’re considering a highly seasonal market like Charleston, seasonality becomes part of the strategy. You’ll need to plan for slower months and make sure your pricing (and your cash reserves) can carry you through the quieter stretch.
That’s where AirDNA comes in. Later in this article, we’ll show you how to use AirDNA to go beyond surface-level averages, dig into seasonal patterns, compare neighborhoods, and even estimate occupancy for a specific property.
The Highest Occupancy Rates for Airbnb Globally
Some of the world’s top-performing markets rival (or even outpace) the highest Airbnb occupancy rates in the U.S. Below are international standouts with strong average occupancy over the past year. Only markets with at least 10 active listings are included.
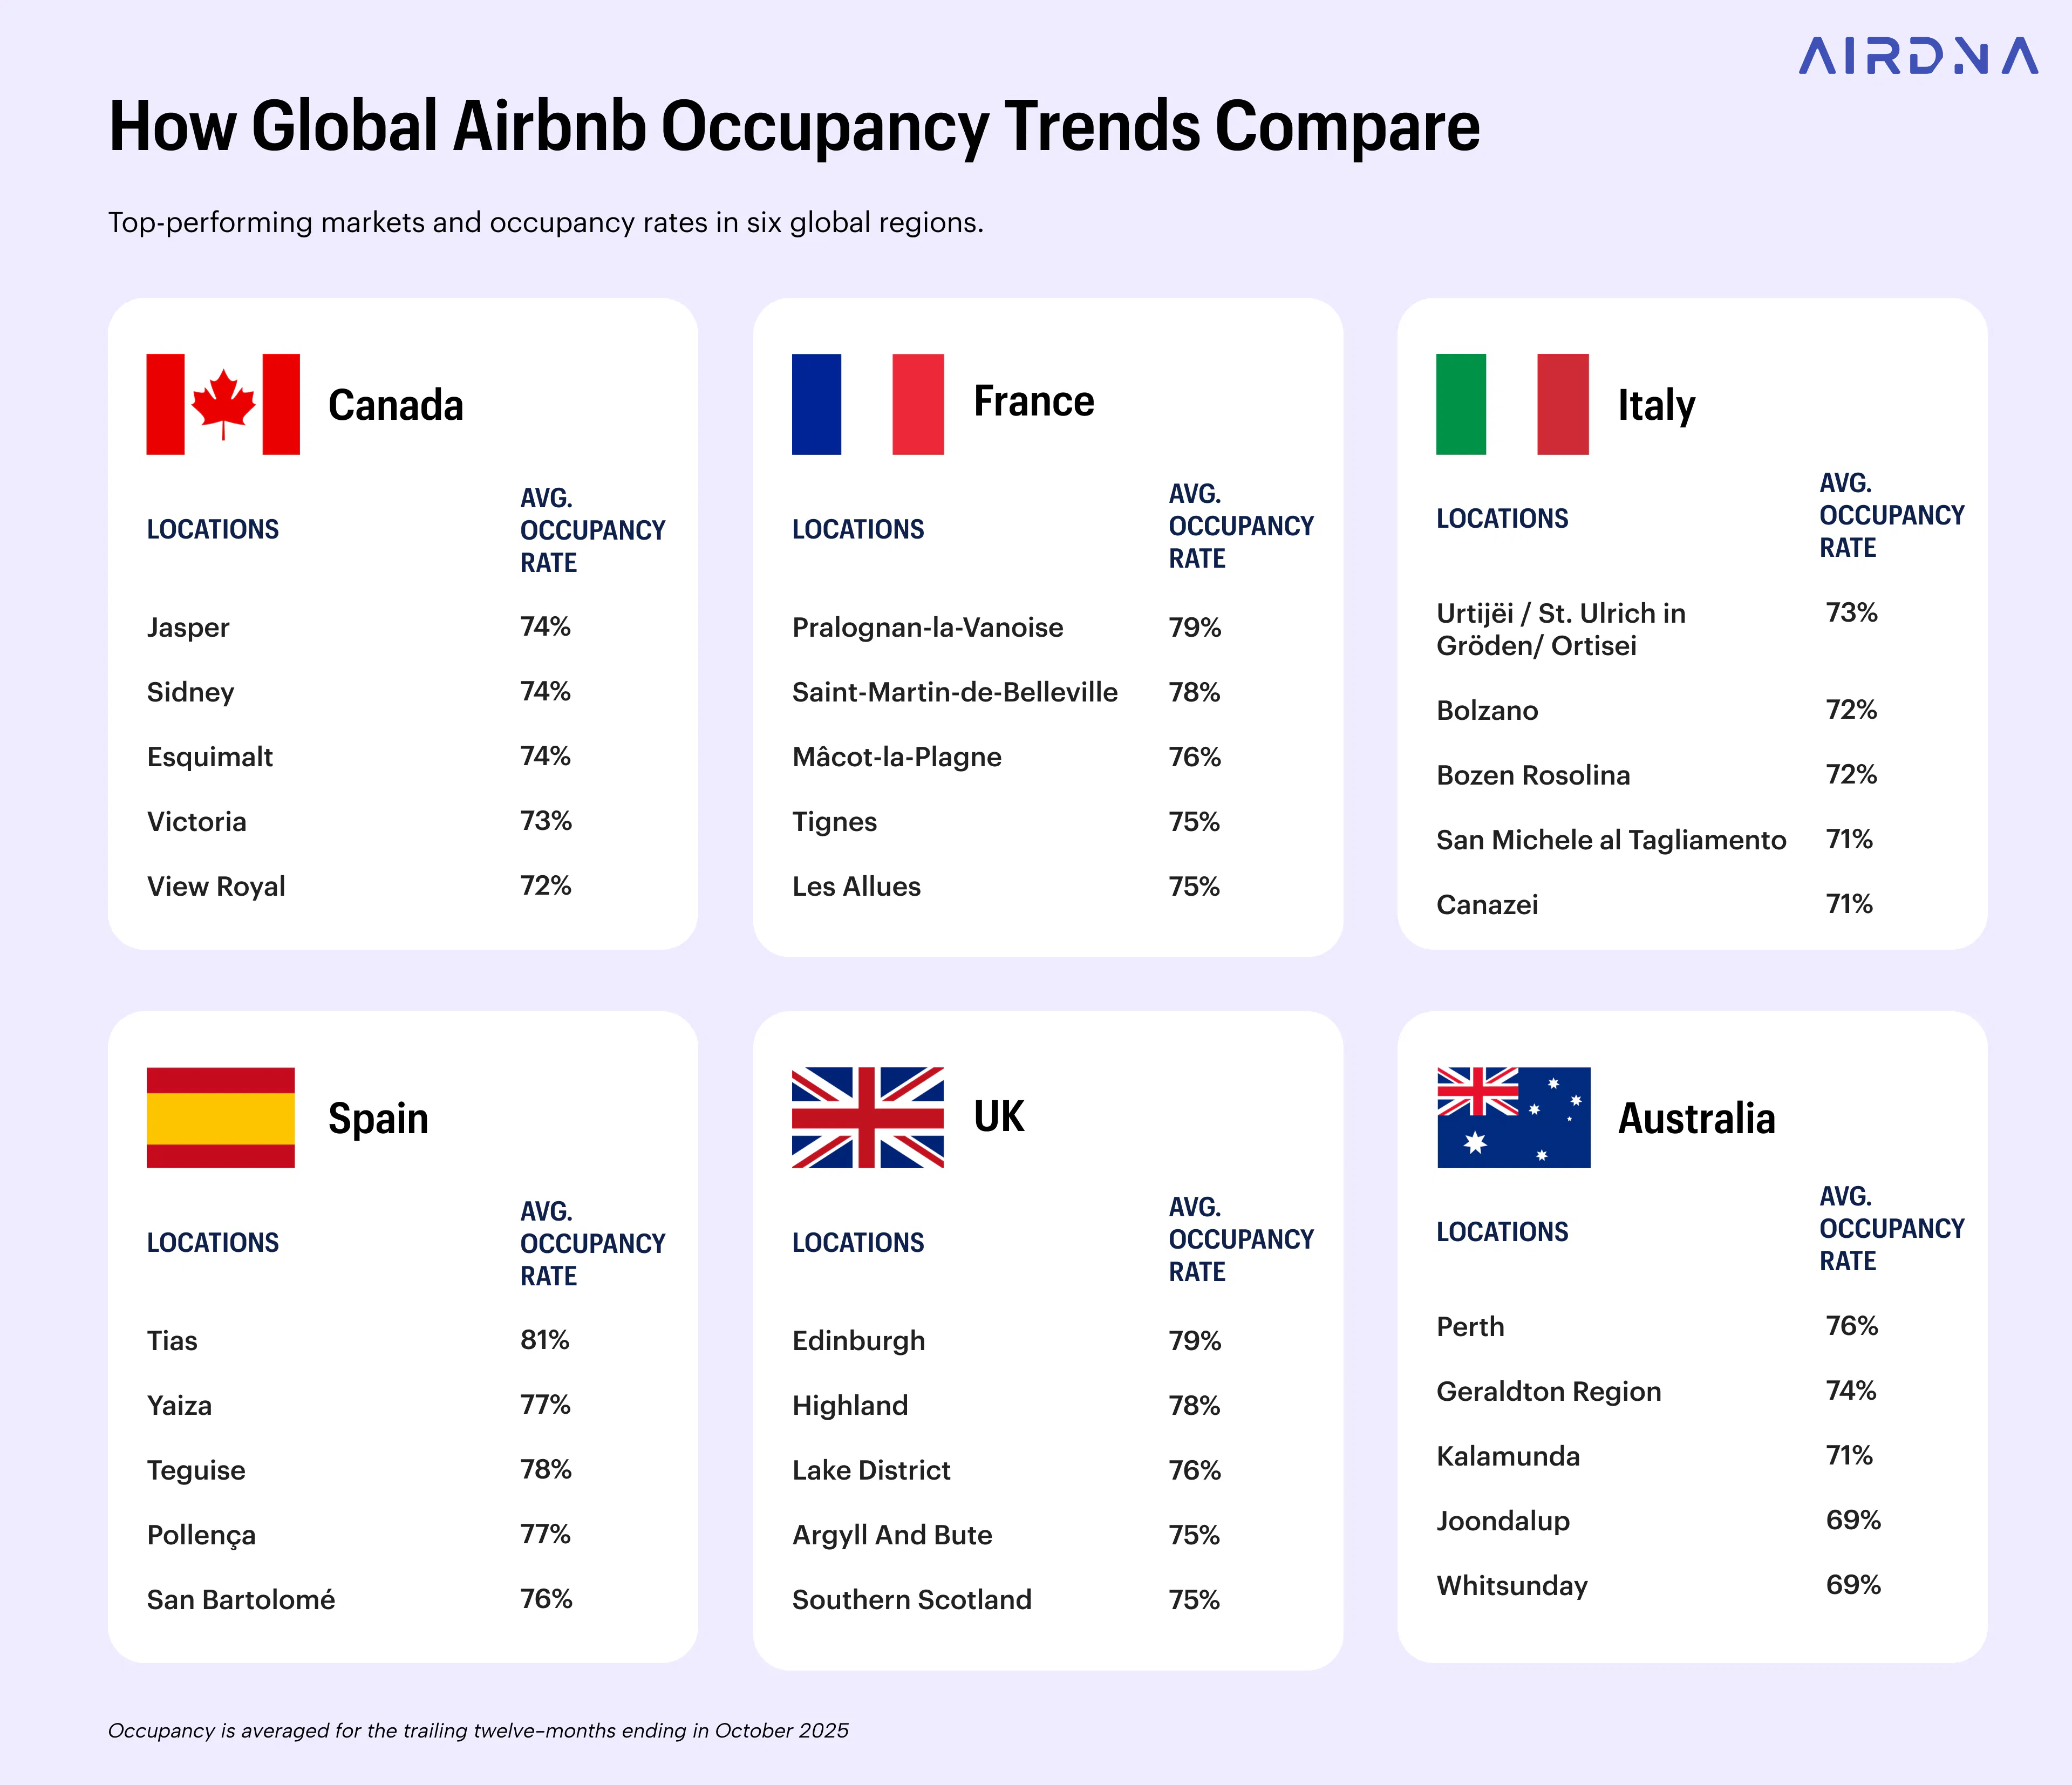
Canada
Many of Canada’s highest occupancy markets are in British Columbia, where nature-focused destinations see strong demand from both domestic and international travelers.
Top markets:
- Jasper: 74%
- Sidney: 74%
- Esquimalt: 74%
- Victoria: 73%
- View Royal: 72%
Despite colder winters, these markets maintain solid year-round demand, especially in regions known for outdoor tourism.
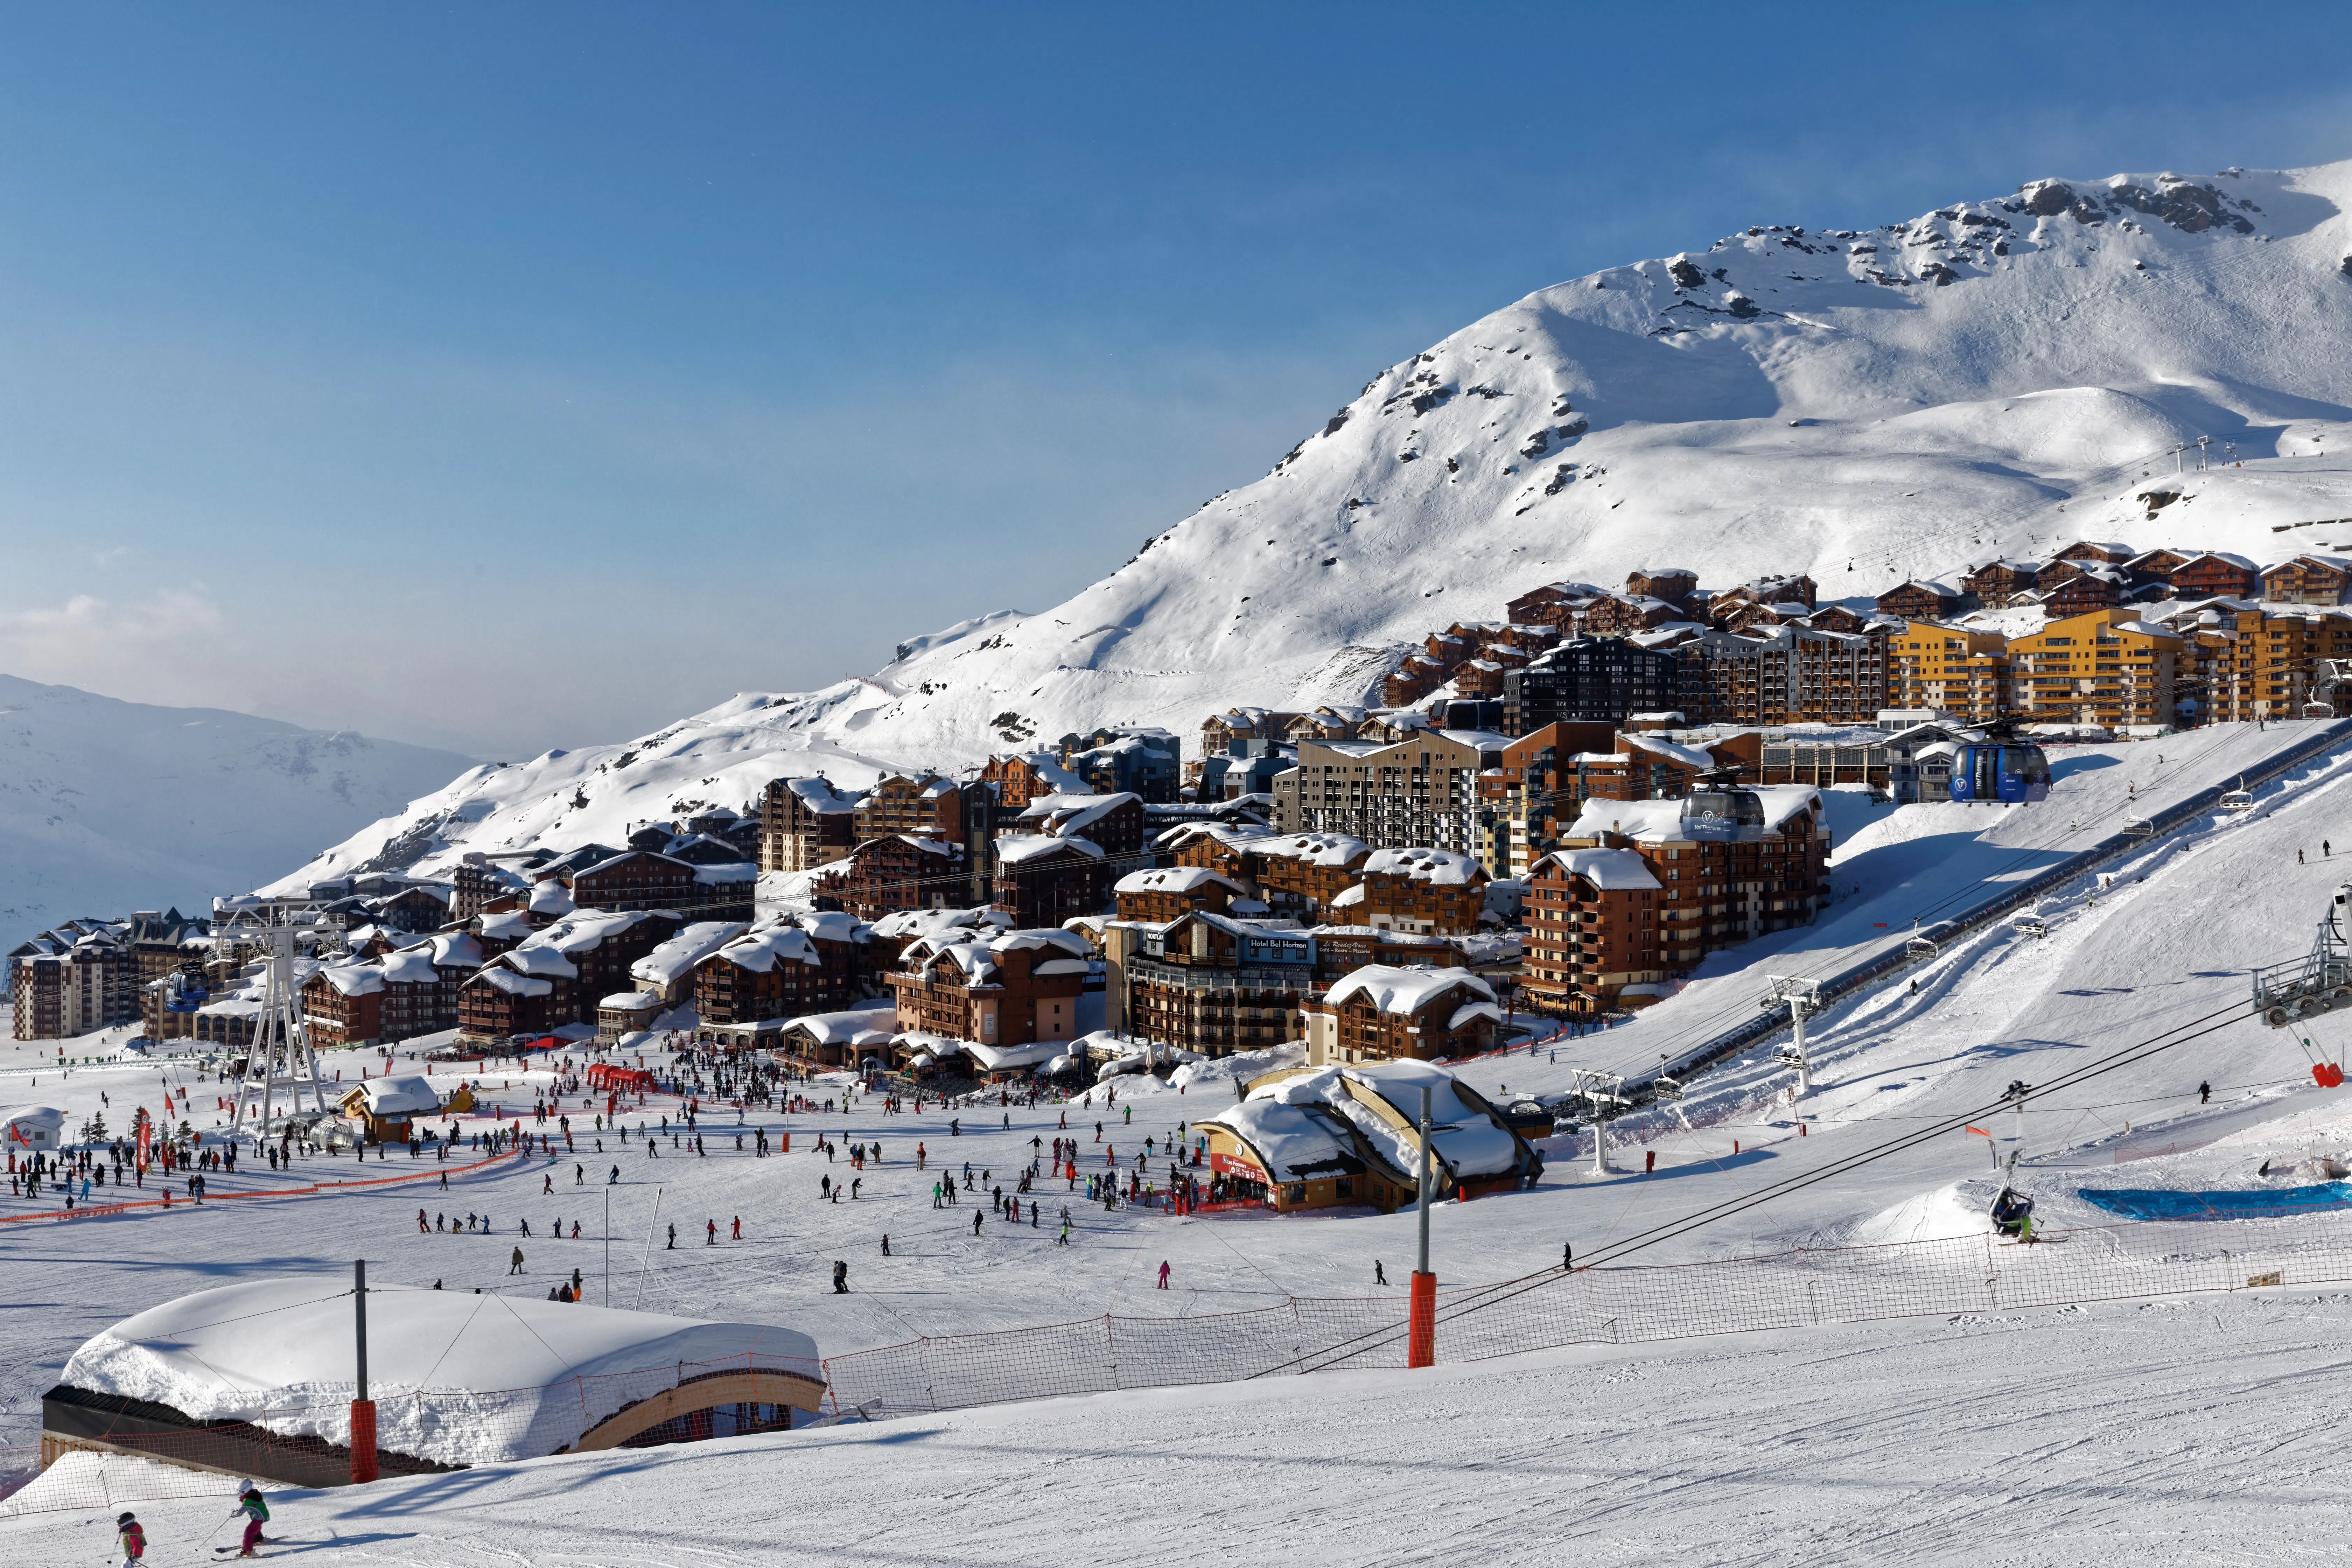
France
France’s highest occupancy markets are clustered in the Alps, where seasonal peaks are strong, but demand often extends beyond winter holidays.
Top markets:
- Pralognan-la-Vanoise: 79%
- Saint-Martin-de-Belleville: 78%
- Mâcot-la-Plagne: 76%
- Tignes: 75%
- Les Allues: 75%
These average occupancy rates are among the highest globally, driven by a mix of ski tourism and summer mountain getaways.
Italy
Italy’s top markets are mostly in the north, where mountain towns and beachside destinations draw seasonal—but steady—travel flows.
Top markets:
- Urtijëi - St. Ulrich in Gröden - Ortisei: 73%
- Bolzano - Bozen: 72%
- Rosolina: 72%
- San Michele al Tagliamento: 71%
- Canazei: 71%
While seasonality plays a role, Italy’s top markets show that consistent leisure demand can drive strong average occupancy.
Spain
Spain’s top performers are in the Canary and Balearic Islands, where mild weather supports year-round tourism and high occupancy.
Top markets:
- Tias: 81%
- Teguise: 78%
- Yaiza: 77%
- Pollença: 77%
- San Bartolomé: 76%
Spain leads the pack globally. Tias has the highest average occupancy rate of any market on this list.
United Kingdom
The UK’s strongest markets are scenic getaways, with the Highlands and Lake District seeing consistent domestic travel, especially during warmer months.
Top markets:
- Edinburgh: 72%
- Highland: 71%
- Lake District: 67%
- Argyll and Bute: 67%
- Southern Scotland: 65%
These markets reflect strong domestic tourism, with occupancy tied closely to seasonality and weekend travel trends.
Australia
Australia’s top markets include both urban areas and coastal regions, with travel patterns influenced by domestic holidays and warm-weather seasons.
Top markets:
- Perth: 76%
- Geraldton Region: 74%
- Kalamunda: 71%
- Joondalup: 69%
- Whitsunday: 69%
With a mix of city and leisure destinations, Australia’s top markets see high average occupancy driven by both local travel and longer regional stays.

What Average Airbnb Occupancy Rates Do and Don’t Tell You
At its simplest, Airbnb occupancy rate is the number of nights a property is booked divided by the number of nights it’s available. It’s one of the most widely used metrics in the short-term rental market, and for good reason: it signals demand. If listings are consistently booked, there’s likely strong guest appeal in that area.
However, while a high Airbnb occupancy rate usually points to solid performance, it doesn’t tell the whole story. Location is only one factor influencing occupancy. How often you’re booked also depends on your pricing strategy, property type, and seasonality.
Most markets in the U.S. tend to average between 50% and 70% occupancy. However, the average occupancy rate is just a starting point, not a guarantee.
There are two big reasons why averages can be misleading:
They smooth over submarket differences. Let’s say you’re looking at Airbnb occupancy rate by city and see that New York City averages 68%. That sounds promising, but zoom in, and you’ll see it’s not evenly distributed. The Gramercy submarket averages 80%, while Concourse sits at just 54%. Same city, totally different story depending on location.
They don’t reflect seasonality. A market’s average might look strong, but that could be the result of very high highs and very low lows. Take the Outer Banks, North Carolina. The market ranks just outside the U.S. top 10 with an average occupancy of 64%. In reality, occupancy drops to around 35% in December and surges to 91% in July. That seasonal spread is common in vacation destinations and needs to be factored into planning and revenue projections.
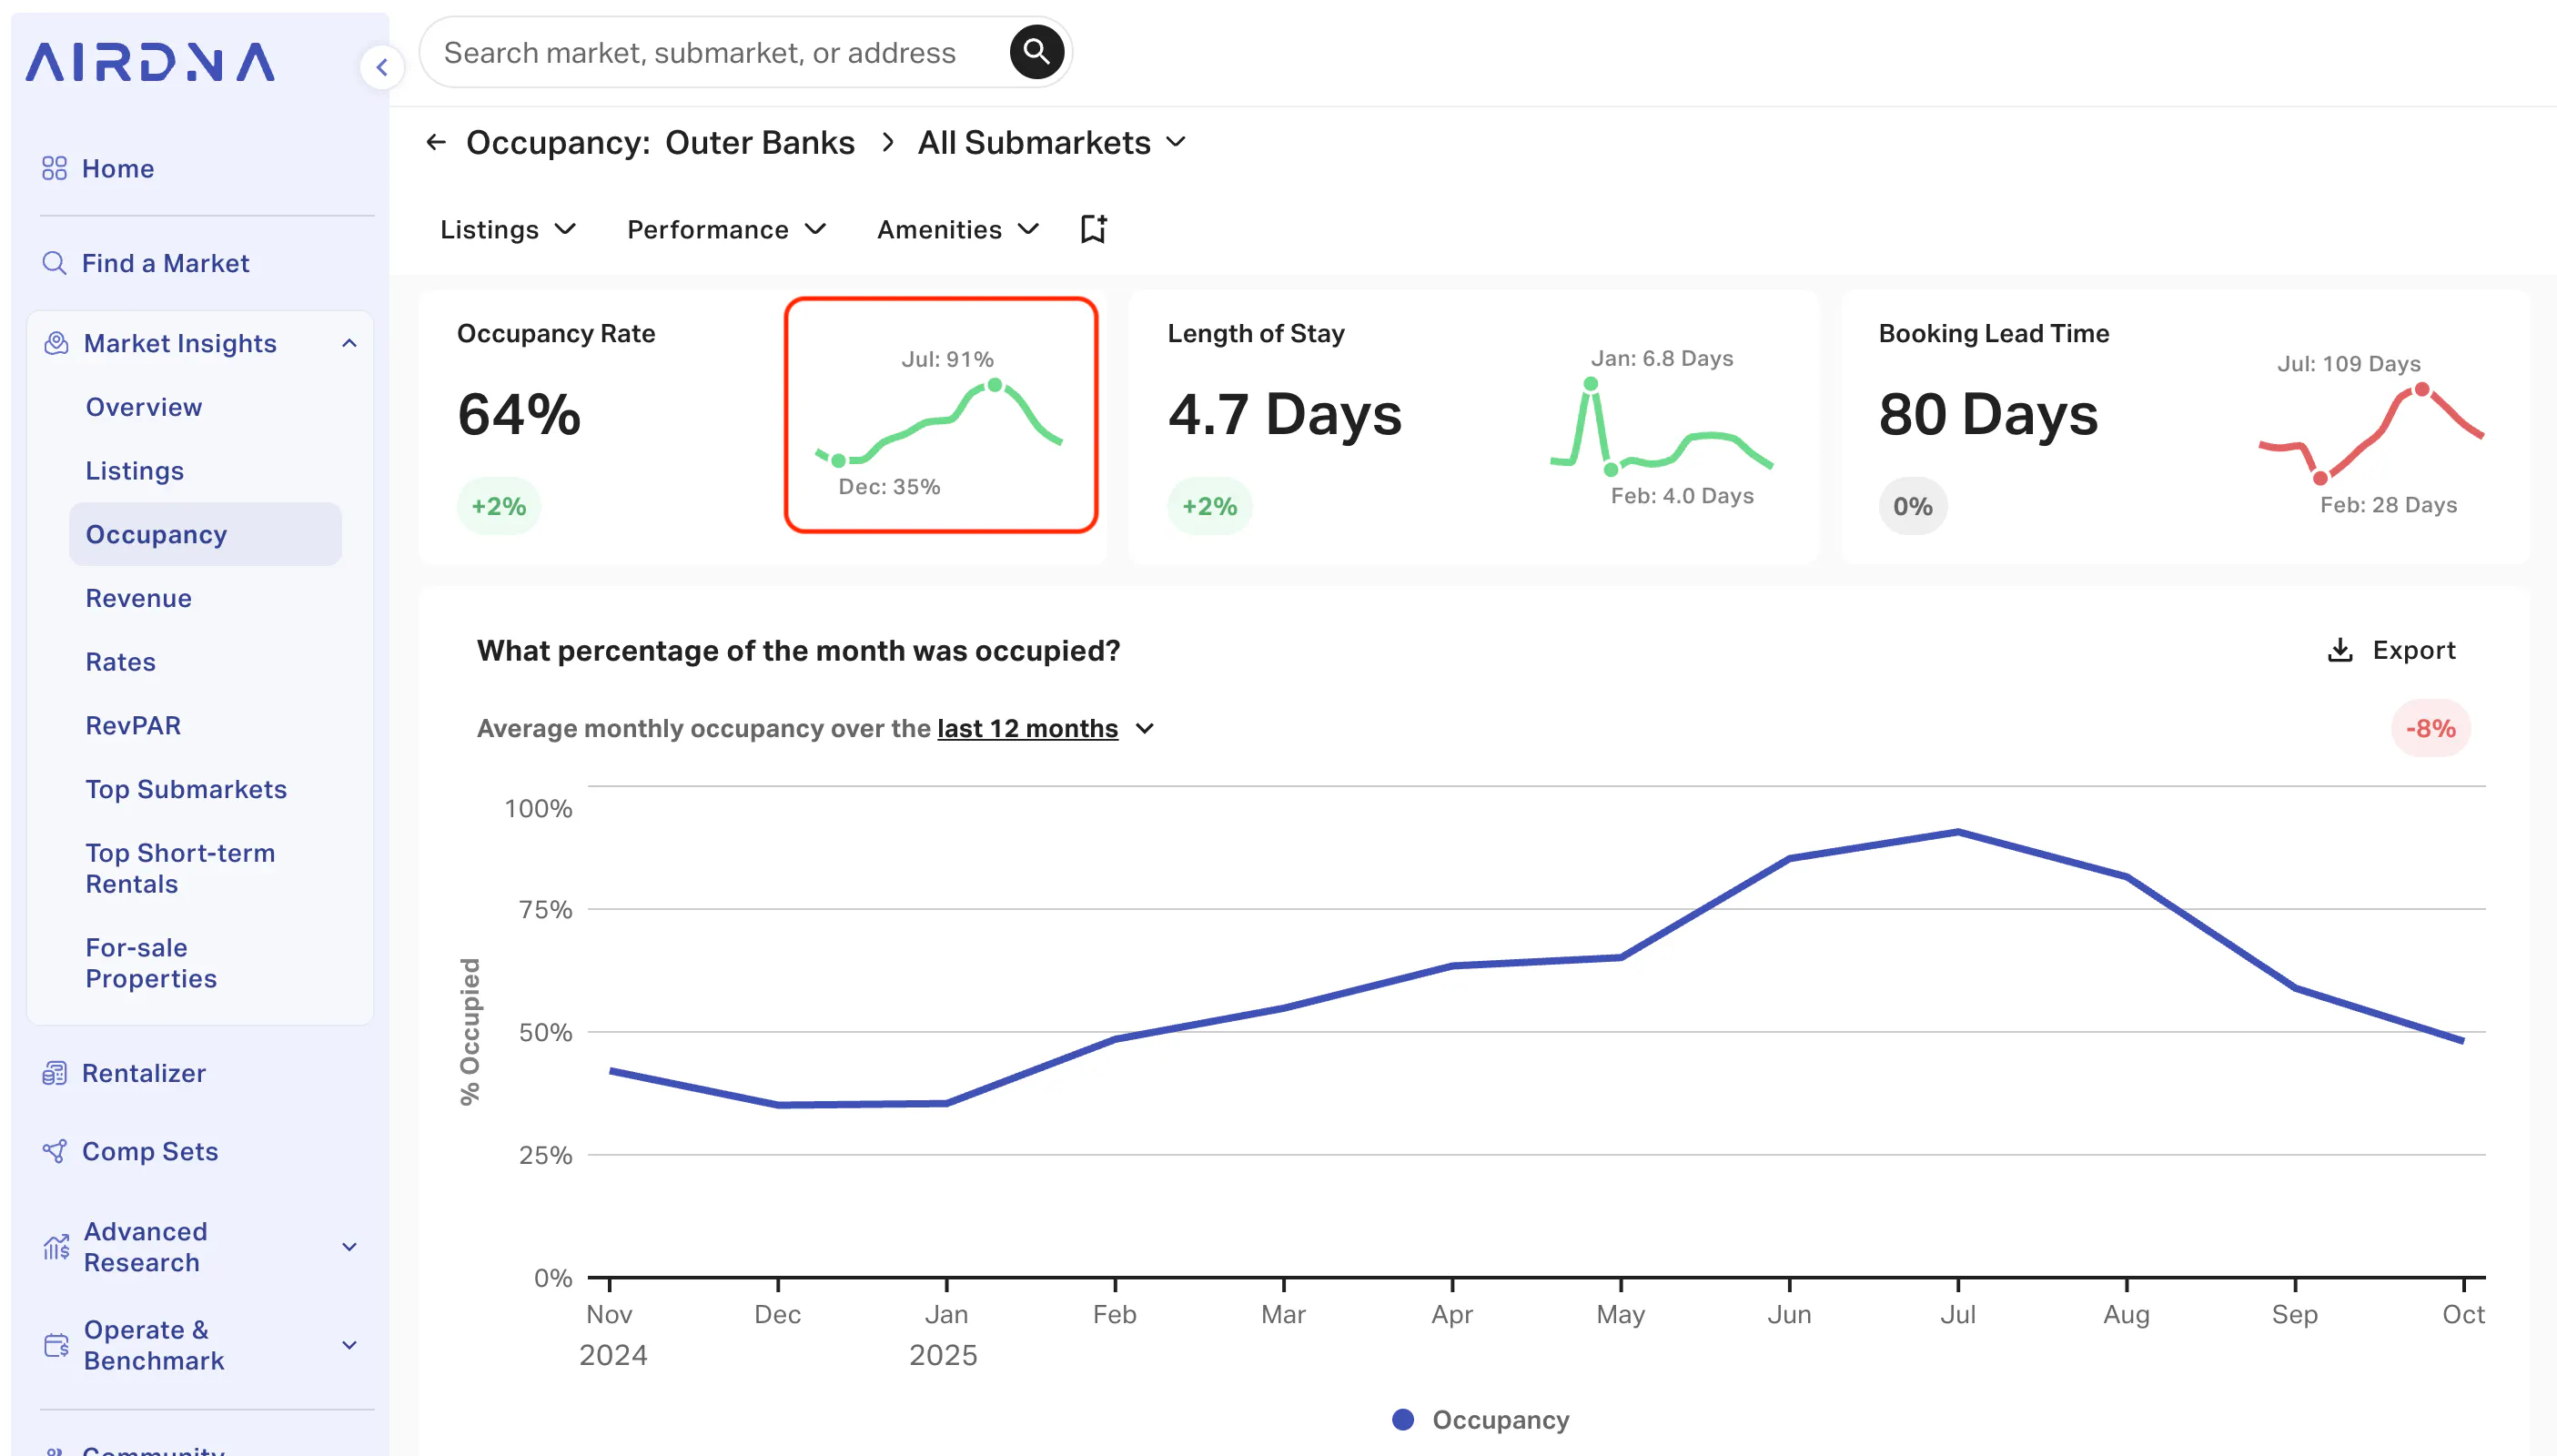
In short, Airbnb occupancy rate data is incredibly useful, but it becomes more powerful when viewed in context. Averages are just the headline. The real insight comes from knowing what’s happening underneath.
Driving Factors for Airbnb Occupancy Rates
Occupancy isn’t just about being in a popular location. How often a listing gets booked is influenced by a mix of market conditions, property features, and host decisions. Here are some of the key factors that shape Airbnb occupancy rates:
Market demand
Tourism hotspots, cities with steady business travel, and areas with frequent events or conventions tend to have stronger demand. The more reasons people have to visit, the more likely your calendar is to fill up.
Property type and amenities
Not all listings perform equally. A well-styled one-bedroom with the right amenities can outperform a larger, less equipped home. Details like pet-friendliness, dedicated workspaces, or a hot tub can also push occupancy higher, especially in competitive markets.
Seasonality and local events
Timing matters. Some markets boom in the summer or during ski season, then slow down for months. Others spike around major festivals, school breaks, or long weekends. Understanding these seasonality patterns helps you plan for occupancy highs and lows.
Pricing strategy and minimum stays
Price too high, and you may miss bookings. Price too low, and you leave money on the table. Pricing tools and strategic minimum night settings can all influence how often your place gets booked and for how long.
Local regulations
Short-term rental regulations vary widely by market. People often make the mistake of thinking local regulation just determines whether you can or cannot operate an STR. Some areas allow vacation rentals but within strict guidelines that limit the number of nights you can host, enforce a minimum length stay, require licensing, and more. Different types of regulation shape occupancy patterns in ways that aren’t immediately obvious.
In some markets, stricter rules reduce the number of active listings, which can inflate occupancy rates among the properties that remain. In other markets, regulations may have the opposite effect by limiting flexibility, constraining availability, or making it harder for hosts to optimize pricing, which can drive occupancy down.
This is why it’s so important to pair occupancy data with regulatory research when evaluating a market.
How to Look Up Airbnb Occupancy Rates by City with AirDNA
You don’t need to guess how often listings are getting booked. With AirDNA, you can explore Airbnb occupancy rates by city, neighborhood, and even by specific property. Whether you're comparing markets or evaluating one address, here’s how to get a closer look at Airbnb occupancy rates.
1. Browse and compare market data
If you’re still deciding where to invest in a short-term rental, start with the big picture.
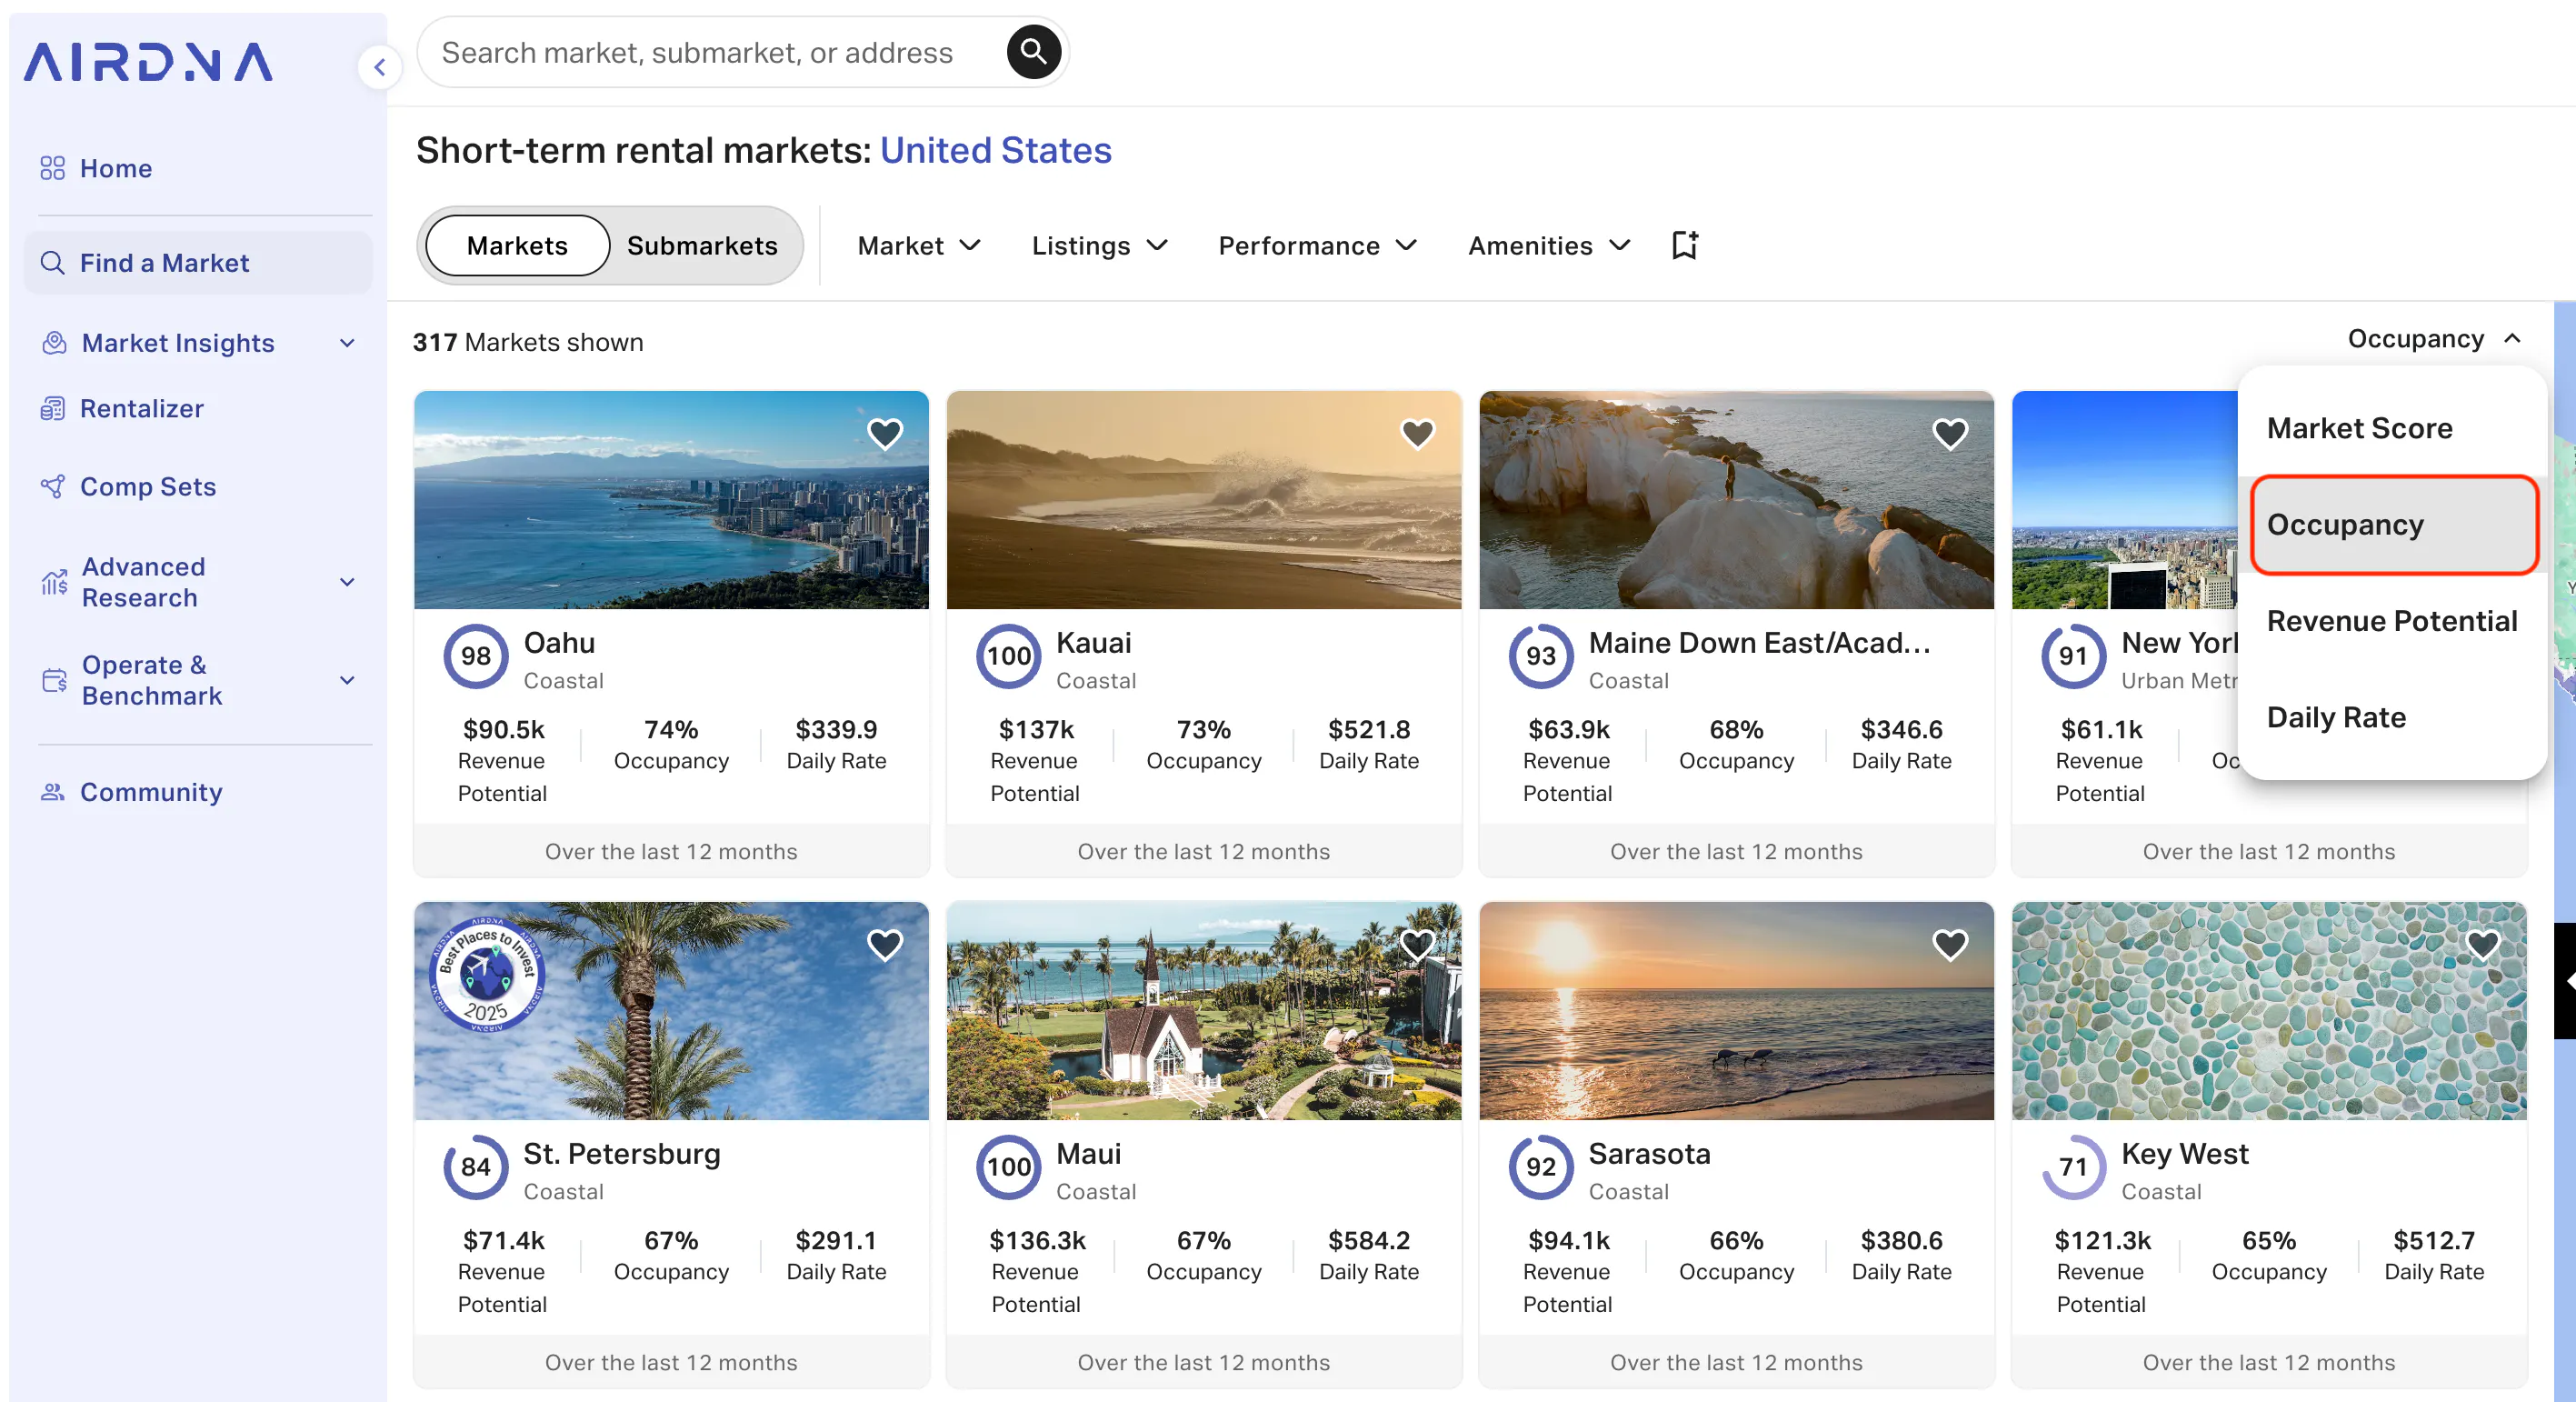
From the Find a Market page, you can sort markets by occupancy rate. This lets you quickly spot the areas with the most consistently booked listings. You can also zoom in further to look at smaller areas within a city (like neighborhoods or districts) for a more detailed view of demand. These are called submarkets and you can browse those as well.
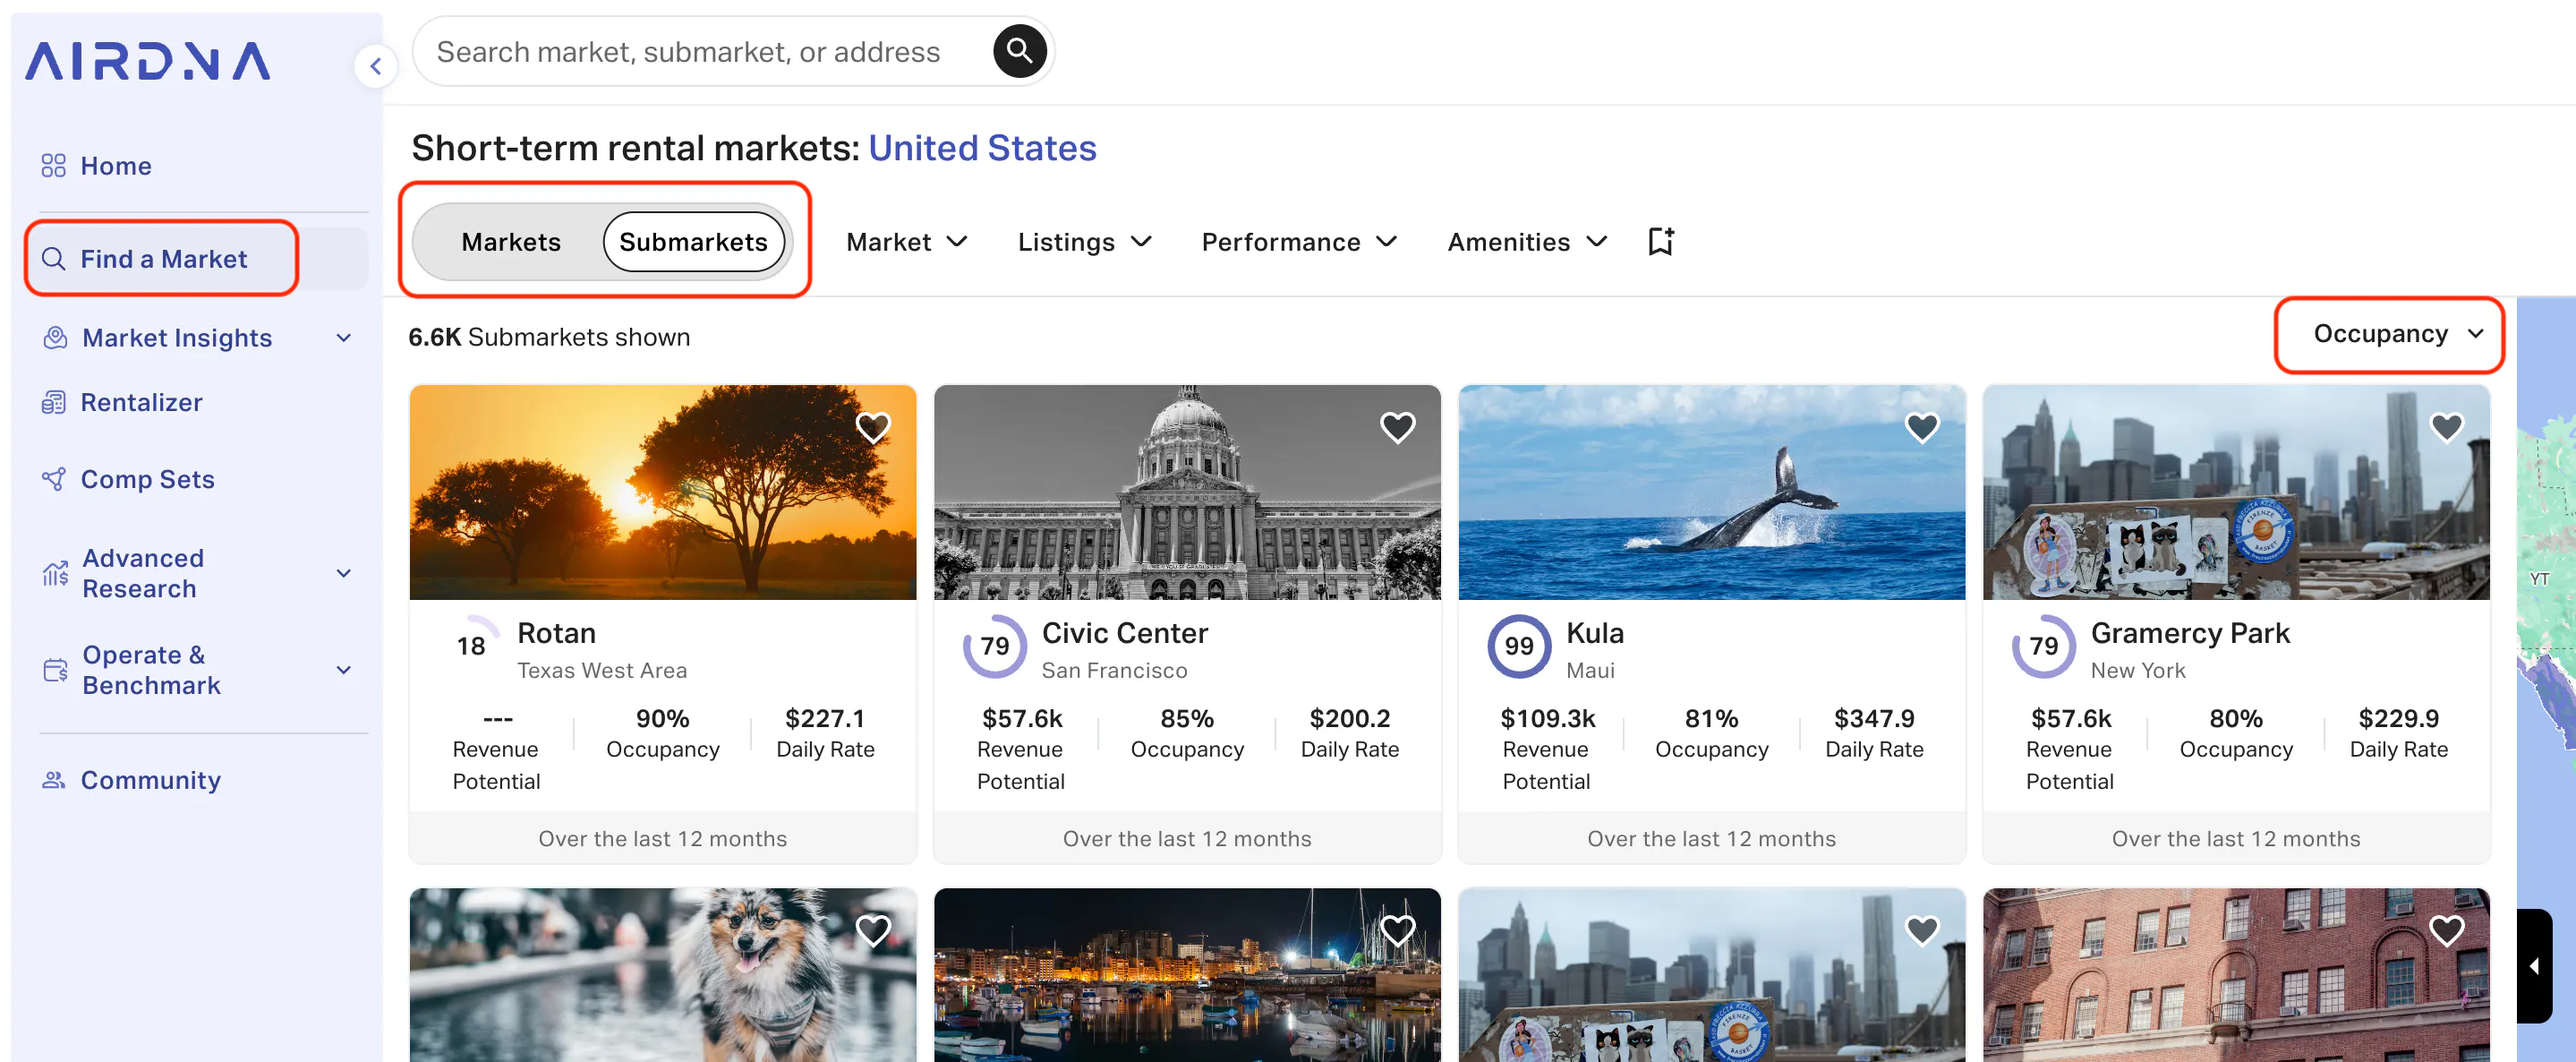
You can also view curated, ranked lists based on your specific interests:
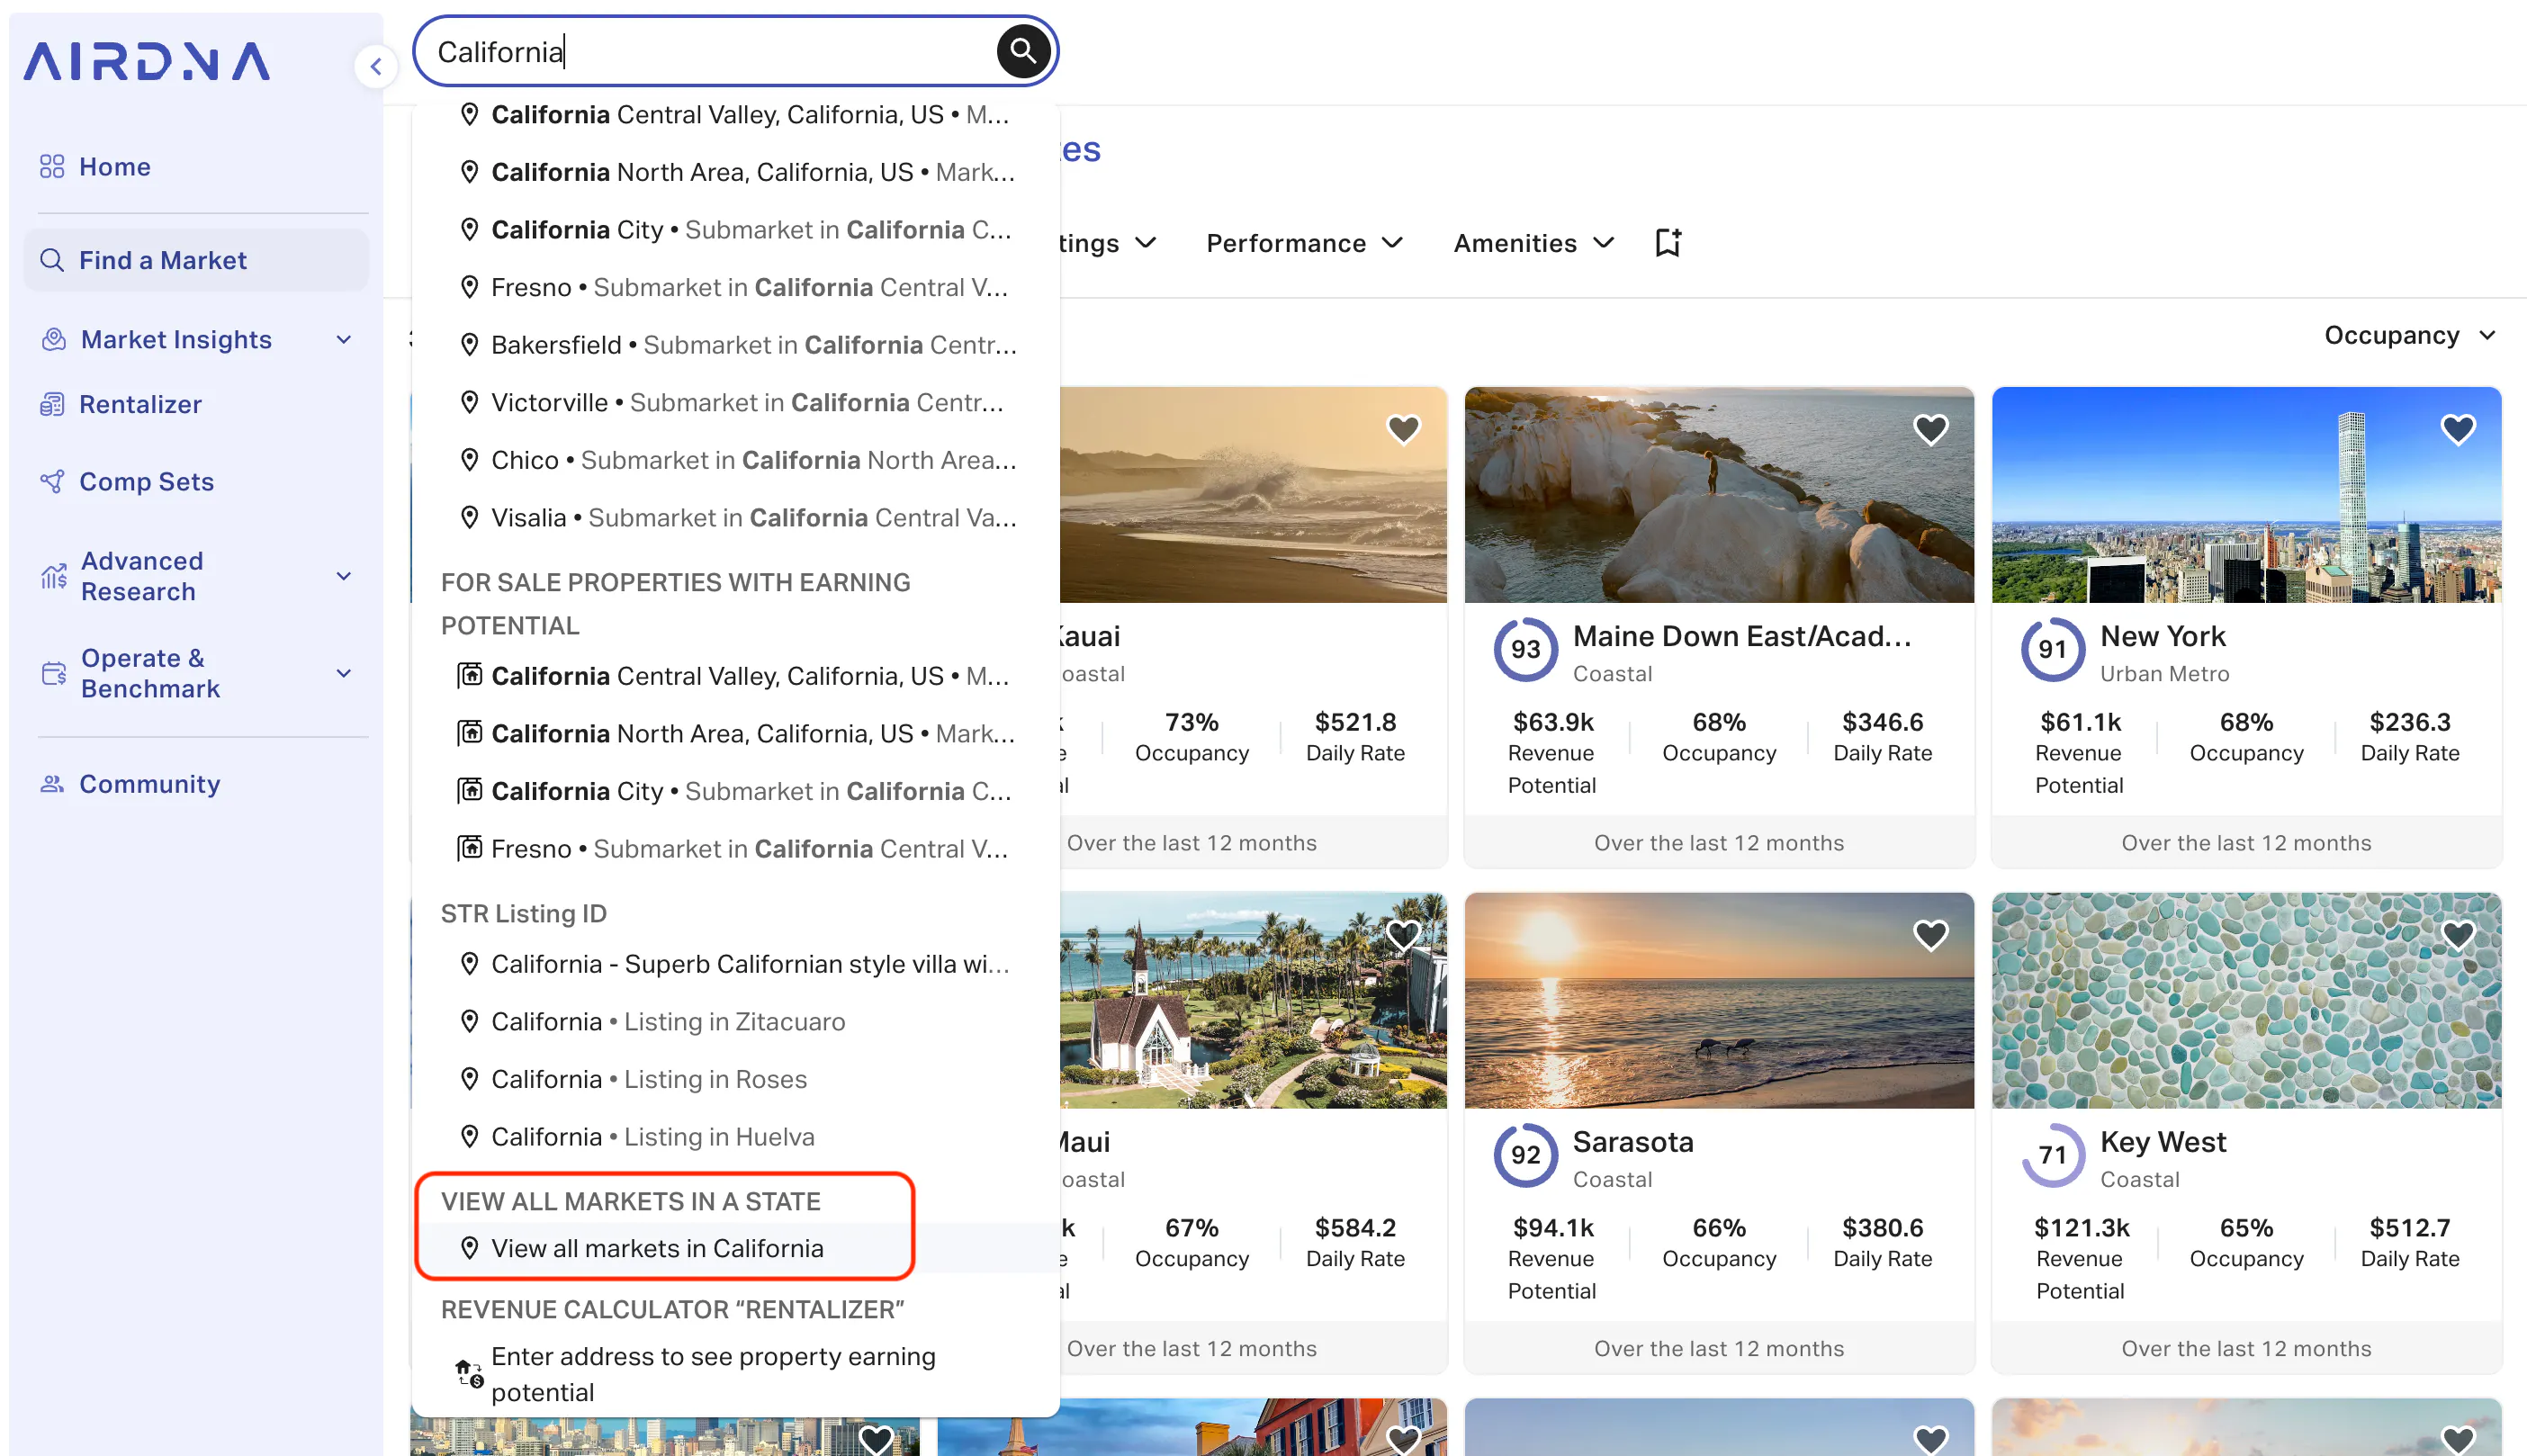
Looking within a specific state? Type your state into the search bar and scroll down until you see the option to “View all markets in [state name].”
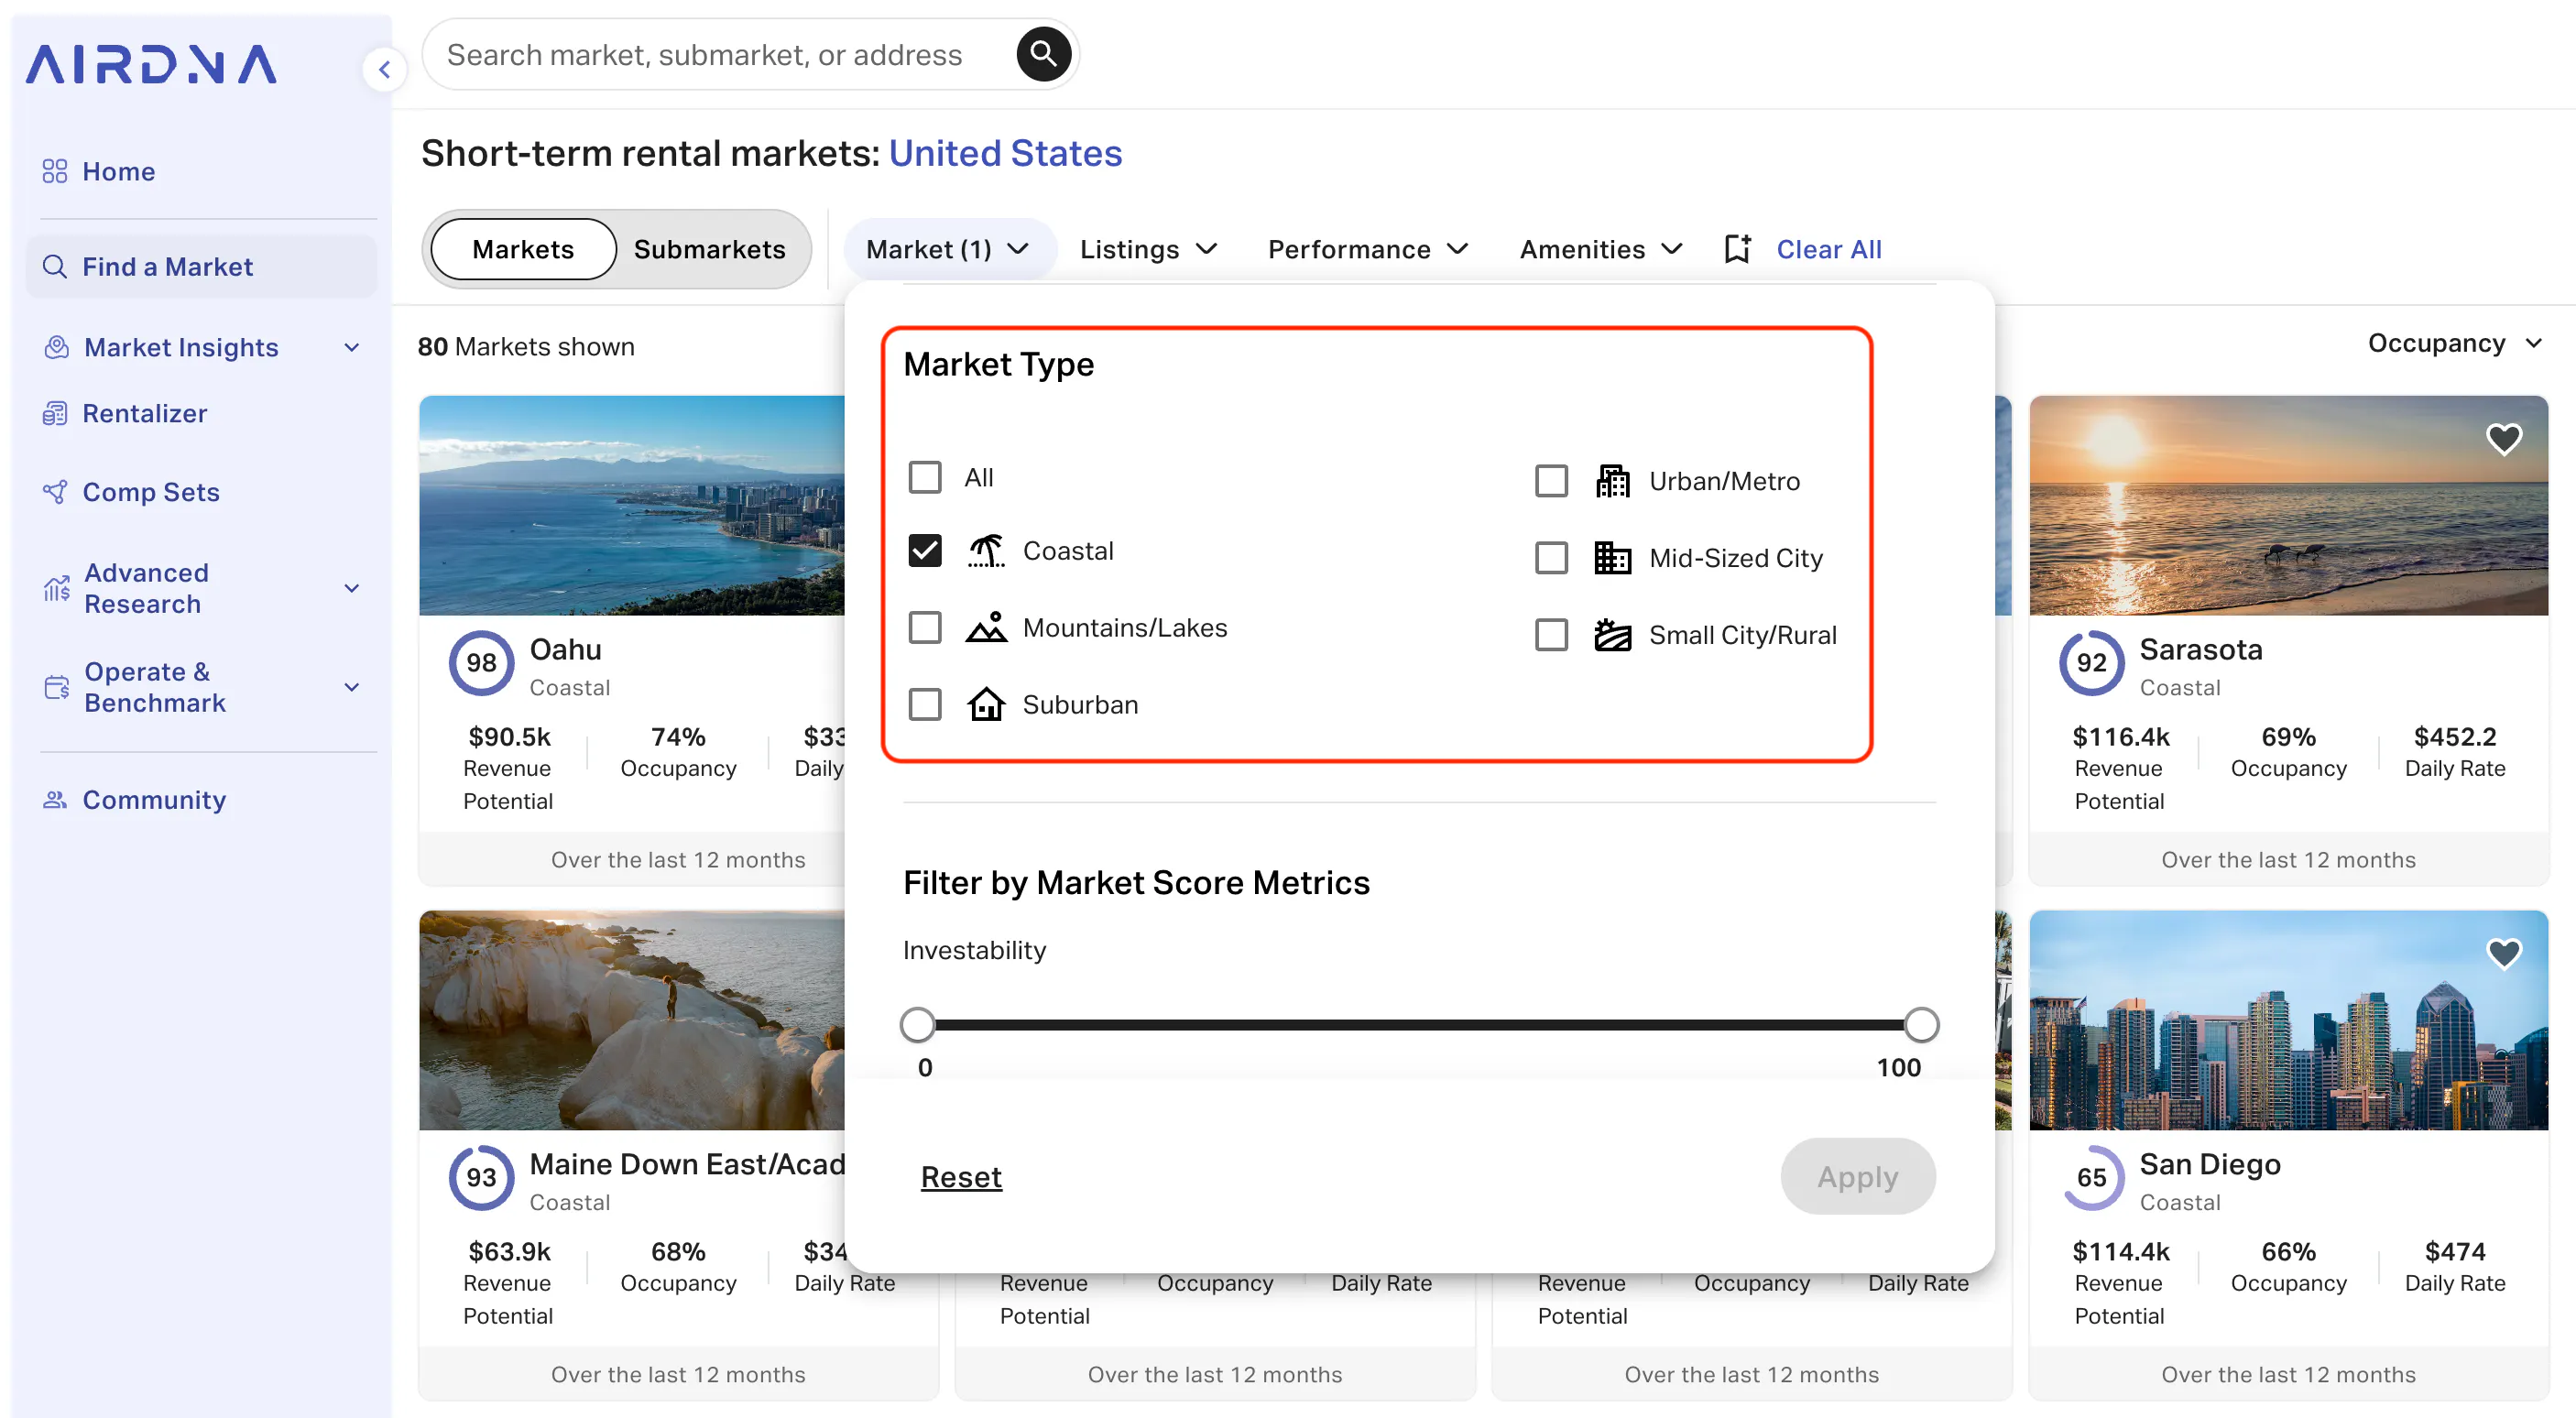
Know the vibe but not the zip code? Use the Market Type filter. If you know you’re drawn to a certain kind of destination (like beach towns, mountain getaways, or small cities), you can narrow your results to see where that market type is performing best. For example, filtering by coastal markets instantly highlights where beach rentals are seeing strong occupancy.
Once you've identified a few promising markets, dive into the Occupancy tab within Market Insights. This gives you a deeper look at demand, including:
- Monthly occupancy trends
- Booking lead time (how far in advance guests book)
- Average length of stay
- Occupancy by bedroom count
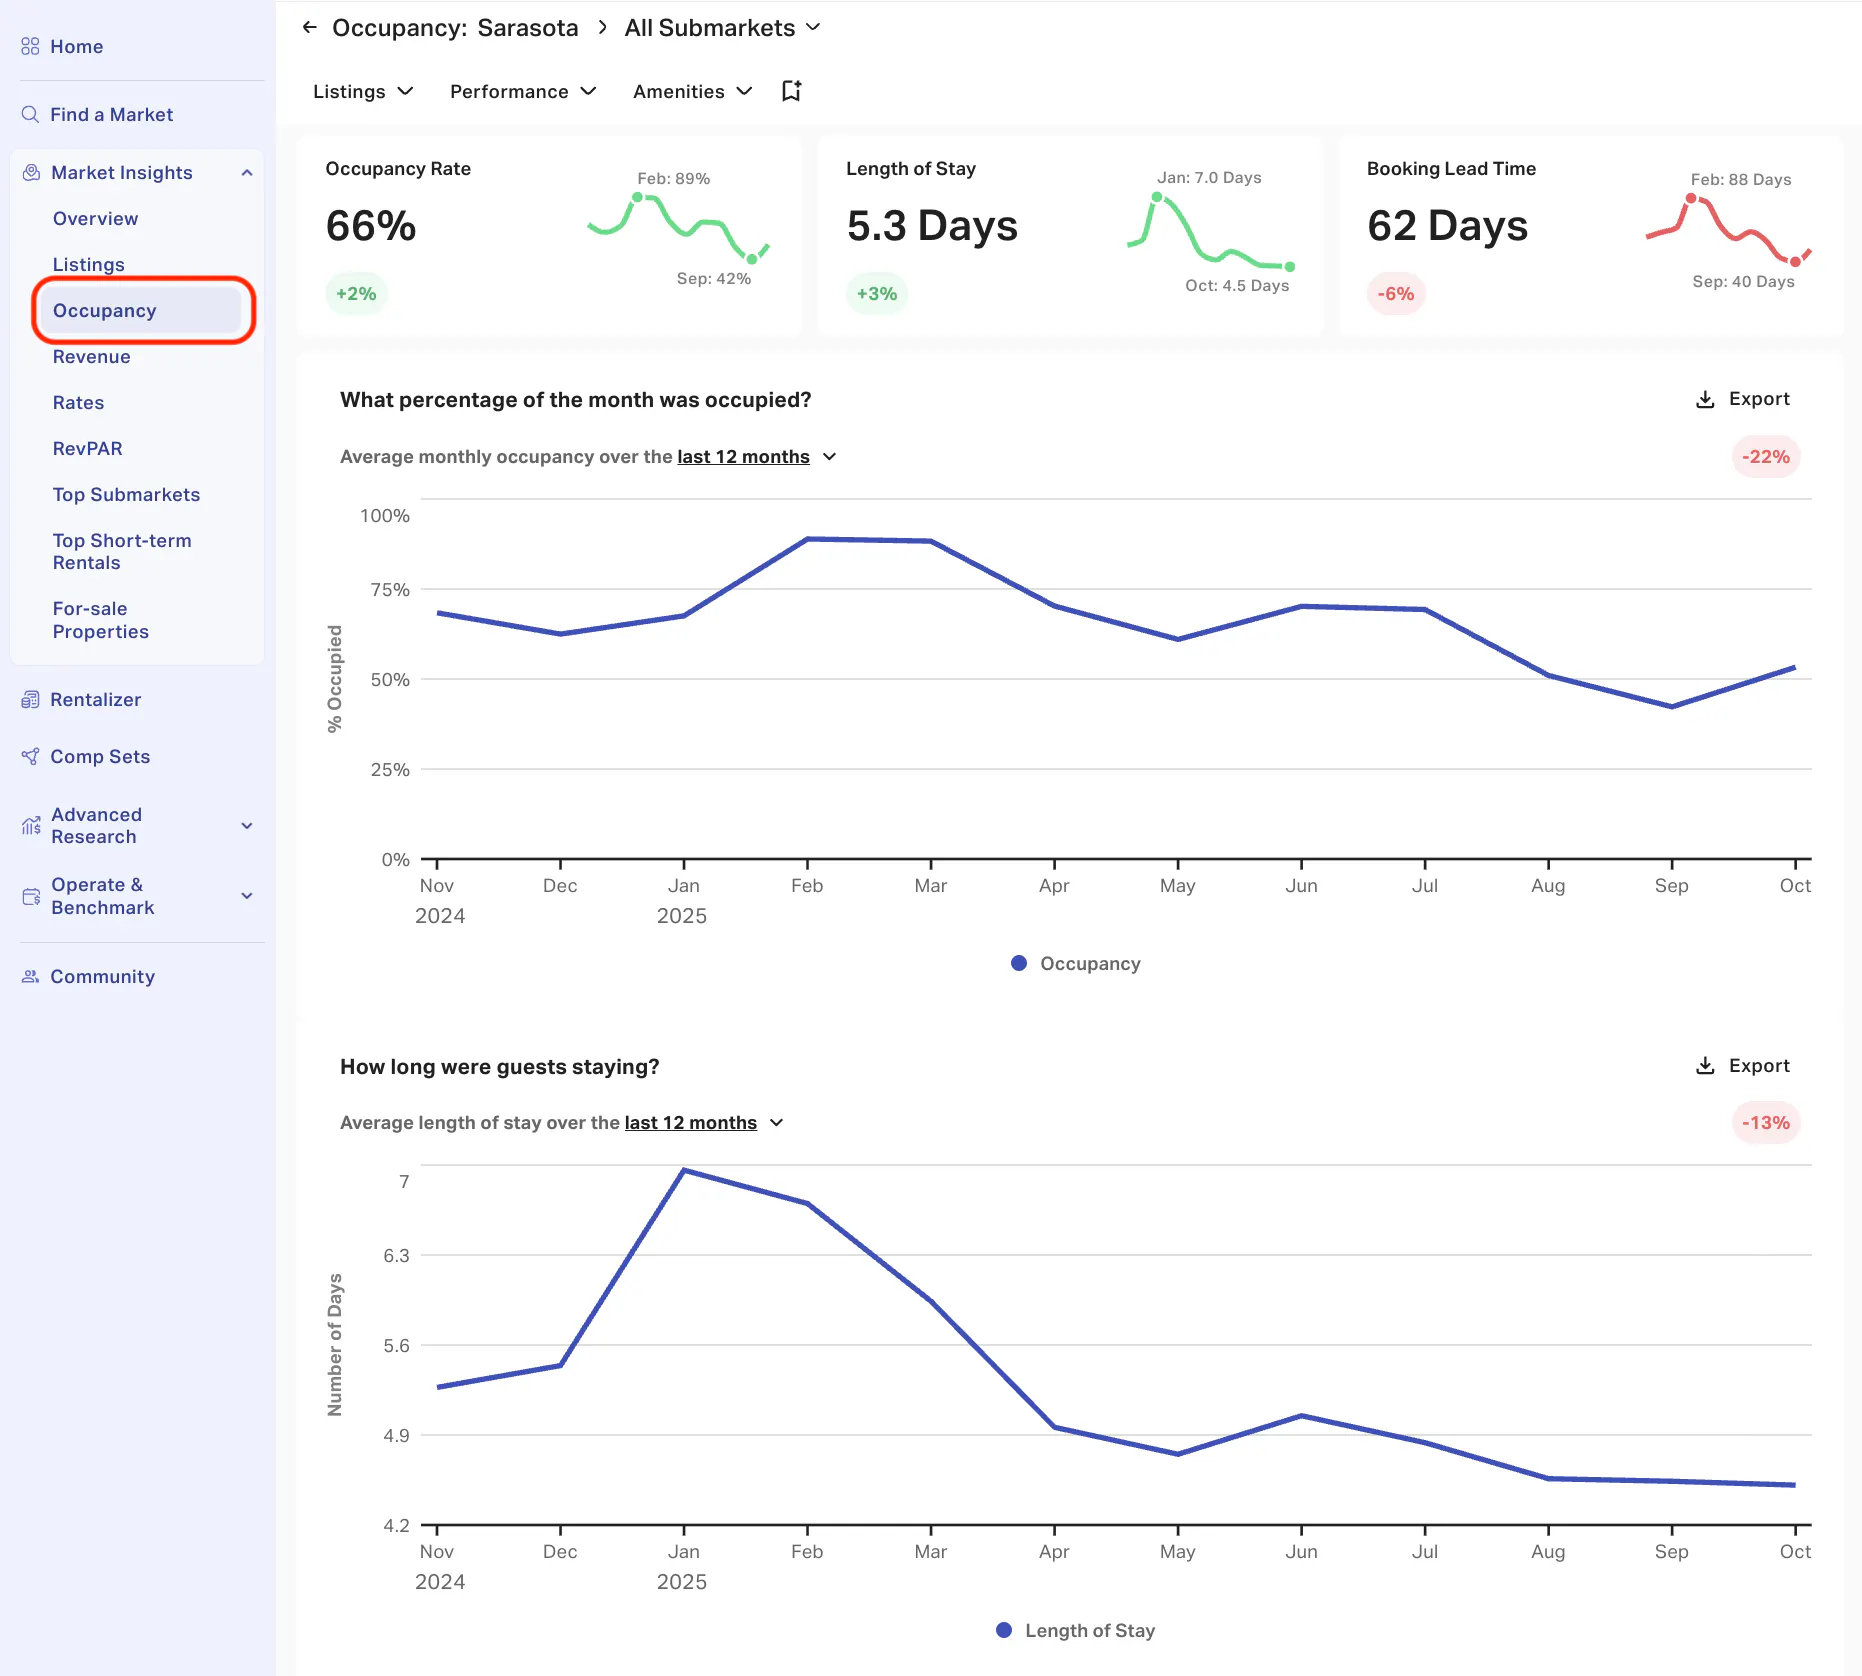
These details help you get a feel for not just how often properties are booked, but when, for how long, and what kinds of listings are driving the trends.
For a deeper look at using occupancy trends to evaluate a market, explore our article on occupancy rates and market valuation.
2. Get occupancy projections for a specific property
Once you’ve found a market that looks promising, it’s time to get more specific. This is where you go from exploring the big picture to digging into what a particular property might actually earn.
Head over to the Rentalizer dashboard (also called the Airbnb calculator).
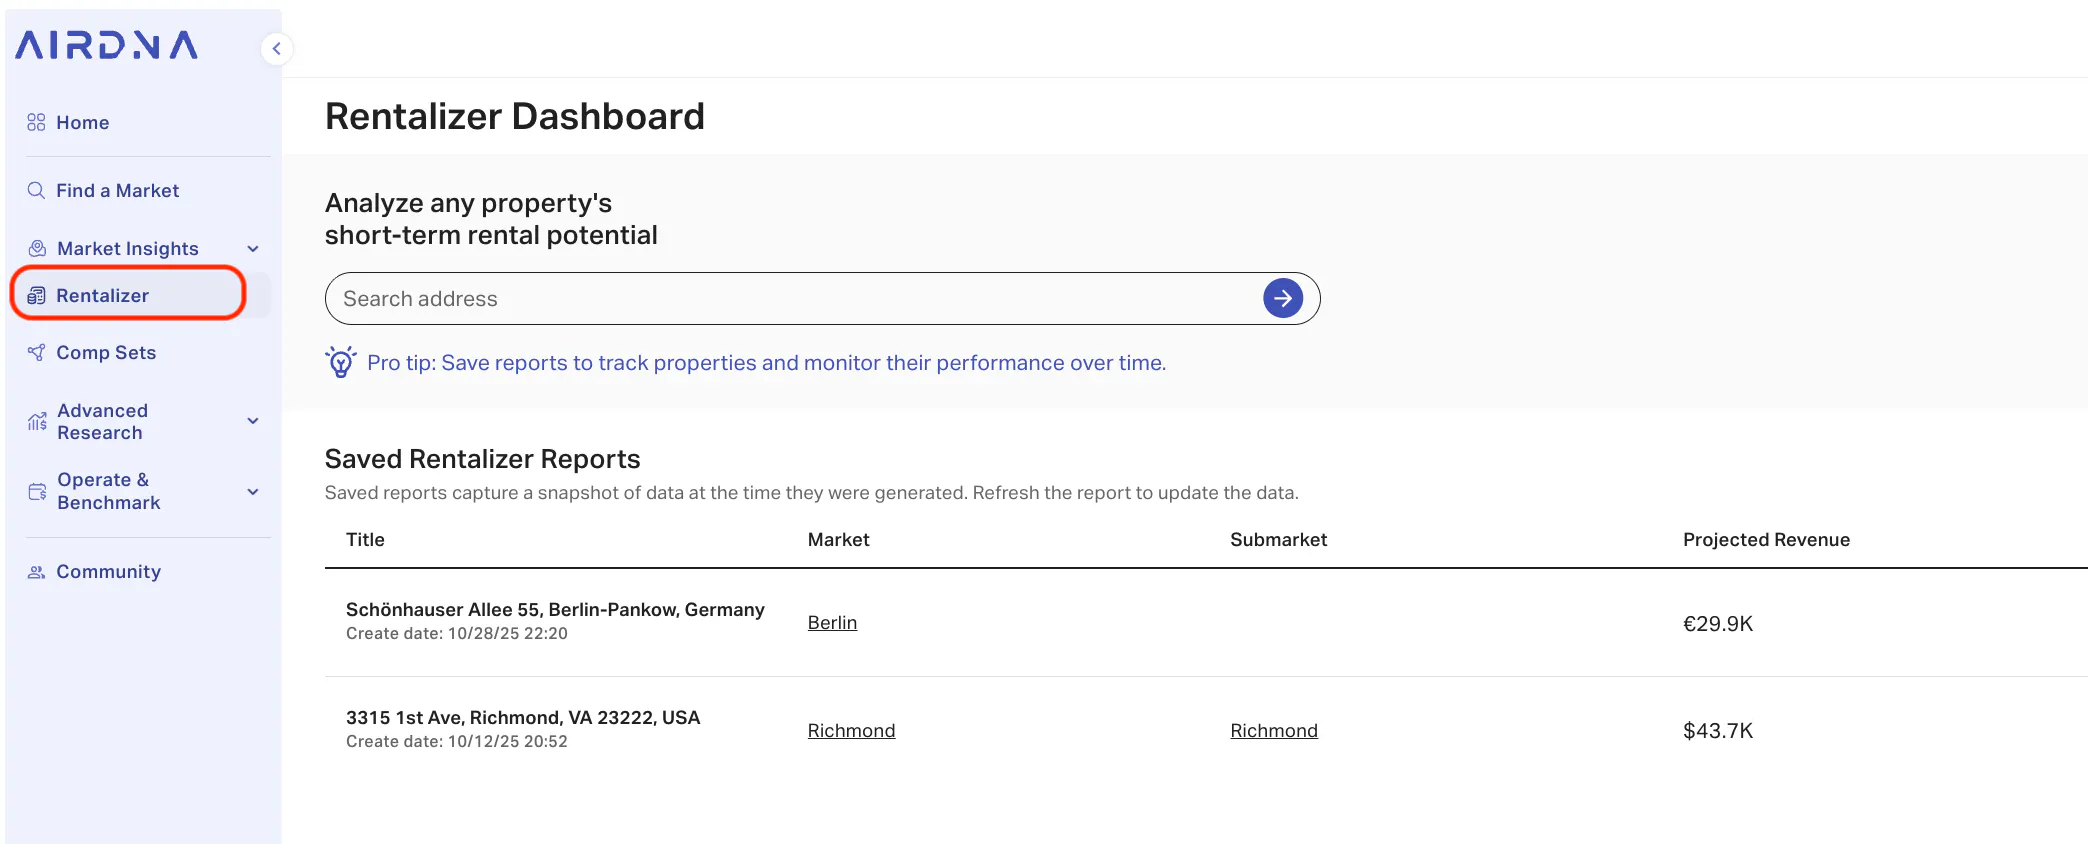
Enter the address of a property you're considering. The Airbnb calculator will then put together a property earning potential report based on how similar active short-term rentals in that area are performing. The report includes a projection for the average occupancy rate.
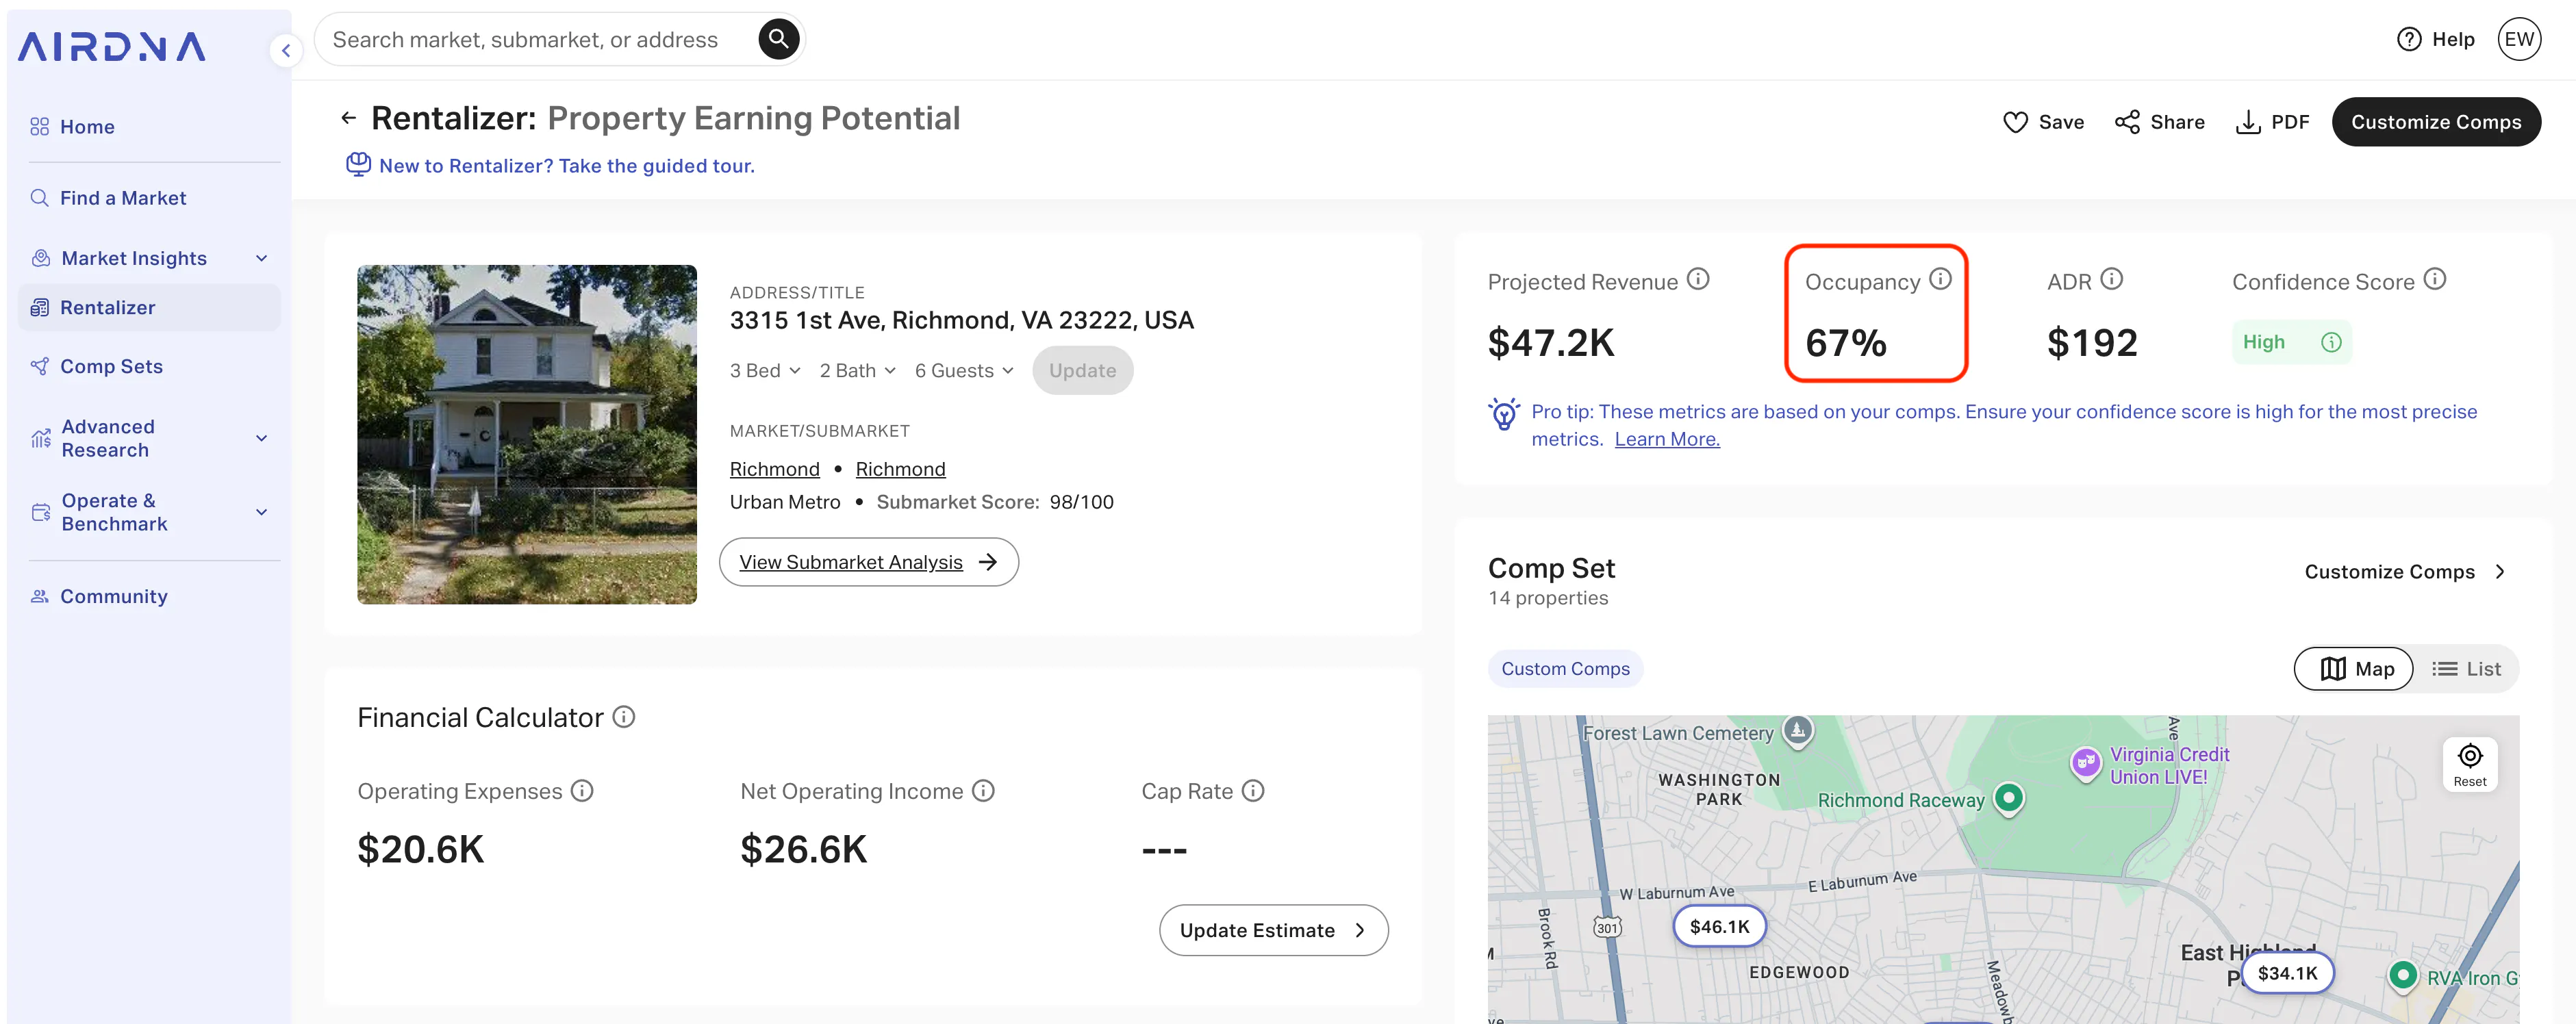
To make that estimate even more accurate, you can customize your comp set. That means choosing which nearby listings you want your property to be compared against. Opening the Manage Comps view allows you to see the occupancy rate for each property in your comparable set.
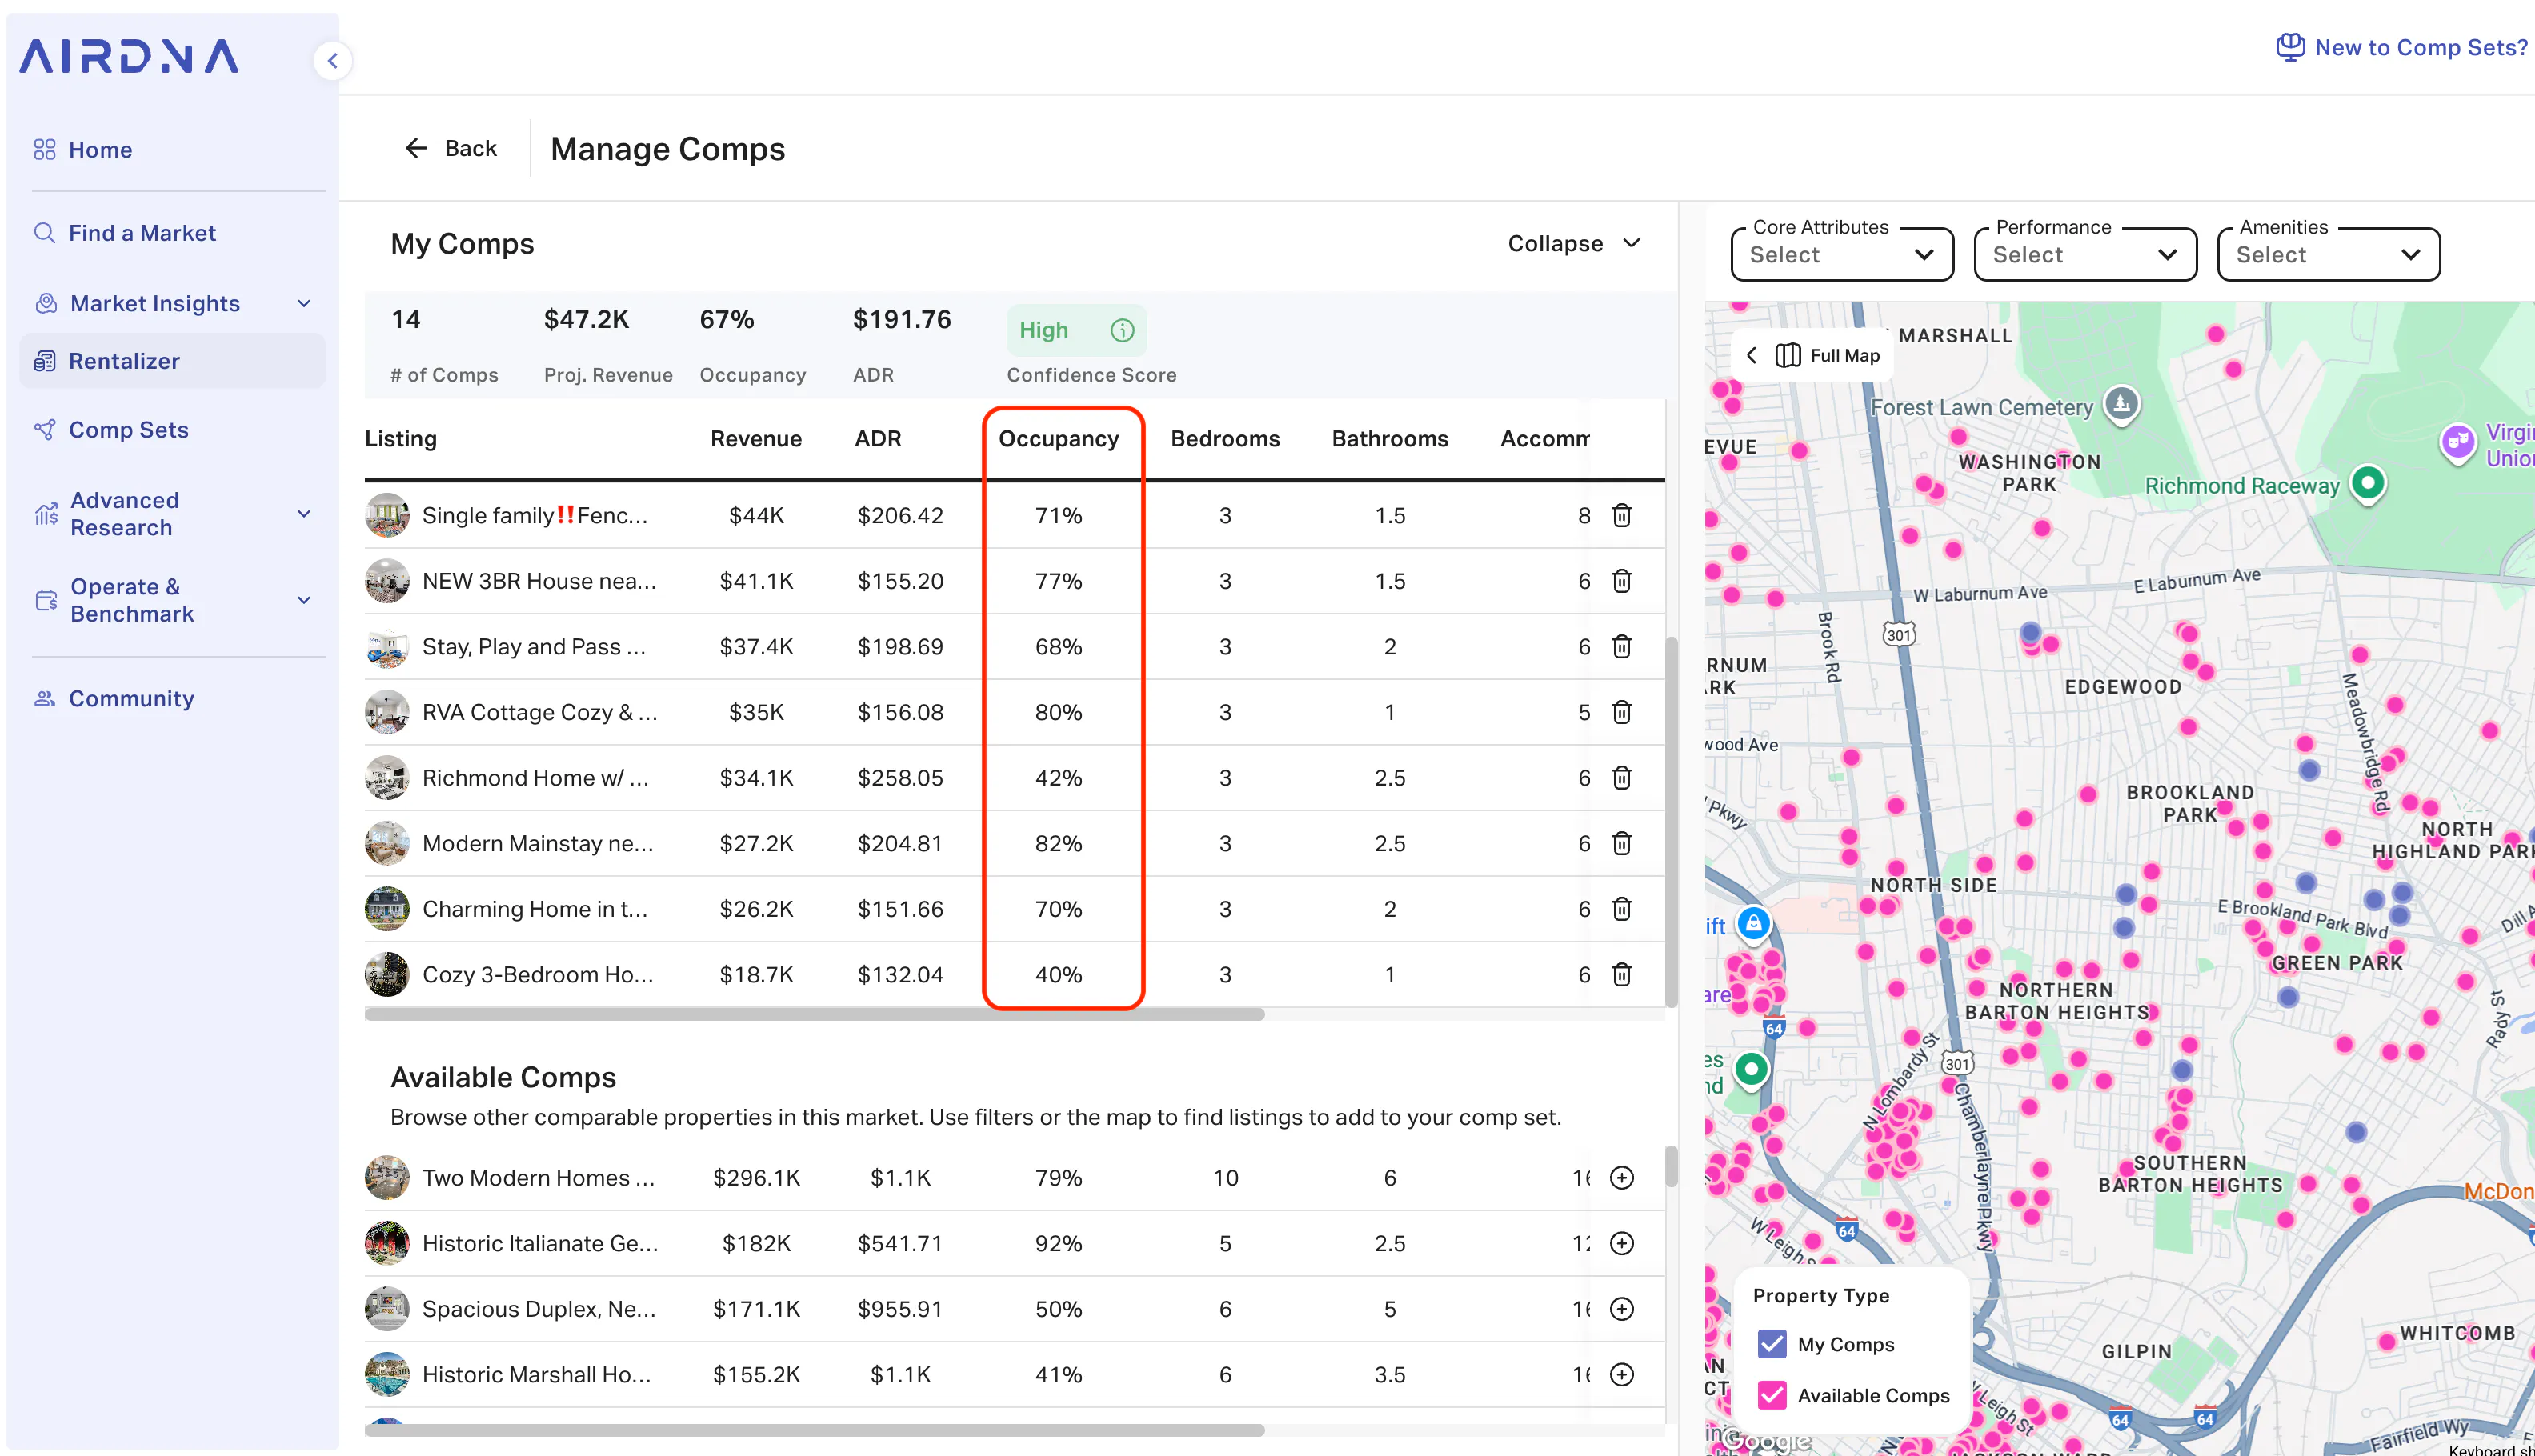
This is where the details start to matter. Most of those listings will have the same number of bedrooms, but some will have noticeably higher occupancy than others. That gives you a chance to figure out what’s working and what’s not. Are they in a busier part of the neighborhood? Do they have features that guests love, like a hot tub, a workspace, or a great view?
Looking at both market trends and individual property performance gives you a much clearer picture of what to expect, so you can make decisions based on real data, not just gut feeling.
FAQs
What’s considered a “good” Airbnb occupancy rate?
A “good” Airbnb occupancy rate varies by market, Airbnb property type, and season. Many U.S. markets average around 50–70%, while high-demand vacation destinations may reach 75% or more. However, occupancy alone doesn’t determine success. It’s only one part of the picture.
What matters more is how your occupancy rate interacts with your nightly price (ADR) and what that means for your overall revenue. A property with slightly lower occupancy but a strong ADR can outperform one that’s booked more often. The goal is to find the right balance between how frequently you’re booked and how much you earn per night, which is why Revenue Per Available Rental (RevPAR) is such an important metric as well.
What are the top cities with the highest Airbnb occupancy rates?
Airbnb occupancy rates vary by season and demand, but consistently high-performing markets include major leisure destinations like beach towns, national park regions, ski areas, and large urban hubs. Cities with historically strong Airbnb occupancy rates include places like Miami, San Diego, Honolulu, Gatlinburg/Pigeon Forge, New Orleans, and New York City, but performance can shift based on events, regulations, and seasonality.
Where can I find free Airbnb occupancy rate data?
You can access free Airbnb occupancy rate data using the AirDNA Airbnb Calculator, which provides estimated occupancy rates, revenue potential, and average nightly rates for any address or market. The calculator uses AirDNA’s industry data to give you a quick, high-level view of performance.
For deeper or month-by-month occupancy trends, you can upgrade your AirDNA account, but the free Airbnb calculator is the easiest way to get reliable occupancy insights instantly.
How do I interpret my own Airbnb occupancy rate?
Interpret your occupancy rate in context. Compare it against:
- Property size (one-bedrooms behave differently than large homes)
- Nightly rate (ADR)
- Location and demand seasonality
- Local competition
For example, a small cabin at 65% occupancy in the Smoky Mountains might outperform a 75% condo in Miami once ADR and operating costs are factored in.
This is why evaluating occupancy alone can be misleading. You need occupancy plus revenue metrics to understand true performance.
How do I improve my Airbnb occupancy rate?
To increase your Airbnb occupancy, focus on the factors most travelers use to choose an Airbnb listing:
- Competitive pricing based on real-time market demand
- High-quality listing photos
- Clear amenities and standout features
- Flexible cancellation or check-in options
- Strong guest reviews and a great guest experience
- Updating seasonal pricing (avoiding overpricing in slow months)
- Optimizing your title and description for search visibility
Consistently refreshing your listing and adjusting rates to match market trends are two of the biggest drivers of occupancy improvement.
ARTICLE SUMMARY
Looking for the hottest Airbnb markets right now? We’ve ranked the top U.S. and global markets with the highest Airbnb occupancy rates. We’ll also show you how to check occupancy rates in any market with AirDNA.
Jamie Zhang
AirDNA Data Analyst
Jamie Zhang is a Data Analyst at AirDNA, leveraging her background in data science and analytics to uncover key trends in the short-term rental industry. Before joining AirDNA, she worked as a data analyst at Shanghai Disney, where she specialized in revenue forecasting and financial planning . She holds a Master’s degree in International Economics and International Relations from Johns Hopkins. Jamie enjoys cycling to explore different corners of the city.