What’s the Average Occupancy Rate on Airbnb?
Published: January 2, 2025
Last updated: May 6, 2026

Bram Gallagher
Key Takeaways
- The national average Airbnb occupancy rate in the U.S. is 54.3%, but that figure is only a starting point.
- High occupancy isn’t always the goal—maximizing revenue requires balancing occupancy with nightly rates.
- AirDNA provides detailed occupancy rate data at every level—from market-wide trends to submarket and property-specific insights.
Trying to figure out how many nights your Airbnb might actually get booked? The national average occupancy rate on Airbnb and Vrbo combined is 54.3%—but that number might be misleading you about your market's true potential.
Here's the thing about averages: they mask the huge variations that exist in real-world performance. Think about it: saying the average U.S. house price is $400,000 tells you almost nothing about what you'll actually pay in Beverly Hills, California versus Boise, Idaho.
The reality is that occupancy rates can swing dramatically from market to market. Some properties consistently hit 80% occupancy while others hover around 30%—and both could be performing perfectly well for their specific markets. Your booking calendar depends on everything from location and seasonality to property type and price point.
By the end of this article, you'll have a better grasp on how occupancy rates vary across U.S. markets and, more importantly, how to use AirDNA to find the real numbers that matter for your property or investment.
What Is the Average Airbnb Occupancy Rate?
The average occupancy rate on Airbnb and Vrbo in the United States over the past 12 months is 54.3%, a solid benchmark for short-term rental (STR) hosts to gauge their performance. However, this figure isn’t static—it fluctuates widely throughout the year due to seasonality.
January sees the lowest occupancy rates on a national scale, averaging 41.6%. Lower rates can be attributed to post-holiday travel slowing down and winter conditions that impact many markets.
Conversely, July marks the average peak of vacation season nationally, with occupancy rates climbing to an impressive 67.5%. This peak is driven by summer travel and family vacations.
Pro tip: Don't just look at the average occupancy rate by city when planning your strategy—dig deeper into seasonal patterns. Even top-performing markets see significant fluctuations throughout the year. The most successful hosts analyze these seasonal trends and adapt accordingly, whether that means running off-season promotions or targeting specific guest segments like remote workers during traditionally slower periods.
Occupancy Rate Definition
At its core, the occupancy rate measures how effectively a short-term rental is booked over a given period. The formula is straightforward:
(Nights Booked ÷ Available Nights) × 100
For example, if your property is available for 30 nights in a month and booked for 18, your occupancy rate would be 60%.
Occupancy rate is a key performance indicator (KPI) for Airbnb hosts. A high occupancy rate typically signals strong demand, competitive pricing, and a well-performing listing. However, it’s not just about keeping your calendar full—it’s about balancing occupancy with nightly rates to maximize revenue. For instance, lowering your rates to achieve full occupancy might result in lower overall earnings, while strategic pricing can boost revenue even with fewer bookings.
Our complete guide to occupancy rates explains everything you need to know about calculating and interpreting occupancy rates.
Factors Affecting Airbnb Occupancy Rates
Airbnb occupancy rates aren’t determined solely by location—they’re influenced by a range of factors that can either increase or limit your booking potential.
Property type
The type of dwelling you're renting out can significantly impact your occupancy patterns. Apartments and condos often see different booking trends than single-family homes, particularly in urban markets where proximity to attractions and business districts can drive steady bookings.
When comparing listing sizes, studios have the highest national average occupancy at 56.4%, followed closely by 1 and 2-bedroom properties (56%). Average occupancy skews even higher for budget and economy listings of that size.
Price point
One of the most significant factors affecting occupancy is your pricing tier. Our data shows budget-friendly properties tend to stay busier, achieving an average national occupancy rate of 58.5%, while luxury properties typically see lower occupancy at 50.7%. This makes sense when you think about it—there's usually a larger pool of potential guests for more affordable stays.
Amenities
The right amenities can significantly boost your occupancy rates—but what works best depends on your market and target guest. Urban properties often see higher occupancy with business-friendly features like fast WiFi and workspaces, while vacation rentals might benefit more from pools and outdoor entertainment areas. Consider both year-round amenities, like a washer and dryer, that consistently drive bookings and seasonal features, like a hot tub or pool, that can help smooth out occupancy fluctuations throughout the year.
Other key factors
Several other characteristics can influence your occupancy rate:
- Review scores and Superhost status
- Instant Book settings
- Minimum stay requirements
Understanding how these factors affect occupancy in your specific market can help you make strategic decisions about your property—from pricing strategies to amenity investments. The key is to look at how properties similar to yours perform in your market through a comp set, rather than trying to hit a universal "good" occupancy rate for Airbnb.
What these statistics tell us
While a high occupancy rate might seem like a surefire sign of a strong market, it’s not the only metric that matters. Consider these nuances:
High occupancy ≠ guaranteed profitability
For instance, Maui boasts one of the highest national occupancy rates at 67%. However, it has a Market Score of only 58. Market Scores reflect the strength of an STR market on a scale of 0 to 100. This contrast between occupancy average and Market Score reflects challenges like low revenue growth and a tough regulatory environment.
Moderate occupancy can be lucrative
On the flip side, Joshua Tree has an occupancy rate of 52%—below the national average—but a perfect market score of 100, suggesting excellent profitability and demand growth.
Airbnb Statistics by City
Short-term rental markets across the U.S. show wide variations in average Airbnb occupancy rates by city, reflecting local demand, seasonality, and market characteristics.
Here’s a snapshot of occupancy performance for the top 9 STR markets by number of active monthly listings:
- Orlando, Florida: 59% (46 submarkets)
- Los Angeles, California: 60% (171 submarkets)
- Phoenix/Scottsdale, Arizona: 58% (44 submarkets)
- Miami, Florida: 58% (40 submarkets)
- Myrtle Beach, South Carolina: 58% (7 submarkets)
- New York, New York: 63% (83 submarkets)
- San Diego, California: 63% (80 submarkets)
- Atlanta, Georgia: 49% (78 submarkets)
- Pigeon Forge/Gatlinburg, Tennessee: 61% (4 submarkets)
City-wide averages only tell part of the story. Major markets contain dozens of distinct submarkets—Los Angeles alone spans 171 of them—each with unique occupancy patterns. You need to look at Airbnb occupancy rates on a more granular level to truly understand your market's potential because performance can vary significantly even between neighboring areas.
Using Los Angeles as an example, the average occupancy rate for distinct submarkets varies significantly for the market-wide average of 60%. In fact, there are 13 submarkets with occupancy averages that exceed than 70%, with Cypress Park (79%), Exposition Park (78%), and Elysian Park (78%) leading the way.
Up next, we'll show you how to use AirDNA's Market Explorer to analyze submarkets as we just did for Los Angeles, helping you make more informed decisions about your short-term rental strategy.
How to Find Airbnb Occupancy Rates
Looking for occupancy data? You have two powerful options at your disposal—let's walk through both.
How to find your property’s occupancy data on Airbnb
Start with your own performance data right on Airbnb:
1. Select Menu from the top navigation bar
2. Click Insights
3. Under Performance, find Occupancy & rates
4. View your average occupancy rate at the top of the page
How to find occupancy data with AirDNA
While Airbnb provides basic occupancy data for your own listing, understanding your true performance potential requires a much deeper level of market intelligence. That's where AirDNA comes in. Our tools help you analyze occupancy rates from multiple angles—from broad market trends to granular property-level insights—giving you the complete picture you need to make informed decisions.
Airbnb occupancy rate by market
When you first open Market Explorer, you'll see a search bar at the top of the page. Let's use St. Petersburg, Florida as an example to understand how to read occupancy data at the market level.
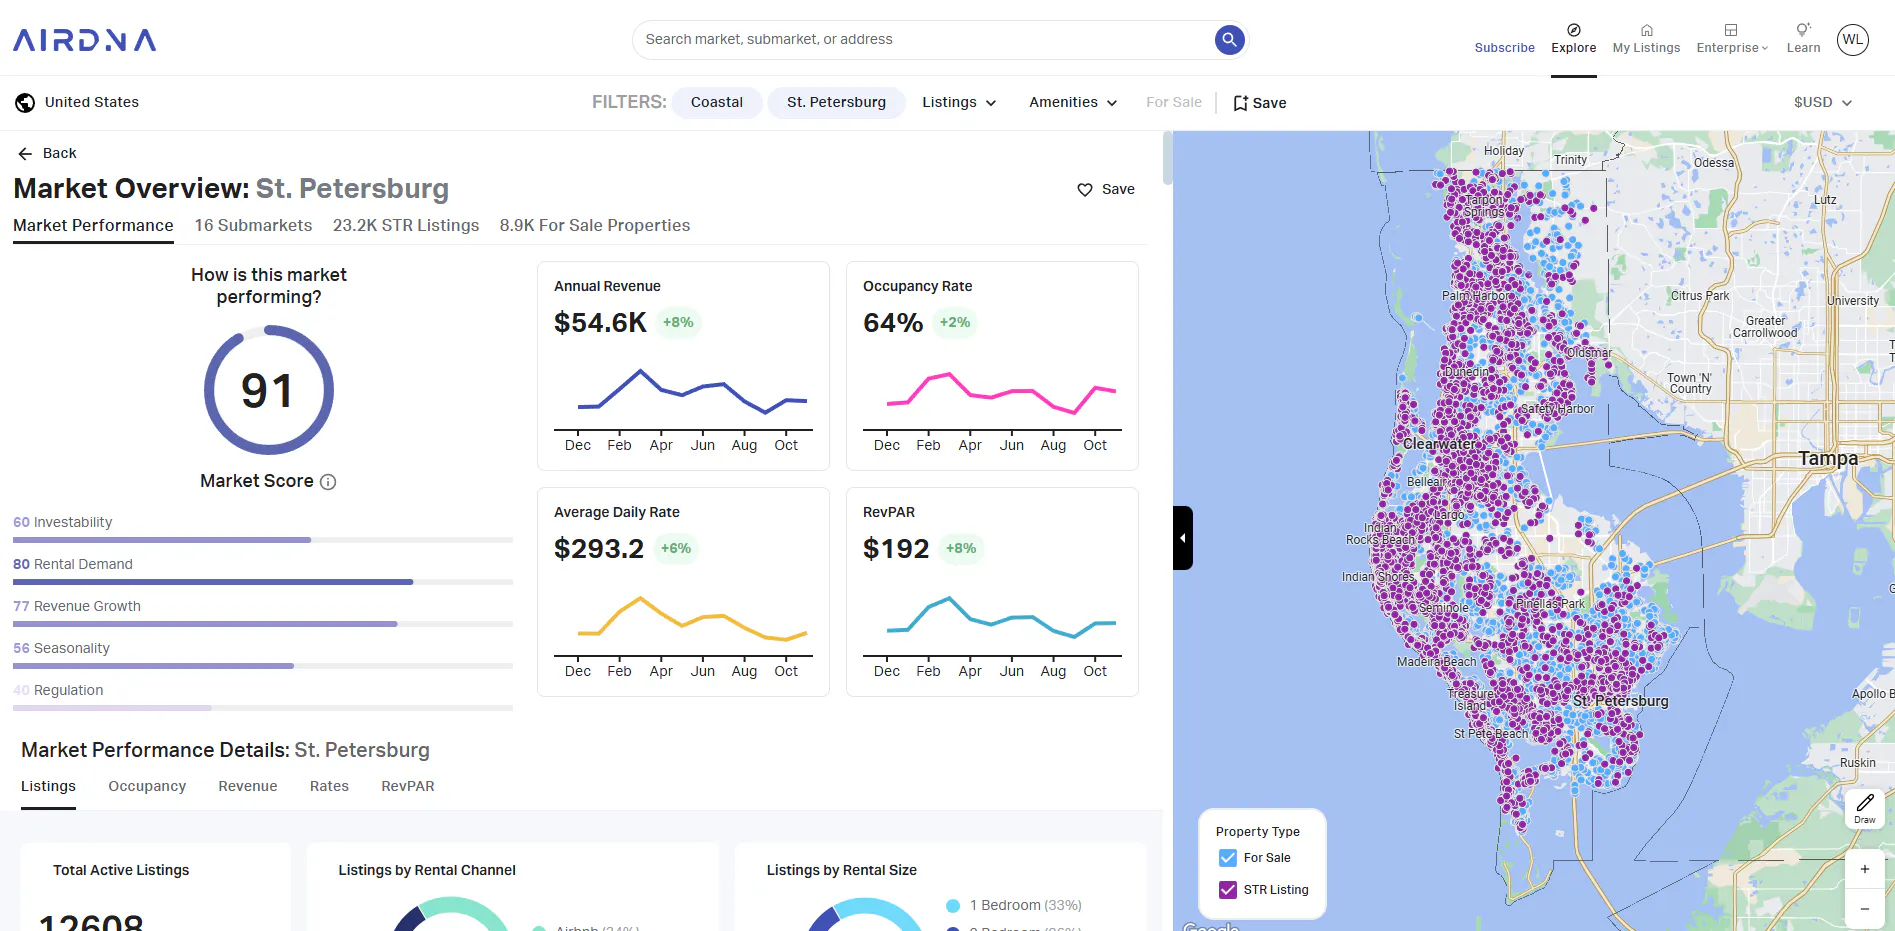
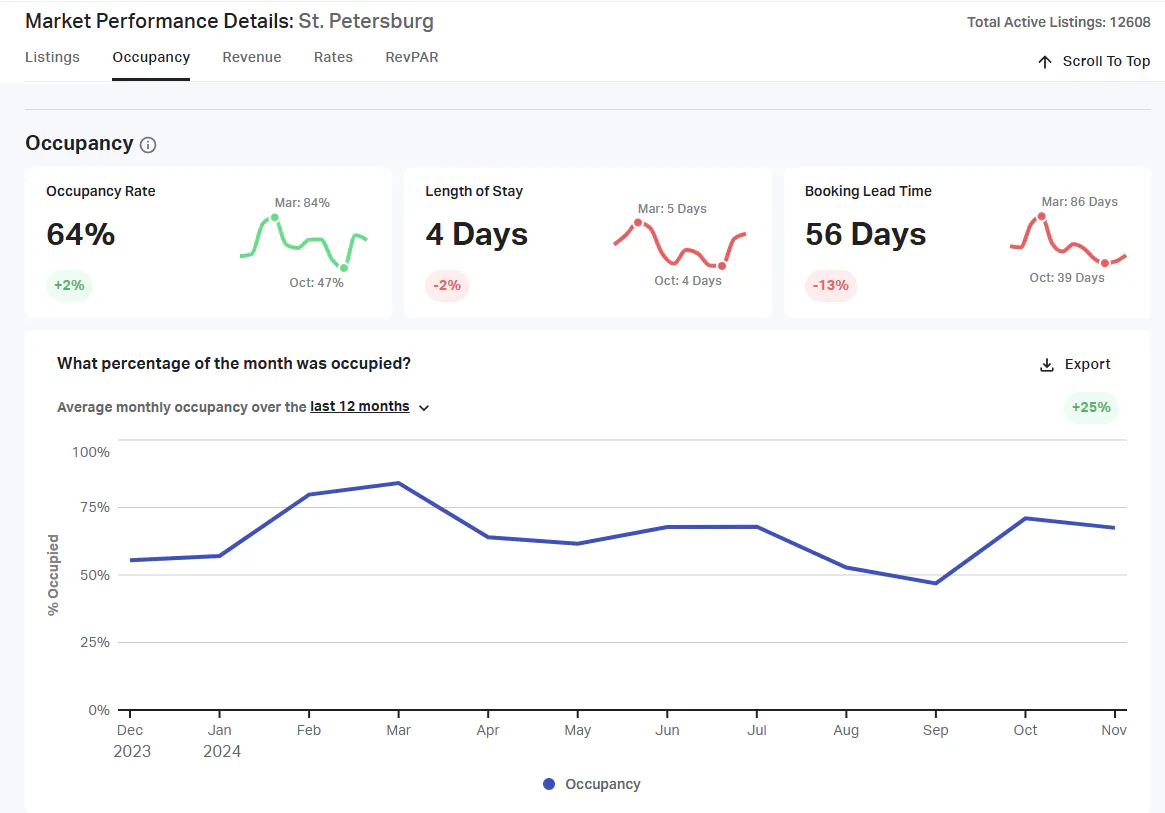
Type in "St. Petersburg" and you'll see a comprehensive view of occupancy patterns. The market overview shows a 64% overall occupancy rate, but the timeline below the main section reveals much more—dramatic seasonal swings from peak season in March (84%) to slower periods in October (47%).
These patterns help you understand what "normal" occupancy looks like throughout the year, while the year-over-year comparison (+2%) shows whether the market is growing or contracting. By combining both the overall rate and seasonal trends, you get a complete picture of when and how consistently properties in this market actually get booked.
Airbnb occupancy rate by zip code or submarket
Location matters when you’re evaluating a short-term rental market—but not just at the city level. Even properties just a few blocks apart can show dramatically different occupancy patterns based on their specific neighborhood dynamics. That's why AirDNA breaks major markets into submarkets—distinct areas where rental properties tend to perform similarly.
It's important to understand that submarkets and zip codes don't always align perfectly. Sometimes a single zip code might span multiple submarkets if it contains areas with distinctly different rental patterns. Other times, multiple zip codes might be grouped into one submarket because their properties show similar booking patterns and attract similar types of guests.
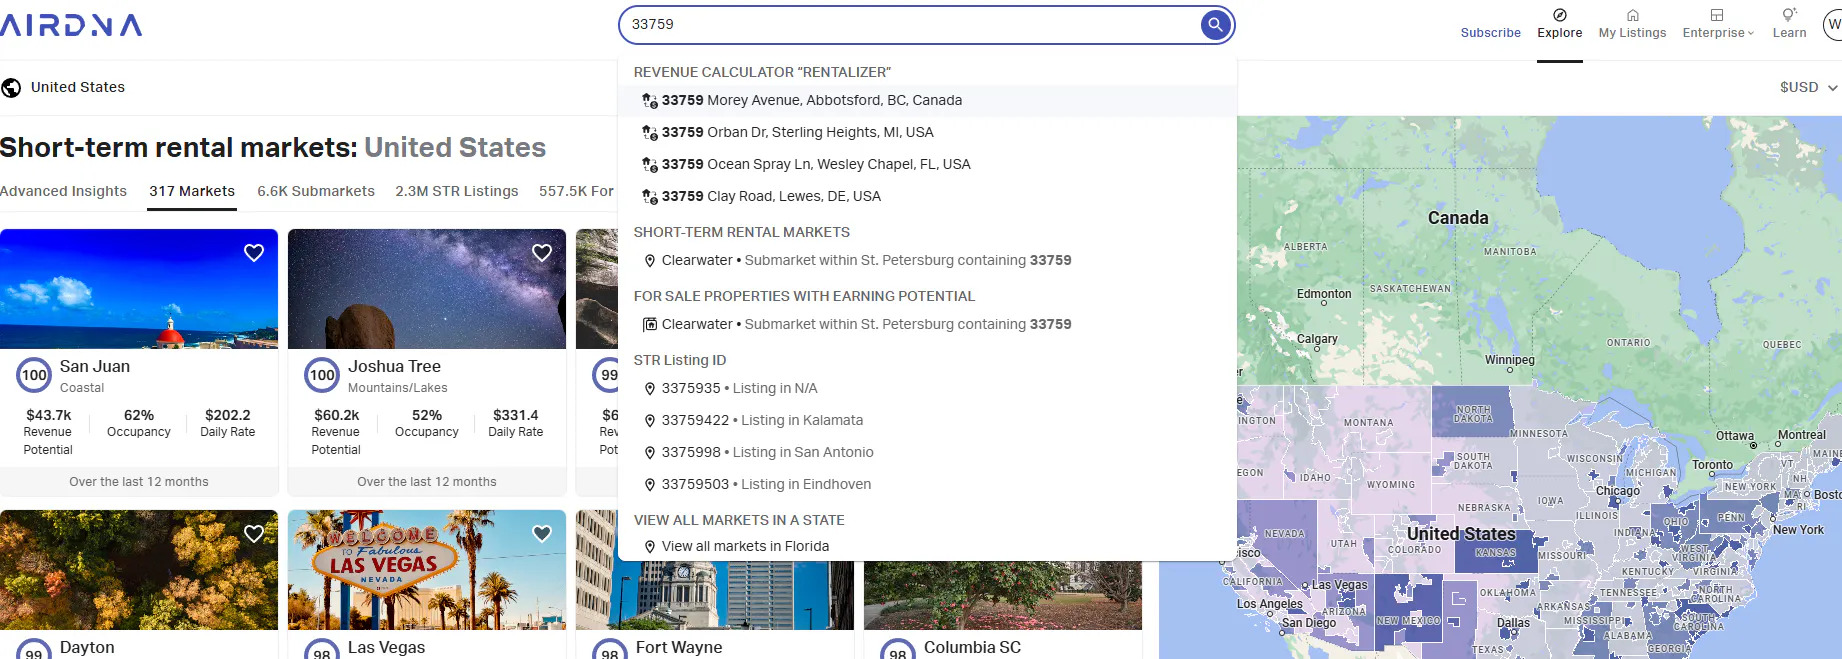
Finding your submarket is simple: either look for it under the submarket tab directly from the market overview page, or enter a specific zip code in the Market Explorer search bar. When you search by zip code, you'll see your matching submarket under "Short-Term Rental Markets" in the dropdown menu.
This targeted view helps you understand how properties actually perform in your specific area, rather than relying on broader market averages that might not reflect your property's true potential. We’ve used Clearwater, Florida (Zip code 33759) as an example here.
Airbnb occupancy rate by individual property
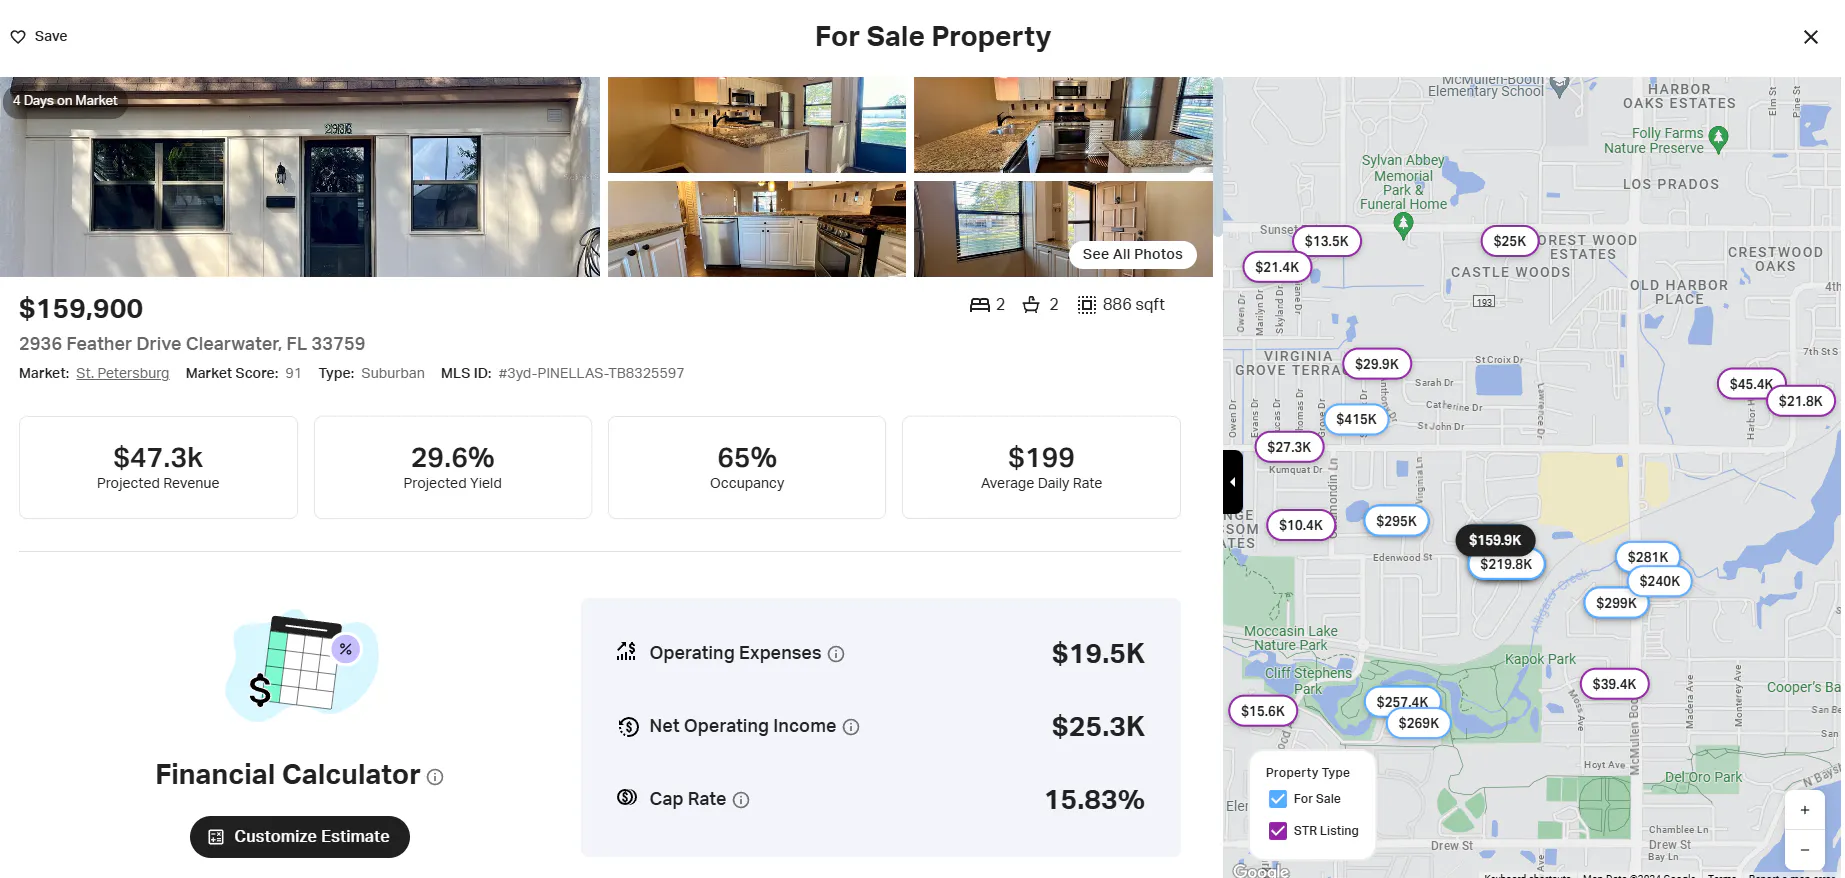
You can also find occupancy data by property with AirDNA. As we were browsing through the Clearwater submarket, we happened upon this lovely little property at 2936 Feather Drive. This property is for sale and shows a projected 65% occupancy rate. Notice how this compares to both the Clearwater submarket average (61%) and the broader St. Petersburg market (64%). This context helps you understand whether a property is overperforming or underperforming relative to its location.
Using advanced features
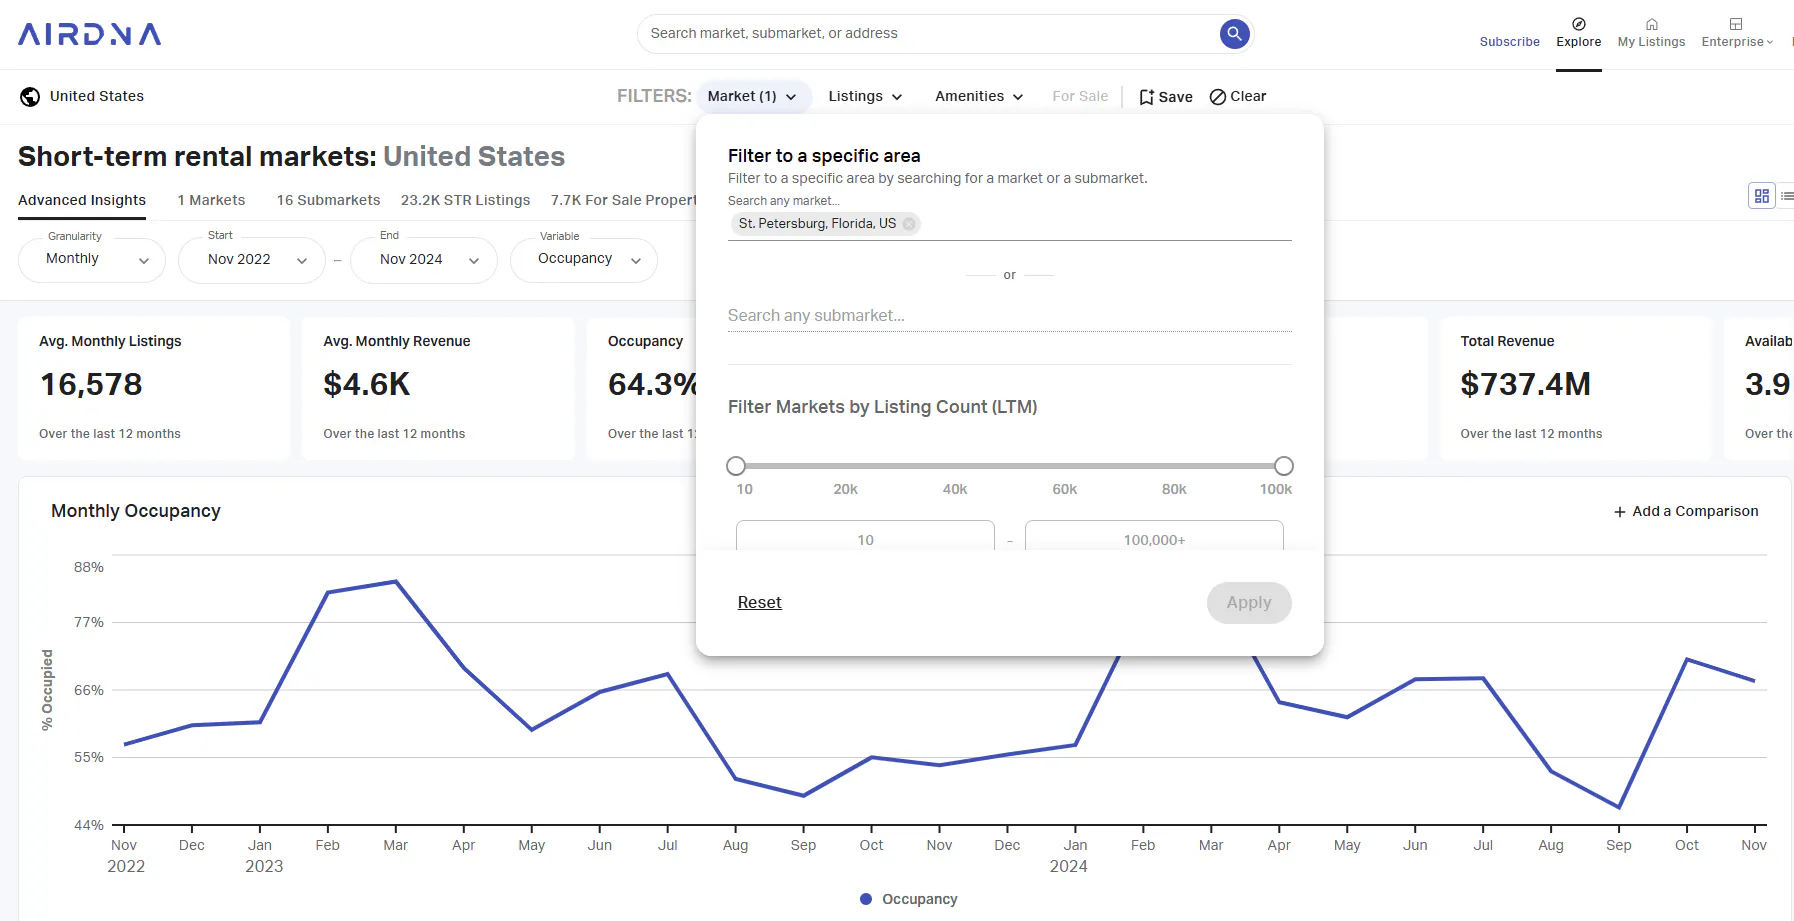
AirDNA's advanced tier puts more analytical power at your fingertips. You'll gain greater control over your data analysis, with the ability to customize date ranges, examine longer historical trends, and create more detailed comparisons across markets. This deeper level of insight helps you spot emerging patterns and make more strategic decisions about your short-term rental business.
Through the Advanced Insights tab (on the left), you can then filter by the usual listing, performance, and amenities filter as well as by market and submarket—giving you the ability to hone in on specific areas or property types. This flexibility allows you to make comparisons across regions and uncover trends that would otherwise go unnoticed. By analyzing granular data, such as occupancy percentages, pricing trends, and revenue potential, you’ll be equipped to optimize your listing's performance and tailor your hosting and investment strategies for maximum profitability.
Connecting your property to AirDNA
Want deeper insights into your own property's performance? Connect your listing to AirDNA's performance dashboard for a detailed view of your projected occupancy trends and market position up to 6 months into the future. Simply click "My Listings" and follow our connection flow to unlock:
- Forward-looking occupancy predictions
- What guests are willing to pay for future dates
- How your property performance compares to market averages
- Custom comp set insights to benchmark against similar properties
Not sure how to get started? Our step-by-step video guide walks you through the entire process of connecting your property and setting up your performance dashboard. Once connected, you'll have all the data you need to make informed decisions about your short-term rental strategy.
How to Improve Your Airbnb Occupancy
Looking to boost your booking rates? Here are six proven strategies backed by our data:
- Watch your comp set pricing: When similar properties are booked on days you're vacant, check their rates. If they're charging less, consider adjusting your prices to stay competitive.
- Optimize your minimum stays: Be flexible with requirements based on seasonality. Think longer stays during peak season, shorter ones during shoulder seasons.
- Improve listing quality: Great photos, detailed descriptions, and quick response times can dramatically impact your booking rate.
- Adjust seasonally: Don't use the same strategy year-round. What works in summer might need tweaking for winter bookings.
- Leverage Instant Book: Properties with Instant Book enabled often see higher occupancy rates, especially for last-minute bookings.
- Target your amenities: Focus on high-impact amenities for your market—like workspace setups in business districts or beach gear in coastal areas.
We’ve also put together more data-driven strategies to maximize your occupancy rate.
Occupancy Rate vs. Booking Rate: What’s the Difference?
You may see occupancy rates and booking rates used interchangeably as terms. However, they have two distinct meanings, particularly within the context your Airbnb performance dashboard.
While occupancy rate measures how many nights your Airbnb is booked relative to its availability, booking rate (also known as conversion rate) looks at a different piece of the puzzle. Booking rate tracks the percentage of inquiries or listing views that result in confirmed reservations. It’s essentially a measure of how effective your listing is at turning potential guests into paying customers.
For example:
- Occupancy Rate Formula:
(Nights booked ÷ available Nights) × 100%
This tells you how much of your calendar is filled with bookings. - Booking Rate Formula:
(Bookings ÷ total listing views) × 100%
This highlights how well your listing converts interest into actual reservations.
A high booking rate often indicates a strong listing with appealing photos, accurate descriptions, competitive pricing, and an overall positive guest experience. However, even with a high booking rate, your occupancy rate could remain low if your property isn’t available for enough nights or lacks demand during certain periods.
For tips on optimizing your booking rate, check out our article on Airbnb SEO, which covers strategies to boost your listing’s visibility and attract more inquiries.
How to find booking rate on Airbnb
Want to measure your average booking rate on Airbnb? Here’s how you can find it directly from your hosting profile:
1. Access your performance insights:
- From the Airbnb hosting dashboard, select the Menu on the top navigation bar.
- Navigate to the Insights section.
2. Locate booking conversion data:
- On the left-hand navigation bar under Performance, click the Conversion drop-down menu.
- Select Booking Conversion.
3. The booking conversion page displays key stats, including:
- Average overall conversion rate: The percentage of all views that convert to bookings.
- First-page impression rate: How often your listing appears on the first page of search results.
- Search-to-listing conversion: The percentage of guests who view your listing after a search.
- Listing-to-booking conversion: How many people who view your listing ultimately book.
Understanding and improving your booking rate can help you reach a wider audience and increase your occupancy rate. For instance, small tweaks—like improving your listing photos or adjusting nightly rates—can boost your listing-to-booking conversion.

Why both metrics matter
Picture occupancy rate and booking rate as your property's vital signs—each tells you something different about your listing's health.
A high occupancy rate means you're successfully filling your calendar with bookings. Your booking rate reveals how efficiently you're getting those bookings. Are you converting interested browsers into guests, or are you missing opportunities?
Let's break it down into two scenarios:
High occupancy + low booking rate
You're filling your calendar, but you're working harder than necessary. Time to improve your listing's appeal with:
- Better photos
- More compelling listing and host descriptions
- Adjusted pricing
- Clearer communication
High booking rate + low occupancy
When people find your listing, they book it—but not enough people are finding it. How to increase bookings on Airbnb:
- Better SEO
- Competitive pricing strategy
- Strategic marketing
The sweet spot? High performance in both metrics. When you're converting viewers efficiently and keeping your calendar full, you're closer to mastering the art of Airbnb hosting.
FAQ
What is a good occupancy rate for Airbnb?
A good occupancy rate for Airbnb varies by market and property type, but the national average occupancy rate on Airbnb and Vrbo is around 54.3%. Budget properties and smaller listings often achieve higher occupancy rates (up to 58%), while luxury or larger properties may be slightly lower. Compare your occupancy rate to your local market’s average or similar listings in your area using tools like AirDNA to determine whether your occupancy rate is “good.” A “good” occupancy rate is highly contextual.
What is a good booking rate on Airbnb?
A good booking rate on Airbnb is typically 2–5%, with high-performing listings exceeding 5%. Booking rate measures how efficiently your listing converts views into bookings, while occupancy rate tracks how many available nights are booked.
How to increase Airbnb bookings through a better conversion rate:
- Improve your photos and description to attract more interest.
- Adjust pricing to stay competitive.
- Highlight unique amenities or offer promotions to stand out.
How can I increase bookings on Airbnb?
You may not need to increase bookings if your occupancy rate is already optimized for your market. Sometimes, achieving a higher occupancy rate just isn’t realistic for your market. Earning more money is all about the balance between your occupancy rate and nightly rate. Revenue per available rental (RevPAR) is a useful metric for better understanding the dynamic between these two performance indicators.
That said, if you’re looking to attract more guests and fill additional nights, certain principles can help. Focus on improving your listing’s visibility with high-quality photos, engaging descriptions, and standout amenities. Dynamic pricing ensures your rates stay competitive, while positive reviews build trust and improve search ranking. With the right strategies, you’ll attract the right number of bookings for your market while maximizing your property’s potential.
ARTICLE SUMMARY
The U.S. average Airbnb occupancy rate is 54.3%, but averages can be deceiving. Performance varies widely based on market, season, and property type, meaning what’s “good” occupancy for one listing isn’t realistic or ideal for another. This article breaks down how occupancy rates fluctuate and shows you how to use AirDNA’s tools to uncover the real numbers that matter for your property.
Bram Gallagher
AirDNA Director of Economics and Forecasting
Bram Gallagher is an Economist at AirDNA, specializing in uncovering insights that drive smarter short-term rental decisions. He put his Ph.D. in Economics from the University of Georgia to work researching and forecasting hotel data with CBRE prior to joining AirDNA, as well as teaching economics at a number of universities. In his spare time, Bram enjoys making wooden furniture with hand tools.